Embed Size (px)
Citation preview
RESEARCH
Please see the last page of this report for important disclosures.
TURKISH AVIATION SECTOR
Secular growth rather than cyclical
February 2014
Analyst: Baris Ince
+90 (212) 384 1141
Sales Contact:
+90 (212) 384 1155
Please see the last page of this report for important disclosures.
2
February 11, 2014
Aviation
TURKISH AVIATION SECTOR
RESEARCH
Table of Contents
EXECUTIVE SUMMARY 3
Recommendations & Valuations 4
A closer look at the aviation sector 8
A study on LCC vs. FSC 13
Turkey in Global Rankings 14
Global Sector Outlook 17
Turkish Aviation Sector at a glance 19
Our Passenger Forecasts 24
Airports in Turkey 26
Capacity Enhancement Studies 26
The Third Airport 29
Recent Developments in Turkish Aviation Sector 30
Airline Terminology 31
THY 32
Investment Positives 34
Investment Negatives 36
Valuation 38
Peer Comparison 38
Model Assumptions 40
How we stand alongside the consensus 41
2014 Guidance vs. Garanti Securities 41
Bussiness Overview 41
Recent Developments 49
The Company Overview 51
The Company Profile 55
PE and EV/EBITDAR graphs 57
Pegasus 58
Investment Positives 60
Investment Negatives 61
Valuation 63
Peer Comparison 63
Model Assumptions 65
How we stand alongside the consensus 66
Bussiness Overview 66
The Company Overview 74
PE and EV/EBITDAR graphs 77
THY vs. Pegasus 80
TAV 82
Investment Positives 84
Investment Negatives 85
Valuation 86
Peer Comparison 87
How we stand alongside the consensus 88
The Company Overview 89
Key DCF Assumptions & Forecasts 91
The Company Profile 101
Disclaimer 105
Please see the last page of this report for important disclosures.
RESEARCH
Executive Summary
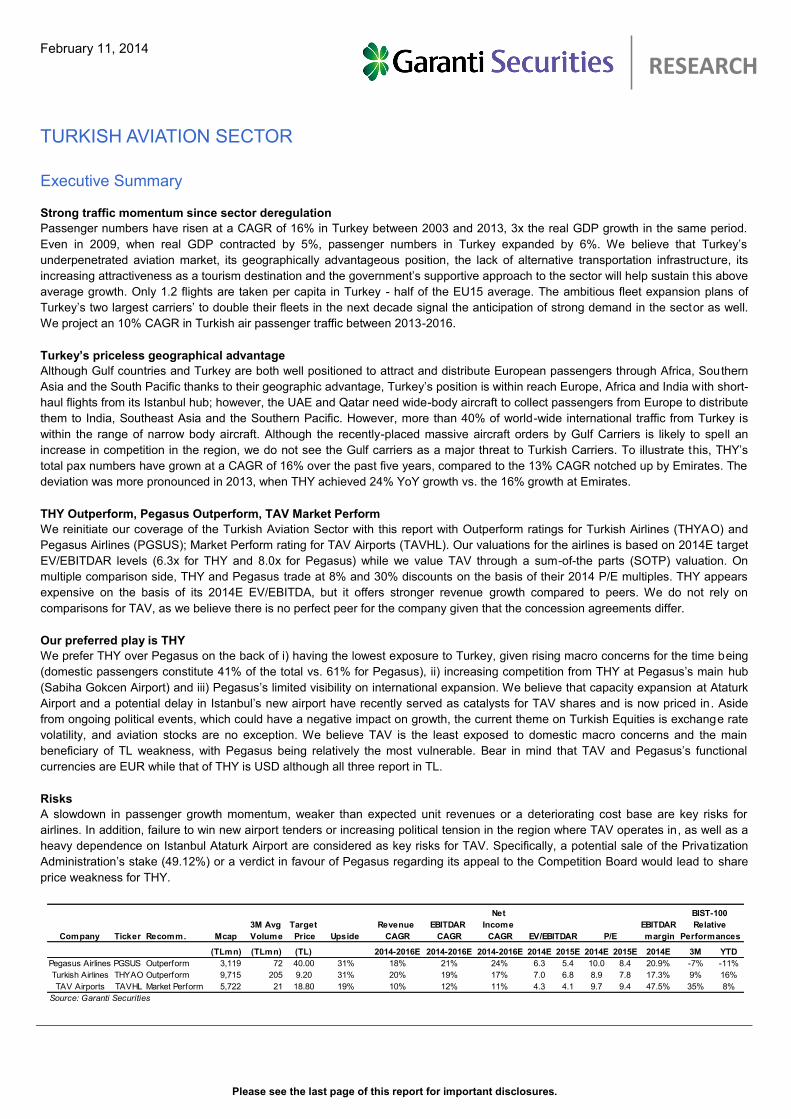
Strong traffic momentum since sector deregulation
Passenger numbers have risen at a CAGR of 16% in Turkey between 2003 and 2013, 3x the real GDP growth in the same period.
Even in 2009, when real GDP contracted by 5%, passenger numbers in Turkey expanded by 6%. We believe that Turkey’s
underpenetrated aviation market, its geographically advantageous position, the lack of alternative transportation infrastructure, its
increasing attractiveness as a tourism destination and the government’s supportive approach to the sector will help sustain this above
average growth. Only 1.2 flights are taken per capita in Turkey - half of the EU15 average. The ambitious fleet expansion plans of
Turkey’s two largest carriers’ to double their fleets in the next decade signal the anticipation of strong demand in the sector as well.
We project an 10% CAGR in Turkish air passenger traffic between 2013-2016.
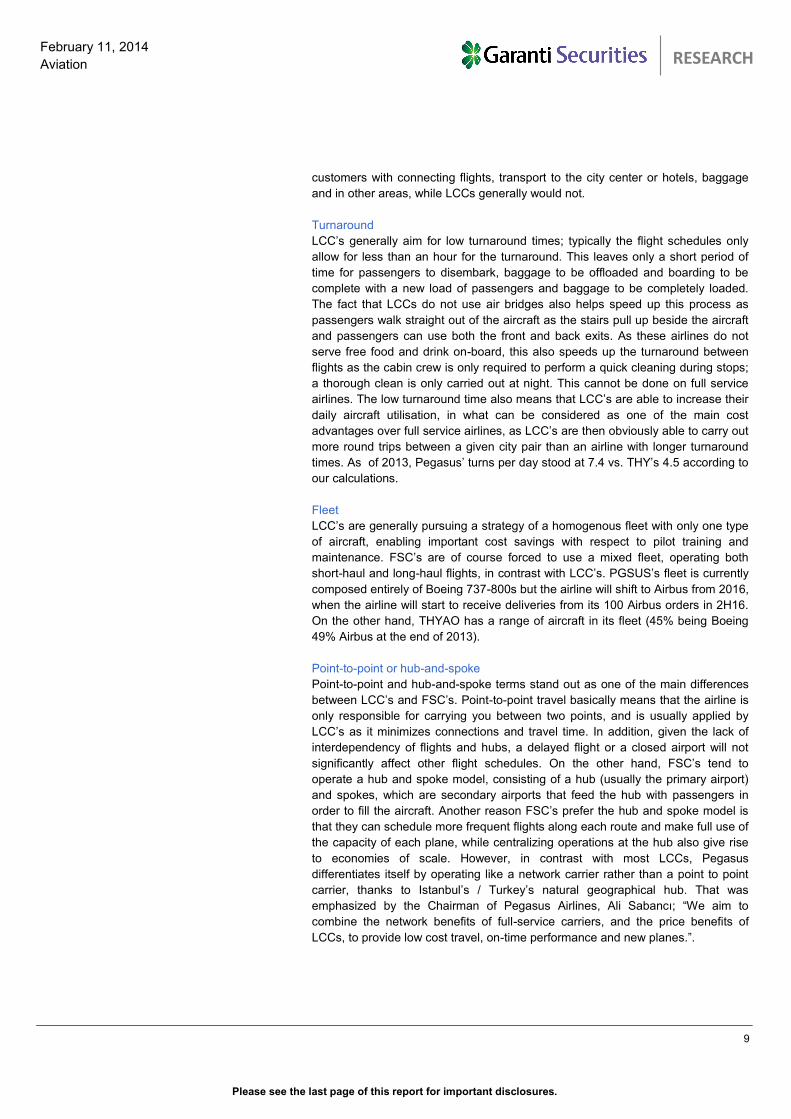
Turkey’s priceless geographical advantage
Although Gulf countries and Turkey are both well positioned to attract and distribute European passengers through Africa, Southern
Asia and the South Pacific thanks to their geographic advantage, Turkey’s position is within reach Europe, Africa and India with short-
haul flights from its Istanbul hub; however, the UAE and Qatar need wide-body aircraft to collect passengers from Europe to distribute
them to India, Southeast Asia and the Southern Pacific. However, more than 40% of world-wide international traffic from Turkey is
within the range of narrow body aircraft. Although the recently-placed massive aircraft orders by Gulf Carriers is likely to spell an
increase in competition in the region, we do not see the Gulf carriers as a major threat to Turkish Carriers. To illustrate this, THY’s
total pax numbers have grown at a CAGR of 16% over the past five years, compared to the 13% CAGR notched up by Emirates. The
deviation was more pronounced in 2013, when THY achieved 24% YoY growth vs. the 16% growth at Emirates.
THY Outperform, Pegasus Outperform, TAV Market Perform
We reinitiate our coverage of the Turkish Aviation Sector with this report with Outperform ratings for Turkish Airlines (THYAO) and
Pegasus Airlines (PGSUS); Market Perform rating for TAV Airports (TAVHL). Our valuations for the airlines is based on 2014E target
EV/EBITDAR levels (6.3x for THY and 8.0x for Pegasus) while we value TAV through a sum-of-the parts (SOTP) valuation. On
multiple comparison side, THY and Pegasus trade at 8% and 30% discounts on the basis of their 2014 P/E multiples. THY appears
expensive on the basis of its 2014E EV/EBITDA, but it offers stronger revenue growth compared to peers. We do not rely on
comparisons for TAV, as we believe there is no perfect peer for the company given that the concession agreements differ.
Our preferred play is THY
We prefer THY over Pegasus on the back of i) having the lowest exposure to Turkey, given rising macro concerns for the time being
(domestic passengers constitute 41% of the total vs. 61% for Pegasus), ii) increasing competition from THY at Pegasus’s main hub
(Sabiha Gokcen Airport) and iii) Pegasus’s limited visibility on international expansion. We believe that capacity expansion at Ataturk
Airport and a potential delay in Istanbul’s new airport have recently served as catalysts for TAV shares and is now priced in . Aside
from ongoing political events, which could have a negative impact on growth, the current theme on Turkish Equities is exchange rate
volatility, and aviation stocks are no exception. We believe TAV is the least exposed to domestic macro concerns and the main
beneficiary of TL weakness, with Pegasus being relatively the most vulnerable. Bear in mind that TAV and Pegasus’s functional
currencies are EUR while that of THY is USD although all three report in TL.
Risks
A slowdown in passenger growth momentum, weaker than expected unit revenues or a deteriorating cost base are key risks for
airlines. In addition, failure to win new airport tenders or increasing political tension in the region where TAV operates in, as well as a
heavy dependence on Istanbul Ataturk Airport are considered as key risks for TAV. Specifically, a potential sale of the Privatization
Administration’s stake (49.12%) or a verdict in favour of Pegasus regarding its appeal to the Competition Board would lead to share
price weakness for THY.
February 11, 2014
TURKISH AVIATION SECTOR
Company Ticker Recomm. Mcap
3M Avg
Volume
Target
Price Upside
Revenue
CAGR
EBITDAR
CAGR
Net
Income
CAGR
EBITDAR
margin
(TLmn) (TLmn) (TL) 2014-2016E 2014-2016E 2014-2016E 2014E 2015E 2014E 2015E 2014E 3M YTD
Pegasus Airlines PGSUS Outperform 3,119 72 40.00 31% 18% 21% 24% 6.3 5.4 10.0 8.4 20.9% -7% -11%
Turkish Airlines THYAO Outperform 9,715 205 9.20 31% 20% 19% 17% 7.0 6.8 8.9 7.8 17.3% 9% 16%
TAV Airports TAVHL Market Perform 5,722 21 18.80 19% 10% 12% 11% 4.3 4.1 9.7 9.4 47.5% 35% 8%
Source: Garanti Securities
EV/EBITDAR P/E
BIST-100
Relative
Performances
Please see the last page of this report for important disclosures.
4
February 11, 2014
Aviation
TURKISH AVIATION SECTOR
RESEARCH
RECOMMENDATIONS & VALUATIONS THY
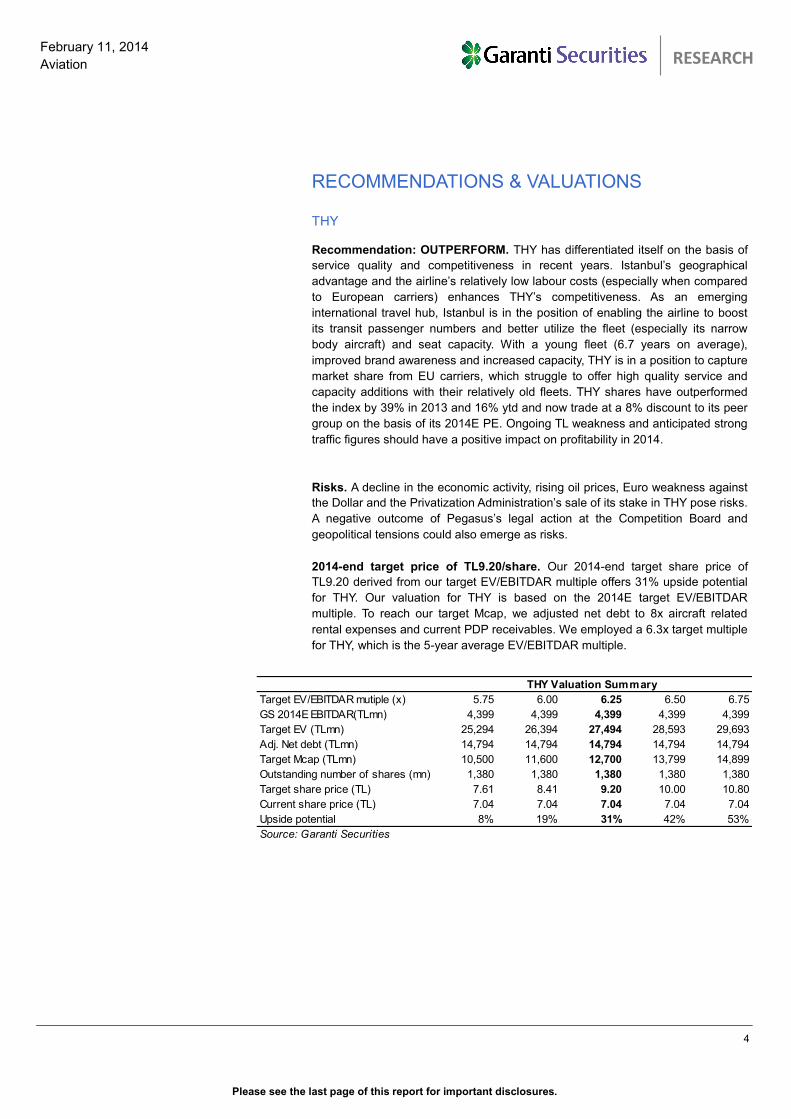
Recommendation: OUTPERFORM. THY has differentiated itself on the basis of
service quality and competitiveness in recent years. Istanbul’s geographical
advantage and the airline’s relatively low labour costs (especially when compared
to European carriers) enhances THY’s competitiveness. As an emerging
international travel hub, Istanbul is in the position of enabling the airline to boost
its transit passenger numbers and better utilize the fleet (especially its narrow
body aircraft) and seat capacity. With a young fleet (6.7 years on average),
improved brand awareness and increased capacity, THY is in a position to capture
market share from EU carriers, which struggle to offer high quality service and
capacity additions with their relatively old fleets. THY shares have outperformed
the index by 39% in 2013 and 16% ytd and now trade at a 8% discount to its peer
group on the basis of its 2014E PE. Ongoing TL weakness and anticipated strong
traffic figures should have a positive impact on profitability in 2014.
Risks. A decline in the economic activity, rising oil prices, Euro weakness against
the Dollar and the Privatization Administration’s sale of its stake in THY pose risks.
A negative outcome of Pegasus’s legal action at the Competition Board and
geopolitical tensions could also emerge as risks.
2014-end target price of TL9.20/share. Our 2014-end target share price of
TL9.20 derived from our target EV/EBITDAR multiple offers 31% upside potential
for THY. Our valuation for THY is based on the 2014E target EV/EBITDAR
multiple. To reach our target Mcap, we adjusted net debt to 8x aircraft related
rental expenses and current PDP receivables. We employed a 6.3x target multiple
for THY, which is the 5-year average EV/EBITDAR multiple.
Target EV/EBITDAR mutiple (x) 5.75 6.00 6.25 6.50 6.75
GS 2014E EBITDAR(TLmn) 4,399 4,399 4,399 4,399 4,399
Target EV (TLmn) 25,294 26,394 27,494 28,593 29,693
Adj. Net debt (TLmn) 14,794 14,794 14,794 14,794 14,794
Target Mcap (TLmn) 10,500 11,600 12,700 13,799 14,899
Outstanding number of shares (mn) 1,380 1,380 1,380 1,380 1,380
Target share price (TL) 7.61 8.41 9.20 10.00 10.80
Current share price (TL) 7.04 7.04 7.04 7.04 7.04
Upside potential 8% 19% 31% 42% 53%
Source: Garanti Securities
THY Valuation Summary
Please see the last page of this report for important disclosures.
5
February 11, 2014
Aviation
TURKISH AVIATION SECTOR
RESEARCH
Pegasus Airlines
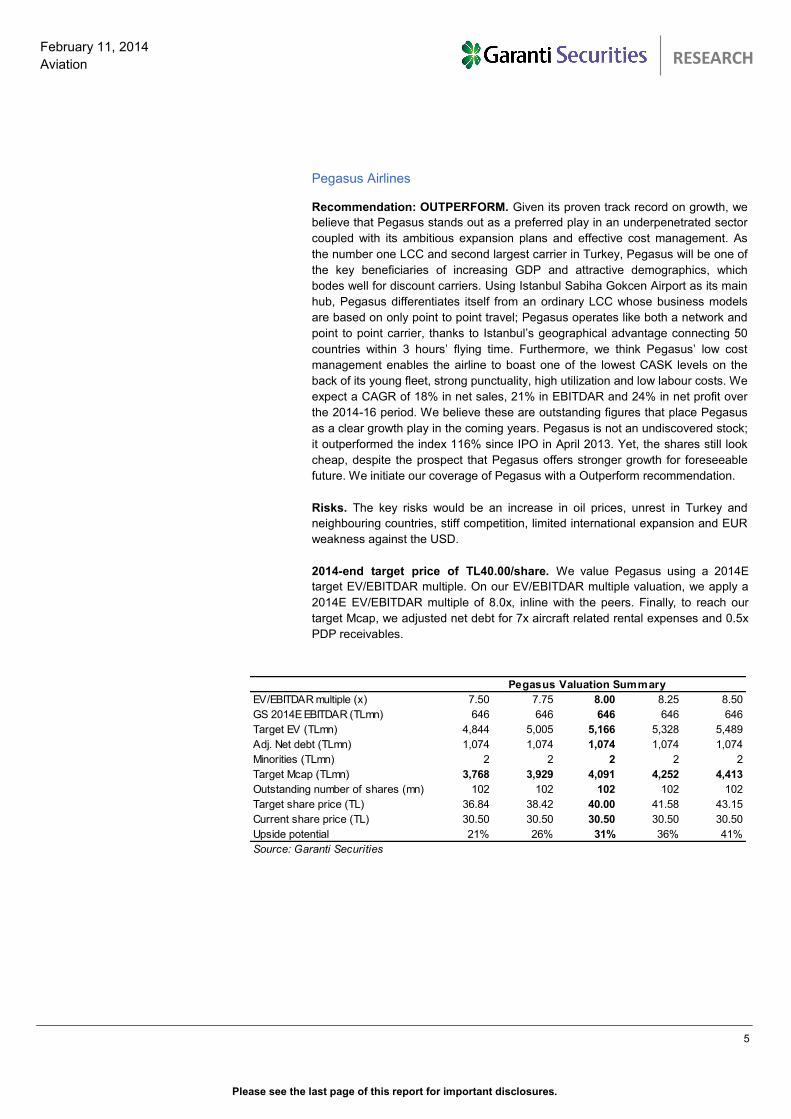
Recommendation: OUTPERFORM. Given its proven track record on growth, we
believe that Pegasus stands out as a preferred play in an underpenetrated sector
coupled with its ambitious expansion plans and effective cost management. As
the number one LCC and second largest carrier in Turkey, Pegasus will be one of
the key beneficiaries of increasing GDP and attractive demographics, which
bodes well for discount carriers. Using Istanbul Sabiha Gokcen Airport as its main
hub, Pegasus differentiates itself from an ordinary LCC whose business models
are based on only point to point travel; Pegasus operates like both a network and
point to point carrier, thanks to Istanbul’s geographical advantage connecting 50
countries within 3 hours’ flying time. Furthermore, we think Pegasus’ low cost
management enables the airline to boast one of the lowest CASK levels on the
back of its young fleet, strong punctuality, high utilization and low labour costs. We
expect a CAGR of 18% in net sales, 21% in EBITDAR and 24% in net profit over
the 2014-16 period. We believe these are outstanding figures that place Pegasus
as a clear growth play in the coming years. Pegasus is not an undiscovered stock;
it outperformed the index 116% since IPO in April 2013. Yet, the shares still look
cheap, despite the prospect that Pegasus offers stronger growth for foreseeable
future. We initiate our coverage of Pegasus with a Outperform recommendation.
Risks. The key risks would be an increase in oil prices, unrest in Turkey and
neighbouring countries, stiff competition, limited international expansion and EUR
weakness against the USD.
2014-end target price of TL40.00/share. We value Pegasus using a 2014E
target EV/EBITDAR multiple. On our EV/EBITDAR multiple valuation, we apply a
2014E EV/EBITDAR multiple of 8.0x, inline with the peers. Finally, to reach our
target Mcap, we adjusted net debt for 7x aircraft related rental expenses and 0.5x
PDP receivables.
EV/EBITDAR multiple (x) 7.50 7.75 8.00 8.25 8.50
GS 2014E EBITDAR (TLmn) 646 646 646 646 646
Target EV (TLmn) 4,844 5,005 5,166 5,328 5,489
Adj. Net debt (TLmn) 1,074 1,074 1,074 1,074 1,074
Minorities (TLmn) 2 2 2 2 2
Target Mcap (TLmn) 3,768 3,929 4,091 4,252 4,413
Outstanding number of shares (mn) 102 102 102 102 102
Target share price (TL) 36.84 38.42 40.00 41.58 43.15
Current share price (TL) 30.50 30.50 30.50 30.50 30.50
Upside potential 21% 26% 31% 36% 41%
Source: Garanti Securities
Pegasus Valuation Summary
Please see the last page of this report for important disclosures.
6
February 11, 2014
Aviation
TURKISH AVIATION SECTOR
RESEARCH
TAV Airports
Recommendation: Market Perform. TAV Airports is Turkey’s leading airport
terminal operator. The Company operates Istanbul Ataturk, Ankara Esenboga and
Izmir Adnan Menderes Airport, located in Turkey’s three largest cities. TAV
Airports’ business structure ensures high operating leverage, and since the
passenger fees are mainly fixed, higher volumes going forward will be the major
growth driver for TAV, also supporting the company’s retail operations. In addition
to a solid long term outlook, we believe the company should benefit from the
current macro environment, as the lion’s share of revenues are based in hard
currencies. Moreover, we believe that the Company is a good proxy to benefit
from growth in number of pax in Turkey without the fuel risk. The Company has
outperformed the BIST-100 by 102% in 2013 and by 8% so far in 2014, a trend we
would attribute to the company’s revenue structure, which is mostly € and $
denominated, and its strong operational performance along with the mounting
expectations of a delay in the third airports project and planned capacity
expansion in its flagship Istanbul Ataturk Airport.
Risks. Key risks include a slowdown in passenger traffic growth, increasing
political tensions in its regions of operation, failure to replace IAA or overpaying in
acquisitions.
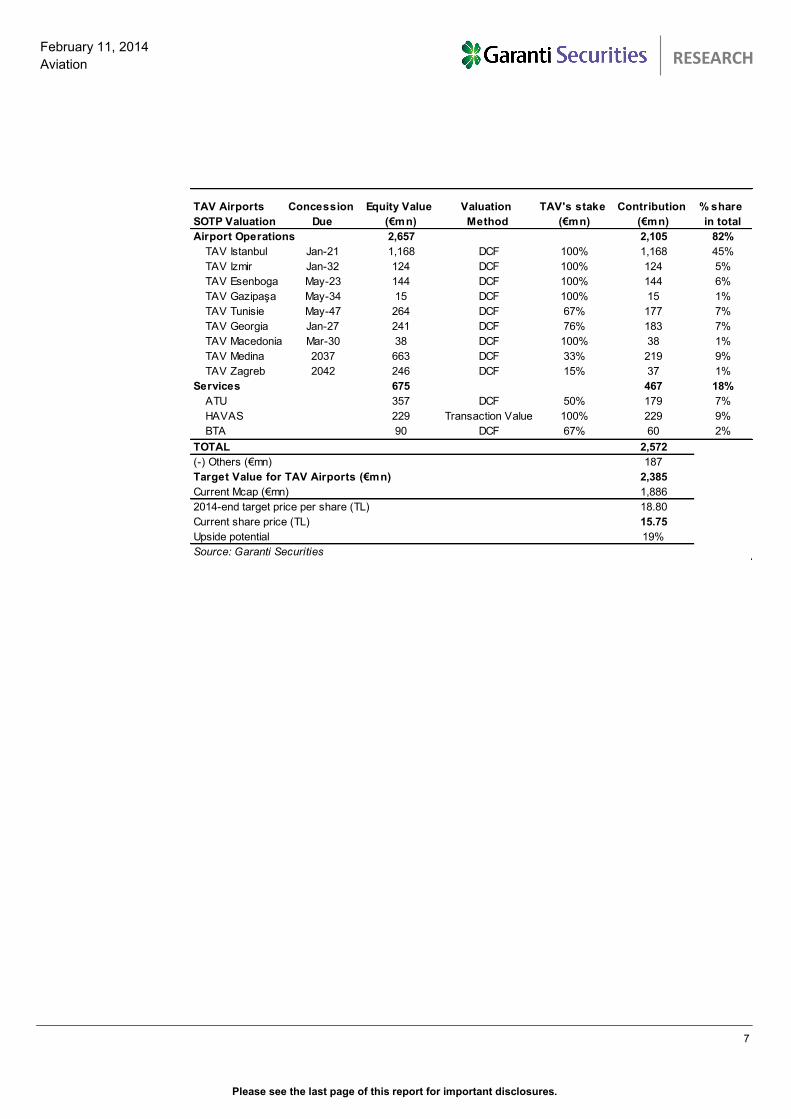
2014-end target price of TL18.80/share. We value TAV Airports using sum-of
the parts (SOTP) analysis based on target Net Asset Value (NAV). We employed
DCF analysis to value each of the Company’s operations separately. Our
valuation is solely based on DCF, as we believe DCF analysis is the most
appropriate means of reflecting TAV Airports’ long-term growth potential as well as
TAV Airports’ well designed structure. We only valued TAV Airports’ existing
airport operations, not taking into account any terminal value and assuming that
the Company would neither win any new tenders, nor would it be awarded another
term upon expiry of its current concession agreements. On the other hand, as the
services companies’ operations will not end with the expiry of operating rights at
the airports, we did include a terminal value in calculating the value of the services
companies. We put HAVAS to our valuation on its transaction value in late 2012.
TAV had paid EUR80mn for 35% of HAVAS at that time.
Please see the last page of this report for important disclosures.
7
February 11, 2014
Aviation
TURKISH AVIATION SECTOR
RESEARCH
TAV Airports
SOTP Valuation
Concession
Due
Equity Value
(€mn)
Valuation
Method
TAV's stake
(€mn)
Contribution
(€mn)
% share
in total
Airport Operations 2,657 2,105 82%
TAV Istanbul Jan-21 1,168 DCF 100% 1,168 45%
TAV Izmir Jan-32 124 DCF 100% 124 5%
TAV Esenboga May-23 144 DCF 100% 144 6%
TAV Gazipaşa May-34 15 DCF 100% 15 1%
TAV Tunisie May-47 264 DCF 67% 177 7%
TAV Georgia Jan-27 241 DCF 76% 183 7%
TAV Macedonia Mar-30 38 DCF 100% 38 1%
TAV Medina 2037 663 DCF 33% 219 9%
TAV Zagreb 2042 246 DCF 15% 37 1%
Services 675 467 18%
ATU 357 DCF 50% 179 7%
HAVAS 229 Transaction Value 100% 229 9%
BTA 90 DCF 67% 60 2%
TOTAL 2,572
(-) Others (€mn) 187
Target Value for TAV Airports (€mn) 2,385
Current Mcap (€mn) 1,886
2014-end target price per share (TL) 18.80
Current share price (TL) 15.75
Upside potential 19%
Source: Garanti Securities
Please see the last page of this report for important disclosures.
8
February 11, 2014
Aviation
TURKISH AVIATION SECTOR
RESEARCH
A closer look at the aviation sector
Before going into the company sections, we believe it would be instructive to set
out our understanding of the dynamics of the aviation sector, as the companies
under our aviation coverage operate in different subsectors of the aviation sector:
THYAO (Full Service Carrier), PGSUS (Low Cost Carrier) and TAVHL (airport
operator).
Differences between the LCC model and the FSC model
The key differences between the LCC model and the more traditional FSC model
are shown in the table below. We would note here that the low-cost carriers
should not be confused with regional airlines that operate short flights without
service, or with full-service airlines offering some reduced fares. Some airlines
have recently actively sought to market and advertise themselves as low-cost,
budget, or discount airlines while maintaining products usually associated with
traditional mainline carriers, which often result in increased operational complexity.
We will put the differences into perspective, comparing low cost carriers with full
service carriers with the following examples of THYAO and PGSUS:
Service
LCC’s ticket prices are usually based on a low amount of service, since generally
no service is associated with the ticket price before the flight, while passengers
may instead be charged for a wide range of services during or just before the
flight. To make up for revenue lost by the lower ticket prices, the airline may
charge for extras like food, priority boarding, seat allocation and baggage. In case
of delays or cancellations, customers should not expect meals and/or
accommodation to be provided for them; and on the whole, no free food or drinks
are provided during the flight on LCCs, but rather may be purchased at relatively
inflated prices. However, the FSC ticket price includes a range of services which
would be treated as extras in LCCs. After the flight, FSCs generally help their
Differences between Low Cost Carriers and Full Service Carriers
LCC FSC
Low er service level (ancillary revenues) High Service Level
Faster turnaround times Low er turnaround times
One type aircraft in f leet Diffrent types of aircraft in f leet
Point-to-Point model Hub and spoke model
Higher seat density Low er seat density (multiple classes)
Secondary or regional airports Primary airports
Higher share of online sales channel Low er share of online sales channel
Limited frequent f lyer programme Attractive frequent f lyer programme
Source: Garanti Securities
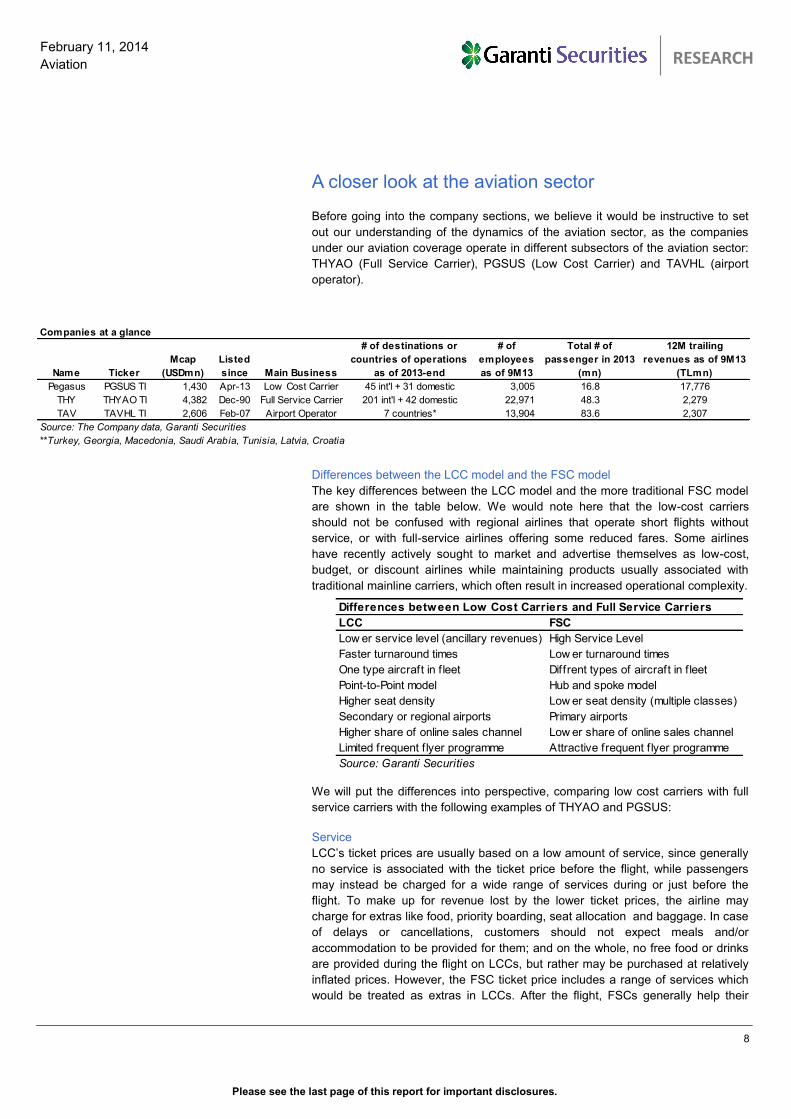
Companies at a glance
Name Ticker
Mcap
(USDmn)
Listed
since Main Business
# of destinations or
countries of operations
as of 2013-end
# of
employees
as of 9M13
Total # of
passenger in 2013
(mn)
12M trailing
revenues as of 9M13
(TLmn)
Pegasus PGSUS TI 1,430 Apr-13 Low Cost Carrier 45 int'l + 31 domestic 3,005 16.8 17,776
THY THYAO TI 4,382 Dec-90 Full Service Carrier 201 int'l + 42 domestic 22,971 48.3 2,279
TAV TAVHL TI 2,606 Feb-07 Airport Operator 7 countries* 13,904 83.6 2,307
Source: The Company data, Garanti Securities
**Turkey, Georgia, Macedonia, Saudi Arabia, Tunisia, Latvia, Croatia
Please see the last page of this report for important disclosures.
9
February 11, 2014
Aviation
TURKISH AVIATION SECTOR
RESEARCH
customers with connecting flights, transport to the city center or hotels, baggage
and in other areas, while LCCs generally would not.
Turnaround
LCC’s generally aim for low turnaround times; typically the flight schedules only
allow for less than an hour for the turnaround. This leaves only a short period of
time for passengers to disembark, baggage to be offloaded and boarding to be
complete with a new load of passengers and baggage to be completely loaded.
The fact that LCCs do not use air bridges also helps speed up this process as
passengers walk straight out of the aircraft as the stairs pull up beside the aircraft
and passengers can use both the front and back exits. As these airlines do not
serve free food and drink on-board, this also speeds up the turnaround between
flights as the cabin crew is only required to perform a quick cleaning during stops;
a thorough clean is only carried out at night. This cannot be done on full service
airlines. The low turnaround time also means that LCC’s are able to increase their
daily aircraft utilisation, in what can be considered as one of the main cost
advantages over full service airlines, as LCC’s are then obviously able to carry out
more round trips between a given city pair than an airline with longer turnaround
times. As of 2013, Pegasus’ turns per day stood at 7.4 vs. THY’s 4.5 according to
our calculations.
Fleet
LCC’s are generally pursuing a strategy of a homogenous fleet with only one type
of aircraft, enabling important cost savings with respect to pilot training and
maintenance. FSC’s are of course forced to use a mixed fleet, operating both
short-haul and long-haul flights, in contrast with LCC’s. PGSUS’s fleet is currently
composed entirely of Boeing 737-800s but the airline will shift to Airbus from 2016,
when the airline will start to receive deliveries from its 100 Airbus orders in 2H16.
On the other hand, THYAO has a range of aircraft in its fleet (45% being Boeing
49% Airbus at the end of 2013).
Point-to-point or hub-and-spoke
Point-to-point and hub-and-spoke terms stand out as one of the main differences
between LCC’s and FSC’s. Point-to-point travel basically means that the airline is
only responsible for carrying you between two points, and is usually applied by
LCC’s as it minimizes connections and travel time. In addition, given the lack of
interdependency of flights and hubs, a delayed flight or a closed airport will not
significantly affect other flight schedules. On the other hand, FSC’s tend to
operate a hub and spoke model, consisting of a hub (usually the primary airport)
and spokes, which are secondary airports that feed the hub with passengers in
order to fill the aircraft. Another reason FSC’s prefer the hub and spoke model is
that they can schedule more frequent flights along each route and make full use of
the capacity of each plane, while centralizing operations at the hub also give rise
to economies of scale. However, in contrast with most LCCs, Pegasus
differentiates itself by operating like a network carrier rather than a point to point
carrier, thanks to Istanbul’s / Turkey’s natural geographical hub. That was
emphasized by the Chairman of Pegasus Airlines, Ali Sabancı; “We aim to
combine the network benefits of full-service carriers, and the price benefits of
LCCs, to provide low cost travel, on-time performance and new planes.”.
Please see the last page of this report for important disclosures.
10
February 11, 2014
Aviation
TURKISH AVIATION SECTOR
RESEARCH
Seat density
Higher seating density is an important element of the LCC business model and a
source of potential cost advantages. The average seat pitch in an LCC is normally
more restricted than the economy class seat of a FSC. This obviously allows
LCC’s to fit more seats into their aircraft, increasing the maximum capacity of each
flight. For example, Pegasus fits 188 seats on average into their fleet while THY
fits 168 seats, which would – assuming similar operating costs – translate into
lower costs for Pegasus. However, it is worth highlighting that a reason for the
lower number of seats on THY aircraft is the presence of a business class section
which command considerably higher ticket prices than economy class seats, thus
producing much higher yields, thus offsetting some of the cost of a lower seat
density.
Airports
Airports are generally categorised in 3 categories; primary airports, such as
Ataturk Airport in Istanbul; secondary airports, which are smaller but still near
major cities, like Sabiha Gokcen, also in Istanbul; and thirdly, regional airports,
which are typically situated in the province some distance from city centres.
Regional airports are typically characterised by the lowest levels of traffic. The
primary airports are mainly used by the larger network carriers as the “hub” in their
hub-and- spoke systems and are therefore command a strong position with regard
to bargaining power, given that they have the size and infrastructure needed to
process large passenger numbers. To illustrate this, Istanbul Ataturk Airport
processes more than 50mn passengers annually. Primary airports are the most
expensive when it comes to airport fees and charges, which include landing fees,
a charge per passenger and/or tonne of freight handled, aircraft parking charge
and other charges such as airport traffic control and air bridges. In a bid to lower
these costs, low fare carriers like Pegasus have followed a strategy of developing
routes to secondary and regional airports, while still maintaining a presence in
primary airports such as Istanbul Ataturk Airport (with only three aircraft). Another
reason for choosing secondary airports is the large volume of traffic in primary
Geographical Advantage
Source: THY presentation
Please see the last page of this report for important disclosures.
11
February 11, 2014
Aviation
TURKISH AVIATION SECTOR
RESEARCH
airports, which can often become congested – hardly optimal for LCC’s aiming for
low turnaround times, which would often be compromised by delays caused by
congestion in primary airports. Using less utilized secondary and regional airports
resolves this problem. The downside for passengers is, of course, that regional
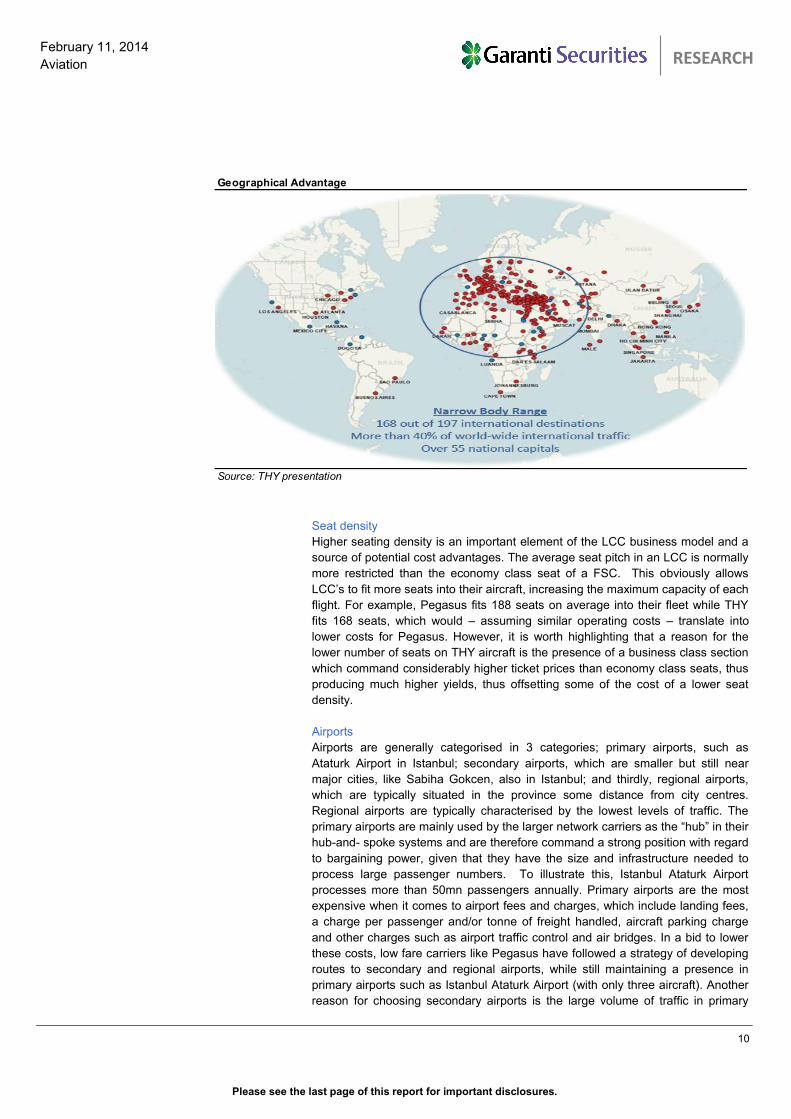
airports are far from city centres. As shown below, it seems that fees and charges
between Istanbul Ataturk Airport and Sabiha Gokcen Airport are generally similar
except ground service expenses.
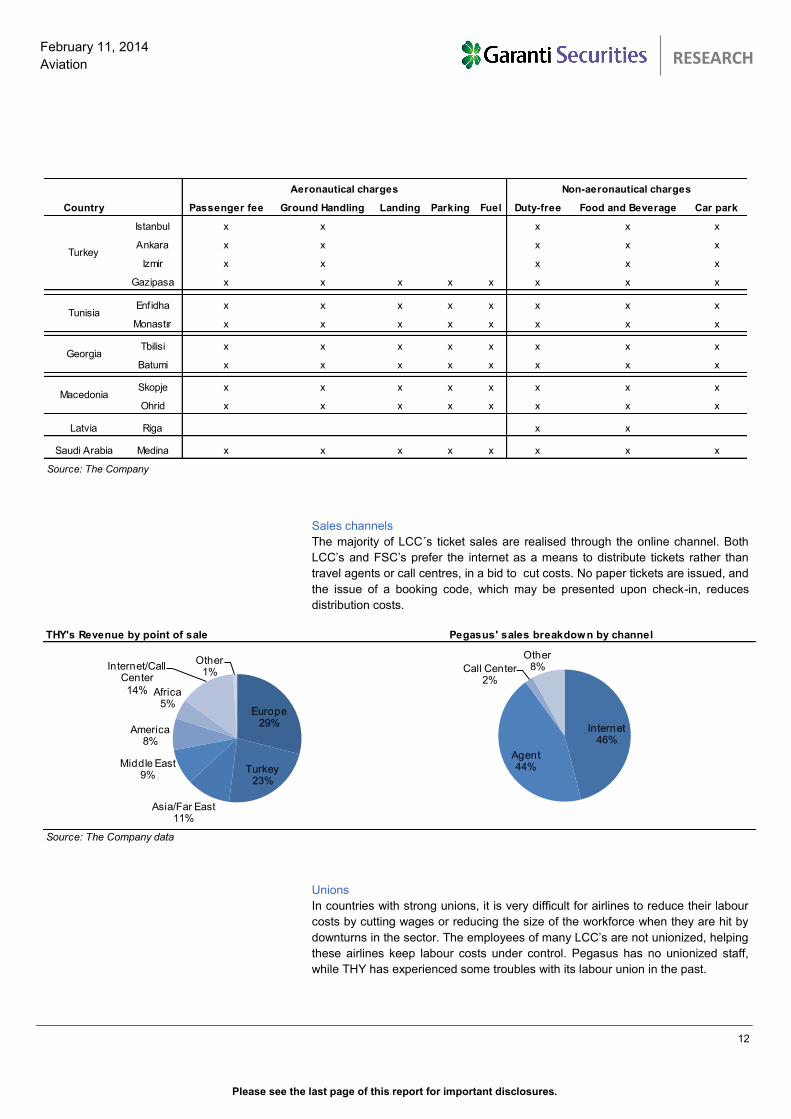
Typically a contract between the airport and airline states that the airport provides
its aeronautical services (passenger fee, ground handling, landing, parking and
fuel). The operators also generate revenues from non-aeronautical charges such
as duty-free, food and beverages, car parking (see revenues sources of TAVHL
below). Once the initial investment in airport facilities has been completed, the
marginal costs of accommodating the extra traffic are very low, because additional
traffic improves the utilization of spare capacity for which airport management has
already paid. Given that additional passengers carry relatively low marginal
terminal costs, we think airports may prefer to add or alter the mix of retail shops
to maximize the revenue generated by the increased passenger numbers as they
focus more on non-aeronautical services, if the charges for aeronautical services
become unfavorable.
Istanbul Ataturk Airport vs. Istanbul Sabiha Gokcen Airport
Fees / Charges Istanbul Ataturk Aırport (IST) Istanbul Sabiha Gokcen (SAW)
per Passenger
Domestic 15$ 15 €
international 3 € 3 €
İntl to intl 5 € 5 €
per Aircraft
Domestic
Landing 0.8 TL 0.4 €
Parking 0.55 TL 0.3 €
Illimunation 33 TL 15.0 €
International
Landing 6.7 € 6.5 €
Parking 2.0 € 2.0 €
Illimunation 41.0 € 40.0 €
Ground services
Seat Capacity
101-150 125.0 € 113.0 €
151-200 167.0 € 149.0 €
201-250 215.0 € 191.0 €
Follow me 34 € 33 €
Source: DHMI,HEAS
Please see the last page of this report for important disclosures.
12
February 11, 2014
Aviation
TURKISH AVIATION SECTOR
RESEARCH
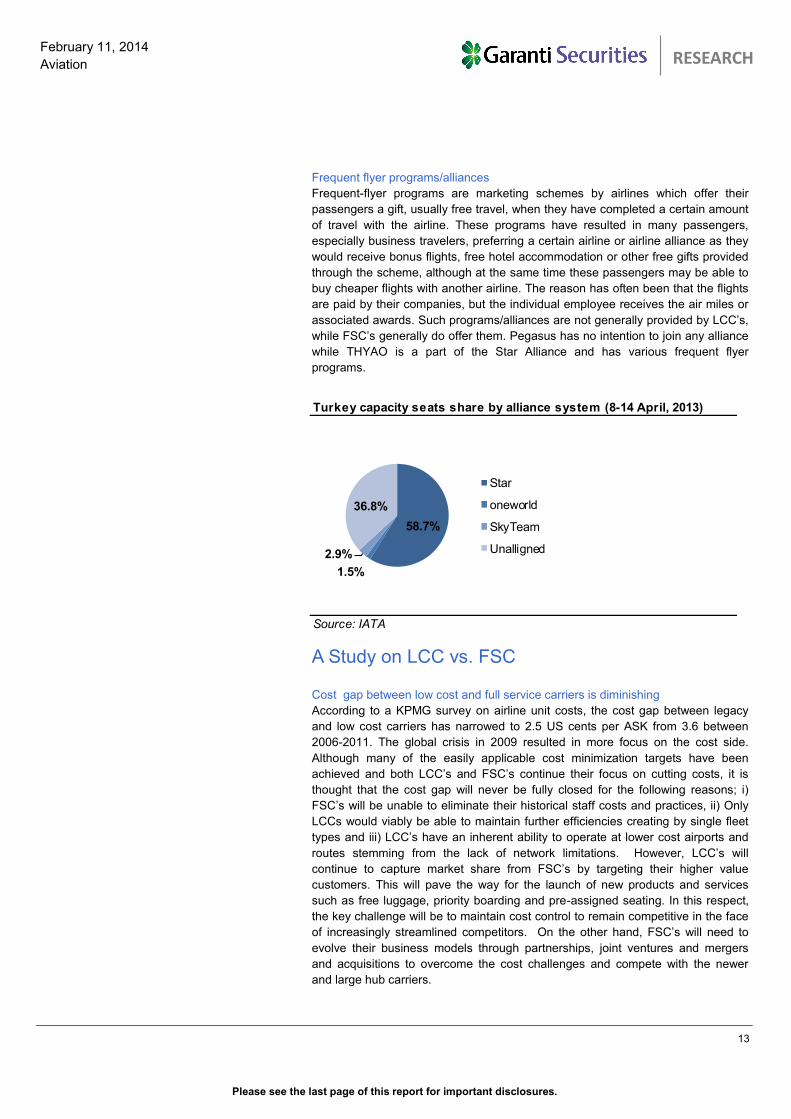
Sales channels
The majority of LCC´s ticket sales are realised through the online channel. Both
LCC’s and FSC’s prefer the internet as a means to distribute tickets rather than
travel agents or call centres, in a bid to cut costs. No paper tickets are issued, and
the issue of a booking code, which may be presented upon check-in, reduces
distribution costs.
Unions
In countries with strong unions, it is very difficult for airlines to reduce their labour
costs by cutting wages or reducing the size of the workforce when they are hit by
downturns in the sector. The employees of many LCC’s are not unionized, helping
these airlines keep labour costs under control. Pegasus has no unionized staff,
while THY has experienced some troubles with its labour union in the past.
THY's Revenue by point of sale Pegasus' sales breakdown by channel
Source: The Company data
Europe29%
Turkey23%
Asia/Far East11%
Middle East9%
America8%
Africa5%
Internet/Call Center
14%
Other1%
Internet46%
Agent44%
Call Center2%
Other8%
Country Passenger fee Ground Handling Landing Parking Fuel Duty-free Food and Beverage Car park
Istanbul x x x x x
Ankara x x x x x
Izmir x x x x x
Gazipasa x x x x x x x x
Enfidha x x x x x x x x
Monastır x x x x x x x x
Tbilisi x x x x x x x x
Batumi x x x x x x x x
Skopje x x x x x x x x
Ohrid x x x x x x x xx
Latvia Riga x x
Saudi Arabia Medina x x x x x x x x
Source: The Company
Macedonia
Aeronautical charges Non-aeronautical charges
Turkey
Tunisia
Georgia
Please see the last page of this report for important disclosures.
13
February 11, 2014
Aviation
TURKISH AVIATION SECTOR
RESEARCH
Frequent flyer programs/alliances
Frequent-flyer programs are marketing schemes by airlines which offer their
passengers a gift, usually free travel, when they have completed a certain amount
of travel with the airline. These programs have resulted in many passengers,
especially business travelers, preferring a certain airline or airline alliance as they
would receive bonus flights, free hotel accommodation or other free gifts provided
through the scheme, although at the same time these passengers may be able to
buy cheaper flights with another airline. The reason has often been that the flights
are paid by their companies, but the individual employee receives the air miles or
associated awards. Such programs/alliances are not generally provided by LCC’s,
while FSC’s generally do offer them. Pegasus has no intention to join any alliance
while THYAO is a part of the Star Alliance and has various frequent flyer
programs.
A Study on LCC vs. FSC
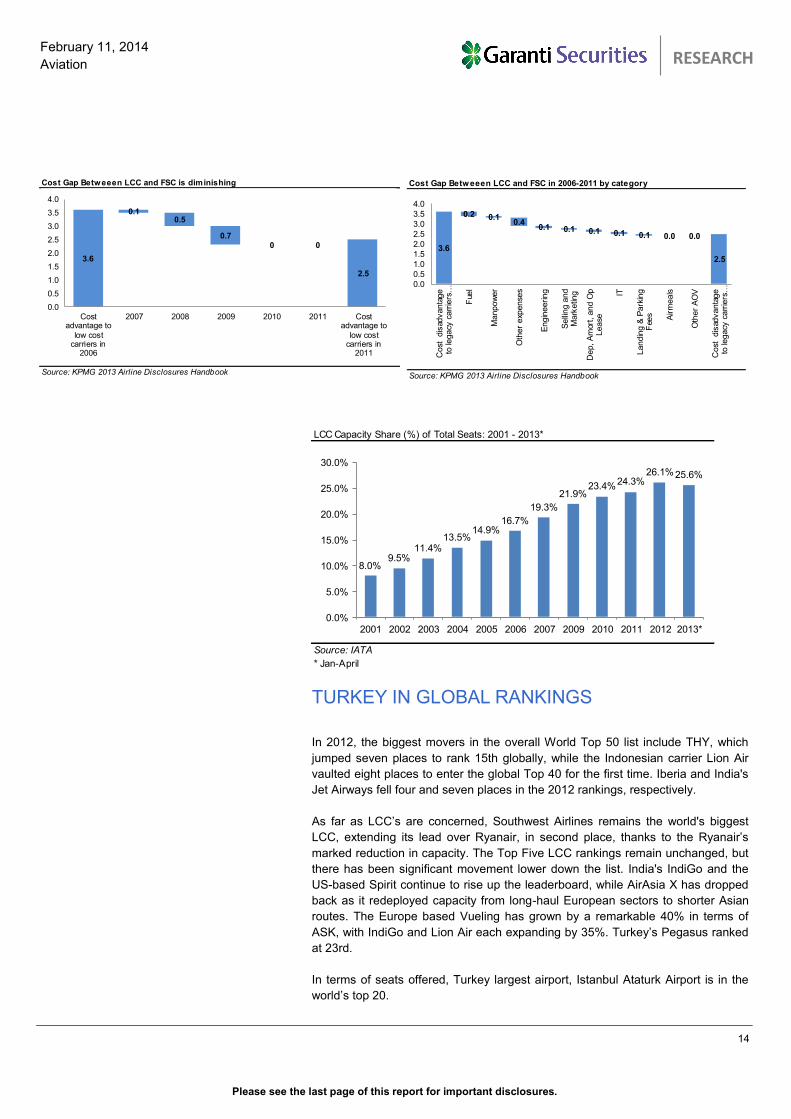
Cost gap between low cost and full service carriers is diminishing
According to a KPMG survey on airline unit costs, the cost gap between legacy
and low cost carriers has narrowed to 2.5 US cents per ASK from 3.6 between
2006-2011. The global crisis in 2009 resulted in more focus on the cost side.
Although many of the easily applicable cost minimization targets have been
achieved and both LCC’s and FSC’s continue their focus on cutting costs, it is
thought that the cost gap will never be fully closed for the following reasons; i)
FSC’s will be unable to eliminate their historical staff costs and practices, ii) Only
LCCs would viably be able to maintain further efficiencies creating by single fleet
types and iii) LCC’s have an inherent ability to operate at lower cost airports and
routes stemming from the lack of network limitations. However, LCC’s will
continue to capture market share from FSC’s by targeting their higher value
customers. This will pave the way for the launch of new products and services
such as free luggage, priority boarding and pre-assigned seating. In this respect,
the key challenge will be to maintain cost control to remain competitive in the face
of increasingly streamlined competitors. On the other hand, FSC’s will need to
evolve their business models through partnerships, joint ventures and mergers
and acquisitions to overcome the cost challenges and compete with the newer
and large hub carriers.
Turkey capacity seats share by alliance system (8-14 April, 2013)
Source: IATA
58.7%
1.5%
2.9%
36.8%
Star
oneworld
SkyTeam
Unalligned
Please see the last page of this report for important disclosures.
14
February 11, 2014
Aviation
TURKISH AVIATION SECTOR
RESEARCH
TURKEY IN GLOBAL RANKINGS
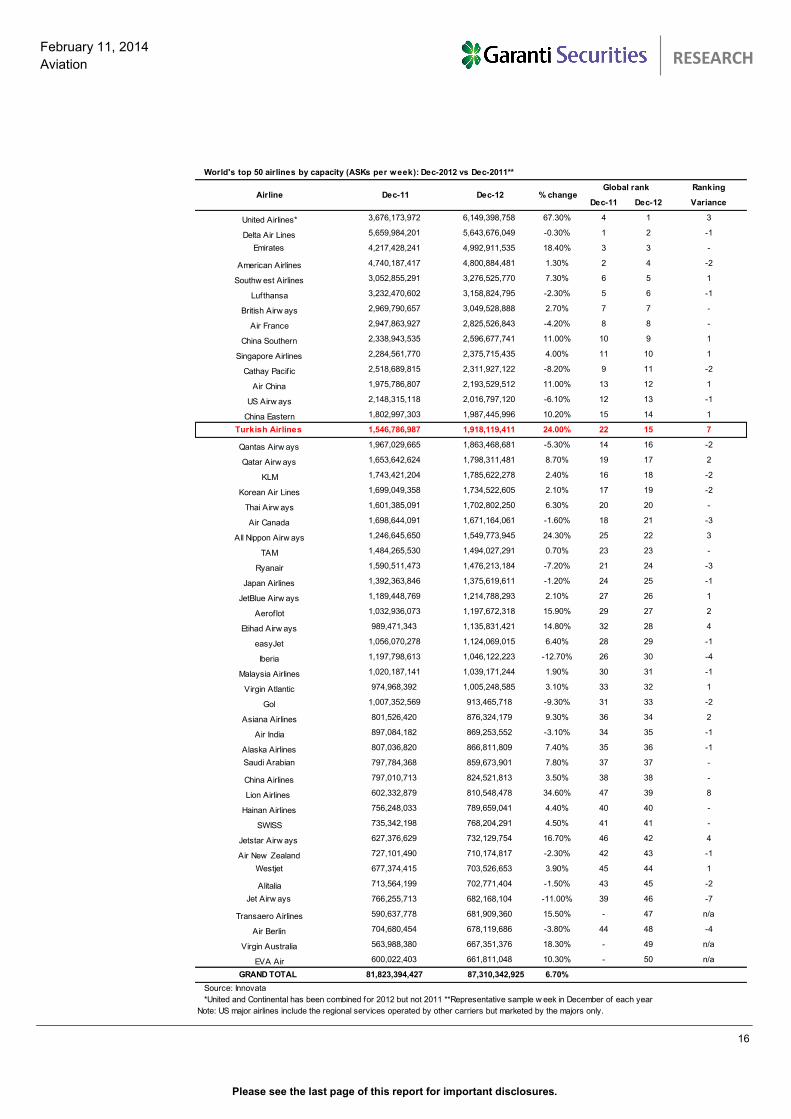
In 2012, the biggest movers in the overall World Top 50 list include THY, which
jumped seven places to rank 15th globally, while the Indonesian carrier Lion Air
vaulted eight places to enter the global Top 40 for the first time. Iberia and India's
Jet Airways fell four and seven places in the 2012 rankings, respectively.
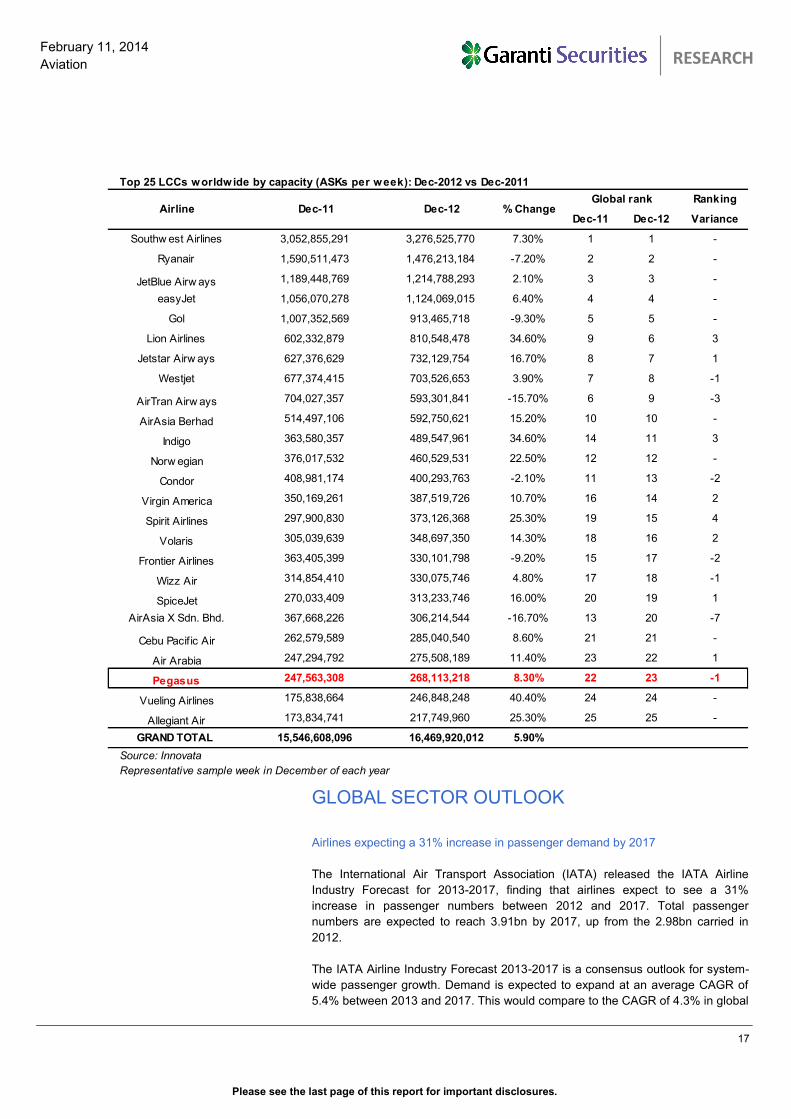
As far as LCC’s are concerned, Southwest Airlines remains the world's biggest
LCC, extending its lead over Ryanair, in second place, thanks to the Ryanair’s
marked reduction in capacity. The Top Five LCC rankings remain unchanged, but
there has been significant movement lower down the list. India's IndiGo and the
US-based Spirit continue to rise up the leaderboard, while AirAsia X has dropped
back as it redeployed capacity from long-haul European sectors to shorter Asian
routes. The Europe based Vueling has grown by a remarkable 40% in terms of
ASK, with IndiGo and Lion Air each expanding by 35%. Turkey’s Pegasus ranked
at 23rd.
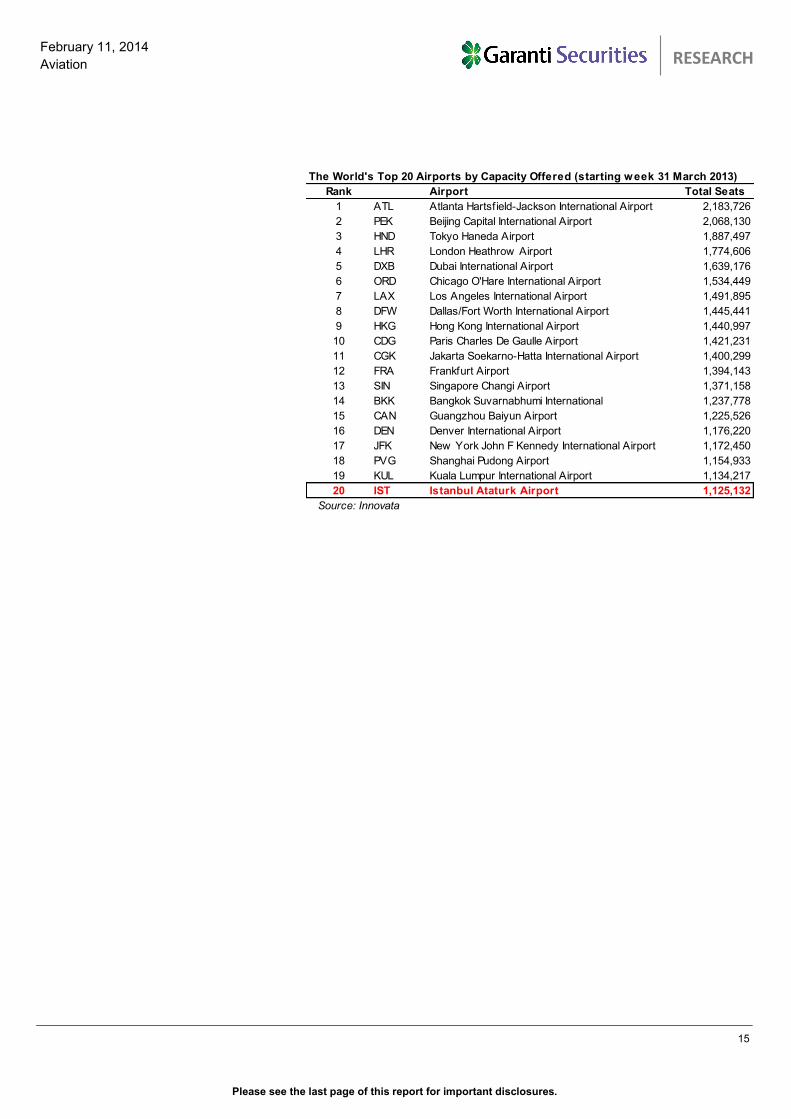
In terms of seats offered, Turkey largest airport, Istanbul Ataturk Airport is in the
world’s top 20.
LCC Capacity Share (%) of Total Seats: 2001 - 2013*
Source: IATA
* Jan-April
8.0%9.5%
11.4%13.5%
14.9%16.7%
19.3%
21.9%23.4%
24.3%26.1%25.6%
0.0%
5.0%
10.0%
15.0%
20.0%
25.0%
30.0%
2001 2002 2003 2004 2005 2006 2007 2009 2010 2011 2012 2013*
Cost Gap Betweeen LCC and FSC is diminishing
Source: KPMG 2013 Airline Disclosures Handbook
3.6
0.10.5
0.70 0
2.5
0.0
0.5
1.0
1.5
2.0
2.5
3.0
3.5
4.0
Costadvantage to
low costcarriers in
2006
2007 2008 2009 2010 2011 Costadvantage to
low costcarriers in
2011
Cost Gap Betweeen LCC and FSC in 2006-2011 by category
Source: KPMG 2013 Airline Disclosures Handbook
3.6
0.2 0.10.4
0.1 0.1 0.1 0.1 0.1 0.0 0.0
2.5
0.0
0.5
1.0
1.5
2.0
2.5
3.0
3.5
4.0
Cost
dis
advanta
ge
to le
gacy
carr
iers
…
Fue
l
Manpow
er
Oth
er
exp
ense
s
Engin
eering
Selli
ng a
nd
Mark
etin
g
Dep, A
mor
t, a
nd O
pLease
IT
Landin
g &
Park
ing
Fee
s Airm
eals
Oth
er
AO
V
Cost
dis
advanta
ge
to le
gacy
carr
iers
…
Please see the last page of this report for important disclosures.
15
February 11, 2014
Aviation
TURKISH AVIATION SECTOR
RESEARCH
The World's Top 20 Airports by Capacity Offered (starting week 31 March 2013)
Rank Airport Total Seats
1 ATL Atlanta Hartsfield-Jackson International Airport 2,183,726
2 PEK Beijing Capital International Airport 2,068,130
3 HND Tokyo Haneda Airport 1,887,497
4 LHR London Heathrow Airport 1,774,606
5 DXB Dubai International Airport 1,639,176
6 ORD Chicago O'Hare International Airport 1,534,449
7 LAX Los Angeles International Airport 1,491,895
8 DFW Dallas/Fort Worth International Airport 1,445,441
9 HKG Hong Kong International Airport 1,440,997
10 CDG Paris Charles De Gaulle Airport 1,421,231
11 CGK Jakarta Soekarno-Hatta International Airport 1,400,299
12 FRA Frankfurt Airport 1,394,143
13 SIN Singapore Changi Airport 1,371,158
14 BKK Bangkok Suvarnabhumi International 1,237,778
15 CAN Guangzhou Baiyun Airport 1,225,526
16 DEN Denver International Airport 1,176,220
17 JFK New York John F Kennedy International Airport 1,172,450
18 PVG Shanghai Pudong Airport 1,154,933
19 KUL Kuala Lumpur International Airport 1,134,217
20 IST Istanbul Ataturk Airport 1,125,132
Source: Innovata
Please see the last page of this report for important disclosures.
16
February 11, 2014
Aviation
TURKISH AVIATION SECTOR
RESEARCH
World's top 50 airlines by capacity (ASKs per week): Dec-2012 vs Dec-2011**
Ranking
Dec-11 Dec-12 Variance
United Airlines* 3,676,173,972 6,149,398,758 67.30% 4 1 3
Delta Air Lines 5,659,984,201 5,643,676,049 -0.30% 1 2 -1
Emirates 4,217,428,241 4,992,911,535 18.40% 3 3 -
American Airlines 4,740,187,417 4,800,884,481 1.30% 2 4 -2
Southw est Airlines 3,052,855,291 3,276,525,770 7.30% 6 5 1
Lufthansa 3,232,470,602 3,158,824,795 -2.30% 5 6 -1
British Airw ays 2,969,790,657 3,049,528,888 2.70% 7 7 -
Air France 2,947,863,927 2,825,526,843 -4.20% 8 8 -
China Southern 2,338,943,535 2,596,677,741 11.00% 10 9 1
Singapore Airlines 2,284,561,770 2,375,715,435 4.00% 11 10 1
Cathay Pacif ic 2,518,689,815 2,311,927,122 -8.20% 9 11 -2
Air China 1,975,786,807 2,193,529,512 11.00% 13 12 1
US Airw ays 2,148,315,118 2,016,797,120 -6.10% 12 13 -1
China Eastern 1,802,997,303 1,987,445,996 10.20% 15 14 1
Turkish Airlines 1,546,786,987 1,918,119,411 24.00% 22 15 7
Qantas Airw ays 1,967,029,665 1,863,468,681 -5.30% 14 16 -2
Qatar Airw ays 1,653,642,624 1,798,311,481 8.70% 19 17 2
KLM 1,743,421,204 1,785,622,278 2.40% 16 18 -2
Korean Air Lines 1,699,049,358 1,734,522,605 2.10% 17 19 -2
Thai Airw ays 1,601,385,091 1,702,802,250 6.30% 20 20 -
Air Canada 1,698,644,091 1,671,164,061 -1.60% 18 21 -3
All Nippon Airw ays 1,246,645,650 1,549,773,945 24.30% 25 22 3
TAM 1,484,265,530 1,494,027,291 0.70% 23 23 -
Ryanair 1,590,511,473 1,476,213,184 -7.20% 21 24 -3
Japan Airlines 1,392,363,846 1,375,619,611 -1.20% 24 25 -1
JetBlue Airw ays 1,189,448,769 1,214,788,293 2.10% 27 26 1
Aeroflot 1,032,936,073 1,197,672,318 15.90% 29 27 2
Etihad Airw ays 989,471,343 1,135,831,421 14.80% 32 28 4
easyJet 1,056,070,278 1,124,069,015 6.40% 28 29 -1
Iberia 1,197,798,613 1,046,122,223 -12.70% 26 30 -4
Malaysia Airlines 1,020,187,141 1,039,171,244 1.90% 30 31 -1
Virgin Atlantic 974,968,392 1,005,248,585 3.10% 33 32 1
Gol 1,007,352,569 913,465,718 -9.30% 31 33 -2
Asiana Airlines 801,526,420 876,324,179 9.30% 36 34 2
Air India 897,084,182 869,253,552 -3.10% 34 35 -1
Alaska Airlines 807,036,820 866,811,809 7.40% 35 36 -1
Saudi Arabian 797,784,368 859,673,901 7.80% 37 37 -
China Airlines 797,010,713 824,521,813 3.50% 38 38 -
Lion Airlines 602,332,879 810,548,478 34.60% 47 39 8
Hainan Airlines 756,248,033 789,659,041 4.40% 40 40 -
SWISS 735,342,198 768,204,291 4.50% 41 41 -
Jetstar Airw ays 627,376,629 732,129,754 16.70% 46 42 4
Air New Zealand 727,101,490 710,174,817 -2.30% 42 43 -1
Westjet 677,374,415 703,526,653 3.90% 45 44 1
Alitalia 713,564,199 702,771,404 -1.50% 43 45 -2
Jet Airw ays 766,255,713 682,168,104 -11.00% 39 46 -7
Transaero Airlines 590,637,778 681,909,360 15.50% - 47 n/a
Air Berlin 704,680,454 678,119,686 -3.80% 44 48 -4
Virgin Australia 563,988,380 667,351,376 18.30% - 49 n/a
EVA Air 600,022,403 661,811,048 10.30% - 50 n/a
GRAND TOTAL 81,823,394,427 87,310,342,925 6.70%
Source: Innovata
*United and Continental has been combined for 2012 but not 2011 **Representative sample w eek in December of each year
Note: US major airlines include the regional services operated by other carriers but marketed by the majors only.
Airline Dec-11 Dec-12 % changeGlobal rank
Please see the last page of this report for important disclosures.
17
February 11, 2014
Aviation
TURKISH AVIATION SECTOR
RESEARCH
GLOBAL SECTOR OUTLOOK
Airlines expecting a 31% increase in passenger demand by 2017
The International Air Transport Association (IATA) released the IATA Airline
Industry Forecast for 2013-2017, finding that airlines expect to see a 31%
increase in passenger numbers between 2012 and 2017. Total passenger
numbers are expected to reach 3.91bn by 2017, up from the 2.98bn carried in
2012.
The IATA Airline Industry Forecast 2013-2017 is a consensus outlook for system-
wide passenger growth. Demand is expected to expand at an average CAGR of
5.4% between 2013 and 2017. This would compare to the CAGR of 4.3% in global
Top 25 LCCs worldwide by capacity (ASKs per week): Dec-2012 vs Dec-2011
Ranking
Dec-11 Dec-12 Variance
Southw est Airlines 3,052,855,291 3,276,525,770 7.30% 1 1 -
Ryanair 1,590,511,473 1,476,213,184 -7.20% 2 2 -
JetBlue Airw ays 1,189,448,769 1,214,788,293 2.10% 3 3 -
easyJet 1,056,070,278 1,124,069,015 6.40% 4 4 -
Gol 1,007,352,569 913,465,718 -9.30% 5 5 -
Lion Airlines 602,332,879 810,548,478 34.60% 9 6 3
Jetstar Airw ays 627,376,629 732,129,754 16.70% 8 7 1
Westjet 677,374,415 703,526,653 3.90% 7 8 -1
AirTran Airw ays 704,027,357 593,301,841 -15.70% 6 9 -3
AirAsia Berhad 514,497,106 592,750,621 15.20% 10 10 -
Indigo 363,580,357 489,547,961 34.60% 14 11 3
Norw egian 376,017,532 460,529,531 22.50% 12 12 -
Condor 408,981,174 400,293,763 -2.10% 11 13 -2
Virgin America 350,169,261 387,519,726 10.70% 16 14 2
Spirit Airlines 297,900,830 373,126,368 25.30% 19 15 4
Volaris 305,039,639 348,697,350 14.30% 18 16 2
Frontier Airlines 363,405,399 330,101,798 -9.20% 15 17 -2
Wizz Air 314,854,410 330,075,746 4.80% 17 18 -1
SpiceJet 270,033,409 313,233,746 16.00% 20 19 1
AirAsia X Sdn. Bhd. 367,668,226 306,214,544 -16.70% 13 20 -7
Cebu Pacif ic Air 262,579,589 285,040,540 8.60% 21 21 -
Air Arabia 247,294,792 275,508,189 11.40% 23 22 1
Pegasus 247,563,308 268,113,218 8.30% 22 23 -1
Vueling Airlines 175,838,664 246,848,248 40.40% 24 24 -
Allegiant Air 173,834,741 217,749,960 25.30% 25 25 -
GRAND TOTAL 15,546,608,096 16,469,920,012 5.90%
Source: Innovata
Representative sample week in December of each year
Airline Dec-11 Dec-12 % ChangeGlobal rank
Please see the last page of this report for important disclosures.
18
February 11, 2014
Aviation
TURKISH AVIATION SECTOR
RESEARCH
passenger numbers between 2008 and 2012, largely reflecting the negative
impact of the 2008 global financial crisis and the recession that followed. Of the
new passengers, approximately 292mn will be carried on international routes and
638mn domestically.
The emerging economies of the Middle East and Asia-Pacific will see the
strongest international passenger growth with a projected CAGR of 6.3% and
5.7%, followed by Africa and Latin America with CAGR rates of 5.3% and 4.5%.
Routes to or within China will be the single largest driver of growth, accounting for
30% of new passengers during the forecast period. Of the anticipated 227.4mn
additional passengers, 195mn will be domestic and 32.4mn will be international.
The Asia-Pacific region (including China) is expected to add around 300mn
additional passengers by the end of the current forecast horizon. Of these, around
225mn or 75% are expected to be domestic passengers.
With 677.8mn domestic passengers in 2017, the United States will remain the
largest single market for domestic passengers, although it is only forecasted to
add 70mn passengers over the forecast period (marking a 2.2% CAGR). This
reflects the market’s maturity. China is firmly established in second place
(487.9mn passengers by 2017, with a 10.2% CAGR.). The US also will reclaim the
top spot from Germany for international passengers by the end of the forecast
period. Germany will add 27.2mn passengers to the 149.4mn in 2012 (3.4%
CAGR), while the US will add 28.2mn international passengers, the number
increasing at a CAGR of 3.5% from 149.3mn in 2012 to 177.5mn in 2017.
Forecast Highlights
International Passenger Development
International passenger numbers are expected to rise by 25% from 1.2 bn in 2012
to 1.5bn in 2017, bringing 292mn additional passengers (4.6% CAGR).
Uzbekistan (10.3% CAGR) has displaced Kazakhstan (9.0% CAGR) as the fastest
growing market for international passenger traffic. The next eight fastest growing
markets are Russia (7.7% CAGR), Turkey (7.6% CAGR), Oman (7.5% CAGR),
China (7.1% CAGR), Vietnam (6.9%CAGR), Saudi Arabia (6.9%), Azerbaijan
(6.8% CAGR), and Pakistan (6.7% CAGR). No Latin American or African countries
are among the fastest growing markets.
The United Arab Emirates will see air passenger numbers increase by 29.2 mn (a
6.6% CAGR) over the forecast period, nearly as many additions as in China. For
international traffic, routes between the Middle East and Asia-Pacific will see the
most rapid growth.
Domestic Passenger Development
Domestic passenger numbers are expected to rise from 1.82 billion in 2012 to
2.46bn in 2017, an increase of 639mn reflecting a CAGR of 6.2% over the period.
Brazil will firmly establish itself as the third largest domestic market after the US
and China, with 122.4mn passengers in 2017, an increase of 32 million

Please see the last page of this report for important disclosures.
19
February 11, 2014
Aviation
TURKISH AVIATION SECTOR
RESEARCH
passengers from the 90mn 2012 (a 6.3% CAGR).
Turkey will enter the top 10 largest markets with 26.3mn passengers carried with
an addition of 17.2mn more (10.6% CAGR) over the forecast period. It is also the
second fastest growing domestic market.
The lower five of the top ten fastest growing markets on the basis of domestic
passenger numbers, the bottom five are all in Latin America: Brazil, Peru,
Colombia, Mexico and Ecuador.
Regional Outlook over the 2013-2017 forecast period
Asia-Pacific passenger traffic is forecast to grow at a CAGR of 5.7%. Traffic within
the Asia-Pacific region will represent 31.7% of global passengers in 2017, up from
28.2% in 2012. North America and Europe will continue to see their share decline,
from 26% to 24% for North America, and from 24% to 23% for Europe.
The Middle East is set to follow the strongest international passenger growth, with
a CAGR of 6.3%.
Europe is on course to see international passenger demand grow at a CAGR of
3.9%.
North America is projected to see the slowest international passenger demand
growth with a CAGR of 3.6%.
Latin America is forecasted to see international passenger demand grow at a
CAGR of 4.5%.
TURKISH AVIATION SECTOR AT A GLANCE
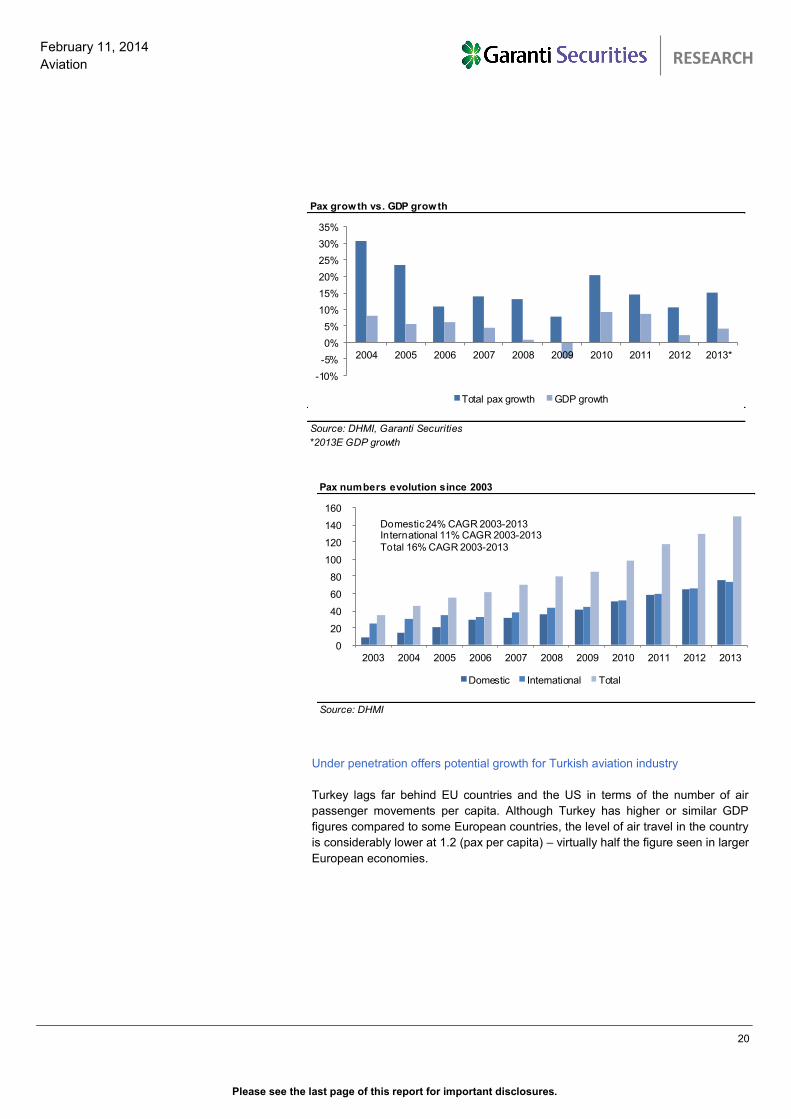
Turkish air passenger traffic posted a 16% CAGR in 2003-2013
Passenger traffic in Turkey has witnessed strong momentum since the
deregulation of the sector in 2003. Passenger numbers have grown at a CAGR of
16% in Turkey between 2003-13, at a multiple of 3x real GDP growth. Even in
2009, when real GDP contracted by 5%, passenger numbers in Turkey grew by
6%. The Turkish aviation industry continued to register high rates of growth, even
at the time of the global financial crisis (in 2008-09), the SARS outbreak (in 2004)
and natural phenomena such as the volcanic eruption in Iceland (in 2011).
Domestic passenger numbers have also surged on the back of affordable fares
with a CAGR of 24% between 2003-2013, surpassing the CAGR of 11% in
international passenger numbers. We think that Turkey’s geographical position, its
increased tourism potential, its still under-penetrated nature and a generally
supportive approach to the sector by the government will help sustain this above-
average growth. Turkey’s two biggest carriers THY and Pegasus plan to double
their fleet size by 2021, indicating their anticipation of strong demand. We project
air passenger traffic to reach 150mn by 2016, marking a CAGR of 9.3% CAGR for
2014-2016E vs. State Airports’ Authority’s projection if a 9.9% CAGR (see page
25 for details).
Please see the last page of this report for important disclosures.
20
February 11, 2014
Aviation
TURKISH AVIATION SECTOR
RESEARCH
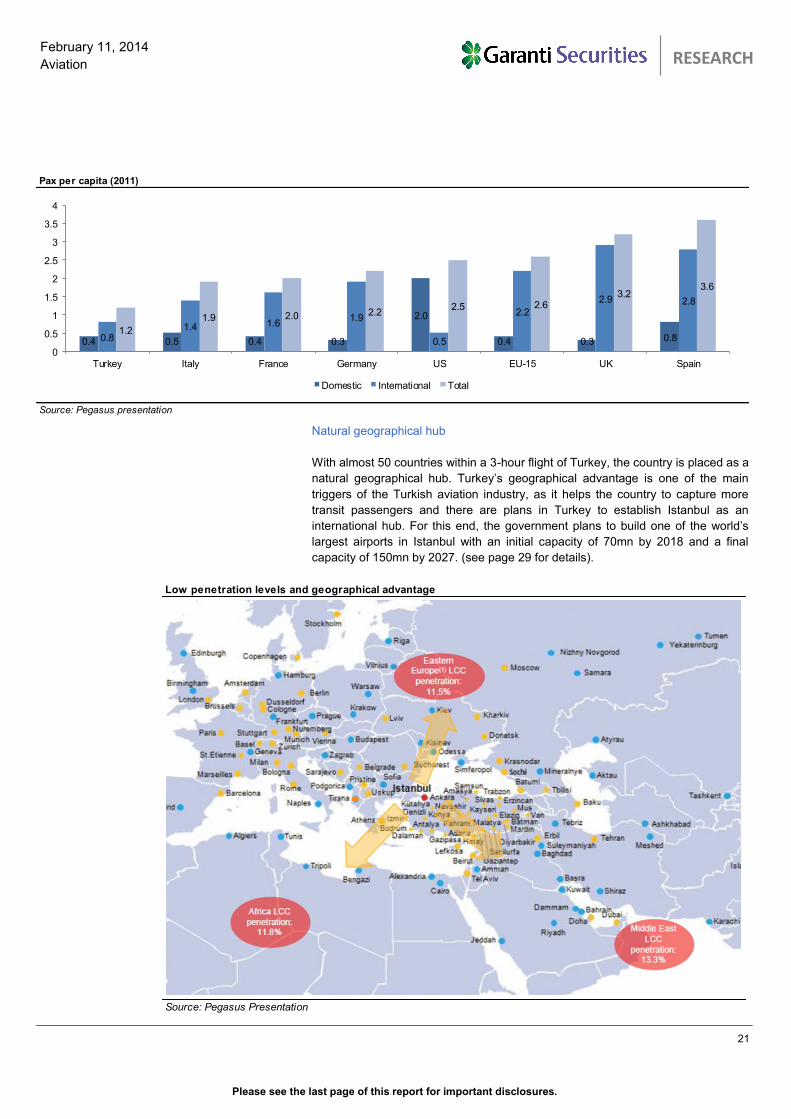
Under penetration offers potential growth for Turkish aviation industry
Turkey lags far behind EU countries and the US in terms of the number of air
passenger movements per capita. Although Turkey has higher or similar GDP
figures compared to some European countries, the level of air travel in the country
is considerably lower at 1.2 (pax per capita) – virtually half the figure seen in larger
European economies.
Pax growth vs. GDP growth
Source: DHMI, Garanti Securities
*2013E GDP growth
-10%
-5%
0%
5%
10%
15%
20%
25%
30%
35%
2004 2005 2006 2007 2008 2009 2010 2011 2012 2013*
Total pax growth GDP growth
Pax numbers evolution since 2003
Source: DHMI
0
20
40
60
80
100
120
140
160
2003 2004 2005 2006 2007 2008 2009 2010 2011 2012 2013
Domestic International Total
Domestic 24% CAGR 2003-2013International 11% CAGR 2003-2013
Total 16% CAGR 2003-2013
Please see the last page of this report for important disclosures.
21
February 11, 2014
Aviation
TURKISH AVIATION SECTOR
RESEARCH
Natural geographical hub
With almost 50 countries within a 3-hour flight of Turkey, the country is placed as a
natural geographical hub. Turkey’s geographical advantage is one of the main
triggers of the Turkish aviation industry, as it helps the country to capture more
transit passengers and there are plans in Turkey to establish Istanbul as an
international hub. For this end, the government plans to build one of the world’s
largest airports in Istanbul with an initial capacity of 70mn by 2018 and a final
capacity of 150mn by 2027. (see page 29 for details).
Pax per capita (2011)
Source: Pegasus presentation
0.4 0.5 0.4 0.3
2.0
0.4 0.3 0.80.81.4 1.6
1.9
0.5
2.2
2.9 2.8
1.2
1.9 2.0 2.22.5 2.6
3.23.6
0
0.5
1
1.5
2
2.5
3
3.5
4
Turkey Italy France Germany US EU-15 UK Spain
Domestic International Total
Low penetration levels and geographical advantage
Source: Pegasus Presentation
Please see the last page of this report for important disclosures.
22
February 11, 2014
Aviation
TURKISH AVIATION SECTOR
RESEARCH
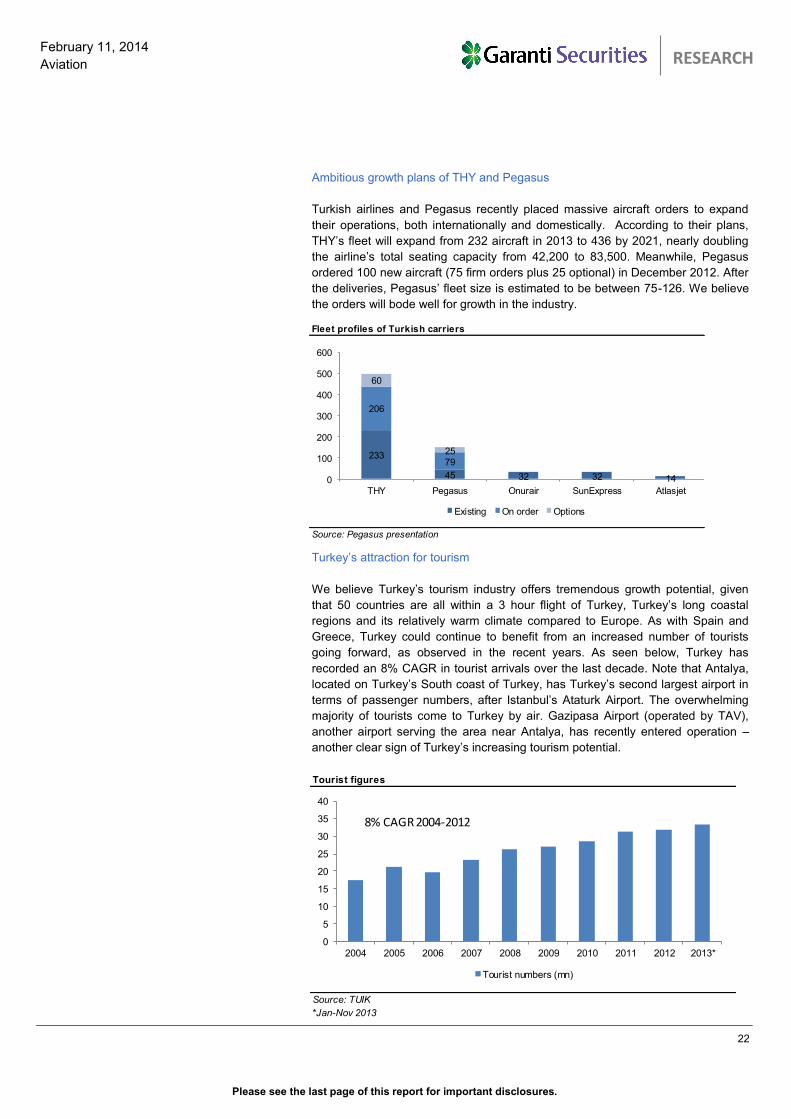
Ambitious growth plans of THY and Pegasus
Turkish airlines and Pegasus recently placed massive aircraft orders to expand
their operations, both internationally and domestically. According to their plans,
THY’s fleet will expand from 232 aircraft in 2013 to 436 by 2021, nearly doubling
the airline’s total seating capacity from 42,200 to 83,500. Meanwhile, Pegasus
ordered 100 new aircraft (75 firm orders plus 25 optional) in December 2012. After
the deliveries, Pegasus’ fleet size is estimated to be between 75-126. We believe
the orders will bode well for growth in the industry.
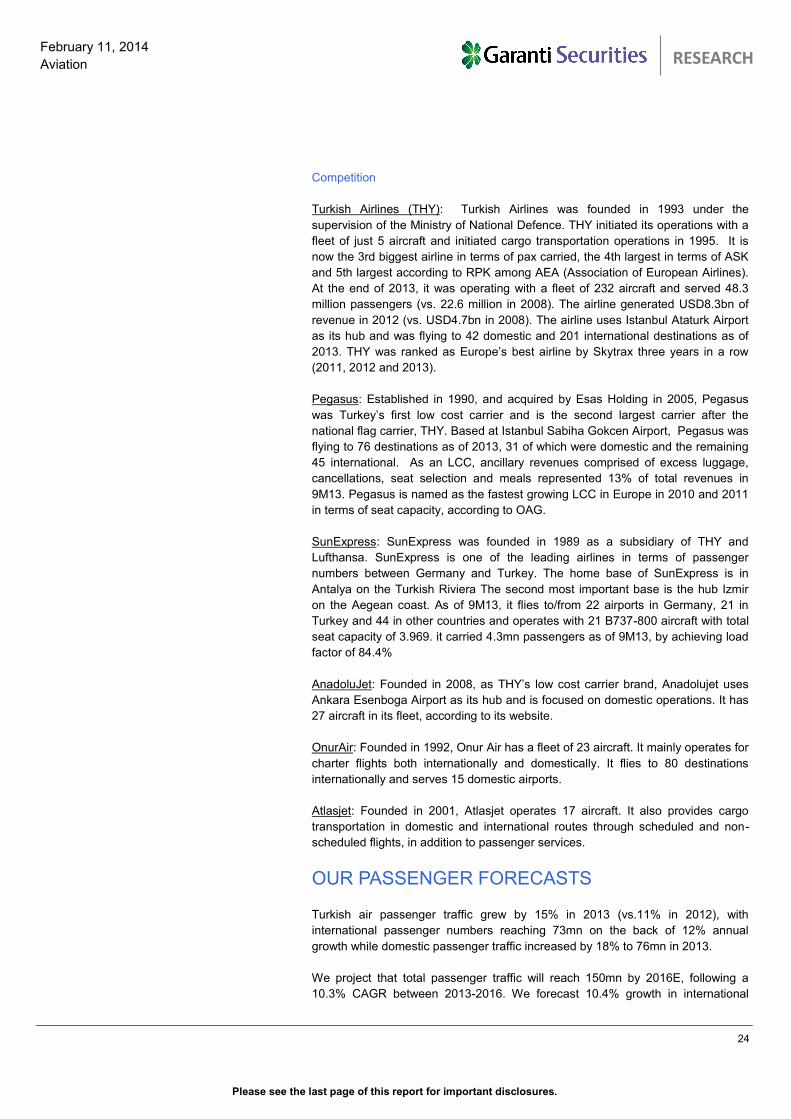
Turkey’s attraction for tourism
We believe Turkey’s tourism industry offers tremendous growth potential, given
that 50 countries are all within a 3 hour flight of Turkey, Turkey’s long coastal
regions and its relatively warm climate compared to Europe. As with Spain and
Greece, Turkey could continue to benefit from an increased number of tourists
going forward, as observed in the recent years. As seen below, Turkey has
recorded an 8% CAGR in tourist arrivals over the last decade. Note that Antalya,
located on Turkey’s South coast of Turkey, has Turkey’s second largest airport in
terms of passenger numbers, after Istanbul’s Ataturk Airport. The overwhelming
majority of tourists come to Turkey by air. Gazipasa Airport (operated by TAV),
another airport serving the area near Antalya, has recently entered operation –
another clear sign of Turkey’s increasing tourism potential.
Fleet profiles of Turkish carriers
Source: Pegasus presentation
233
45 32 32 14
206
79
60
25
0
100
200
300
400
500
600
THY Pegasus Onurair SunExpress Atlasjet
Existing On order Options
Tourist figures
Source: TUIK
*Jan-Nov 2013
0
5
10
15
20
25
30
35
40
2004 2005 2006 2007 2008 2009 2010 2011 2012 2013*
Tourist numbers (mn)
8% CAGR 2004-2012
Please see the last page of this report for important disclosures.
23
February 11, 2014
Aviation
TURKISH AVIATION SECTOR
RESEARCH
Supportive demographics
Turkey is the second largest country in Europe in terms of population, after
Germany, with a demographically young population; half of the population is under
the age of 30, meaning more people tend to fly as they reach working age. In
Turkey, it is believed that passport ownership ratio is yet at low teens and we
believe the majority of passport holders are Turkish citizens living in other
countries. We believe the high passport fees are one of the reasons for the low
passport ownership in Turkey. There has been increasing controversy on that
issue with campaigns to ensure passport ownership is more affordable or easy.
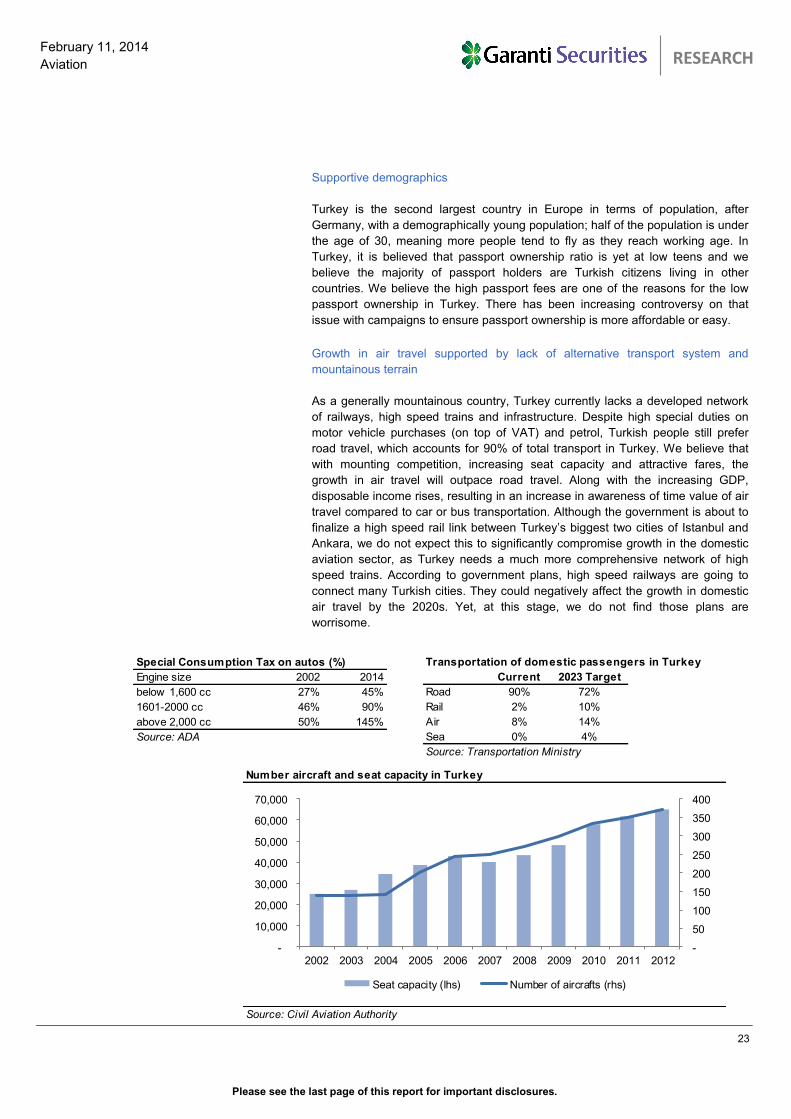
Growth in air travel supported by lack of alternative transport system and
mountainous terrain
As a generally mountainous country, Turkey currently lacks a developed network
of railways, high speed trains and infrastructure. Despite high special duties on
motor vehicle purchases (on top of VAT) and petrol, Turkish people still prefer
road travel, which accounts for 90% of total transport in Turkey. We believe that
with mounting competition, increasing seat capacity and attractive fares, the
growth in air travel will outpace road travel. Along with the increasing GDP,
disposable income rises, resulting in an increase in awareness of time value of air
travel compared to car or bus transportation. Although the government is about to
finalize a high speed rail link between Turkey’s biggest two cities of Istanbul and
Ankara, we do not expect this to significantly compromise growth in the domestic
aviation sector, as Turkey needs a much more comprehensive network of high
speed trains. According to government plans, high speed railways are going to
connect many Turkish cities. They could negatively affect the growth in domestic
air travel by the 2020s. Yet, at this stage, we do not find those plans are
worrisome.
Special Consumption Tax on autos (%)
Engine size 2002 2014
below 1,600 cc 27% 45%
1601-2000 cc 46% 90%
above 2,000 cc 50% 145%
Source: ADA
Transportation of domestic passengers in Turkey
Current 2023 Target
Road 90% 72%
Rail 2% 10%
Air 8% 14%
Sea 0% 4%
Source: Transportation Ministry
Number aircraft and seat capacity in Turkey
Source: Civil Aviation Authority
-
50
100
150
200
250
300
350
400
-
10,000
20,000
30,000
40,000
50,000
60,000
70,000
2002 2003 2004 2005 2006 2007 2008 2009 2010 2011 2012
Seat capacity (lhs) Number of aircrafts (rhs)
Please see the last page of this report for important disclosures.
24
February 11, 2014
Aviation
TURKISH AVIATION SECTOR
RESEARCH
Competition
Turkish Airlines (THY): Turkish Airlines was founded in 1993 under the
supervision of the Ministry of National Defence. THY initiated its operations with a
fleet of just 5 aircraft and initiated cargo transportation operations in 1995. It is
now the 3rd biggest airline in terms of pax carried, the 4th largest in terms of ASK
and 5th largest according to RPK among AEA (Association of European Airlines).
At the end of 2013, it was operating with a fleet of 232 aircraft and served 48.3
million passengers (vs. 22.6 million in 2008). The airline generated USD8.3bn of
revenue in 2012 (vs. USD4.7bn in 2008). The airline uses Istanbul Ataturk Airport
as its hub and was flying to 42 domestic and 201 international destinations as of
2013. THY was ranked as Europe’s best airline by Skytrax three years in a row
(2011, 2012 and 2013).
Pegasus: Established in 1990, and acquired by Esas Holding in 2005, Pegasus
was Turkey’s first low cost carrier and is the second largest carrier after the
national flag carrier, THY. Based at Istanbul Sabiha Gokcen Airport, Pegasus was
flying to 76 destinations as of 2013, 31 of which were domestic and the remaining
45 international. As an LCC, ancillary revenues comprised of excess luggage,
cancellations, seat selection and meals represented 13% of total revenues in
9M13. Pegasus is named as the fastest growing LCC in Europe in 2010 and 2011
in terms of seat capacity, according to OAG.
SunExpress: SunExpress was founded in 1989 as a subsidiary of THY and
Lufthansa. SunExpress is one of the leading airlines in terms of passenger
numbers between Germany and Turkey. The home base of SunExpress is in
Antalya on the Turkish Riviera The second most important base is the hub Izmir
on the Aegean coast. As of 9M13, it flies to/from 22 airports in Germany, 21 in
Turkey and 44 in other countries and operates with 21 B737-800 aircraft with total
seat capacity of 3.969. it carried 4.3mn passengers as of 9M13, by achieving load
factor of 84.4%
AnadoluJet: Founded in 2008, as THY’s low cost carrier brand, Anadolujet uses
Ankara Esenboga Airport as its hub and is focused on domestic operations. It has
27 aircraft in its fleet, according to its website.
OnurAir: Founded in 1992, Onur Air has a fleet of 23 aircraft. It mainly operates for
charter flights both internationally and domestically. It flies to 80 destinations
internationally and serves 15 domestic airports.
Atlasjet: Founded in 2001, Atlasjet operates 17 aircraft. It also provides cargo
transportation in domestic and international routes through scheduled and non-
scheduled flights, in addition to passenger services.
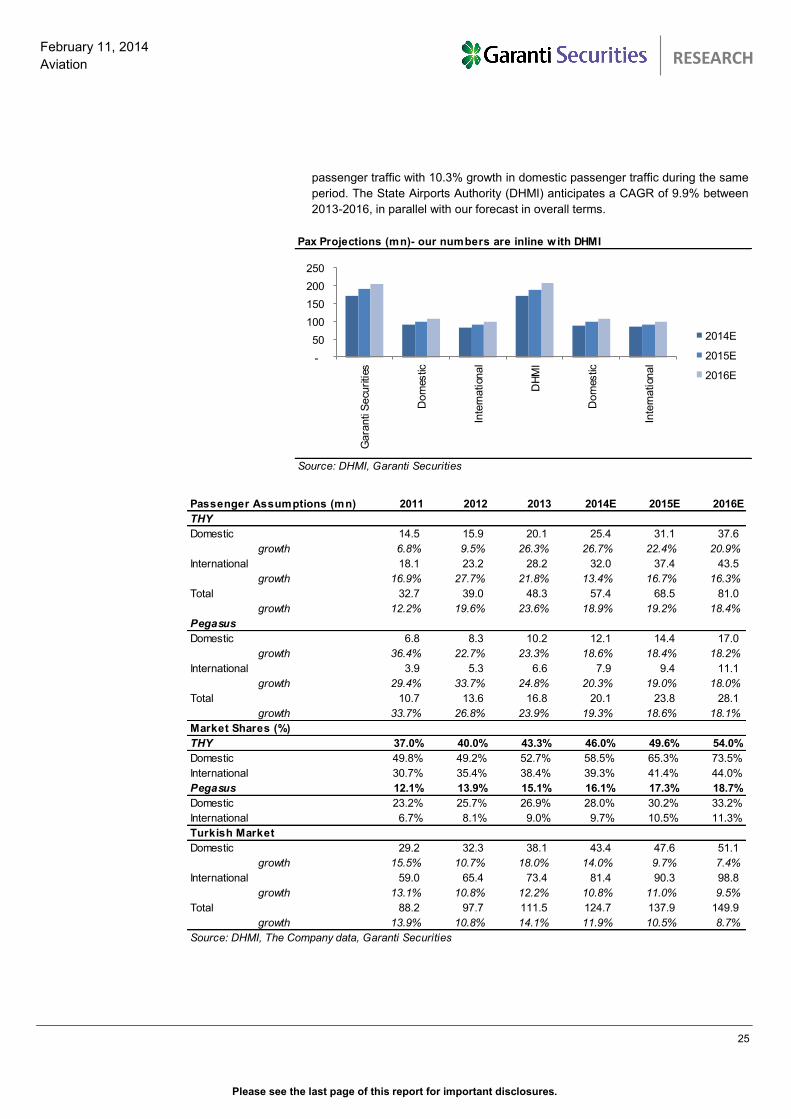
OUR PASSENGER FORECASTS
Turkish air passenger traffic grew by 15% in 2013 (vs.11% in 2012), with
international passenger numbers reaching 73mn on the back of 12% annual
growth while domestic passenger traffic increased by 18% to 76mn in 2013.
We project that total passenger traffic will reach 150mn by 2016E, following a
10.3% CAGR between 2013-2016. We forecast 10.4% growth in international
Please see the last page of this report for important disclosures.
25
February 11, 2014
Aviation
TURKISH AVIATION SECTOR
RESEARCH
passenger traffic with 10.3% growth in domestic passenger traffic during the same
period. The State Airports Authority (DHMI) anticipates a CAGR of 9.9% between
2013-2016, in parallel with our forecast in overall terms.
Pax Projections (mn)- our numbers are inline w ith DHMI
Source: DHMI, Garanti Securities
-
50
100
150
200
250
Gara
nti
Secu
rities
Dom
estic
Inte
rnation
al
DH
MI
Dom
estic
Inte
rnation
al
2014E
2015E
2016E
Passenger Assumptions (mn) 2011 2012 2013 2014E 2015E 2016E
THY
Domestic 14.5 15.9 20.1 25.4 31.1 37.6
growth 6.8% 9.5% 26.3% 26.7% 22.4% 20.9%
International 18.1 23.2 28.2 32.0 37.4 43.5
growth 16.9% 27.7% 21.8% 13.4% 16.7% 16.3%
Total 32.7 39.0 48.3 57.4 68.5 81.0
growth 12.2% 19.6% 23.6% 18.9% 19.2% 18.4%
Pegasus
Domestic 6.8 8.3 10.2 12.1 14.4 17.0
growth 36.4% 22.7% 23.3% 18.6% 18.4% 18.2%
International 3.9 5.3 6.6 7.9 9.4 11.1
growth 29.4% 33.7% 24.8% 20.3% 19.0% 18.0%
Total 10.7 13.6 16.8 20.1 23.8 28.1
growth 33.7% 26.8% 23.9% 19.3% 18.6% 18.1%
Market Shares (%)
THY 37.0% 40.0% 43.3% 46.0% 49.6% 54.0%
Domestic 49.8% 49.2% 52.7% 58.5% 65.3% 73.5%
International 30.7% 35.4% 38.4% 39.3% 41.4% 44.0%
Pegasus 12.1% 13.9% 15.1% 16.1% 17.3% 18.7%
Domestic 23.2% 25.7% 26.9% 28.0% 30.2% 33.2%
International 6.7% 8.1% 9.0% 9.7% 10.5% 11.3%
Turkish Market
Domestic 29.2 32.3 38.1 43.4 47.6 51.1
growth 15.5% 10.7% 18.0% 14.0% 9.7% 7.4%
International 59.0 65.4 73.4 81.4 90.3 98.8
growth 13.1% 10.8% 12.2% 10.8% 11.0% 9.5%
Total 88.2 97.7 111.5 124.7 137.9 149.9
growth 13.9% 10.8% 14.1% 11.9% 10.5% 8.7%
Source: DHMI, The Company data, Garanti Securities
Please see the last page of this report for important disclosures.
26
February 11, 2014
Aviation
TURKISH AVIATION SECTOR
RESEARCH
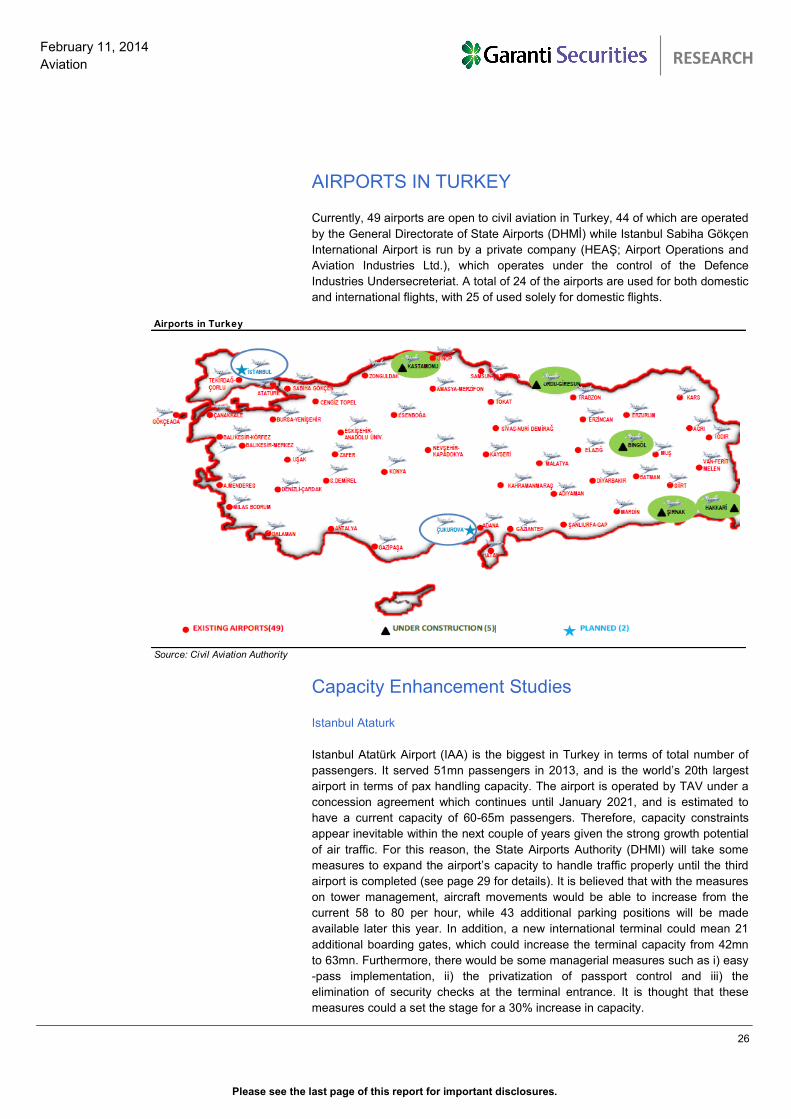
AIRPORTS IN TURKEY
Currently, 49 airports are open to civil aviation in Turkey, 44 of which are operated
by the General Directorate of State Airports (DHMİ) while Istanbul Sabiha Gökçen
International Airport is run by a private company (HEAŞ; Airport Operations and
Aviation Industries Ltd.), which operates under the control of the Defence
Industries Undersecreteriat. A total of 24 of the airports are used for both domestic
and international flights, with 25 of used solely for domestic flights.
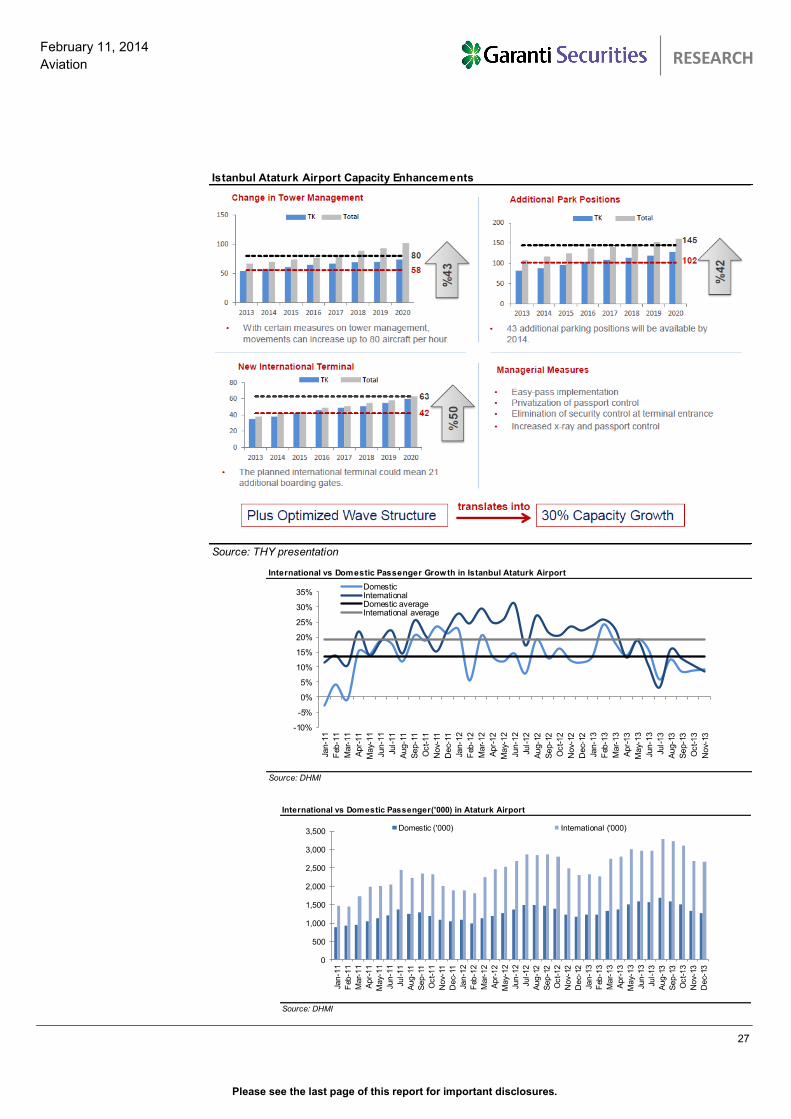
Capacity Enhancement Studies
Istanbul Ataturk
Istanbul Atatürk Airport (IAA) is the biggest in Turkey in terms of total number of
passengers. It served 51mn passengers in 2013, and is the world’s 20th largest
airport in terms of pax handling capacity. The airport is operated by TAV under a
concession agreement which continues until January 2021, and is estimated to
have a current capacity of 60-65m passengers. Therefore, capacity constraints
appear inevitable within the next couple of years given the strong growth potential
of air traffic. For this reason, the State Airports Authority (DHMI) will take some
measures to expand the airport’s capacity to handle traffic properly until the third
airport is completed (see page 29 for details). It is believed that with the measures
on tower management, aircraft movements would be able to increase from the
current 58 to 80 per hour, while 43 additional parking positions will be made
available later this year. In addition, a new international terminal could mean 21
additional boarding gates, which could increase the terminal capacity from 42mn
to 63mn. Furthermore, there would be some managerial measures such as i) easy
-pass implementation, ii) the privatization of passport control and iii) the
elimination of security checks at the terminal entrance. It is thought that these
measures could a set the stage for a 30% increase in capacity.
Airports in Turkey
Source: Civil Aviation Authority
Please see the last page of this report for important disclosures.
27
February 11, 2014
Aviation
TURKISH AVIATION SECTOR
RESEARCH
Source: DHMI
International vs Domestic Passenger Growth in Istanbul Ataturk Airport
-10%
-5%
0%
5%
10%
15%
20%
25%
30%
35%
Jan-1
1
Feb
-11
Mar-
11
Apr-
11
May-
11
Jun-1
1
Jul-11
Aug-1
1
Sep-1
1
Oct-11
Nov-
11
Dec-
11
Jan-1
2
Feb
-12
Mar-
12
Apr-
12
May-
12
Jun-1
2
Jul-12
Aug-1
2
Sep-1
2
Oct-12
Nov-
12
Dec-
12
Jan-1
3
Feb
-13
Mar-
13
Apr-
13
May-
13
Jun-1
3
Jul-13
Aug-1
3
Sep-1
3
Oct-13
Nov-
13
DomesticInternationalDomestic averageInternational average
Source: DHMI
International vs Domestic Passenger('000) in Ataturk Airport
0
500
1,000
1,500
2,000
2,500
3,000
3,500
Jan-1
1
Feb
-11
Mar-
11
Apr-
11
May-
11
Jun-1
1
Jul-11
Aug-1
1
Sep-1
1
Oct-11
Nov-
11
Dec-
11
Jan-1
2
Feb
-12
Mar-
12
Apr-
12
May-
12
Jun-1
2
Jul-12
Aug-1
2
Sep-1
2
Oct-12
Nov-
12
Dec-
12
Jan-1
3
Feb
-13
Mar-
13
Apr-
13
May-
13
Jun-1
3
Jul-13
Aug-1
3
Sep-1
3
Oct-13
Nov-
13
Dec-
13
Domestic ('000) International ('000)
Istanbul Ataturk Airport Capacity Enhancements
Source: THY presentation
Please see the last page of this report for important disclosures.
28
February 11, 2014
Aviation
TURKISH AVIATION SECTOR
RESEARCH
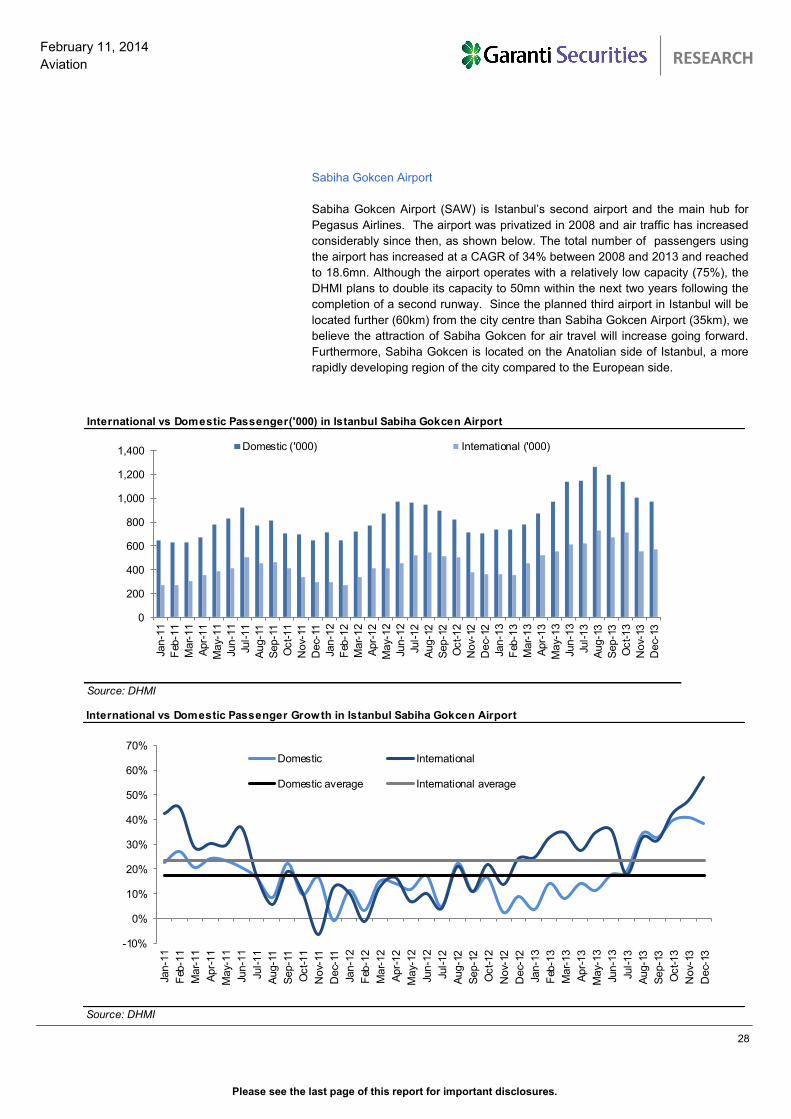
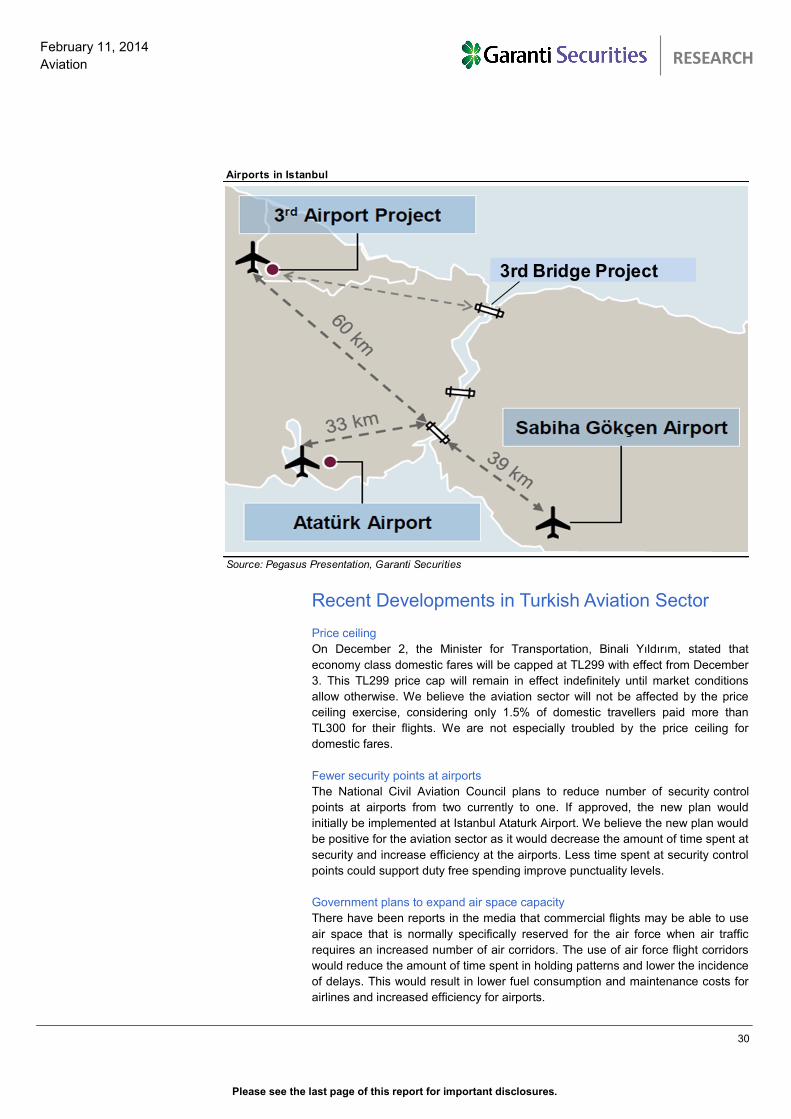
Sabiha Gokcen Airport
Sabiha Gokcen Airport (SAW) is Istanbul’s second airport and the main hub for
Pegasus Airlines. The airport was privatized in 2008 and air traffic has increased
considerably since then, as shown below. The total number of passengers using
the airport has increased at a CAGR of 34% between 2008 and 2013 and reached
to 18.6mn. Although the airport operates with a relatively low capacity (75%), the
DHMI plans to double its capacity to 50mn within the next two years following the
completion of a second runway. Since the planned third airport in Istanbul will be
located further (60km) from the city centre than Sabiha Gokcen Airport (35km), we
believe the attraction of Sabiha Gokcen for air travel will increase going forward.
Furthermore, Sabiha Gokcen is located on the Anatolian side of Istanbul, a more
rapidly developing region of the city compared to the European side.
Source: DHMI
International vs Domestic Passenger('000) in Istanbul Sabiha Gokcen Airport
0
200
400
600
800
1,000
1,200
1,400
Jan-1
1
Feb
-11
Mar-
11
Apr-
11
May-
11
Jun-1
1
Jul-11
Aug-1
1
Sep-1
1
Oct-11
Nov-
11
Dec-
11
Jan-1
2
Feb
-12
Mar-
12
Apr-
12
May-
12
Jun-1
2
Jul-12
Aug-1
2
Sep-1
2
Oct-12
Nov-
12
Dec-
12
Jan-1
3
Feb
-13
Mar-
13
Apr-
13
May-
13
Jun-1
3
Jul-13
Aug-1
3
Sep-1
3
Oct-13
Nov-
13
Dec-
13
Domestic ('000) International ('000)
Source: DHMI
International vs Domestic Passenger Growth in Istanbul Sabiha Gokcen Airport
-10%
0%
10%
20%
30%
40%
50%
60%
70%
Jan-1
1
Feb
-11
Mar-
11
Apr-
11
May-
11
Jun-1
1
Jul-11
Aug-1
1
Sep-1
1
Oct-11
Nov-
11
Dec-
11
Jan-1
2
Feb
-12
Mar-
12
Apr-
12
May-
12
Jun-1
2
Jul-12
Aug-1
2
Sep-1
2
Oct-12
Nov-
12
Dec-
12
Jan-1
3
Feb
-13
Mar-
13
Apr-
13
May-
13
Jun-1
3
Jul-13
Aug-1
3
Sep-1
3
Oct-13
Nov-
13
Dec-
13
Domestic International
Domestic average International average
Please see the last page of this report for important disclosures.
29
February 11, 2014
Aviation
TURKISH AVIATION SECTOR
RESEARCH
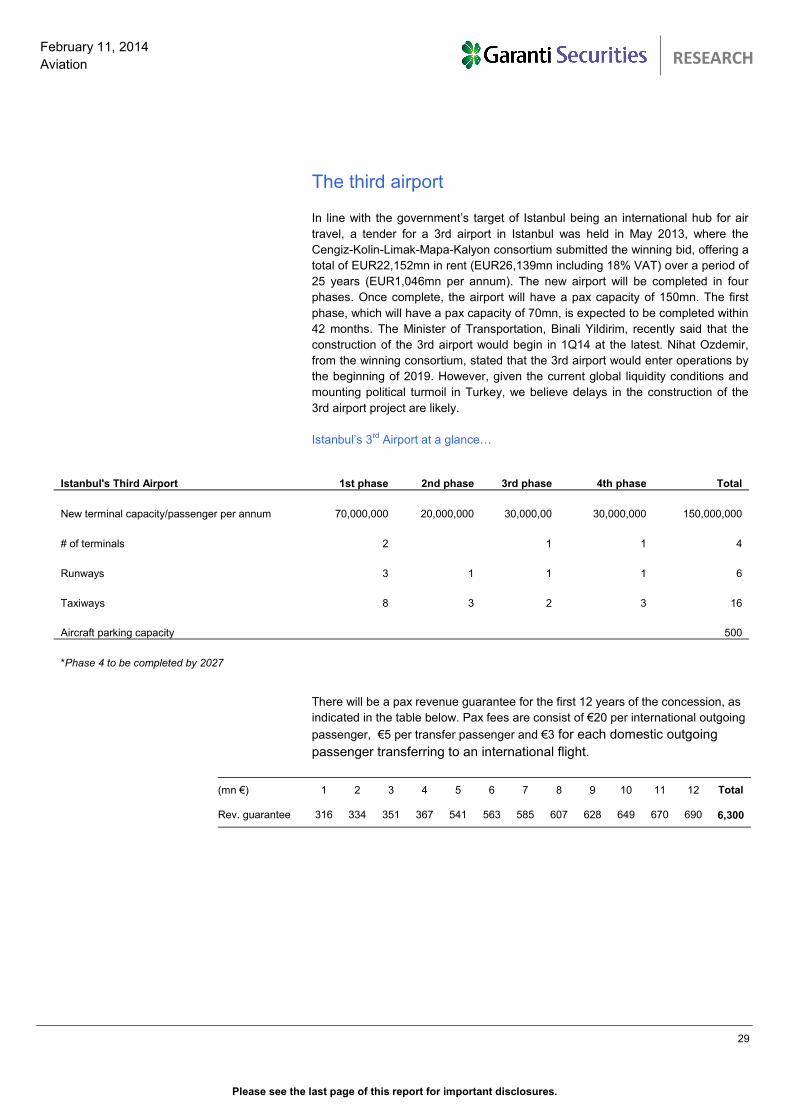
The third airport
In line with the government’s target of Istanbul being an international hub for air
travel, a tender for a 3rd airport in Istanbul was held in May 2013, where the
Cengiz-Kolin-Limak-Mapa-Kalyon consortium submitted the winning bid, offering a
total of EUR22,152mn in rent (EUR26,139mn including 18% VAT) over a period of
25 years (EUR1,046mn per annum). The new airport will be completed in four
phases. Once complete, the airport will have a pax capacity of 150mn. The first
phase, which will have a pax capacity of 70mn, is expected to be completed within
42 months. The Minister of Transportation, Binali Yildirim, recently said that the
construction of the 3rd airport would begin in 1Q14 at the latest. Nihat Ozdemir,
from the winning consortium, stated that the 3rd airport would enter operations by
the beginning of 2019. However, given the current global liquidity conditions and
mounting political turmoil in Turkey, we believe delays in the construction of the
3rd airport project are likely.
Istanbul’s 3rd Airport at a glance…
There will be a pax revenue guarantee for the first 12 years of the concession, as
indicated in the table below. Pax fees are consist of €20 per international outgoing
passenger, €5 per transfer passenger and €3 for each domestic outgoing
passenger transferring to an international flight.
Istanbul's Third Airport 1st phase 2nd phase 3rd phase 4th phase Total
New terminal capacity/passenger per annum 70,000,000 20,000,000 30,000,00 30,000,000 150,000,000
# of terminals 2 1 1 4
Runways 3 1 1 1 6
Taxiways 8 3 2 3 16
Aircraft parking capacity 500
*Phase 4 to be completed by 2027
(mn €) 1 2 3 4 5 6 7 8 9 10 11 12 Total
Rev. guarantee 316 334 351 367 541 563 585 607 628 649 670 690 6,300
Please see the last page of this report for important disclosures.
30
February 11, 2014
Aviation
TURKISH AVIATION SECTOR
RESEARCH
Recent Developments in Turkish Aviation Sector
Price ceiling
On December 2, the Minister for Transportation, Binali Yıldırım, stated that
economy class domestic fares will be capped at TL299 with effect from December
3. This TL299 price cap will remain in effect indefinitely until market conditions
allow otherwise. We believe the aviation sector will not be affected by the price
ceiling exercise, considering only 1.5% of domestic travellers paid more than
TL300 for their flights. We are not especially troubled by the price ceiling for
domestic fares.
Fewer security points at airports
The National Civil Aviation Council plans to reduce number of security control
points at airports from two currently to one. If approved, the new plan would
initially be implemented at Istanbul Ataturk Airport. We believe the new plan would
be positive for the aviation sector as it would decrease the amount of time spent at
security and increase efficiency at the airports. Less time spent at security control
points could support duty free spending improve punctuality levels.
Government plans to expand air space capacity
There have been reports in the media that commercial flights may be able to use
air space that is normally specifically reserved for the air force when air traffic
requires an increased number of air corridors. The use of air force flight corridors
would reduce the amount of time spent in holding patterns and lower the incidence
of delays. This would result in lower fuel consumption and maintenance costs for
airlines and increased efficiency for airports.
Airports in Istanbul
Source: Pegasus Presentation, Garanti Securities
3rd Bridge Project
Please see the last page of this report for important disclosures.
31
February 11, 2014
Aviation
TURKISH AVIATION SECTOR
RESEARCH
Airline Terminology
Revenue passengers: Revenue passengers represents the total number of paying
passengers flown on all flight segments.
Revenue passenger kilometers (RPK): Revenue passenger kilometers (RPK)
represents the numbers of kilometers flown by revenue passengers
Available seat kilometers (ASK): Available seat kilometers (ASK) represents the
aircraft seating capacity multiplied by the number of kilometers the seats are
flown.
Load factor: Load factor represents the percentage of aircraft seating capacity that
is actually utilized (calculated by dividing RPK by ASK).
Breakeven load factor: Breakeven load factor is the passenger load factor that will
result in passenger revenues being equal to operating expenses.
Aircraft utilization: Aircraft utilization represents the average number of block hours
operated per day per aircraft for the total aircraft fleet.
Block hours: Block hours refers to the elapsed time between an aircraft leaving an
airport gate and arriving at an airport gate.
Yield per passenger kilometer: Yield per passenger kilometer represents the
average amount one passenger pays to fly one kilometer.
Passenger revenue per available seat kilometer: Passenger revenue per available
seat kilometer represents passenger revenue divided by available seat kilometers.
Operating revenue per available seat kilometer (RASK): Operating revenue per
available seat kilometer (RASK) represents operating revenues divided by
available seat kilometers.
Average stage length: Average stage length represents the average number of
kilometers flown per flight.
Operating expense per available seat kilometer (CASK): Operating expense per
available seat kilometer (CASK) represents operating expenses divided by
available seat kilometers.
Wet Lease Arrangement: A wet lease is a leasing arrangement whereby one
airline (lessor) provides an aircraft, complete crew, maintenance, and insurance,
to another airline (lessee), who pays by hours operated. The lessee provides fuel,
covers airport fees, and any other duties, taxes, etc. The flight uses the flight
number of the lessee. A wet lease generally lasts one month to two years,
anything less would be considered an ad-hoc charter. A wet lease is typically
utilized during peak traffic seasons or annual heavy maintenance checks, or to
initiate new routes. Ground handling is usually done by the lessor although this
can vary from country to country. In some cases the lessee provides these
services (or one of its partners).
Please see the last page of this report for important disclosures.
RESEARCH
February 11, 2014
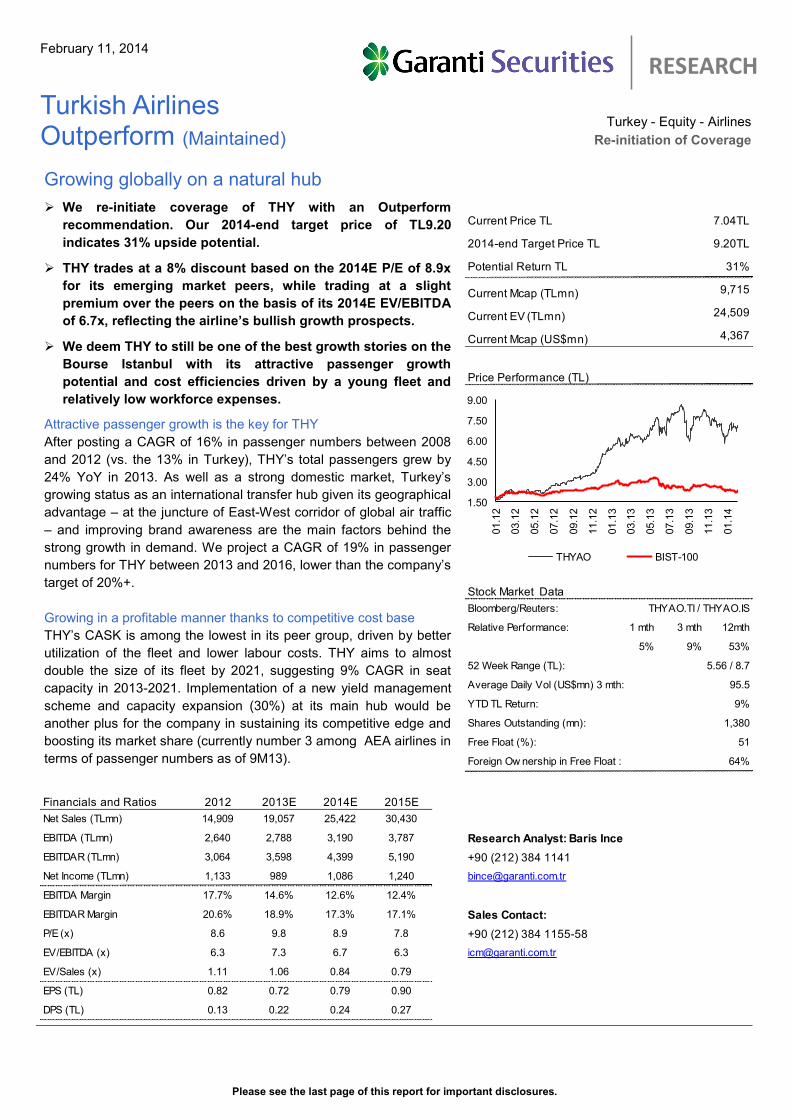
Turkish Airlines Outperform (Maintained)
Current Price TL 7.04TL
2014-end Target Price TL 9.20TL
Potential Return TL 31%
Current Mcap (TLmn) 9,715
Current EV (TLmn) 24,509
4,367
Bloomberg/Reuters:
1 mth 3 mth 12mth
5% 9% 53%
95.5
YTD TL Return: 9%
1,380
Free Float (%): 51
64%
Financials and Ratios 2012 2013E 2014E 2015E
Net Sales (TLmn) 14,909 19,057 25,422 30,430
EBITDA (TLmn) 2,640 2,788 3,190 3,787 Research Analyst: Baris Ince
EBITDAR (TLmn) 3,064 3,598 4,399 5,190 +90 (212) 384 1141
Net Income (TLmn) 1,133 989 1,086 1,240 [email protected]
EBITDA Margin 17.7% 14.6% 12.6% 12.4%
EBITDAR Margin 20.6% 18.9% 17.3% 17.1% Sales Contact:
P/E (x) 8.6 9.8 8.9 7.8 +90 (212) 384 1155-58
EV/EBITDA (x) 6.3 7.3 6.7 6.3 [email protected]
EV/Sales (x) 1.11 1.06 0.84 0.79
EPS (TL) 0.82 0.72 0.79 0.90
DPS (TL) 0.13 0.22 0.24 0.27
Current Mcap (US$mn)
Price Performance (TL)
Stock Market Data
THYAO.TI / THYAO.IS
Relative Performance:
52 Week Range (TL): 5.56 / 8.7
Average Daily Vol (US$mn) 3 mth:
Shares Outstanding (mn):
Foreign Ow nership in Free Float :
1.50
3.00
4.50
6.00
7.50
9.00
01.1
2
03.1
2
05.1
2
07.1
2
09.1
2
11.1
2
01.1
3
03.1
3
05.1
3
07.1
3
09.1
3
11.1
3
01.1
4
THYAO BIST-100
Growing globally on a natural hub
We re-initiate coverage of THY with an Outperform
recommendation. Our 2014-end target price of TL9.20
indicates 31% upside potential.
THY trades at a 8% discount based on the 2014E P/E of 8.9x
for its emerging market peers, while trading at a slight
premium over the peers on the basis of its 2014E EV/EBITDA
of 6.7x, reflecting the airline’s bullish growth prospects.
We deem THY to still be one of the best growth stories on the
Bourse Istanbul with its attractive passenger growth
potential and cost efficiencies driven by a young fleet and
relatively low workforce expenses.
Attractive passenger growth is the key for THY
After posting a CAGR of 16% in passenger numbers between 2008
and 2012 (vs. the 13% in Turkey), THY’s total passengers grew by
24% YoY in 2013. As well as a strong domestic market, Turkey’s
growing status as an international transfer hub given its geographical
advantage – at the juncture of East-West corridor of global air traffic
– and improving brand awareness are the main factors behind the
strong growth in demand. We project a CAGR of 19% in passenger
numbers for THY between 2013 and 2016, lower than the company’s
target of 20%+.
Growing in a profitable manner thanks to competitive cost base
THY’s CASK is among the lowest in its peer group, driven by better
utilization of the fleet and lower labour costs. THY aims to almost
double the size of its fleet by 2021, suggesting 9% CAGR in seat
capacity in 2013-2021. Implementation of a new yield management
scheme and capacity expansion (30%) at its main hub would be
another plus for the company in sustaining its competitive edge and
boosting its market share (currently number 3 among AEA airlines in
terms of passenger numbers as of 9M13).
Turkey - Equity - Airlines
Re-initiation of Coverage
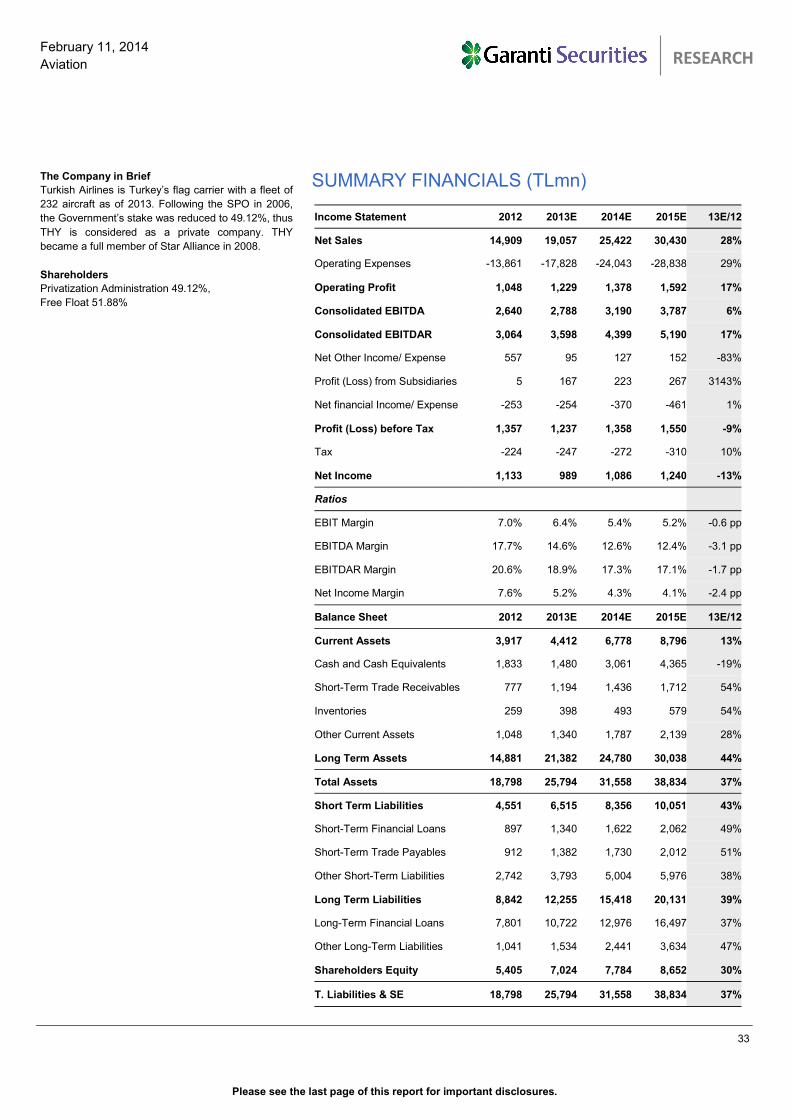
Please see the last page of this report for important disclosures.
33
February 11, 2014
Aviation
TURKISH AVIATION SECTOR
RESEARCH
SUMMARY FINANCIALS (TLmn) The Company in Brief
Turkish Airlines is Turkey’s flag carrier with a fleet of
232 aircraft as of 2013. Following the SPO in 2006,
the Government’s stake was reduced to 49.12%, thus
THY is considered as a private company. THY
became a full member of Star Alliance in 2008.
Shareholders
Privatization Administration 49.12%,
Free Float 51.88%
Income Statement 2012 2013E 2014E 2015E 13E/12
Net Sales 14,909 19,057 25,422 30,430 28%
Operating Expenses -13,861 -17,828 -24,043 -28,838 29%
Operating Profit 1,048 1,229 1,378 1,592 17%
Consolidated EBITDA 2,640 2,788 3,190 3,787 6%
Consolidated EBITDAR 3,064 3,598 4,399 5,190 17%
Net Other Income/ Expense 557 95 127 152 -83%
Profit (Loss) from Subsidiaries 5 167 223 267 3143%
Net financial Income/ Expense -253 -254 -370 -461 1%
Profit (Loss) before Tax 1,357 1,237 1,358 1,550 -9%
Tax -224 -247 -272 -310 10%
Net Income 1,133 989 1,086 1,240 -13%
Ratios
EBIT Margin 7.0% 6.4% 5.4% 5.2% -0.6 pp
EBITDA Margin 17.7% 14.6% 12.6% 12.4% -3.1 pp
EBITDAR Margin 20.6% 18.9% 17.3% 17.1% -1.7 pp
Net Income Margin 7.6% 5.2% 4.3% 4.1% -2.4 pp
Balance Sheet 2012 2013E 2014E 2015E 13E/12
Current Assets 3,917 4,412 6,778 8,796 13%
Cash and Cash Equivalents 1,833 1,480 3,061 4,365 -19%
Short-Term Trade Receivables 777 1,194 1,436 1,712 54%
Inventories 259 398 493 579 54%
Other Current Assets 1,048 1,340 1,787 2,139 28%
Long Term Assets 14,881 21,382 24,780 30,038 44%
Total Assets 18,798 25,794 31,558 38,834 37%
Short Term Liabilities 4,551 6,515 8,356 10,051 43%
Short-Term Financial Loans 897 1,340 1,622 2,062 49%
Short-Term Trade Payables 912 1,382 1,730 2,012 51%
Other Short-Term Liabilities 2,742 3,793 5,004 5,976 38%
Long Term Liabilities 8,842 12,255 15,418 20,131 39%
Long-Term Financial Loans 7,801 10,722 12,976 16,497 37%
Other Long-Term Liabilities 1,041 1,534 2,441 3,634 47%
Shareholders Equity 5,405 7,024 7,784 8,652 30%
T. Liabilities & SE 18,798 25,794 31,558 38,834 37%
Please see the last page of this report for important disclosures.
34
February 11, 2014
Aviation
TURKISH AVIATION SECTOR
RESEARCH
Investment Positives
A growing focus on the international market
THY has been one of the world’s fastest growing full service carriers in last
decade. THY operates an effective network and implements marketing strategies
aimed at increasing profitability in parallel with its growth. The airline is expanding
its network by adding new destinations, having become renowned worldwide for
its expansion strategy. THY’s current growth strategy has mainly hinged on
increasing its presence in medium to long haul routes since 2010. In terns of
number of destinations, medium and long-haul routes accounted for 45% of all
routes in 2013, compared to 35% in 2009. The airline’s main focus is to increase
the share of transit passengers in total pax carried to 50%+ from current 23%
compared to around 50% for Lufthansa. In parallel with this strategy, THY’s
domestic revenues accounted for 14% of its total in 9M13, compared to the 21%
in 2008.
Istanbul is the key for growth
Istanbul, being a transfer point on Europe- Middle East, Europe-Far East and
Asia, Europe-Africa, and America-Middle East lines, reduces flight time and
introduces the flexibility to use a variety of fleets of diverse capacity. Thanks to its
geographical position, Istanbul offers more convenient connections when
compared with other potential transfer points. Istanbul serves as a geographical
bridge between East and West, enabling the use of a narrow body fleet, thus
providing considerable cost advantages and contributing to competitive
superiority. In 9M13, a total of 8.5mn international passengers arrived from
various points on THY flights and transferred through Istanbul to fly to another
international destination. Notably, this number was 29% YoY higher when
compared to 9M12.
Revenue maximization/cost minimization efforts have gained importance
We believe the company’s strategy of opening new routes and increasing market
share in international markets will continue to put pressure on revenue yields until
2017. We observed a 6% decline in revenue yields in USD terms in 9M13 after
the 4.6% fall in 2012. According to our assumptions, revenue yields will drop by
1.2% per annum over the 2013-2016 period, vs. the 4.7% between 2008-2012. It
is worth highlighting that the management started to implement new yield
management software from the beginning of 2013. The new system uses an origin
-destination formula (O&D) rather than a point-to-point formula. As THY’s flight
network expands, a new revenue management system will be required to value
each seat on the network more precisely. The new system, O&D based revenue
management, maximizes the total revenue of the network by using sophisticated
demand forecasting and flight optimization tools, developed by the leading vendor
in the industry. Accordingly, the system displays the availability for each O&D pair
separately, resulting in the overall maximum gain. The CEO of THY stated that
2013 would be a calibration period for the new software and that yields would tend
to increase once transition was completed later this year. Therefore, we believe
the airline will more focus on unit cost minimization as observed in recent years
but which had been interrupted in 9M13 due to the one-off increase in
maintenance and personnel costs. We are not assuming a major change in unit
costs in 2013 after the 4.9% decline in 2012. Our projections suggest that unit
costs will register a 1.1% decline between 2013-2016 compared to the 2.7%
Please see the last page of this report for important disclosures.
35
February 11, 2014
Aviation
TURKISH AVIATION SECTOR
RESEARCH
decline in 2008-2012, driven by a younger fleet, a more efficient workforce and the
delivery of wide body airliners.
Fleet to almost double by 2021
The company aims to nearly double the size of its fleet from 233 aircraft in 2013 to
436 aircraft by 2021. The total order stood at 265 aircraft as of 2013, of which 212
were firm orders and the remainder optional. The airline would record a 9% seat
capacity increase per annum between 2013-2021. In March 2013, THY had
placed a massive order for 117 narrow-body aircraft from Airbus, of which 82 were
firm orders and 35 optional, with the aircraft to be received between 2015-2020.
THY then placed another substantial order in April, this time for Boeing aircraft, for
95 narrow-body planes (70 firm and 25 optional) to enter the fleet between 2016
and 2021. A young and narrow-body denominated fleet would help THY to sustain
its competitive edges compared to both European and Gulf carriers.
Increasing brand awareness
The airline has undertaken a number of important projects to further develop its
global brand image. In addition to effective and successful campaigns in the social
media, the airline has invested heavily in its brand through a variety of platforms
including sponsorship agreements and global advertising. In recent years, THY
has made extensive use of the most popular communication channels in
disseminating corporate news in the fastest possible manner, to better
communicate with its passengers and become a part of their daily lives. THY’s
continuing investment in increasing quality and improving its branding has
recently won recognition by international aviation ranking organizations. THY has
been selected as Europe’s best airline by Skytrax for the last three years in a row
(2011, 2012 and in 2013).
Inorganic growth
THY has always been in search of inorganic growth opportunities, as indicated by
its previous attempts to acquire the Polish LOT and Portuguese TAP. However,
THY abandoned its attempts to acquire LOT due to EU regulations. The chairman
of THY, Mr. Hamdi Topcu was recently quoted as saying that THY was working on
an acquisition in Africa. An acquisition in a growing African market would likely be
perceived positively by investors, in our view, depending on price.
Strike concerns are over
THY reached an agreement with the new management of labour union, Hava-Is,
on pay for 2013-2015, officially ending the prolonged strike. Accordingly, pay will
be raised by 8.1% cumulatively in 2013 (backdated), 6.1% cumulatively in 2014
and 6.1% cumulatively in 2015. Importantly, THY agreed on a gross one-off
payment of TL5,500 to each unionized member of staff, subject to proportionate
days of worked during 2013 for each relevant member of staff. At the end of
9M13, THY had 22,971 personnel on its payroll, most of which were unionized.
The one-off payment could result in an additional expense of around TL100mn,
which we would not find worrisome. Occasional threats of strike action have long
been an issue affecting the share price.
2014 budget guidance implies strong top line, but cautious cost side
According to THY‘s 2014 budget guidance, the management of THY aims to
generate US$11.4bn in revenues (GS estimate: US$11.7bn). The company
anticipates a total pax number of 59.5mn, implying 23% YoY growth vs. our own
forecast of 19%. Total pax numbers are expected to be driven by domestic growth
Please see the last page of this report for important disclosures.
36
February 11, 2014
Aviation
TURKISH AVIATION SECTOR
RESEARCH
(30% YoY expected) in 2014 more than by international growth (15% expected).
THY aims to boost its ASK by 21% to 141bn in line with our forecast of 20%
growth. Regarding the load factor, the airline is assuming a 78.8% load factor (GS
estimate : 79.0% vs. the 79.0% in 2013). As far as yields are concerned, THY
expects a 2% decline in domestic (TL) yields, but a 1% increase in international
(EUR) yields. We believe that achieving a 1% increase international yields could
present a challenge to the airline given the observed yield contraction in recent
quarters. However, we find the airline more cautious on the cost side, expecting a
2% increase in its CASK ex-fuel (USD) in 2014. We appear to be more optimistic
on the cost side; we do not have any information on what exchange rates were
budgeted by THY in 2014 but we believe that exchange rates assumptions would
be the reason behind this divergence. (see details on page 41)
An attractive valuation
Our 2014-end target share price of TL9.20, derived from target EV/ EBITDAR
multiple, offers 31% upside for THY. Our valuation for THY is based on the 2014E
target EV/EBITDAR multiple. To reach our target Mcap, we adjusted net debt for
8x aircraft related rental expenses and current PDP receivables. We employed a
6.3x target multiple for THY, which is inline with its 5-year average EV/EBITDAR
multiple. THY trades at a discount of 8% to its peers on the basis of its 2014E P/E,
but 14% premium based on its EV/EBITDA which is justified with THY’s strong
prospects, in our view, based on our forecasts.
Investments Negatives
High sensitivity to oil prices and FX rates
THY’s major cost item is fuel, which accounts for around 37% of overall COGS,
followed by staff costs (18%). The company has a strategy of passing 50% of fuel
price increases to customers through the fuel surcharge, while hedging 50% of its
fuel expenses; we did not factor in the potentially positive effect of the fuel
surcharge and hedging in our assumptions. Considering its lower hedging ratio
when compared to the 60% levels of its European peers, THY’s margins - and our
valuation – are highly sensitive to movements in fuel prices. Due to the currency
mismatch in THY’s operations (FX denominated costs account for 74% of THY’s
total costs, while FX denominated revenues account for 86% of revenues), the TL
weakness effectively serves to support THY’s profitability.
Deterioration in demand and higher than expected contraction in yields
THY’s expansion and its fleet plans are based on increasing demand; hence lower
than expected demand in any of the markets where THY operates in represents a
key risk for the company. The airline industry is highly volatile and exposed to a
number of risks, including macro conditions, geopolitical tensions in the region
and natural disasters. Other than that, the opening of new routes and increased
capacity coupled with stiff competition on its routes would result in a steeper than
expected contraction in yields.
Please see the last page of this report for important disclosures.
37
February 11, 2014
Aviation
TURKISH AVIATION SECTOR
RESEARCH
Capacity constraints at Istanbul Ataturk Airport (IAA) – THY’s main hub
IAA served 51mn passengers in 2013, not far short of its capacity of 60-65mn.
However, the capacity constraint is less of concern now as the government plans
to increase capacity at the airport by 30% with some new measures. Through
such capacity enhancements, the company will seek to handle operations at the
airport properly until the 3rd Airport enters operation. Recall that the Minister of
Transportation, Binali Yildirim, said that the construction of a 3rd airport would
begin by 1Q14 at the latest, and that the President of Limak Holding, Nihat
Ozdemir, stated that the 3rd airport would enter operation by the beginning of
2019. Given the current global liquidity concerns and political turmoil in Turkey, we
would not expect the delays in the completion of Istanbul’s new airport to hurt
THY’s operations. Alternatively, THY also has a presence at Istanbul Sabiha
Gokcen Airports (SAW) which currently has a pax capacity of 25mn. As of 9M13
the airline operated 14 aircrafts from the airport serving 30 destinations (19
domestic and 11 international). It carried 2.6mn passengers (+100% YoY) in 9M13
with 77% load factor. The airline plans to appoint 24 aircraft to SAW and to fly to
36 destinations (9 domestic and 27 international) in 2014. After the completion of
a second runway at the airport, SAW’s capacity will reach to 50mn pax.
Pegasus’ legal action at the Competition Board
There is an ongoing investigation into THY after Pegasus filed a complaint to the
Competition Board. This is a long running dispute related to the question of
whether THY abused its dominant position in domestic and international flights
from Istanbul and blocked others seeking to penetrate the market. The
Competition Board had earlier ruled against THY, but the decision was later
overruled in court, whereupon the Competition Board re-opened the investigation.
As far as we know, there are currently no further developments. A negative
outcome related to the investigation would cause share price weakness for THY.
A potential SPO
The Privatization Authority holds a 49.12% stake in THY and announced back in
December 2010 that it would evaluate advisory/consultancy services for a further
stake sale in THY. Therefore, a potential secondary offering could create
overhang on the shares.
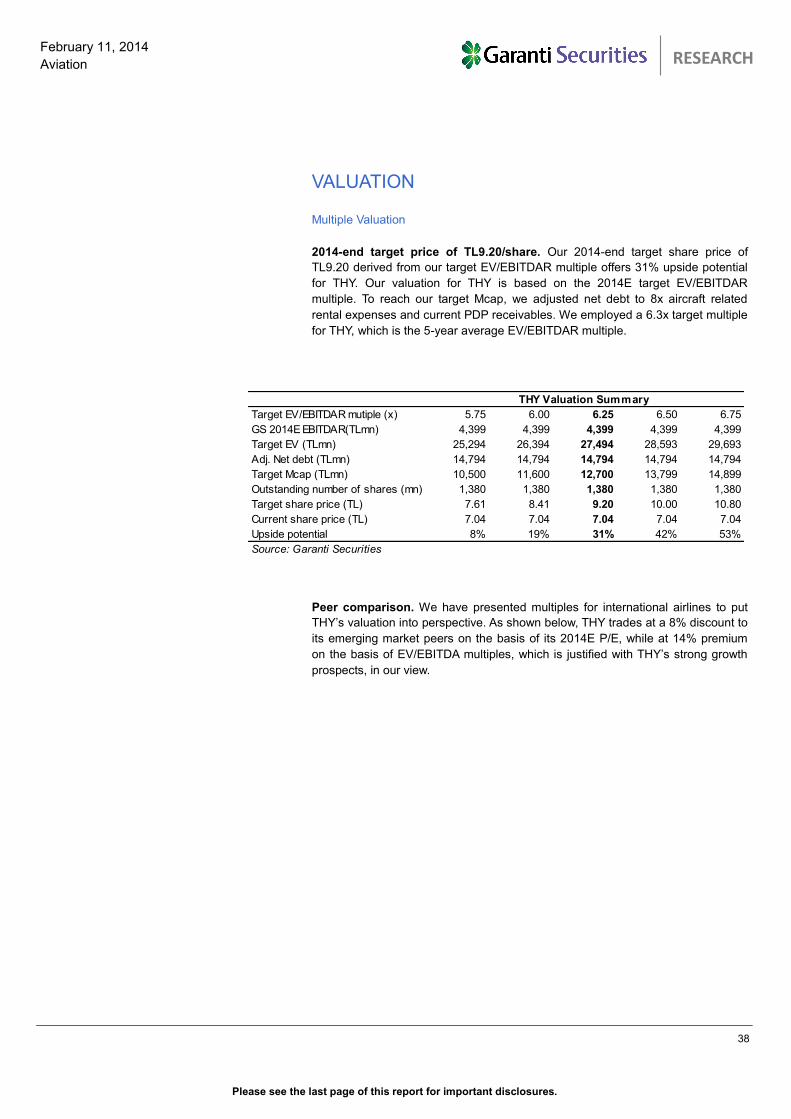
Please see the last page of this report for important disclosures.
38
February 11, 2014
Aviation
TURKISH AVIATION SECTOR
RESEARCH
VALUATION
Multiple Valuation
2014-end target price of TL9.20/share. Our 2014-end target share price of
TL9.20 derived from our target EV/EBITDAR multiple offers 31% upside potential
for THY. Our valuation for THY is based on the 2014E target EV/EBITDAR
multiple. To reach our target Mcap, we adjusted net debt to 8x aircraft related
rental expenses and current PDP receivables. We employed a 6.3x target multiple
for THY, which is the 5-year average EV/EBITDAR multiple.
Peer comparison. We have presented multiples for international airlines to put
THY’s valuation into perspective. As shown below, THY trades at a 8% discount to
its emerging market peers on the basis of its 2014E P/E, while at 14% premium
on the basis of EV/EBITDA multiples, which is justified with THY’s strong growth
prospects, in our view.
Target EV/EBITDAR mutiple (x) 5.75 6.00 6.25 6.50 6.75
GS 2014E EBITDAR(TLmn) 4,399 4,399 4,399 4,399 4,399
Target EV (TLmn) 25,294 26,394 27,494 28,593 29,693
Adj. Net debt (TLmn) 14,794 14,794 14,794 14,794 14,794
Target Mcap (TLmn) 10,500 11,600 12,700 13,799 14,899
Outstanding number of shares (mn) 1,380 1,380 1,380 1,380 1,380
Target share price (TL) 7.61 8.41 9.20 10.00 10.80
Current share price (TL) 7.04 7.04 7.04 7.04 7.04
Upside potential 8% 19% 31% 42% 53%
Source: Garanti Securities
THY Valuation Summary
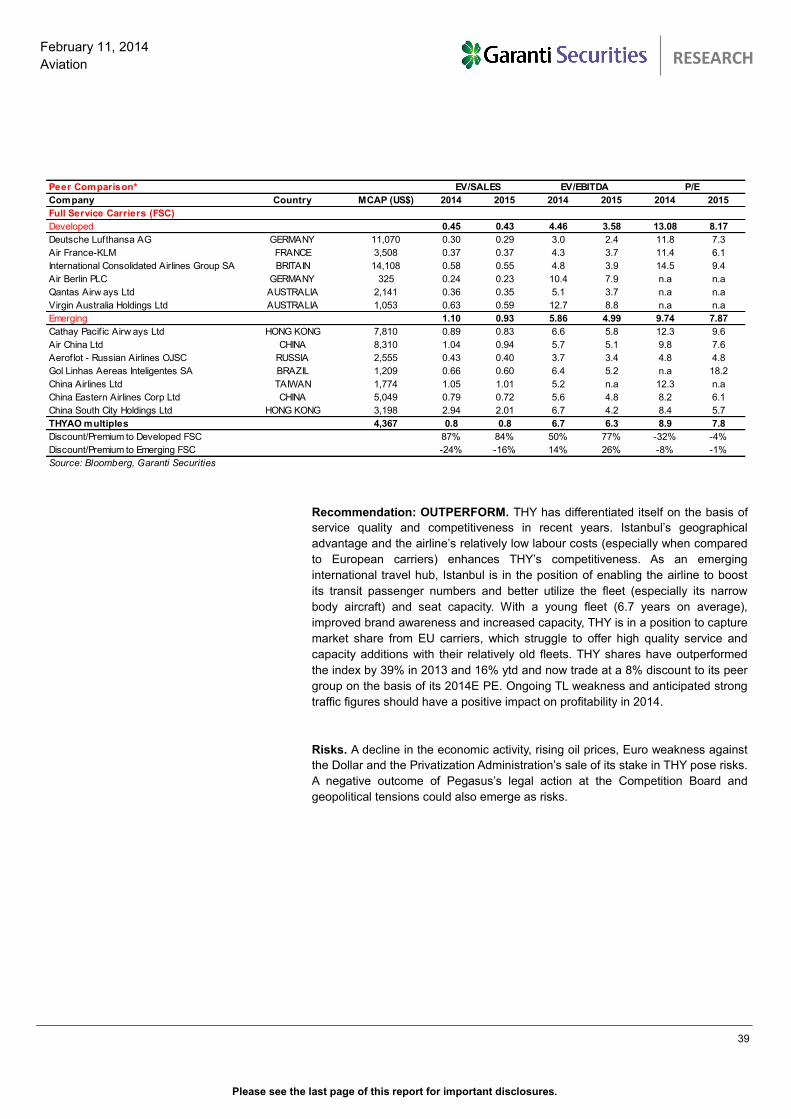
Please see the last page of this report for important disclosures.
39
February 11, 2014
Aviation
TURKISH AVIATION SECTOR
RESEARCH
Recommendation: OUTPERFORM. THY has differentiated itself on the basis of
service quality and competitiveness in recent years. Istanbul’s geographical
advantage and the airline’s relatively low labour costs (especially when compared
to European carriers) enhances THY’s competitiveness. As an emerging
international travel hub, Istanbul is in the position of enabling the airline to boost
its transit passenger numbers and better utilize the fleet (especially its narrow
body aircraft) and seat capacity. With a young fleet (6.7 years on average),
improved brand awareness and increased capacity, THY is in a position to capture
market share from EU carriers, which struggle to offer high quality service and
capacity additions with their relatively old fleets. THY shares have outperformed
the index by 39% in 2013 and 16% ytd and now trade at a 8% discount to its peer
group on the basis of its 2014E PE. Ongoing TL weakness and anticipated strong
traffic figures should have a positive impact on profitability in 2014.
Risks. A decline in the economic activity, rising oil prices, Euro weakness against
the Dollar and the Privatization Administration’s sale of its stake in THY pose risks.
A negative outcome of Pegasus’s legal action at the Competition Board and
geopolitical tensions could also emerge as risks.
Peer Comparison*
Company Country MCAP (US$) 2014 2015 2014 2015 2014 2015
Full Service Carriers (FSC)
Developed 0.45 0.43 4.46 3.58 13.08 8.17
Deutsche Lufthansa AG GERMANY 11,070 0.30 0.29 3.0 2.4 11.8 7.3
Air France-KLM FRANCE 3,508 0.37 0.37 4.3 3.7 11.4 6.1
International Consolidated Airlines Group SA BRITAIN 14,108 0.58 0.55 4.8 3.9 14.5 9.4
Air Berlin PLC GERMANY 325 0.24 0.23 10.4 7.9 n.a n.a
Qantas Airw ays Ltd AUSTRALIA 2,141 0.36 0.35 5.1 3.7 n.a n.a
Virgin Australia Holdings Ltd AUSTRALIA 1,053 0.63 0.59 12.7 8.8 n.a n.a
Emerging 1.10 0.93 5.86 4.99 9.74 7.87
Cathay Pacif ic Airw ays Ltd HONG KONG 7,810 0.89 0.83 6.6 5.8 12.3 9.6
Air China Ltd CHINA 8,310 1.04 0.94 5.7 5.1 9.8 7.6
Aeroflot - Russian Airlines OJSC RUSSIA 2,555 0.43 0.40 3.7 3.4 4.8 4.8
Gol Linhas Aereas Inteligentes SA BRAZIL 1,209 0.66 0.60 6.4 5.2 n.a 18.2
China Airlines Ltd TAIWAN 1,774 1.05 1.01 5.2 n.a 12.3 n.a
China Eastern Airlines Corp Ltd CHINA 5,049 0.79 0.72 5.6 4.8 8.2 6.1
China South City Holdings Ltd HONG KONG 3,198 2.94 2.01 6.7 4.2 8.4 5.7
THYAO multiples 4,367 0.8 0.8 6.7 6.3 8.9 7.8
Discount/Premium to Developed FSC 87% 84% 50% 77% -32% -4%
Discount/Premium to Emerging FSC -24% -16% 14% 26% -8% -1%
Source: Bloomberg, Garanti Securities
EV/SALES EV/EBITDA P/E
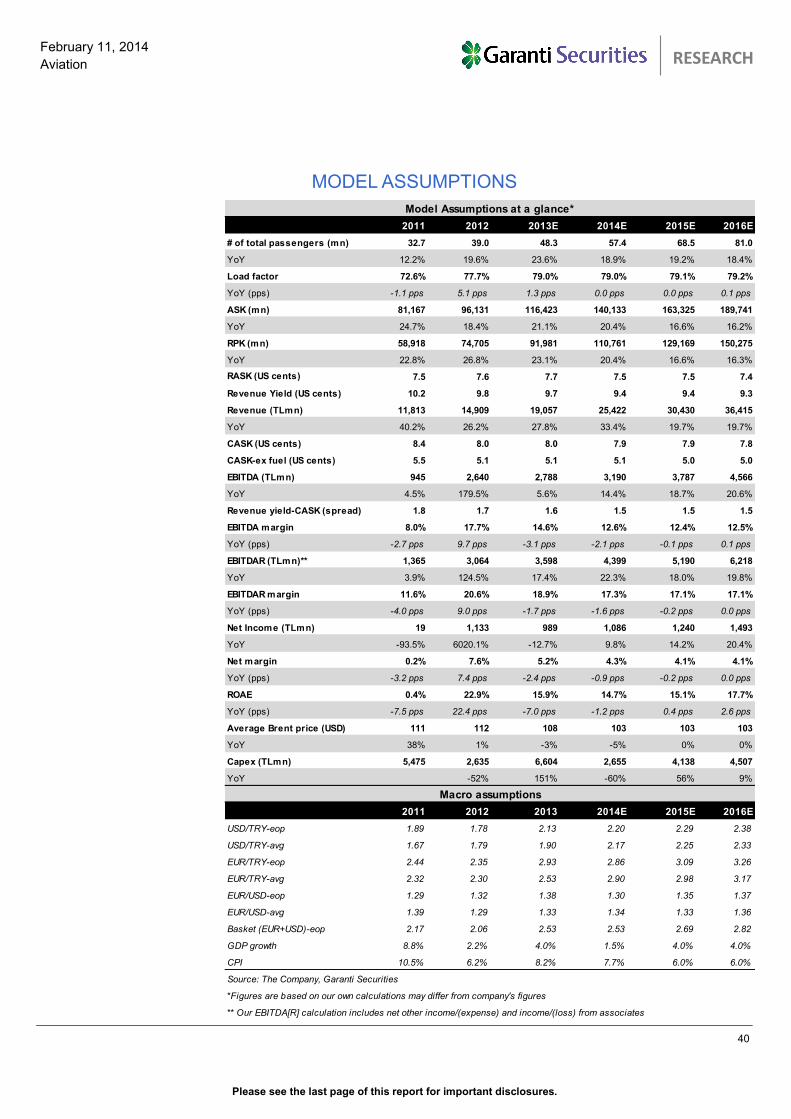
Please see the last page of this report for important disclosures.
40
February 11, 2014
Aviation
TURKISH AVIATION SECTOR
RESEARCH
MODEL ASSUMPTIONS
2011 2012 2013E 2014E 2015E 2016E
# of total passengers (mn) 32.7 39.0 48.3 57.4 68.5 81.0
YoY 12.2% 19.6% 23.6% 18.9% 19.2% 18.4%
Load factor 72.6% 77.7% 79.0% 79.0% 79.1% 79.2%
YoY (pps) -1.1 pps 5.1 pps 1.3 pps 0.0 pps 0.0 pps 0.1 pps
ASK (mn) 81,167 96,131 116,423 140,133 163,325 189,741
YoY 24.7% 18.4% 21.1% 20.4% 16.6% 16.2%
RPK (mn) 58,918 74,705 91,981 110,761 129,169 150,275
YoY 22.8% 26.8% 23.1% 20.4% 16.6% 16.3%
RASK (US cents) 7.5 7.6 7.7 7.5 7.5 7.4
Revenue Yield (US cents) 10.2 9.8 9.7 9.4 9.4 9.3
Revenue (TLmn) 11,813 14,909 19,057 25,422 30,430 36,415
YoY 40.2% 26.2% 27.8% 33.4% 19.7% 19.7%
CASK (US cents) 8.4 8.0 8.0 7.9 7.9 7.8
CASK-ex fuel (US cents) 5.5 5.1 5.1 5.1 5.0 5.0
EBITDA (TLmn) 945 2,640 2,788 3,190 3,787 4,566
YoY 4.5% 179.5% 5.6% 14.4% 18.7% 20.6%
Revenue yield-CASK (spread) 1.8 1.7 1.6 1.5 1.5 1.5
EBITDA margin 8.0% 17.7% 14.6% 12.6% 12.4% 12.5%
YoY (pps) -2.7 pps 9.7 pps -3.1 pps -2.1 pps -0.1 pps 0.1 pps
EBITDAR (TLmn)** 1,365 3,064 3,598 4,399 5,190 6,218
YoY 3.9% 124.5% 17.4% 22.3% 18.0% 19.8%
EBITDAR margin 11.6% 20.6% 18.9% 17.3% 17.1% 17.1%
YoY (pps) -4.0 pps 9.0 pps -1.7 pps -1.6 pps -0.2 pps 0.0 pps
Net Income (TLmn) 19 1,133 989 1,086 1,240 1,493
YoY -93.5% 6020.1% -12.7% 9.8% 14.2% 20.4%
Net margin 0.2% 7.6% 5.2% 4.3% 4.1% 4.1%
YoY (pps) -3.2 pps 7.4 pps -2.4 pps -0.9 pps -0.2 pps 0.0 pps
ROAE 0.4% 22.9% 15.9% 14.7% 15.1% 17.7%
YoY (pps) -7.5 pps 22.4 pps -7.0 pps -1.2 pps 0.4 pps 2.6 pps
Average Brent price (USD) 111 112 108 103 103 103
YoY 38% 1% -3% -5% 0% 0%
Capex (TLmn) 5,475 2,635 6,604 2,655 4,138 4,507
YoY -52% 151% -60% 56% 9%
2011 2012 2013 2014E 2015E 2016E
USD/TRY-eop 1.89 1.78 2.13 2.20 2.29 2.38
USD/TRY-avg 1.67 1.79 1.90 2.17 2.25 2.33
EUR/TRY-eop 2.44 2.35 2.93 2.86 3.09 3.26
EUR/TRY-avg 2.32 2.30 2.53 2.90 2.98 3.17
EUR/USD-eop 1.29 1.32 1.38 1.30 1.35 1.37
EUR/USD-avg 1.39 1.29 1.33 1.34 1.33 1.36
Basket (EUR+USD)-eop 2.17 2.06 2.53 2.53 2.69 2.82
GDP growth 8.8% 2.2% 4.0% 1.5% 4.0% 4.0%
CPI 10.5% 6.2% 8.2% 7.7% 6.0% 6.0%
Source: The Company, Garanti Securities
*Figures are based on our own calculations may differ from company's figures
** Our EBITDA[R] calculation includes net other income/(expense) and income/(loss) from associates
Model Assumptions at a glance*
Macro assumptions
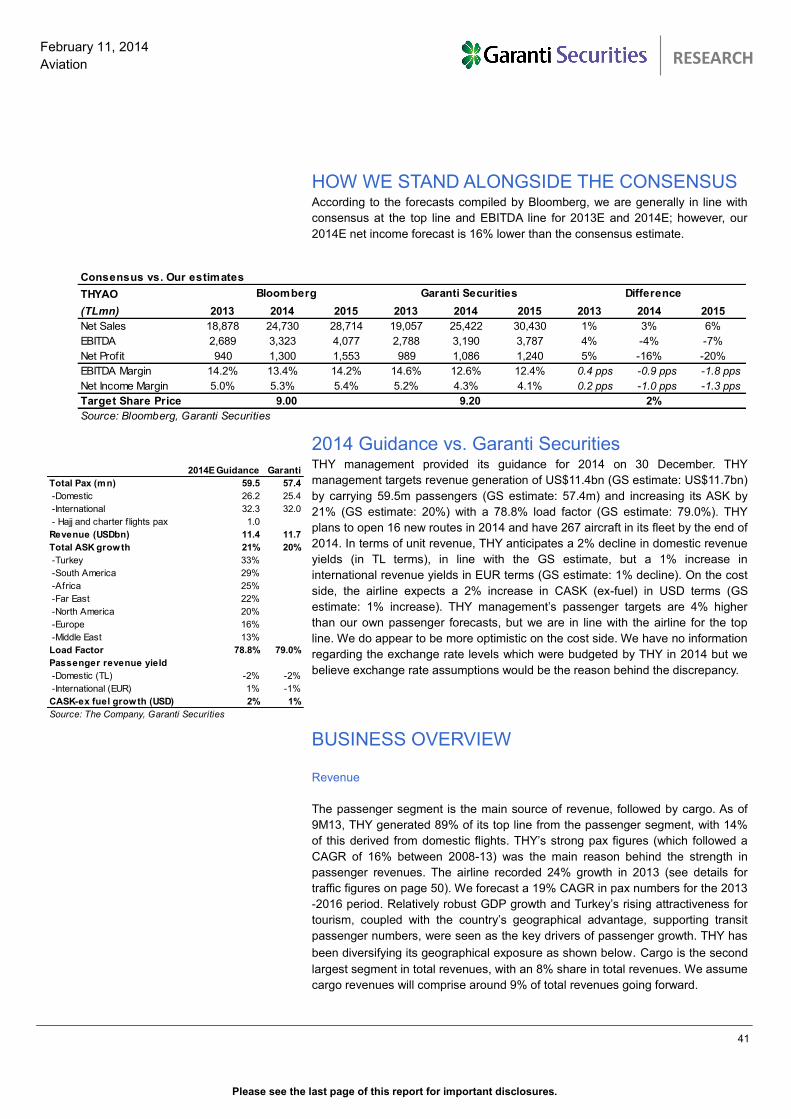
Please see the last page of this report for important disclosures.
41
February 11, 2014
Aviation
TURKISH AVIATION SECTOR
RESEARCH
HOW WE STAND ALONGSIDE THE CONSENSUS According to the forecasts compiled by Bloomberg, we are generally in line with
consensus at the top line and EBITDA line for 2013E and 2014E; however, our
2014E net income forecast is 16% lower than the consensus estimate.
2014 Guidance vs. Garanti Securities THY management provided its guidance for 2014 on 30 December. THY
management targets revenue generation of US$11.4bn (GS estimate: US$11.7bn)
by carrying 59.5m passengers (GS estimate: 57.4m) and increasing its ASK by
21% (GS estimate: 20%) with a 78.8% load factor (GS estimate: 79.0%). THY
plans to open 16 new routes in 2014 and have 267 aircraft in its fleet by the end of
2014. In terms of unit revenue, THY anticipates a 2% decline in domestic revenue
yields (in TL terms), in line with the GS estimate, but a 1% increase in
international revenue yields in EUR terms (GS estimate: 1% decline). On the cost
side, the airline expects a 2% increase in CASK (ex-fuel) in USD terms (GS
estimate: 1% increase). THY management’s passenger targets are 4% higher
than our own passenger forecasts, but we are in line with the airline for the top
line. We do appear to be more optimistic on the cost side. We have no information
regarding the exchange rate levels which were budgeted by THY in 2014 but we
believe exchange rate assumptions would be the reason behind the discrepancy.
BUSINESS OVERVIEW
Revenue
The passenger segment is the main source of revenue, followed by cargo. As of
9M13, THY generated 89% of its top line from the passenger segment, with 14%
of this derived from domestic flights. THY’s strong pax figures (which followed a
CAGR of 16% between 2008-13) was the main reason behind the strength in
passenger revenues. The airline recorded 24% growth in 2013 (see details for
traffic figures on page 50). We forecast a 19% CAGR in pax numbers for the 2013
-2016 period. Relatively robust GDP growth and Turkey’s rising attractiveness for
tourism, coupled with the country’s geographical advantage, supporting transit
passenger numbers, were seen as the key drivers of passenger growth. THY has
been diversifying its geographical exposure as shown below. Cargo is the second
largest segment in total revenues, with an 8% share in total revenues. We assume
cargo revenues will comprise around 9% of total revenues going forward.
Consensus vs. Our estimates
THYAO
(TLmn) 2013 2014 2015 2013 2014 2015 2013 2014 2015
Net Sales 18,878 24,730 28,714 19,057 25,422 30,430 1% 3% 6%
EBITDA 2,689 3,323 4,077 2,788 3,190 3,787 4% -4% -7%
Net Profit 940 1,300 1,553 989 1,086 1,240 5% -16% -20%
EBITDA Margin 14.2% 13.4% 14.2% 14.6% 12.6% 12.4% 0.4 pps -0.9 pps -1.8 pps
Net Income Margin 5.0% 5.3% 5.4% 5.2% 4.3% 4.1% 0.2 pps -1.0 pps -1.3 pps
Target Share Price
Source: Bloomberg, Garanti Securities
Bloomberg Garanti Securities Difference
9.00 9.20 2%
2014E Guidance Garanti
Total Pax (mn) 59.5 57.4
-Domestic 26.2 25.4
-International 32.3 32.0
- Hajj and charter f lights pax 1.0
Revenue (USDbn) 11.4 11.7
Total ASK growth 21% 20%
-Turkey 33%
-South America 29%
-Africa 25%
-Far East 22%
-North America 20%
-Europe 16%
-Middle East 13%
Load Factor 78.8% 79.0%
Passenger revenue yield
-Domestic (TL) -2% -2%
-International (EUR) 1% -1%
CASK-ex fuel growth (USD) 2% 1%
Source: The Company, Garanti Securities
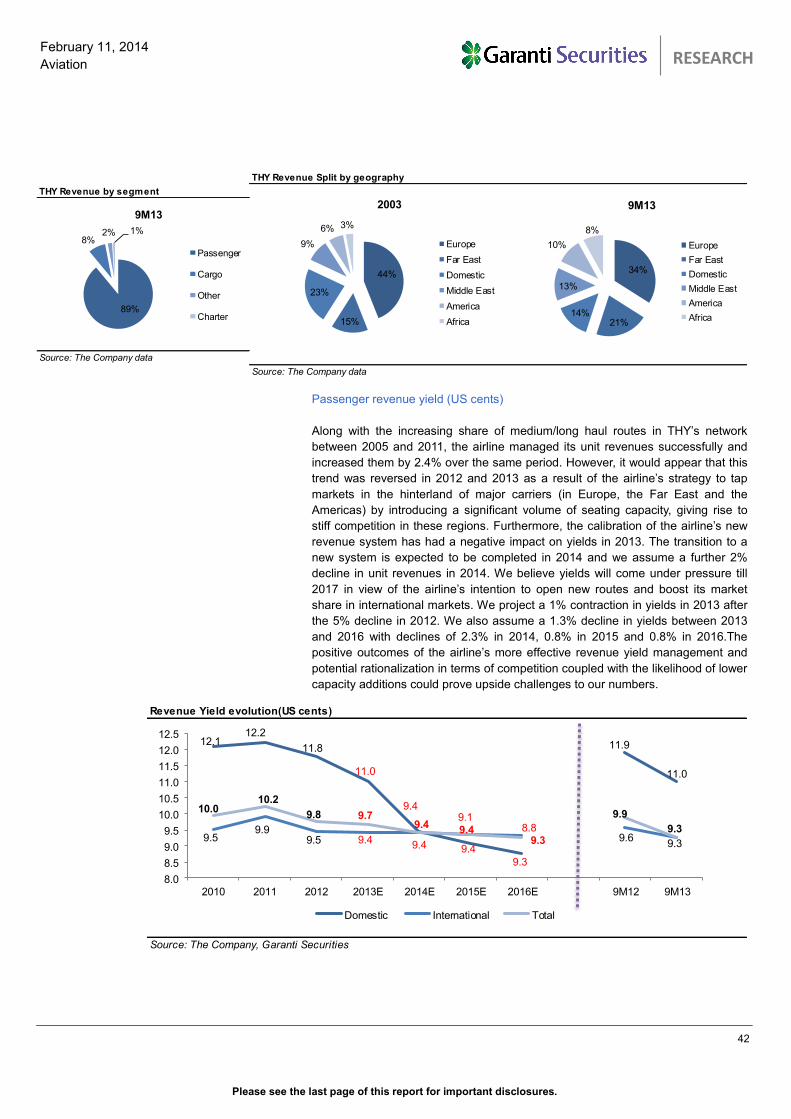
Please see the last page of this report for important disclosures.
42
February 11, 2014
Aviation
TURKISH AVIATION SECTOR
RESEARCH
Passenger revenue yield (US cents)
Along with the increasing share of medium/long haul routes in THY’s network
between 2005 and 2011, the airline managed its unit revenues successfully and
increased them by 2.4% over the same period. However, it would appear that this
trend was reversed in 2012 and 2013 as a result of the airline’s strategy to tap
markets in the hinterland of major carriers (in Europe, the Far East and the
Americas) by introducing a significant volume of seating capacity, giving rise to
stiff competition in these regions. Furthermore, the calibration of the airline’s new
revenue system has had a negative impact on yields in 2013. The transition to a
new system is expected to be completed in 2014 and we assume a further 2%
decline in unit revenues in 2014. We believe yields will come under pressure till
2017 in view of the airline’s intention to open new routes and boost its market
share in international markets. We project a 1% contraction in yields in 2013 after
the 5% decline in 2012. We also assume a 1.3% decline in yields between 2013
and 2016 with declines of 2.3% in 2014, 0.8% in 2015 and 0.8% in 2016.The
positive outcomes of the airline’s more effective revenue yield management and
potential rationalization in terms of competition coupled with the likelihood of lower
capacity additions could prove upside challenges to our numbers.
Revenue Yield evolution(US cents)
Source: The Company, Garanti Securities
12.112.2
11.8
11.0
9.49.1
8.8
11.9
11.0
9.59.9
9.5 9.49.4 9.4
9.3
9.69.3
10.010.2
9.8 9.79.4
9.49.3
9.9
9.3
8.0
8.5
9.0
9.5
10.0
10.5
11.0
11.5
12.0
12.5
2010 2011 2012 2013E 2014E 2015E 2016E 9M12 9M13
Domestic International Total
THY Revenue Split by geography
Source: The Company data
44%
15%
23%
9%
6% 3%
2003
Europe
Far East
Domestic
Middle East
America
Africa
34%
21%14%
13%
10%
8%
9M13
Europe
Far East
Domestic
Middle East
America
Africa
THY Revenue by segment
Source: The Company data
89%
8%2% 1%
9M13
Passenger
Cargo
Other
Charter
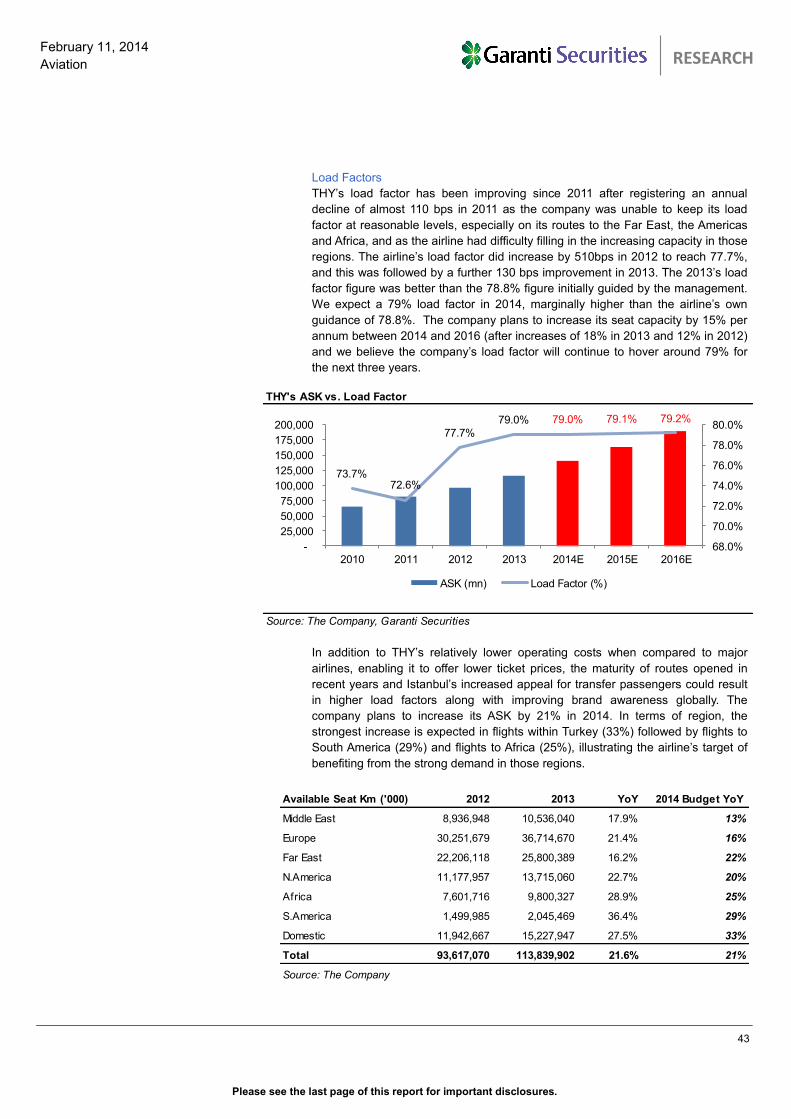
Please see the last page of this report for important disclosures.
43
February 11, 2014
Aviation
TURKISH AVIATION SECTOR
RESEARCH
Load Factors
THY’s load factor has been improving since 2011 after registering an annual
decline of almost 110 bps in 2011 as the company was unable to keep its load
factor at reasonable levels, especially on its routes to the Far East, the Americas
and Africa, and as the airline had difficulty filling in the increasing capacity in those
regions. The airline’s load factor did increase by 510bps in 2012 to reach 77.7%,
and this was followed by a further 130 bps improvement in 2013. The 2013’s load
factor figure was better than the 78.8% figure initially guided by the management.
We expect a 79% load factor in 2014, marginally higher than the airline’s own
guidance of 78.8%. The company plans to increase its seat capacity by 15% per
annum between 2014 and 2016 (after increases of 18% in 2013 and 12% in 2012)
and we believe the company’s load factor will continue to hover around 79% for
the next three years.
In addition to THY’s relatively lower operating costs when compared to major
airlines, enabling it to offer lower ticket prices, the maturity of routes opened in
recent years and Istanbul’s increased appeal for transfer passengers could result
in higher load factors along with improving brand awareness globally. The
company plans to increase its ASK by 21% in 2014. In terms of region, the
strongest increase is expected in flights within Turkey (33%) followed by flights to
South America (29%) and flights to Africa (25%), illustrating the airline’s target of
benefiting from the strong demand in those regions.
Available Seat Km ('000) 2012 2013 YoY 2014 Budget YoY
Middle East 8,936,948 10,536,040 17.9% 13%
Europe 30,251,679 36,714,670 21.4% 16%
Far East 22,206,118 25,800,389 16.2% 22%
N.America 11,177,957 13,715,060 22.7% 20%
Africa 7,601,716 9,800,327 28.9% 25%
S.America 1,499,985 2,045,469 36.4% 29%
Domestic 11,942,667 15,227,947 27.5% 33%
Total 93,617,070 113,839,902 21.6% 21%
Source: The Company
THY's ASK vs. Load Factor
Source: The Company, Garanti Securities
73.7%72.6%
77.7%
79.0% 79.0% 79.1% 79.2%
68.0%
70.0%
72.0%
74.0%
76.0%
78.0%
80.0%
-
25,000
50,000
75,000
100,000
125,000
150,000
175,000
200,000
2010 2011 2012 2013 2014E 2015E 2016E
ASK (mn) Load Factor (%)
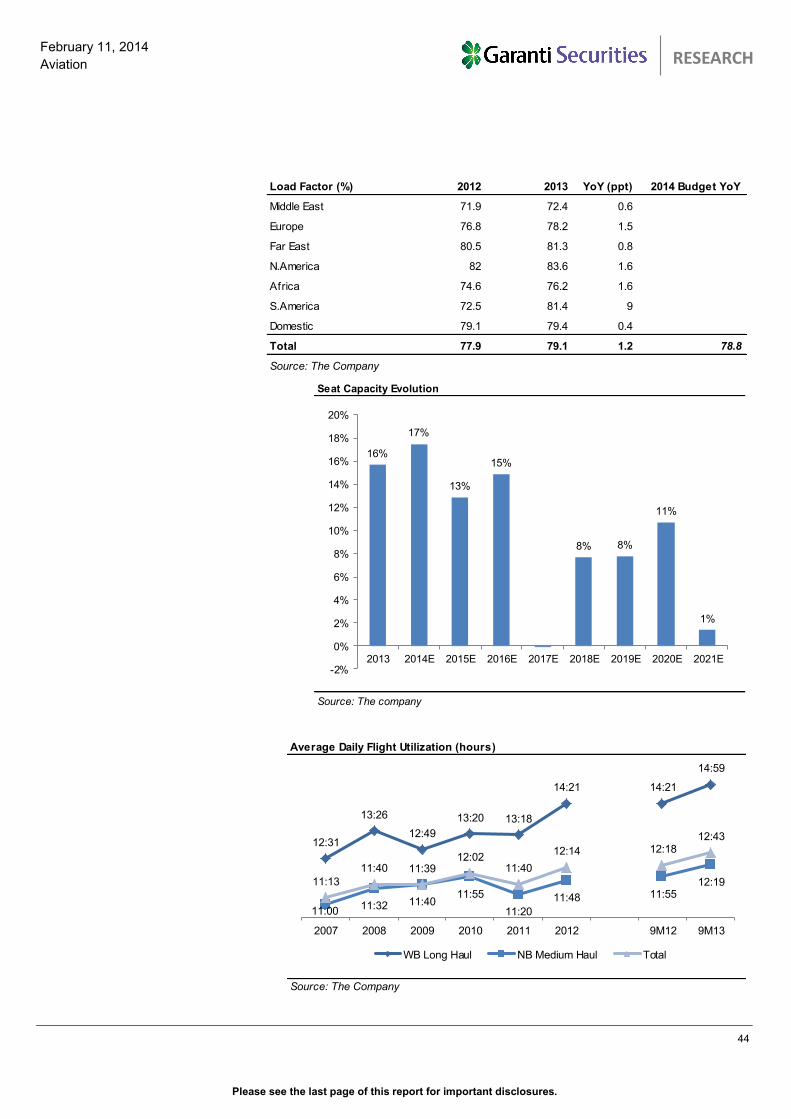
Please see the last page of this report for important disclosures.
44
February 11, 2014
Aviation
TURKISH AVIATION SECTOR
RESEARCH
Seat Capacity Evolution
Source: The company
16%
17%
13%
15%
8% 8%
11%
1%
-2%
0%
2%
4%
6%
8%
10%
12%
14%
16%
18%
20%
2013 2014E 2015E 2016E 2017E 2018E 2019E 2020E 2021E
Average Daily Flight Utilization (hours)
Source: The Company
12:31
13:26
12:49
13:20 13:18
14:21 14:21
14:59
11:0011:32 11:40
11:55
11:20
11:48 11:5512:1911:13
11:40 11:3912:02
11:40
12:14 12:1812:43
2007 2008 2009 2010 2011 2012 9M12 9M13
WB Long Haul NB Medium Haul Total
Load Factor (%) 2012 2013 YoY (ppt) 2014 Budget YoY
Middle East 71.9 72.4 0.6
Europe 76.8 78.2 1.5
Far East 80.5 81.3 0.8
N.America 82 83.6 1.6
Africa 74.6 76.2 1.6
S.America 72.5 81.4 9
Domestic 79.1 79.4 0.4
Total 77.9 79.1 1.2 78.8
Source: The Company
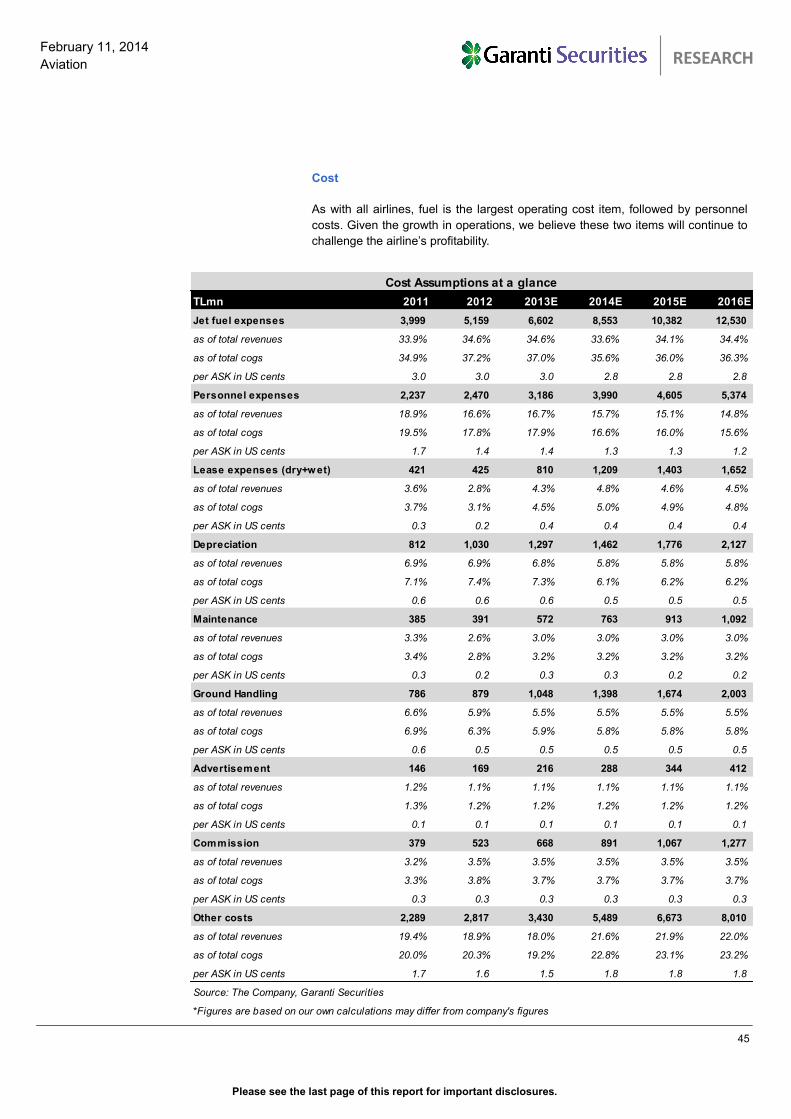
Please see the last page of this report for important disclosures.
45
February 11, 2014
Aviation
TURKISH AVIATION SECTOR
RESEARCH
Cost
As with all airlines, fuel is the largest operating cost item, followed by personnel
costs. Given the growth in operations, we believe these two items will continue to
challenge the airline’s profitability.
TLmn 2011 2012 2013E 2014E 2015E 2016E
Jet fuel expenses 3,999 5,159 6,602 8,553 10,382 12,530
as of total revenues 33.9% 34.6% 34.6% 33.6% 34.1% 34.4%
as of total cogs 34.9% 37.2% 37.0% 35.6% 36.0% 36.3%
per ASK in US cents 3.0 3.0 3.0 2.8 2.8 2.8
Personnel expenses 2,237 2,470 3,186 3,990 4,605 5,374
as of total revenues 18.9% 16.6% 16.7% 15.7% 15.1% 14.8%
as of total cogs 19.5% 17.8% 17.9% 16.6% 16.0% 15.6%
per ASK in US cents 1.7 1.4 1.4 1.3 1.3 1.2
Lease expenses (dry+wet) 421 425 810 1,209 1,403 1,652
as of total revenues 3.6% 2.8% 4.3% 4.8% 4.6% 4.5%
as of total cogs 3.7% 3.1% 4.5% 5.0% 4.9% 4.8%
per ASK in US cents 0.3 0.2 0.4 0.4 0.4 0.4
Depreciation 812 1,030 1,297 1,462 1,776 2,127
as of total revenues 6.9% 6.9% 6.8% 5.8% 5.8% 5.8%
as of total cogs 7.1% 7.4% 7.3% 6.1% 6.2% 6.2%
per ASK in US cents 0.6 0.6 0.6 0.5 0.5 0.5
Maintenance 385 391 572 763 913 1,092
as of total revenues 3.3% 2.6% 3.0% 3.0% 3.0% 3.0%
as of total cogs 3.4% 2.8% 3.2% 3.2% 3.2% 3.2%
per ASK in US cents 0.3 0.2 0.3 0.3 0.2 0.2
Ground Handling 786 879 1,048 1,398 1,674 2,003
as of total revenues 6.6% 5.9% 5.5% 5.5% 5.5% 5.5%
as of total cogs 6.9% 6.3% 5.9% 5.8% 5.8% 5.8%
per ASK in US cents 0.6 0.5 0.5 0.5 0.5 0.5
Advertisement 146 169 216 288 344 412
as of total revenues 1.2% 1.1% 1.1% 1.1% 1.1% 1.1%
as of total cogs 1.3% 1.2% 1.2% 1.2% 1.2% 1.2%
per ASK in US cents 0.1 0.1 0.1 0.1 0.1 0.1
Commission 379 523 668 891 1,067 1,277
as of total revenues 3.2% 3.5% 3.5% 3.5% 3.5% 3.5%
as of total cogs 3.3% 3.8% 3.7% 3.7% 3.7% 3.7%
per ASK in US cents 0.3 0.3 0.3 0.3 0.3 0.3
Other costs 2,289 2,817 3,430 5,489 6,673 8,010
as of total revenues 19.4% 18.9% 18.0% 21.6% 21.9% 22.0%
as of total cogs 20.0% 20.3% 19.2% 22.8% 23.1% 23.2%
per ASK in US cents 1.7 1.6 1.5 1.8 1.8 1.8
Source: The Company, Garanti Securities
*Figures are based on our own calculations may differ from company's figures
Cost Assumptions at a glance
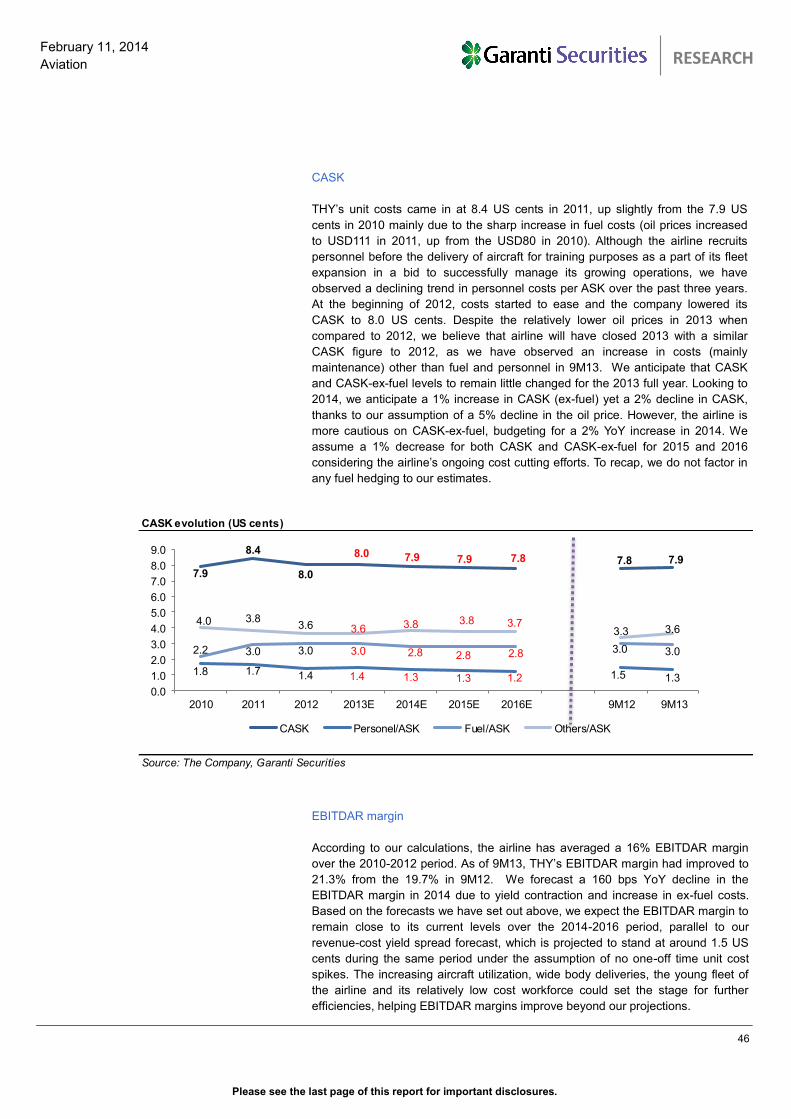
Please see the last page of this report for important disclosures.
46
February 11, 2014
Aviation
TURKISH AVIATION SECTOR
RESEARCH
CASK
THY’s unit costs came in at 8.4 US cents in 2011, up slightly from the 7.9 US
cents in 2010 mainly due to the sharp increase in fuel costs (oil prices increased
to USD111 in 2011, up from the USD80 in 2010). Although the airline recruits
personnel before the delivery of aircraft for training purposes as a part of its fleet
expansion in a bid to successfully manage its growing operations, we have
observed a declining trend in personnel costs per ASK over the past three years.
At the beginning of 2012, costs started to ease and the company lowered its
CASK to 8.0 US cents. Despite the relatively lower oil prices in 2013 when
compared to 2012, we believe that airline will have closed 2013 with a similar
CASK figure to 2012, as we have observed an increase in costs (mainly
maintenance) other than fuel and personnel in 9M13. We anticipate that CASK
and CASK-ex-fuel levels to remain little changed for the 2013 full year. Looking to
2014, we anticipate a 1% increase in CASK (ex-fuel) yet a 2% decline in CASK,
thanks to our assumption of a 5% decline in the oil price. However, the airline is
more cautious on CASK-ex-fuel, budgeting for a 2% YoY increase in 2014. We
assume a 1% decrease for both CASK and CASK-ex-fuel for 2015 and 2016
considering the airline’s ongoing cost cutting efforts. To recap, we do not factor in
any fuel hedging to our estimates.
EBITDAR margin
According to our calculations, the airline has averaged a 16% EBITDAR margin
over the 2010-2012 period. As of 9M13, THY’s EBITDAR margin had improved to
21.3% from the 19.7% in 9M12. We forecast a 160 bps YoY decline in the
EBITDAR margin in 2014 due to yield contraction and increase in ex-fuel costs.
Based on the forecasts we have set out above, we expect the EBITDAR margin to
remain close to its current levels over the 2014-2016 period, parallel to our
revenue-cost yield spread forecast, which is projected to stand at around 1.5 US
cents during the same period under the assumption of no one-off time unit cost
spikes. The increasing aircraft utilization, wide body deliveries, the young fleet of
the airline and its relatively low cost workforce could set the stage for further
efficiencies, helping EBITDAR margins improve beyond our projections.
CASK evolution (US cents)
Source: The Company, Garanti Securities
7.9
8.4
8.0
8.0 7.9 7.9 7.8 7.8 7.9
1.8 1.7 1.4 1.4 1.3 1.3 1.2 1.5 1.3
2.2 3.0 3.0 3.0 2.8 2.8 2.8 3.0 3.0
4.0 3.83.6 3.6 3.8 3.8 3.7
3.3 3.6
0.0
1.0
2.0
3.0
4.0
5.0
6.0
7.0
8.0
9.0
2010 2011 2012 2013E 2014E 2015E 2016E 9M12 9M13
CASK Personel/ASK Fuel/ASK Others/ASK
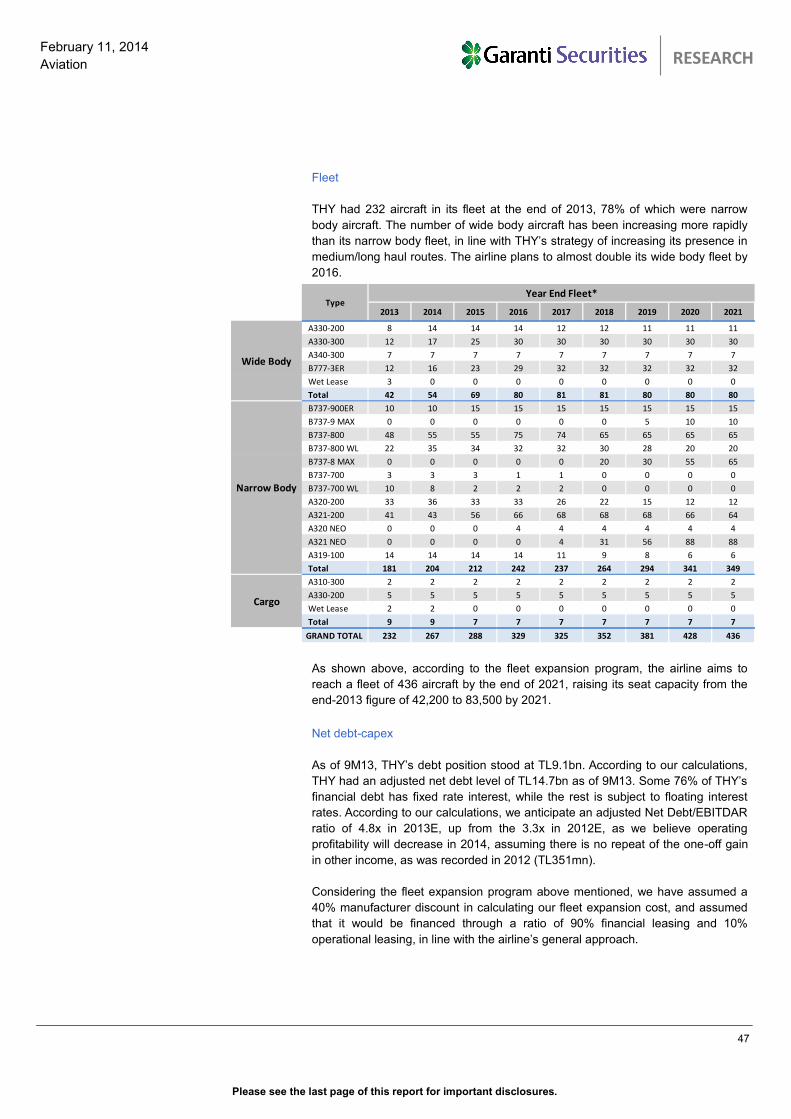
Please see the last page of this report for important disclosures.
47
February 11, 2014
Aviation
TURKISH AVIATION SECTOR
RESEARCH
Fleet
THY had 232 aircraft in its fleet at the end of 2013, 78% of which were narrow
body aircraft. The number of wide body aircraft has been increasing more rapidly
than its narrow body fleet, in line with THY’s strategy of increasing its presence in
medium/long haul routes. The airline plans to almost double its wide body fleet by
2016.
As shown above, according to the fleet expansion program, the airline aims to
reach a fleet of 436 aircraft by the end of 2021, raising its seat capacity from the
end-2013 figure of 42,200 to 83,500 by 2021.
Net debt-capex
As of 9M13, THY’s debt position stood at TL9.1bn. According to our calculations,
THY had an adjusted net debt level of TL14.7bn as of 9M13. Some 76% of THY’s
financial debt has fixed rate interest, while the rest is subject to floating interest
rates. According to our calculations, we anticipate an adjusted Net Debt/EBITDAR
ratio of 4.8x in 2013E, up from the 3.3x in 2012E, as we believe operating
profitability will decrease in 2014, assuming there is no repeat of the one-off gain
in other income, as was recorded in 2012 (TL351mn).
Considering the fleet expansion program above mentioned, we have assumed a
40% manufacturer discount in calculating our fleet expansion cost, and assumed
that it would be financed through a ratio of 90% financial leasing and 10%
operational leasing, in line with the airline’s general approach.
2013 2014 2015 2016 2017 2018 2019 2020 2021
A330-200 8 14 14 14 12 12 11 11 11
A330-300 12 17 25 30 30 30 30 30 30
A340-300 7 7 7 7 7 7 7 7 7
B777-3ER 12 16 23 29 32 32 32 32 32
Wet Lease 3 0 0 0 0 0 0 0 0
Total 42 54 69 80 81 81 80 80 80
B737-900ER 10 10 15 15 15 15 15 15 15
B737-9 MAX 0 0 0 0 0 0 5 10 10
B737-800 48 55 55 75 74 65 65 65 65
B737-800 WL 22 35 34 32 32 30 28 20 20
B737-8 MAX 0 0 0 0 0 20 30 55 65
B737-700 3 3 3 1 1 0 0 0 0
B737-700 WL 10 8 2 2 2 0 0 0 0
A320-200 33 36 33 33 26 22 15 12 12
A321-200 41 43 56 66 68 68 68 66 64
A320 NEO 0 0 0 4 4 4 4 4 4
A321 NEO 0 0 0 0 4 31 56 88 88
A319-100 14 14 14 14 11 9 8 6 6
Total 181 204 212 242 237 264 294 341 349
A310-300 2 2 2 2 2 2 2 2 2
A330-200 5 5 5 5 5 5 5 5 5
Wet Lease 2 2 0 0 0 0 0 0 0
Total 9 9 7 7 7 7 7 7 7
GRAND TOTAL 232 267 288 329 325 352 381 428 436
Year End Fleet*
Wide Body
Narrow Body
Cargo
Type
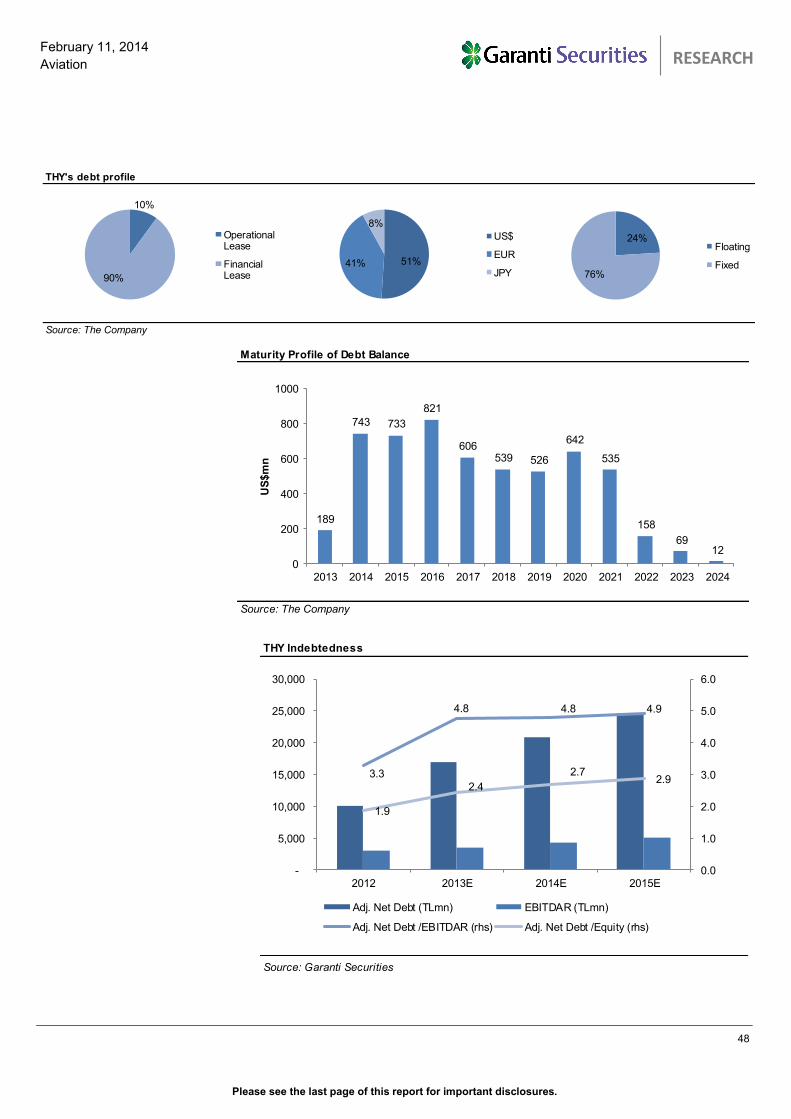
Please see the last page of this report for important disclosures.
48
February 11, 2014
Aviation
TURKISH AVIATION SECTOR
RESEARCH
THY's debt profile
Source: The Company
10%
90%
OperationalLease
FinancialLease
51%41%
8%
US$
EUR
JPY
24%
76%
Floating
Fixed
Maturity Profile of Debt Balance
Source: The Company
189
743 733
821
606539 526
642
535
158
6912
0
200
400
600
800
1000
2013 2014 2015 2016 2017 2018 2019 2020 2021 2022 2023 2024
US
$m
n
THY Indebtedness
Source: Garanti Securities
3.3
4.8 4.8 4.9
1.9
2.4
2.72.9
0.0
1.0
2.0
3.0
4.0
5.0
6.0
-
5,000
10,000
15,000
20,000
25,000
30,000
2012 2013E 2014E 2015E
Adj. Net Debt (TLmn) EBITDAR (TLmn)
Adj. Net Debt /EBITDAR (rhs) Adj. Net Debt /Equity (rhs)
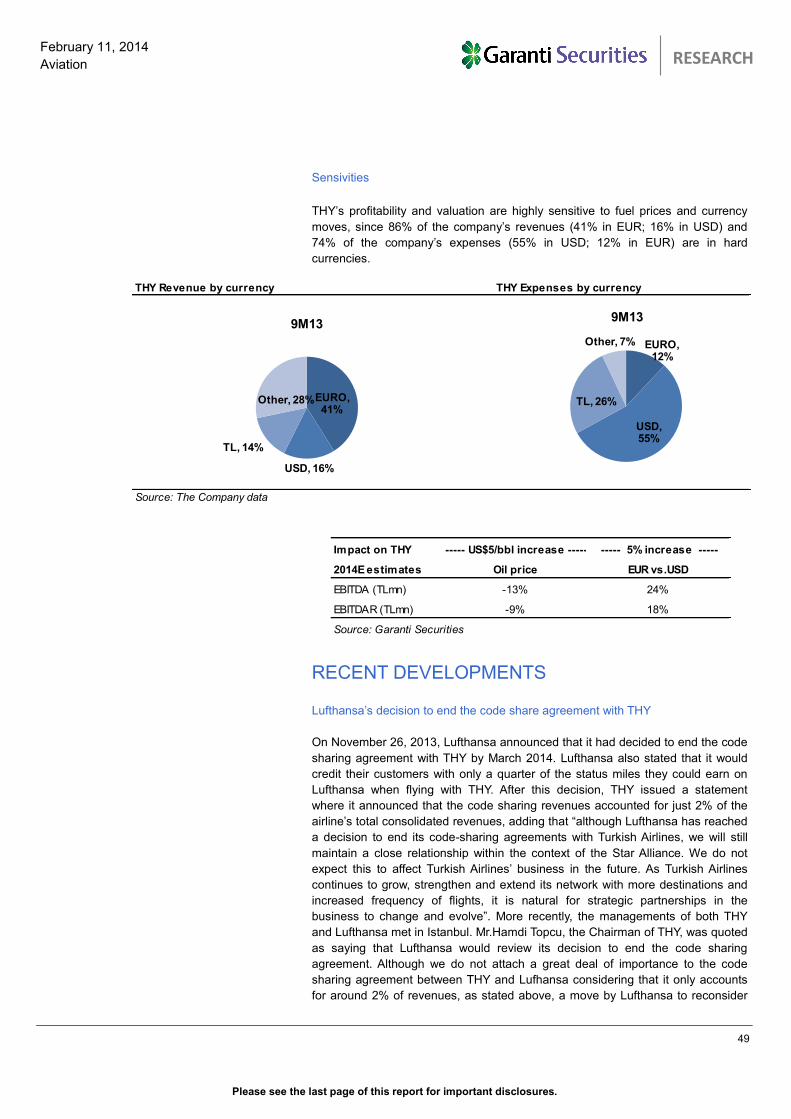
Please see the last page of this report for important disclosures.
49
February 11, 2014
Aviation
TURKISH AVIATION SECTOR
RESEARCH
Sensivities
THY’s profitability and valuation are highly sensitive to fuel prices and currency
moves, since 86% of the company’s revenues (41% in EUR; 16% in USD) and
74% of the company’s expenses (55% in USD; 12% in EUR) are in hard
currencies.
RECENT DEVELOPMENTS
Lufthansa’s decision to end the code share agreement with THY
On November 26, 2013, Lufthansa announced that it had decided to end the code
sharing agreement with THY by March 2014. Lufthansa also stated that it would
credit their customers with only a quarter of the status miles they could earn on
Lufthansa when flying with THY. After this decision, THY issued a statement
where it announced that the code sharing revenues accounted for just 2% of the
airline’s total consolidated revenues, adding that “although Lufthansa has reached
a decision to end its code-sharing agreements with Turkish Airlines, we will still
maintain a close relationship within the context of the Star Alliance. We do not
expect this to affect Turkish Airlines’ business in the future. As Turkish Airlines
continues to grow, strengthen and extend its network with more destinations and
increased frequency of flights, it is natural for strategic partnerships in the
business to change and evolve”. More recently, the managements of both THY
and Lufthansa met in Istanbul. Mr.Hamdi Topcu, the Chairman of THY, was quoted
as saying that Lufthansa would review its decision to end the code sharing
agreement. Although we do not attach a great deal of importance to the code
sharing agreement between THY and Lufhansa considering that it only accounts
for around 2% of revenues, as stated above, a move by Lufthansa to reconsider
THY Revenue by currency THY Expenses by currency
Source: The Company data
EURO, 41%
USD, 16%
TL, 14%
Other, 28%
9M13
EURO, 12%
USD, 55%
TL, 26%
Other, 7%
9M13
Impact on THY ----- US$5/bbl increase ----- ----- 5% increase -----
2014E estimates Oil price EUR vs.USD
EBITDA (TLmn) -13% 24%
EBITDAR (TLmn) -9% 18%
Source: Garanti Securities
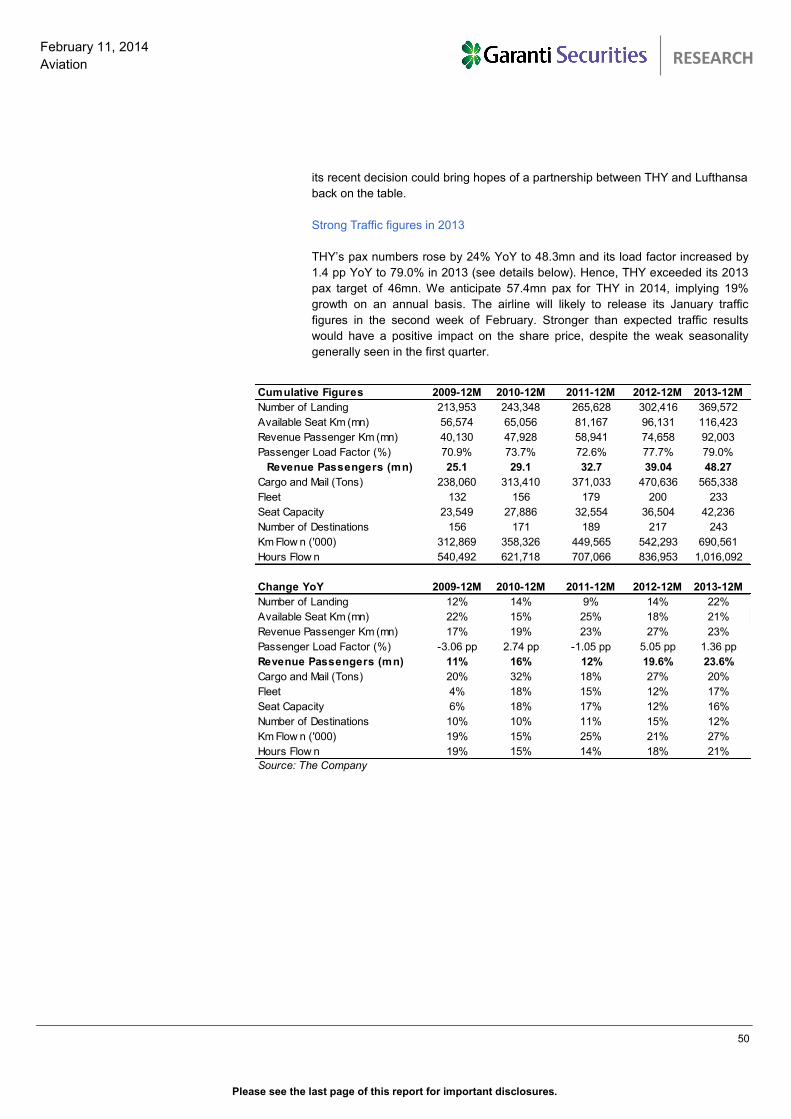
Please see the last page of this report for important disclosures.
50
February 11, 2014
Aviation
TURKISH AVIATION SECTOR
RESEARCH
its recent decision could bring hopes of a partnership between THY and Lufthansa
back on the table.
Strong Traffic figures in 2013
THY’s pax numbers rose by 24% YoY to 48.3mn and its load factor increased by
1.4 pp YoY to 79.0% in 2013 (see details below). Hence, THY exceeded its 2013
pax target of 46mn. We anticipate 57.4mn pax for THY in 2014, implying 19%
growth on an annual basis. The airline will likely to release its January traffic
figures in the second week of February. Stronger than expected traffic results
would have a positive impact on the share price, despite the weak seasonality
generally seen in the first quarter.
Cumulative Figures 2009-12M 2010-12M 2011-12M 2012-12M 2013-12M
Number of Landing 213,953 243,348 265,628 302,416 369,572
Available Seat Km (mn) 56,574 65,056 81,167 96,131 116,423
Revenue Passenger Km (mn) 40,130 47,928 58,941 74,658 92,003
Passenger Load Factor (%) 70.9% 73.7% 72.6% 77.7% 79.0%
Revenue Passengers (mn) 25.1 29.1 32.7 39.04 48.27
Cargo and Mail (Tons) 238,060 313,410 371,033 470,636 565,338
Fleet 132 156 179 200 233
Seat Capacity 23,549 27,886 32,554 36,504 42,236
Number of Destinations 156 171 189 217 243
Km Flow n ('000) 312,869 358,326 449,565 542,293 690,561
Hours Flow n 540,492 621,718 707,066 836,953 1,016,092
Change YoY 2009-12M 2010-12M 2011-12M 2012-12M 2013-12M
Number of Landing 12% 14% 9% 14% 22%
Available Seat Km (mn) 22% 15% 25% 18% 21%
Revenue Passenger Km (mn) 17% 19% 23% 27% 23%
Passenger Load Factor (%) -3.06 pp 2.74 pp -1.05 pp 5.05 pp 1.36 pp
Revenue Passengers (mn) 11% 16% 12% 19.6% 23.6%
Cargo and Mail (Tons) 20% 32% 18% 27% 20%
Fleet 4% 18% 15% 12% 17%
Seat Capacity 6% 18% 17% 12% 16%
Number of Destinations 10% 10% 11% 15% 12%
Km Flow n ('000) 19% 15% 25% 21% 27%
Hours Flow n 19% 15% 14% 18% 21%
Source: The Company
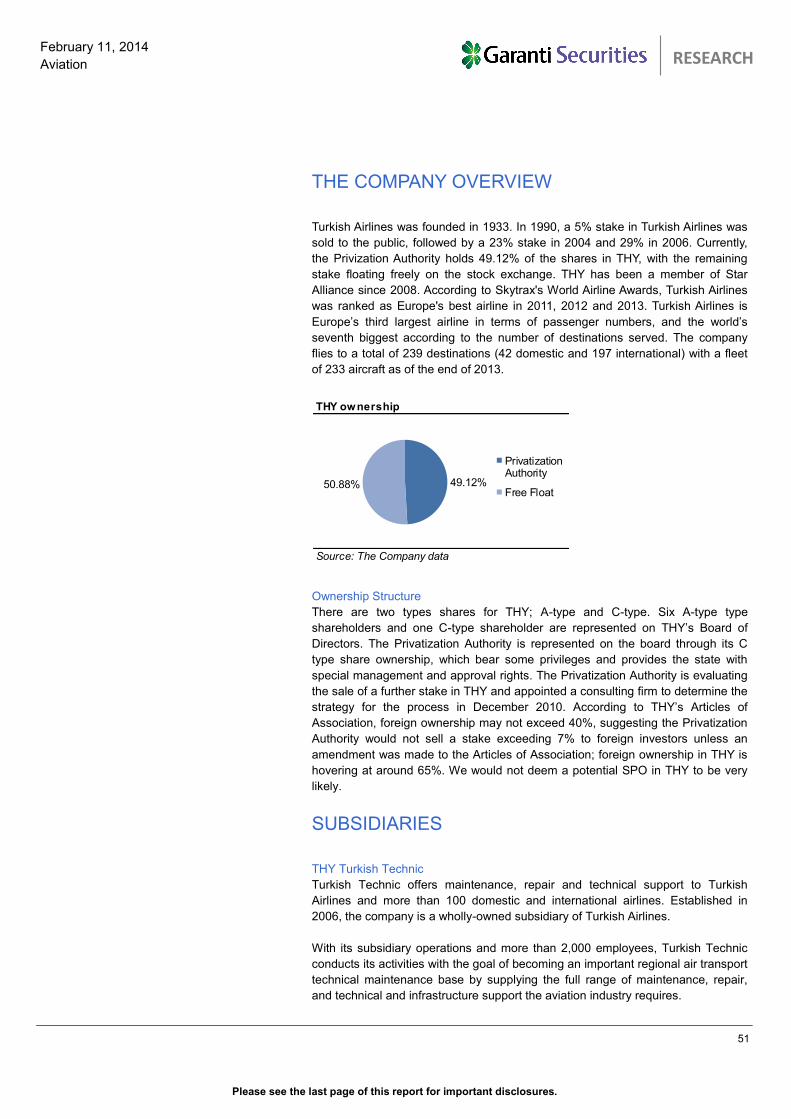
Please see the last page of this report for important disclosures.
51
February 11, 2014
Aviation
TURKISH AVIATION SECTOR
RESEARCH
THE COMPANY OVERVIEW
Turkish Airlines was founded in 1933. In 1990, a 5% stake in Turkish Airlines was
sold to the public, followed by a 23% stake in 2004 and 29% in 2006. Currently,
the Privization Authority holds 49.12% of the shares in THY, with the remaining
stake floating freely on the stock exchange. THY has been a member of Star
Alliance since 2008. According to Skytrax's World Airline Awards, Turkish Airlines
was ranked as Europe's best airline in 2011, 2012 and 2013. Turkish Airlines is
Europe’s third largest airline in terms of passenger numbers, and the world’s
seventh biggest according to the number of destinations served. The company
flies to a total of 239 destinations (42 domestic and 197 international) with a fleet
of 233 aircraft as of the end of 2013.
Ownership Structure
There are two types shares for THY; A-type and C-type. Six A-type type
shareholders and one C-type shareholder are represented on THY’s Board of
Directors. The Privatization Authority is represented on the board through its C
type share ownership, which bear some privileges and provides the state with
special management and approval rights. The Privatization Authority is evaluating
the sale of a further stake in THY and appointed a consulting firm to determine the
strategy for the process in December 2010. According to THY’s Articles of
Association, foreign ownership may not exceed 40%, suggesting the Privatization
Authority would not sell a stake exceeding 7% to foreign investors unless an
amendment was made to the Articles of Association; foreign ownership in THY is
hovering at around 65%. We would not deem a potential SPO in THY to be very
likely.
SUBSIDIARIES
THY Turkish Technic
Turkish Technic offers maintenance, repair and technical support to Turkish
Airlines and more than 100 domestic and international airlines. Established in
2006, the company is a wholly-owned subsidiary of Turkish Airlines.
With its subsidiary operations and more than 2,000 employees, Turkish Technic
conducts its activities with the goal of becoming an important regional air transport
technical maintenance base by supplying the full range of maintenance, repair,
and technical and infrastructure support the aviation industry requires.
THY ownership
Source: The Company data
49.12%50.88%
PrivatizationAuthority
Free Float
Please see the last page of this report for important disclosures.
52
February 11, 2014
Aviation
TURKISH AVIATION SECTOR
RESEARCH
SunExpress
Founded in 1989, SunExpress is a joint venture between Turkish Airlines and
Lufthansa, in which each holds a 50% stake. It is the market leader in charter
flights between Germany and Turkey.
Having inaugurated its flights in 1990, the company has served the charter market
for many years. It began to operate on the Antalya-Frankfurt route as the first
privately owned airline in Turkey to operate a regularly scheduled international
flights. The airline currently has a fleet of 23 aircraft and a workforce of 1,695
employees as of 2012.
Turkish OPET Aviation Fuels
Turkish OPET Aviation Fuels, established in 2009, is a joint venture between
Turkish Airlines and OPET Petrolcülük A.Ş, in which each holds an equal stake. It
provides jet fuel storage and supply services at İstanbul Atatürk and other airports
in Turkey.
The company commenced operations on 1 July 2010. In addition to all kinds of
aviation fuel , it also engages in the domestic and international sale, import,
export, distribution, and transport of chemicals, lubricants, and paints.
Turkish Ground Services
The company provides ground handling services at İstanbul Atatürk Airport and at
five other airports in Turkey. Established in 2009 as a joint venture between
Turkish Airlines and HAVAŞ Havaalanları Yer Hizmetleri A.Ş under TAV, in which
each holds a 50% stake, TGS (Turkish Ground Services) has been in operation
since the beginning of 2010.
Providing services to high international standards, TGS serves approximately 70
domestic and international airlines in addition to Turkish Airlines at Turkey’s
İstanbul Atatürk, Ankara Esenboğa, İzmir Adnan Menderes, Antalya, Adana, and
İstanbul Sabiha Gökçen airports. Employing over 7,000 personnel, TGS has
provided ground services to more than 400,000 flights to date.
THY Turkish DO & CO
The Company provides catering services to Turkish Airlines and more than sixty
other domestic and international airlines. Commencing operations in 2007,
Turkish DO&CO is a joint venture between Turkish Airlines and DO&CO
Restaurants & Catering AG (DOCO TI, NR), in which each holds a 50% stake.
Headquartered at İstanbul Atatürk Airport, it provides catering services to
domestic and international airlines out of kitchens operating at nine locations in
Turkey. These kitchens turn out around 140,000 meals a day, each choice of
which is carefully prepared by Turkish DO&CO’s own culinary staff. Turkish
DO&CO has been responsible for substantial improvements in the quality of
catering on THY flights.
Please see the last page of this report for important disclosures.
53
February 11, 2014
Aviation
TURKISH AVIATION SECTOR
RESEARCH
Pratt&Whitney THY Turkish Engine Center (TEC)
This company, established in 2008, provides aircraft engine maintenance, repair,
and overhaul services to customers both in Turkey and its hinterland. It is a joint
venture between Turkish Airlines and United Technologies, a subsidiary of Pratt &
Whitney. Turkish Airlines holds a 51% stake in TEC. Operating out of a high-tech,
environmentally-friendly maintenance centre with an area of around 25,000 m² at
İstanbul Sabiha Gökçen International Airport, TEC has the capacity to perform
maintenance on more than 200 aircraft engines per year.
Goodrich Turkish Airlines Technical Service Center
The company provides high quality services for maintenance and repair of
nacelles, thrust reversers, related parts and rotable support at its Gebze facilities.
Established in 2010, the Goodrich Turkish Airlines Technical Service Centre is a
joint venture between Turkish Technic (40%) and TSA-Rina Holdings (60%), the
latter being a subsidiary of the Goodrich Corporation.
The Goodrich Turkish Airlines Technical Service Centre aims to be an important
player in the industry by providing maintenance and repair services meeting
international standards to Turkish Airlines and other international airline
companies, underpinned by technical certification.
Turkish Cabin Interior Systems Industries Inc.
This company aims to capture a share of world markets with its cabin interior
system products. Formed in 2011, it is owned by Turkish Airlines (30% stake),
Turkish Tecnic (21%) and Türk Havacılık ve Uzay Sanayi A.Ş. (TUSAŞ -TAI)
(49% stake).
TCI’s objective is to undertake the design, manufacture, logistical support,
modification and marketing of aircraft cabin interior systems and components, and
to capture a share of the international markets with the goods and services that it
produces.
Aircraft Seat Manufacturing Industry & Trade Inc.
Established to design and manufacture airline seats, and to make, modify, market,
and sell spare parts to Turkish Airlines and other international airline companies,
the company is a joint venture with the Assan Hanil Group. Formed in 2011, the
company is 50% owned by the Assan Hanil Group, 45% by Turkish Airlines and
5% by Turkish Tecnic.
HABOM Aviation Maintenance, Repair and Modification Center
This facility, established in Sabiha Gokcen International Airport, aims to become
the largest centre of its kind in the region, providing maintenance, repair and
modification services. The company was established in 2011 as a wholly-owned
subsidiary of Turkish Airlines.
HABOM’s principal business activities consist of buying, selling, renting, leasing,
maintaining, repairing, and modifying all manner of aircraft and aircraft equipment,
as a full range of aviation related equipment, instruments and engines; it also
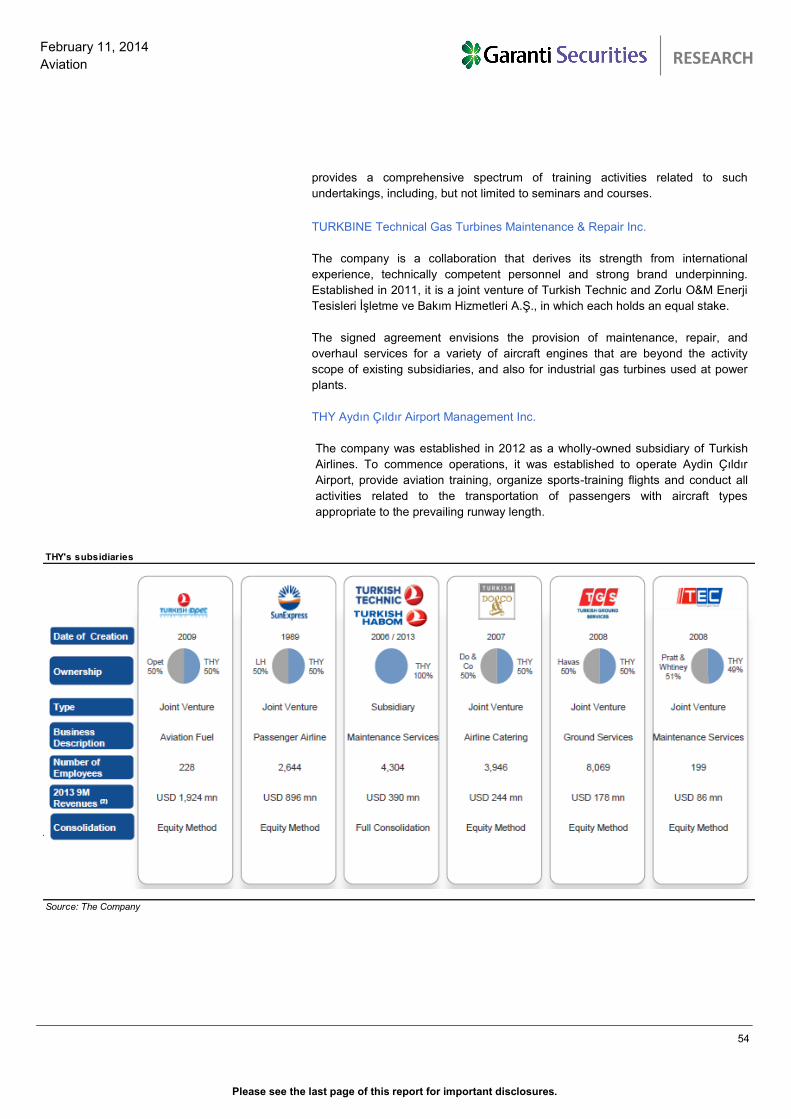
Please see the last page of this report for important disclosures.
54
February 11, 2014
Aviation
TURKISH AVIATION SECTOR
RESEARCH
provides a comprehensive spectrum of training activities related to such
undertakings, including, but not limited to seminars and courses.
TURKBINE Technical Gas Turbines Maintenance & Repair Inc.
The company is a collaboration that derives its strength from international
experience, technically competent personnel and strong brand underpinning.
Established in 2011, it is a joint venture of Turkish Technic and Zorlu O&M Enerji
Tesisleri İşletme ve Bakım Hizmetleri A.Ş., in which each holds an equal stake.
The signed agreement envisions the provision of maintenance, repair, and
overhaul services for a variety of aircraft engines that are beyond the activity
scope of existing subsidiaries, and also for industrial gas turbines used at power
plants.
THY Aydın Çıldır Airport Management Inc.
The company was established in 2012 as a wholly-owned subsidiary of Turkish
Airlines. To commence operations, it was established to operate Aydin Çıldır
Airport, provide aviation training, organize sports-training flights and conduct all
activities related to the transportation of passengers with aircraft types
appropriate to the prevailing runway length.
THY's subsidiaries
Source: The Company
Source: The Company
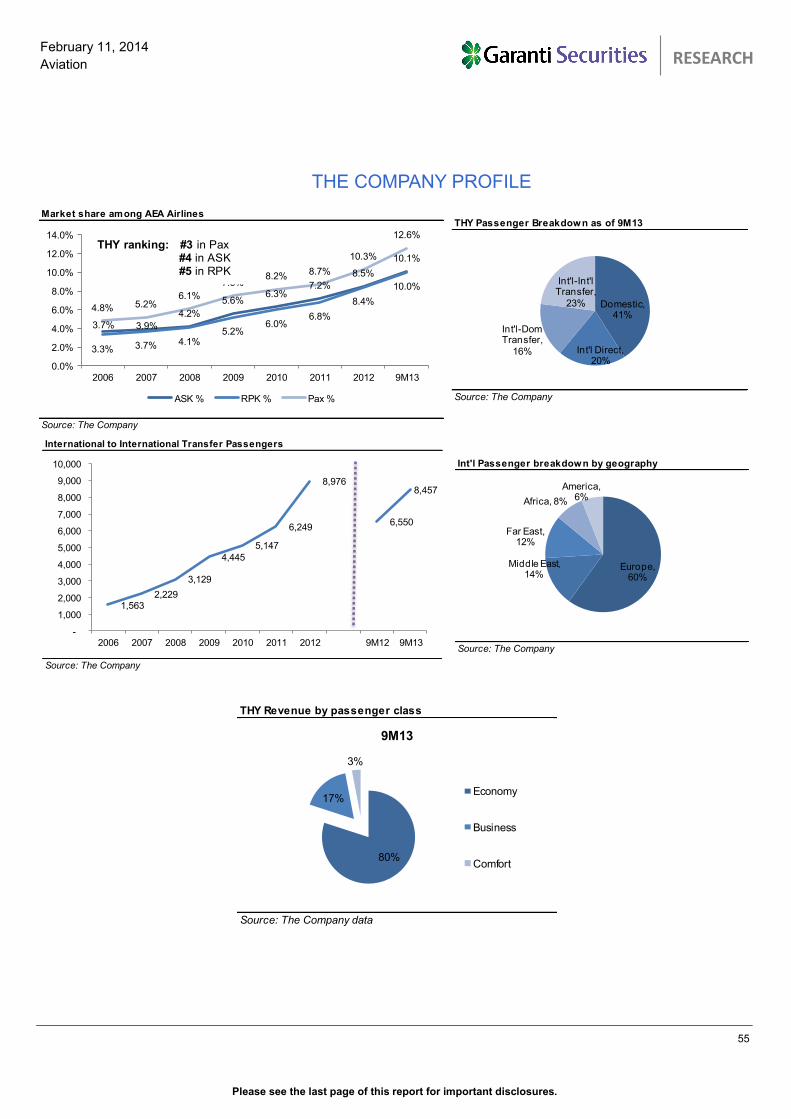
Please see the last page of this report for important disclosures.
55
February 11, 2014
Aviation
TURKISH AVIATION SECTOR
RESEARCH
THE COMPANY PROFILE
Market share among AEA Airlines
Source: The Company
3.7% 3.9%
4.2%
5.6%6.3%
7.2%
8.5%
10.1%
3.3% 3.7% 4.1%5.2%
6.0%6.8%
8.4%
10.0%
4.8% 5.2%6.1%
7.5%8.2%
8.7%
10.3%
12.6%
0.0%
2.0%
4.0%
6.0%
8.0%
10.0%
12.0%
14.0%
2006 2007 2008 2009 2010 2011 2012 9M13
ASK % RPK % Pax %
THY ranking: #3 in Pax#4 in ASK#5 in RPK
International to International Transfer Passengers
Source: The Company
1,563 2,229
3,129
4,445
5,147
6,249
8,976
6,550
8,457
-
1,000
2,000
3,000
4,000
5,000
6,000
7,000
8,000
9,000
10,000
2006 2007 2008 2009 2010 2011 2012 9M12 9M13
THY Passenger Breakdown as of 9M13
Source: The Company
Domestic, 41%
Int'l Direct, 20%
Int'l-Dom Transfer,
16%
Int'l-Int'l Transfer,
23%
Int'l Passenger breakdown by geography
Source: The Company
Europe, 60%
Middle East, 14%
Far East, 12%
Africa, 8%
America, 6%
THY Revenue by passenger class
Source: The Company data
80%
17%
3%
9M13
Economy
Business
Comfort
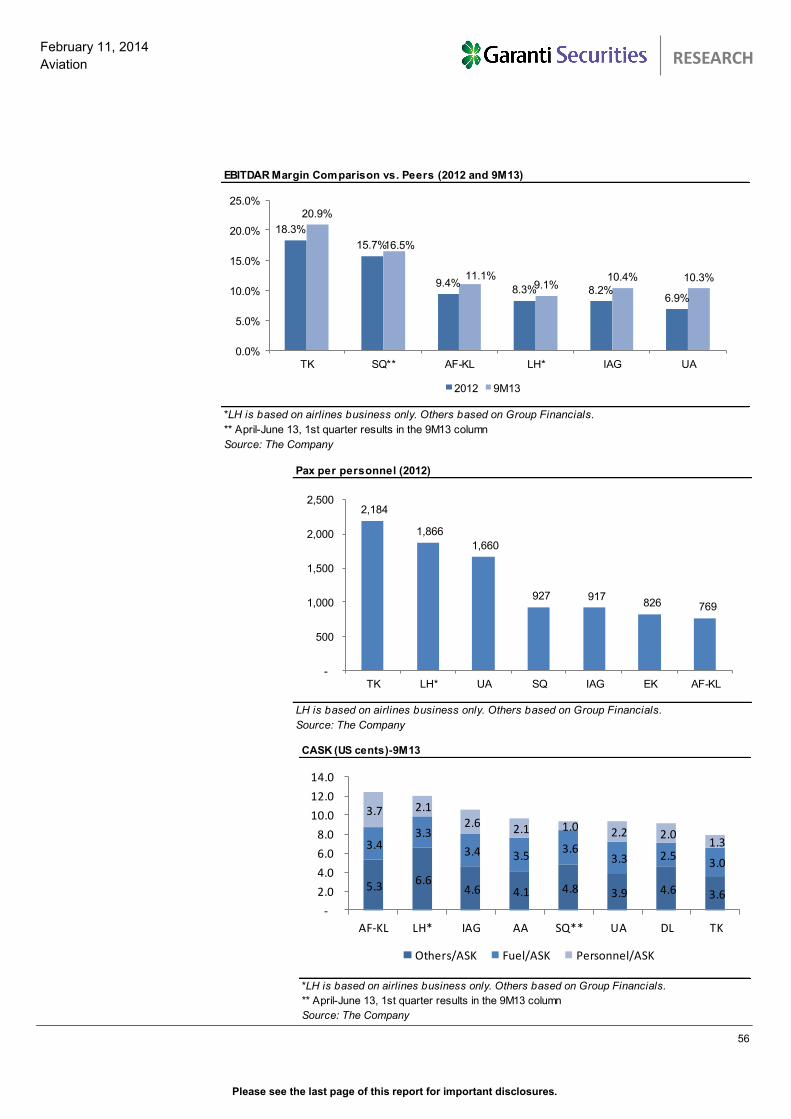
Please see the last page of this report for important disclosures.
56
February 11, 2014
Aviation
TURKISH AVIATION SECTOR
RESEARCH
EBITDAR Margin Comparison vs. Peers (2012 and 9M13)
*LH is based on airlines business only. Others based on Group Financials.
** April-June 13, 1st quarter results in the 9M13 column
Source: The Company
18.3%
15.7%
9.4%8.3% 8.2%
6.9%
20.9%
16.5%
11.1%9.1%
10.4% 10.3%
0.0%
5.0%
10.0%
15.0%
20.0%
25.0%
TK SQ** AF-KL LH* IAG UA
2012 9M13
Pax per personnel (2012)
LH is based on airlines business only. Others based on Group Financials.
Source: The Company
2,184
1,866
1,660
927 917 826 769
-
500
1,000
1,500
2,000
2,500
TK LH* UA SQ IAG EK AF-KL
CASK (US cents)-9M13
*LH is based on airlines business only. Others based on Group Financials.
** April-June 13, 1st quarter results in the 9M13 column
Source: The Company
5.3 6.6 4.6 4.1 4.8 3.9 4.6 3.6
3.4 3.3
3.4 3.5 3.6
3.3 2.5 3.0
3.7 2.1 2.6 2.1 1.0 2.2 2.0
1.3
-
2.0
4.0
6.0
8.0
10.0
12.0
14.0
AF-KL LH* IAG AA SQ** UA DL TK
Others/ASK Fuel/ASK Personnel/ASK
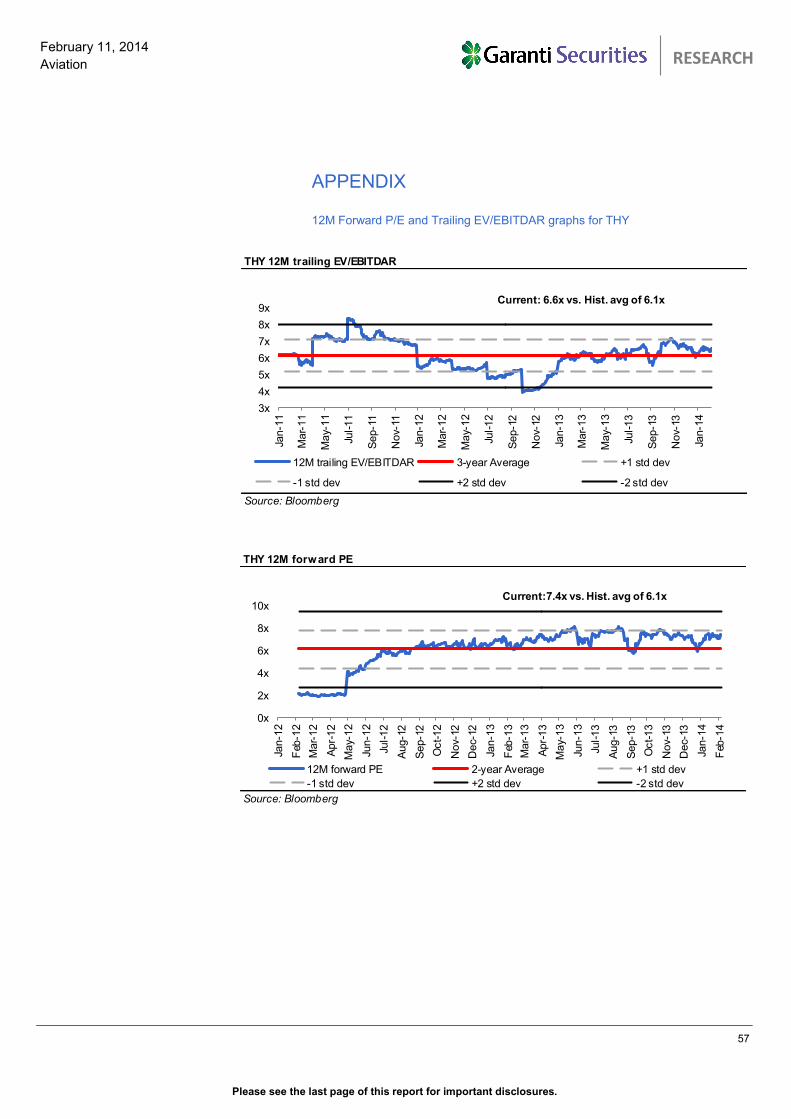
Please see the last page of this report for important disclosures.
57
February 11, 2014
Aviation
TURKISH AVIATION SECTOR
RESEARCH
APPENDIX 12M Forward P/E and Trailing EV/EBITDAR graphs for THY
THY 12M trailing EV/EBITDAR
Source: Bloomberg
3x
4x
5x
6x
7x
8x
9x
Jan-1
1
Mar-
11
May-
11
Jul-11
Sep-1
1
Nov-
11
Jan-1
2
Mar-
12
May-
12
Jul-12
Sep-1
2
Nov-
12
Jan-1
3
Mar-
13
May-
13
Jul-13
Sep-1
3
Nov-
13
Jan-1
4
12M trailing EV/EBITDAR 3-year Average +1 std dev
-1 std dev +2 std dev -2 std dev
Current: 6.6x vs. Hist. avg of 6.1x
THY 12M forward PE
Source: Bloomberg
0x
2x
4x
6x
8x
10x
Jan-1
2
Feb
-12
Mar-
12
Apr-
12
May-
12
Jun-1
2
Jul-12
Aug-1
2
Sep-1
2
Oct-12
Nov-
12
Dec-
12
Jan-1
3
Feb
-13
Mar-
13
Apr-
13
May-
13
Jun-1
3
Jul-13
Aug-1
3
Sep-1
3
Oct-13
Nov-
13
Dec-
13
Jan-1
4
Feb
-14
12M forward PE 2-year Average +1 std dev
-1 std dev +2 std dev -2 std dev
Current:7.4x vs. Hist. avg of 6.1x
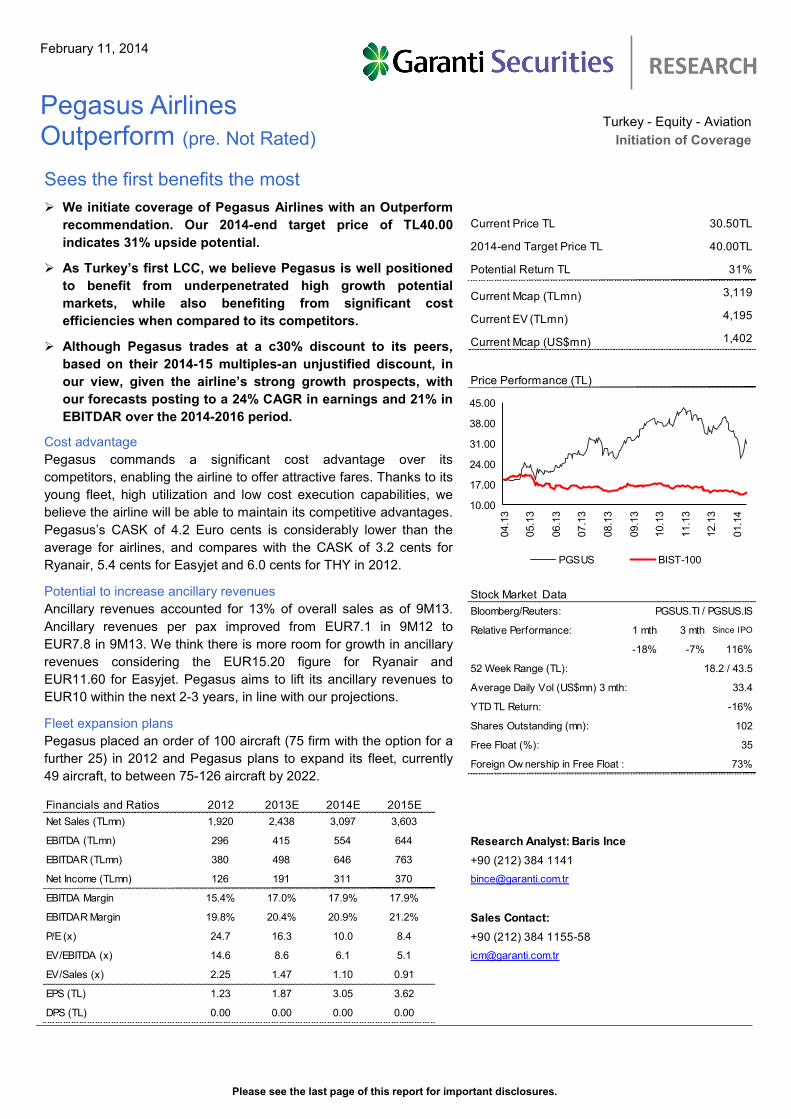
Please see the last page of this report for important disclosures.
RESEARCH
February 11, 2014
Pegasus Airlines Outperform (pre. Not Rated)
Current Price TL 30.50TL
2014-end Target Price TL 40.00TL
Potential Return TL 31%
Current Mcap (TLmn) 3,119
Current EV (TLmn) 4,195
1,402
Bloomberg/Reuters:
1 mth 3 mth Since IPO
-18% -7% 116%
33.4
YTD TL Return: -16%
102
Free Float (%): 35
73%
Financials and Ratios 2012 2013E 2014E 2015E
Net Sales (TLmn) 1,920 2,438 3,097 3,603
EBITDA (TLmn) 296 415 554 644 Research Analyst: Baris Ince
EBITDAR (TLmn) 380 498 646 763 +90 (212) 384 1141
Net Income (TLmn) 126 191 311 370 [email protected]
EBITDA Margin 15.4% 17.0% 17.9% 17.9%
EBITDAR Margin 19.8% 20.4% 20.9% 21.2% Sales Contact:
P/E (x) 24.7 16.3 10.0 8.4 +90 (212) 384 1155-58
EV/EBITDA (x) 14.6 8.6 6.1 5.1 [email protected]
EV/Sales (x) 2.25 1.47 1.10 0.91
EPS (TL) 1.23 1.87 3.05 3.62
DPS (TL) 0.00 0.00 0.00 0.00
Foreign Ow nership in Free Float :
Stock Market Data
PGSUS.TI / PGSUS.IS
Relative Performance:
52 Week Range (TL): 18.2 / 43.5
Average Daily Vol (US$mn) 3 mth:
Shares Outstanding (mn):
Current Mcap (US$mn)
Price Performance (TL)
10.00
17.00
24.00
31.00
38.00
45.00
04.1
3
05.1
3
06.1
3
07.1
3
08.1
3
09.1
3
10.1
3
11.1
3
12.1
3
01.1
4
PGSUS BIST-100
Sees the first benefits the most
We initiate coverage of Pegasus Airlines with an Outperform
recommendation. Our 2014-end target price of TL40.00
indicates 31% upside potential.
As Turkey’s first LCC, we believe Pegasus is well positioned
to benefit from underpenetrated high growth potential
markets, while also benefiting from significant cost
efficiencies when compared to its competitors.
Although Pegasus trades at a c30% discount to its peers,
based on their 2014-15 multiples-an unjustified discount, in
our view, given the airline’s strong growth prospects, with
our forecasts posting to a 24% CAGR in earnings and 21% in
EBITDAR over the 2014-2016 period.
Cost advantage
Pegasus commands a significant cost advantage over its
competitors, enabling the airline to offer attractive fares. Thanks to its
young fleet, high utilization and low cost execution capabilities, we
believe the airline will be able to maintain its competitive advantages.
Pegasus’s CASK of 4.2 Euro cents is considerably lower than the
average for airlines, and compares with the CASK of 3.2 cents for
Ryanair, 5.4 cents for Easyjet and 6.0 cents for THY in 2012.
Potential to increase ancillary revenues
Ancillary revenues accounted for 13% of overall sales as of 9M13.
Ancillary revenues per pax improved from EUR7.1 in 9M12 to
EUR7.8 in 9M13. We think there is more room for growth in ancillary
revenues considering the EUR15.20 figure for Ryanair and
EUR11.60 for Easyjet. Pegasus aims to lift its ancillary revenues to
EUR10 within the next 2-3 years, in line with our projections.
Fleet expansion plans
Pegasus placed an order of 100 aircraft (75 firm with the option for a
further 25) in 2012 and Pegasus plans to expand its fleet, currently
49 aircraft, to between 75-126 aircraft by 2022.
Turkey - Equity - Aviation
Initiation of Coverage
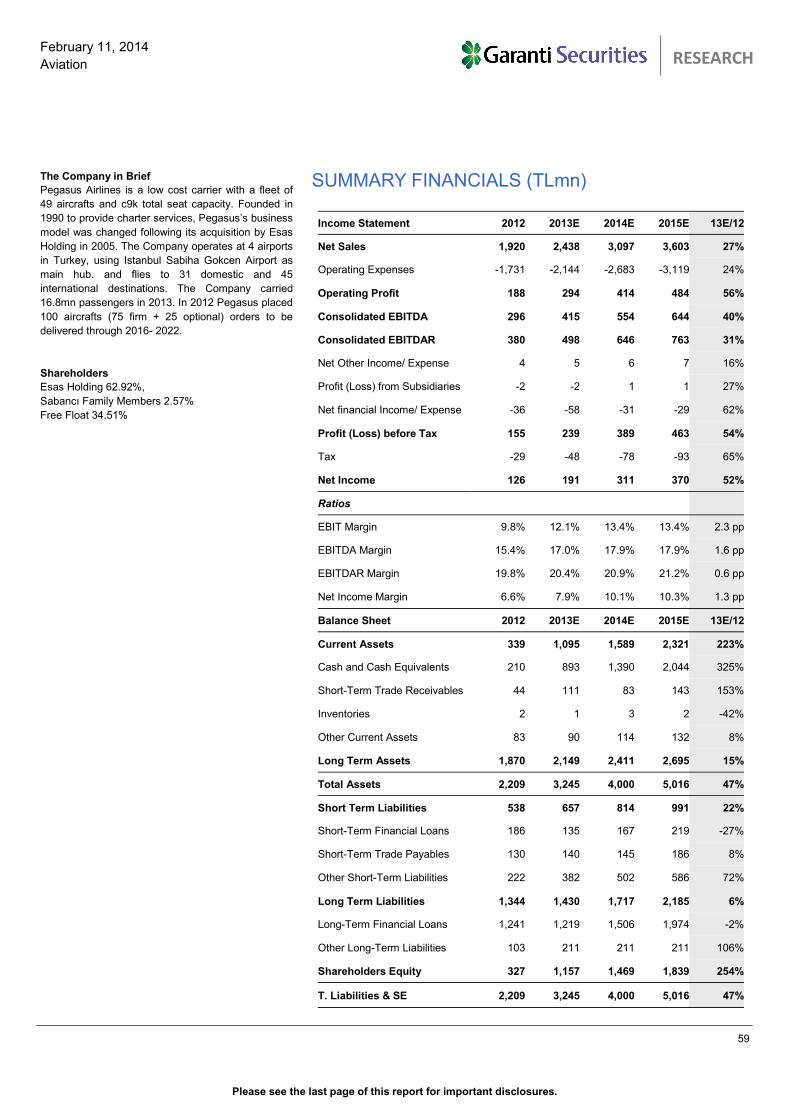
Please see the last page of this report for important disclosures.
59
February 11, 2014
Aviation
TURKISH AVIATION SECTOR
RESEARCH
SUMMARY FINANCIALS (TLmn)
The Company in Brief
Pegasus Airlines is a low cost carrier with a fleet of
49 aircrafts and c9k total seat capacity. Founded in
1990 to provide charter services, Pegasus’s business
model was changed following its acquisition by Esas
Holding in 2005. The Company operates at 4 airports
in Turkey, using Istanbul Sabiha Gokcen Airport as
main hub. and flies to 31 domestic and 45
international destinations. The Company carried
16.8mn passengers in 2013. In 2012 Pegasus placed
100 aircrafts (75 firm + 25 optional) orders to be
delivered through 2016- 2022.
Shareholders
Esas Holding 62.92%,
Sabancı Family Members 2.57%
Free Float 34.51%
Income Statement 2012 2013E 2014E 2015E 13E/12
Net Sales 1,920 2,438 3,097 3,603 27%
Operating Expenses -1,731 -2,144 -2,683 -3,119 24%
Operating Profit 188 294 414 484 56%
Consolidated EBITDA 296 415 554 644 40%
Consolidated EBITDAR 380 498 646 763 31%
Net Other Income/ Expense 4 5 6 7 16%
Profit (Loss) from Subsidiaries -2 -2 1 1 27%
Net financial Income/ Expense -36 -58 -31 -29 62%
Profit (Loss) before Tax 155 239 389 463 54%
Tax -29 -48 -78 -93 65%
Net Income 126 191 311 370 52%
Ratios
EBIT Margin 9.8% 12.1% 13.4% 13.4% 2.3 pp
EBITDA Margin 15.4% 17.0% 17.9% 17.9% 1.6 pp
EBITDAR Margin 19.8% 20.4% 20.9% 21.2% 0.6 pp
Net Income Margin 6.6% 7.9% 10.1% 10.3% 1.3 pp
Balance Sheet 2012 2013E 2014E 2015E 13E/12
Current Assets 339 1,095 1,589 2,321 223%
Cash and Cash Equivalents 210 893 1,390 2,044 325%
Short-Term Trade Receivables 44 111 83 143 153%
Inventories 2 1 3 2 -42%
Other Current Assets 83 90 114 132 8%
Long Term Assets 1,870 2,149 2,411 2,695 15%
Total Assets 2,209 3,245 4,000 5,016 47%
Short Term Liabilities 538 657 814 991 22%
Short-Term Financial Loans 186 135 167 219 -27%
Short-Term Trade Payables 130 140 145 186 8%
Other Short-Term Liabilities 222 382 502 586 72%
Long Term Liabilities 1,344 1,430 1,717 2,185 6%
Long-Term Financial Loans 1,241 1,219 1,506 1,974 -2%
Other Long-Term Liabilities 103 211 211 211 106%
Shareholders Equity 327 1,157 1,469 1,839 254%
T. Liabilities & SE 2,209 3,245 4,000 5,016 47%
Please see the last page of this report for important disclosures.
60
February 11, 2014
Aviation
TURKISH AVIATION SECTOR
RESEARCH
Investment Positives
Operating in an underpenetrated market as the largest LCC
Pegasus is the second largest carrier in Turkey after THY, with a market share of
around 27% in the domestic market in terms of passenger numbers and around
9% in international passenger numbers. Using Istanbul Sabiha Gokcen Airport
(SAW) as its main hub, the airline flies to 45 international and 31 domestic
destinations. The penetration level of LCCs in Turkey and the surrounding region
(mainly the CIS) is lower than in Europe. Therefore, we believe the airline offers
high growth potential. An average of only 0.4 flights are taken per capita each year
in Turkey compared to 0.8 in Spain, while it is believed that passport ownership
ratio is yet at low teens and we believe the majority of passport holders are
Turkish citizens living in other countries, another sign of the under penetration.
Increasing GDP (positive for disposable income) and a young population (around
half of the population are under the age of 30) are also very positive for the long
term growth potential for the airline.
Istanbul is a natural geographical hub
Turkey stands out as a natural geographical hub, with 50 countries within a 3-hour
flight. This helps Pegasus operate with a network model, rather than a point-to-
point one, as is the case for Ryanair and EasyJet. This approach is also summed
up by the Chairman of Pegasus, Ali Sabancı, when he says “we aim to combine
the network benefits of full-service carriers, and the price benefits of LCCs, to
provide low cost travel, on-time performance and new planes.” SAW currently
operates with a capacity of 25mn (with a CUR of around 75%) which is expected
to double in two years’ time after the completion of a second runway. Benefiting
from this geographical advantage, Pegasus aims to increase the share of
international to international transfer passenger traffic in its total passenger
numbers (current 12%). In 9M13, 24% of Pegasus’ passengers were transit
passengers, who either transited to a different part of Turkey or to other
international destinations. The company plans to continue using SAW as its main
hub after the completion of Istanbul’s new airport, which is planned to have an
initial capacity of 90mn by 2017 and later reaching 150mn by 2027.
Effective cost management
Pegasus commands a significant cost advantage over its competitors, enabling
the airline to offer attractive fares. Thanks to its young fleet, high utilization and
low cost execution capabilities, we believe the airline will be able to maintain its
competitive advantages. Pegasus’ CASK of 4.2 Euro Cents in 2012 was below the
average for airlines, and compares with the CASK of 3.2 cents for Ryanair, 5.4
cents for Easyjet and 6.0 cents for THY in 2012. Pegasus has been always in
search of cost cutting initiatives and to this end, it employs a "continuous
improvement team" (CIT) management team charged with the duty of closely
following and controlling costs by developing efficiency initiatives. Thanks to its
cost-efficiency, Pegasus realizes higher EBITDAR margins than its peers.
Please see the last page of this report for important disclosures.
61
February 11, 2014
Aviation
TURKISH AVIATION SECTOR
RESEARCH
The potential to increase ancillary revenues
Ancillary revenue is the revenue from non-ticket sources, such as baggage fees
and on-board food and services, and has become an important financial
component for low-cost carriers. Higher margin ancillary revenues accounted for
13% of overall sales as of 9M13. Ancillary revenues per pax rose from EUR7.1 in
9M12 to EUR7.8 in 9M13. There is more room for growth in ancillary revenues, in
our view, considering the EUR15.20 figure for Ryanair and EUR11.60 for EasyJet.
Pegasus aims to lift its ancillary revenues per pax to EUR10 within 2-3 years. We
forecast that Pegasus will attain ancillary revenues of EUR10.1 per pax by 2016 -
which would be at the lower end of the management target within three years.
Fleet expansion plans
Pegasus has a fleet of 49 aircraft with an average age of 4 years. The airline has
recently placed an order for 100 new aircraft (75 firm + 25 optional). Accordingly,
its fleet could reach a size of between 75-126 aircraft by 2022. We expect
Pegasus to register a CAGR of 18% in its seat capacity between 2013-2016.
The potential beneficiary of a slowdown in economy
Our macroeconomic scenario projects 1.5% GDP growth in 2014E compared to
the 4% in 2013E on the back of increased interest rates and a weaker currency.
Domestic and foreign demand will contribute 0.6 pps and 1.7 pps to 2014E GDP
growth, respectively. Domestic revenues account for 42% of Pegasus’ total
scheduled revenues, Turkish passengers could trade down in a weaker economy.
That could be positive for Pegasus as its competitive prices were also highlighted
by a recent report by a flight comparison website, WhichAirline. After comparing
20 airlines, the survey found Pegasus to be the cheapest low cost carrier in
Europe, with an average total fare of EUR63.19 per one-way flight (including the
20kg baggage allowance and a transaction fee).
Valuation
Pegasus trades at a 33% discount to international LCC peers on 2014E multiples
(37% discount on the basis of the P/E and 29% discount on the basis of its EV/
EBITDAR). Our multiple based valuation suggests a target price of TL40.00,
offering a 31% potential return.
Investment Negatives
Bilateral agreements
Generally, airlines need to secure operating rights for international flights which
are designed by bilateral agreements between the countries. As the flag carrier,
THY has the upper hand over other Turkish carriers when it comes to obtaining
the rights in most international markets. Therefore, the requirement to be a part of
bilateral agreements could limit the visibility of international expansion. Pegasus’
international expansion is focused on in its routes to the Middle East, the CIS and
Eastern Europe, which are deemed as catchment areas; international pax
revenues account for 46% of Pagasus’ total revenues. The company added nine
international destinations to its network and announced that it will start flying to
Frankfurt, Germany and Madrid, Spain and Kuwait starting from late March 2014.
Please see the last page of this report for important disclosures.
62
February 11, 2014
Aviation
TURKISH AVIATION SECTOR
RESEARCH
Increasing competition at SAW
THY has been stepping up its presence at SAW in recent years, mainly due to
capacity constraints at Istanbul Ataturk Airport (IST). THY operated with 14 aircraft
at SAW airport in 9M13, serving 30 destinations (19 domestic and 11 international)
with these flights carrying 2.6mn passengers (up 100% YoY) with 77% load factor.
In 2014, THY plans to appoint 24 aircraft to SAW and fly to 36 destinations (9
domestic, 27 international). This should result in more competition and increased
congestion at SAW, which could compromise Pegasus’ high rankings regarding
metrics of on-time performance (90%), turns per day (7.4) and aircraft utilization
(12.6 BH) as of 2013.
Change in fleet type
Pegasus currently operates with a fleet of Boeing aircraft with an average age of 4
years. In a marked shift, however, the airline had lodged 75 firm orders for Airbus
aircraft with a further 25 optional orders ahead of the IPO, with deliveries to start
by 2H16. Although the new generation Airbus aircraft consume around 15% less
fuel, the transition to a dual type fleet would result in an increase in maintenance
and personnel costs. The management believes the fuel efficiency of the new
aircraft will compensate for the extra costs stemming from operating a dual fleet.
Therefore, the airline’s margins may come under pressure until the successful
completion of the transition.
Sensitivity to FX and oil prices
Although the airline implements fuel hedging and fuel surcharges, its profitability is
still highly sensitive to oil prices as fuel is the largest item (accounting for around
35% of the total) in Pegasus’ COGS. The company’s hedging policy covers up to
60% of projected fuel consumption. Under this policy, the airline has hedged 48%
of its projected fuel consumption for 2013 at USD947/tonne and 35% of its
expected fuel consumption for 2014 at a price of USD926/tonne. Pegasus hedging
ratio stands below its peer of Ryanair and EasyJet, which have hedging ratios of
around 90%. Pegasus’s functional currency is the EUR while it reports in TL.
Some 55% of Pegasus’s total revenues are denominated in hard currencies (11%
in USD; 40% in EUR) while 66% of total costs are in hard currency (36% in USD;
29% in EUR), therefore, Pegasus benefits from a strong EUR against the TL and
USD from an operational perspective. The airline uses a swap/forward mechanism
to eliminate the adverse impact of exchange rate movements.
Risk of new supply
A 34.5% stake in Pegasus was offered to the public through an IPO in April 2013.
The stock’s average trading volume is around USD33mn. According to the terms
of the IPO, there is a 365 day lock-up period for pre-IPO shareholders. There is a
risk that further supply may come to the market after the lock-up period ends in
April 2014.
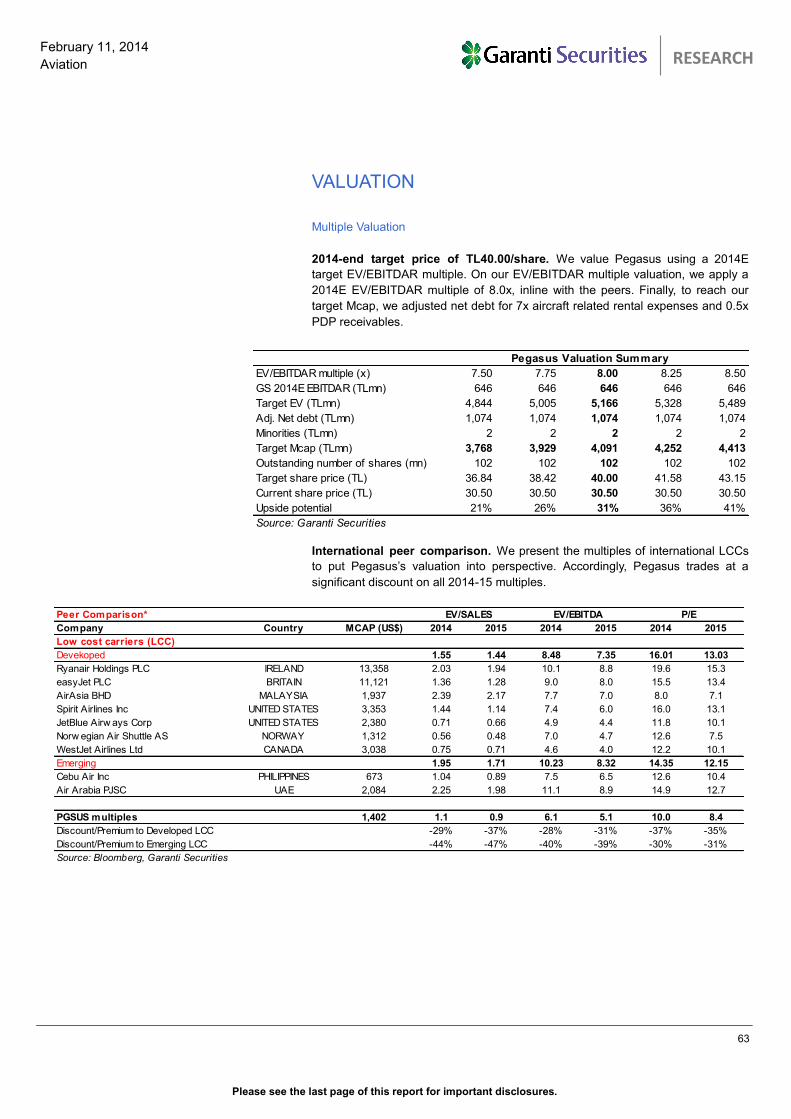
Please see the last page of this report for important disclosures.
63
February 11, 2014
Aviation
TURKISH AVIATION SECTOR
RESEARCH
VALUATION
Multiple Valuation
2014-end target price of TL40.00/share. We value Pegasus using a 2014E
target EV/EBITDAR multiple. On our EV/EBITDAR multiple valuation, we apply a
2014E EV/EBITDAR multiple of 8.0x, inline with the peers. Finally, to reach our
target Mcap, we adjusted net debt for 7x aircraft related rental expenses and 0.5x
PDP receivables.
International peer comparison. We present the multiples of international LCCs
to put Pegasus’s valuation into perspective. Accordingly, Pegasus trades at a
significant discount on all 2014-15 multiples.
EV/EBITDAR multiple (x) 7.50 7.75 8.00 8.25 8.50
GS 2014E EBITDAR (TLmn) 646 646 646 646 646
Target EV (TLmn) 4,844 5,005 5,166 5,328 5,489
Adj. Net debt (TLmn) 1,074 1,074 1,074 1,074 1,074
Minorities (TLmn) 2 2 2 2 2
Target Mcap (TLmn) 3,768 3,929 4,091 4,252 4,413
Outstanding number of shares (mn) 102 102 102 102 102
Target share price (TL) 36.84 38.42 40.00 41.58 43.15
Current share price (TL) 30.50 30.50 30.50 30.50 30.50
Upside potential 21% 26% 31% 36% 41%
Source: Garanti Securities
Pegasus Valuation Summary
Peer Comparison*
Company Country MCAP (US$) 2014 2015 2014 2015 2014 2015
Low cost carriers (LCC)
Devekoped 1.55 1.44 8.48 7.35 16.01 13.03
Ryanair Holdings PLC IRELAND 13,358 2.03 1.94 10.1 8.8 19.6 15.3
easyJet PLC BRITAIN 11,121 1.36 1.28 9.0 8.0 15.5 13.4
AirAsia BHD MALAYSIA 1,937 2.39 2.17 7.7 7.0 8.0 7.1
Spirit Airlines Inc UNITED STATES 3,353 1.44 1.14 7.4 6.0 16.0 13.1
JetBlue Airw ays Corp UNITED STATES 2,380 0.71 0.66 4.9 4.4 11.8 10.1
Norw egian Air Shuttle AS NORWAY 1,312 0.56 0.48 7.0 4.7 12.6 7.5
WestJet Airlines Ltd CANADA 3,038 0.75 0.71 4.6 4.0 12.2 10.1
Emerging 1.95 1.71 10.23 8.32 14.35 12.15
Cebu Air Inc PHILIPPINES 673 1.04 0.89 7.5 6.5 12.6 10.4
Air Arabia PJSC UAE 2,084 2.25 1.98 11.1 8.9 14.9 12.7
PGSUS multiples 1,402 1.1 0.9 6.1 5.1 10.0 8.4
Discount/Premium to Developed LCC -29% -37% -28% -31% -37% -35%
Discount/Premium to Emerging LCC -44% -47% -40% -39% -30% -31%
Source: Bloomberg, Garanti Securities
EV/SALES EV/EBITDA P/E
Please see the last page of this report for important disclosures.
64
February 11, 2014
Aviation
TURKISH AVIATION SECTOR
RESEARCH
Recommendation: OUTPERFORM. Given its proven track record on growth, we
believe that Pegasus stands out as a preferred play in an underpenetrated sector
coupled with its ambitious expansion plans and effective cost management. As
the number one LCC and second largest carrier in Turkey, Pegasus will be one of
the key beneficiaries of increasing GDP and attractive demographics, which
bodes well for discount carriers. Using Istanbul Sabiha Gokcen Airport as its main
hub, Pegasus differentiates itself from an ordinary LCC whose business models
are based on only point to point travel; Pegasus operates like both a network and
point to point carrier, thanks to Istanbul’s geographical advantage connecting 50
countries within 3 hours’ flying time. Furthermore, we think Pegasus’ low cost
management enables the airline to boast one of the lowest CASK levels on the
back of its young fleet, strong punctuality, high utilization and low labour costs. We
expect a CAGR of 18% in net sales, 21% in EBITDAR and 24% in net profit over
the 2014-16 period. We believe these are outstanding figures that place Pegasus
as a clear growth play in the coming years. Pegasus is not an undiscovered stock;
it outperformed the index 116% since IPO in April 2013. Yet, the shares still look
cheap, despite the prospect that Pegasus offers stronger growth for foreseeable
future. We initiate our coverage of Pegasus with a Outperform recommendation.
Risks. The key risks would be an increase in oil prices, unrest in Turkey and
neighbouring countries, stiff competition, limited international expansion and EUR
weakness against the USD.
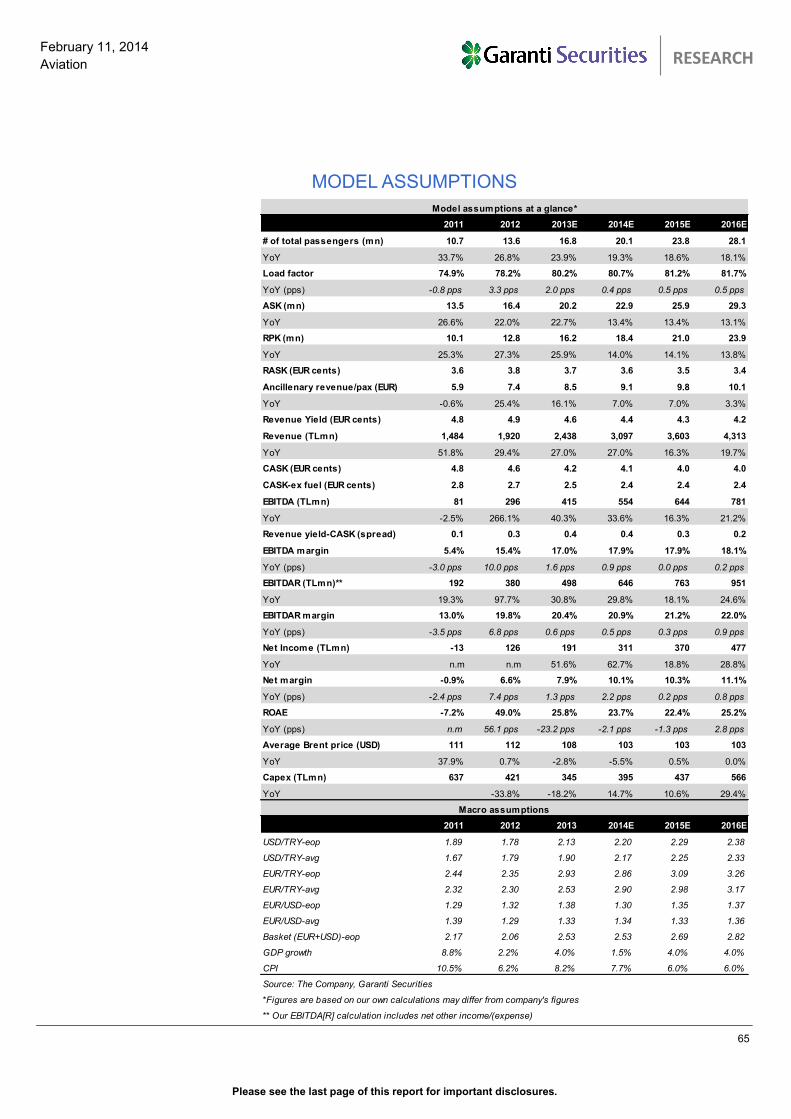
Please see the last page of this report for important disclosures.
65
February 11, 2014
Aviation
TURKISH AVIATION SECTOR
RESEARCH
MODEL ASSUMPTIONS
2011 2012 2013E 2014E 2015E 2016E
# of total passengers (mn) 10.7 13.6 16.8 20.1 23.8 28.1
YoY 33.7% 26.8% 23.9% 19.3% 18.6% 18.1%
Load factor 74.9% 78.2% 80.2% 80.7% 81.2% 81.7%
YoY (pps) -0.8 pps 3.3 pps 2.0 pps 0.4 pps 0.5 pps 0.5 pps
ASK (mn) 13.5 16.4 20.2 22.9 25.9 29.3
YoY 26.6% 22.0% 22.7% 13.4% 13.4% 13.1%
RPK (mn) 10.1 12.8 16.2 18.4 21.0 23.9
YoY 25.3% 27.3% 25.9% 14.0% 14.1% 13.8%
RASK (EUR cents) 3.6 3.8 3.7 3.6 3.5 3.4
Ancillenary revenue/pax (EUR) 5.9 7.4 8.5 9.1 9.8 10.1
YoY -0.6% 25.4% 16.1% 7.0% 7.0% 3.3%
Revenue Yield (EUR cents) 4.8 4.9 4.6 4.4 4.3 4.2
Revenue (TLmn) 1,484 1,920 2,438 3,097 3,603 4,313
YoY 51.8% 29.4% 27.0% 27.0% 16.3% 19.7%
CASK (EUR cents) 4.8 4.6 4.2 4.1 4.0 4.0
CASK-ex fuel (EUR cents) 2.8 2.7 2.5 2.4 2.4 2.4
EBITDA (TLmn) 81 296 415 554 644 781
YoY -2.5% 266.1% 40.3% 33.6% 16.3% 21.2%
Revenue yield-CASK (spread) 0.1 0.3 0.4 0.4 0.3 0.2
EBITDA margin 5.4% 15.4% 17.0% 17.9% 17.9% 18.1%
YoY (pps) -3.0 pps 10.0 pps 1.6 pps 0.9 pps 0.0 pps 0.2 pps
EBITDAR (TLmn)** 192 380 498 646 763 951
YoY 19.3% 97.7% 30.8% 29.8% 18.1% 24.6%
EBITDAR margin 13.0% 19.8% 20.4% 20.9% 21.2% 22.0%
YoY (pps) -3.5 pps 6.8 pps 0.6 pps 0.5 pps 0.3 pps 0.9 pps
Net Income (TLmn) -13 126 191 311 370 477
YoY n.m n.m 51.6% 62.7% 18.8% 28.8%
Net margin -0.9% 6.6% 7.9% 10.1% 10.3% 11.1%
YoY (pps) -2.4 pps 7.4 pps 1.3 pps 2.2 pps 0.2 pps 0.8 pps
ROAE -7.2% 49.0% 25.8% 23.7% 22.4% 25.2%
YoY (pps) n.m 56.1 pps -23.2 pps -2.1 pps -1.3 pps 2.8 pps
Average Brent price (USD) 111 112 108 103 103 103
YoY 37.9% 0.7% -2.8% -5.5% 0.5% 0.0%
Capex (TLmn) 637 421 345 395 437 566
YoY -33.8% -18.2% 14.7% 10.6% 29.4%
2011 2012 2013 2014E 2015E 2016E
USD/TRY-eop 1.89 1.78 2.13 2.20 2.29 2.38
USD/TRY-avg 1.67 1.79 1.90 2.17 2.25 2.33
EUR/TRY-eop 2.44 2.35 2.93 2.86 3.09 3.26
EUR/TRY-avg 2.32 2.30 2.53 2.90 2.98 3.17
EUR/USD-eop 1.29 1.32 1.38 1.30 1.35 1.37
EUR/USD-avg 1.39 1.29 1.33 1.34 1.33 1.36
Basket (EUR+USD)-eop 2.17 2.06 2.53 2.53 2.69 2.82
GDP growth 8.8% 2.2% 4.0% 1.5% 4.0% 4.0%
CPI 10.5% 6.2% 8.2% 7.7% 6.0% 6.0%
Source: The Company, Garanti Securities
*Figures are based on our own calculations may differ from company's figures
** Our EBITDA[R] calculation includes net other income/(expense)
Model assumptions at a glance*
Macro assumptions
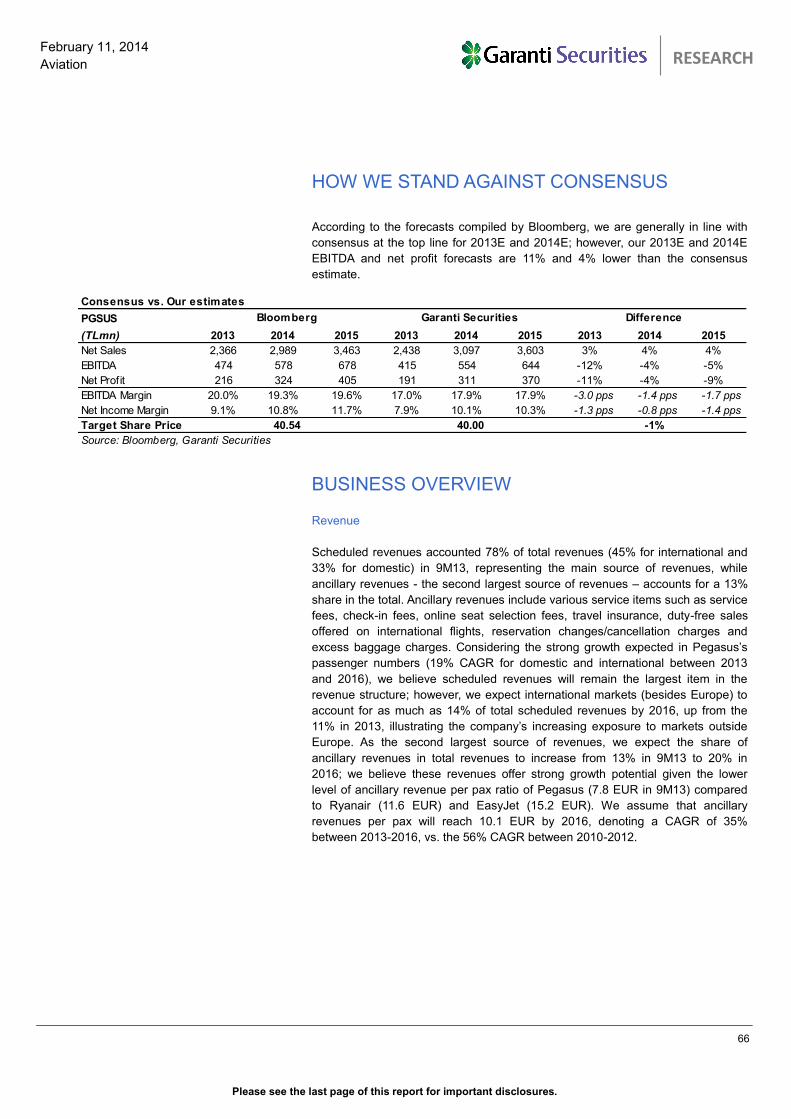
Please see the last page of this report for important disclosures.
66
February 11, 2014
Aviation
TURKISH AVIATION SECTOR
RESEARCH
HOW WE STAND AGAINST CONSENSUS
According to the forecasts compiled by Bloomberg, we are generally in line with
consensus at the top line for 2013E and 2014E; however, our 2013E and 2014E
EBITDA and net profit forecasts are 11% and 4% lower than the consensus
estimate.
BUSINESS OVERVIEW
Revenue
Scheduled revenues accounted 78% of total revenues (45% for international and
33% for domestic) in 9M13, representing the main source of revenues, while
ancillary revenues - the second largest source of revenues – accounts for a 13%
share in the total. Ancillary revenues include various service items such as service
fees, check-in fees, online seat selection fees, travel insurance, duty-free sales
offered on international flights, reservation changes/cancellation charges and
excess baggage charges. Considering the strong growth expected in Pegasus’s
passenger numbers (19% CAGR for domestic and international between 2013
and 2016), we believe scheduled revenues will remain the largest item in the
revenue structure; however, we expect international markets (besides Europe) to
account for as much as 14% of total scheduled revenues by 2016, up from the
11% in 2013, illustrating the company’s increasing exposure to markets outside
Europe. As the second largest source of revenues, we expect the share of
ancillary revenues in total revenues to increase from 13% in 9M13 to 20% in
2016; we believe these revenues offer strong growth potential given the lower
level of ancillary revenue per pax ratio of Pegasus (7.8 EUR in 9M13) compared
to Ryanair (11.6 EUR) and EasyJet (15.2 EUR). We assume that ancillary
revenues per pax will reach 10.1 EUR by 2016, denoting a CAGR of 35%
between 2013-2016, vs. the 56% CAGR between 2010-2012.
Consensus vs. Our estimates
PGSUS
(TLmn) 2013 2014 2015 2013 2014 2015 2013 2014 2015
Net Sales 2,366 2,989 3,463 2,438 3,097 3,603 3% 4% 4%
EBITDA 474 578 678 415 554 644 -12% -4% -5%
Net Profit 216 324 405 191 311 370 -11% -4% -9%
EBITDA Margin 20.0% 19.3% 19.6% 17.0% 17.9% 17.9% -3.0 pps -1.4 pps -1.7 pps
Net Income Margin 9.1% 10.8% 11.7% 7.9% 10.1% 10.3% -1.3 pps -0.8 pps -1.4 pps
Target Share Price
Source: Bloomberg, Garanti Securities
Bloomberg Garanti Securities Difference
40.54 40.00 -1%
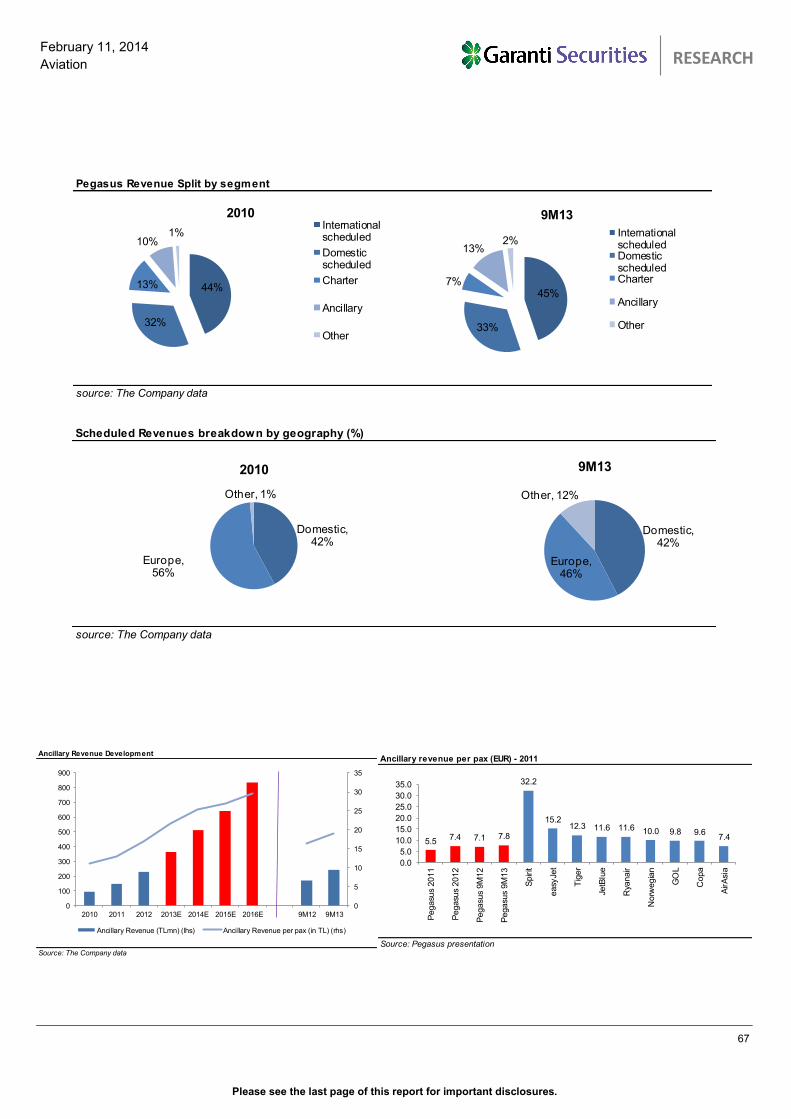
Please see the last page of this report for important disclosures.
67
February 11, 2014
Aviation
TURKISH AVIATION SECTOR
RESEARCH
Pegasus Revenue Split by segment
source: The Company data
44%
32%
13%
10%1%
2010Internationalscheduled
Domesticscheduled
Charter
Ancillary
Other
45%
33%
7%
13%2%
9M13
InternationalscheduledDomesticscheduledCharter
Ancillary
Other
Scheduled Revenues breakdown by geography (%)
source: The Company data
Domestic, 42%
Europe, 56%
Other, 1%
2010
Domestic, 42%
Europe, 46%
Other, 12%
9M13
Ancillary revenue per pax (EUR) - 2011
Source: Pegasus presentation
5.57.4 7.1 7.8
32.2
15.212.3 11.6 11.6 10.0 9.8 9.6
7.4
0.0
5.0
10.0
15.0
20.0
25.0
30.0
35.0
Pegasu
s 2
011
Pegasu
s 2
012
Pegasu
s 9
M12
Pegasu
s 9
M13
Spirit
easy
Jet
Tig
er
JetB
lue
Rya
nair
Norw
egia
n
GO
L
Copa
AirA
sia
Ancillary Revenue Development
Source: The Company data
0
5
10
15
20
25
30
35
0
100
200
300
400
500
600
700
800
900
2010 2011 2012 2013E 2014E 2015E 2016E 9M12 9M13
Ancillary Revenue (TLmn) (lhs) Ancillary Revenue per pax (in TL) (rhs)
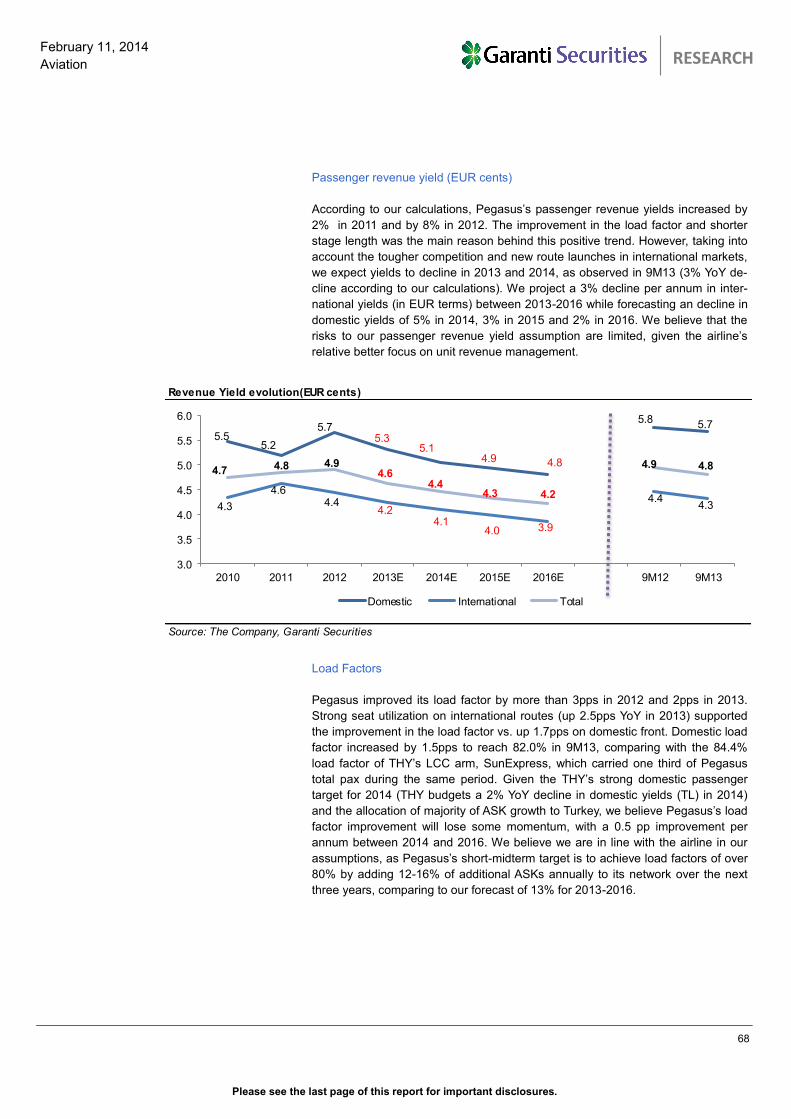
Please see the last page of this report for important disclosures.
68
February 11, 2014
Aviation
TURKISH AVIATION SECTOR
RESEARCH
Passenger revenue yield (EUR cents)
According to our calculations, Pegasus’s passenger revenue yields increased by
2% in 2011 and by 8% in 2012. The improvement in the load factor and shorter
stage length was the main reason behind this positive trend. However, taking into
account the tougher competition and new route launches in international markets,
we expect yields to decline in 2013 and 2014, as observed in 9M13 (3% YoY de-
cline according to our calculations). We project a 3% decline per annum in inter-
national yields (in EUR terms) between 2013-2016 while forecasting an decline in
domestic yields of 5% in 2014, 3% in 2015 and 2% in 2016. We believe that the
risks to our passenger revenue yield assumption are limited, given the airline’s
relative better focus on unit revenue management.
Load Factors
Pegasus improved its load factor by more than 3pps in 2012 and 2pps in 2013.
Strong seat utilization on international routes (up 2.5pps YoY in 2013) supported
the improvement in the load factor vs. up 1.7pps on domestic front. Domestic load
factor increased by 1.5pps to reach 82.0% in 9M13, comparing with the 84.4%
load factor of THY’s LCC arm, SunExpress, which carried one third of Pegasus
total pax during the same period. Given the THY’s strong domestic passenger
target for 2014 (THY budgets a 2% YoY decline in domestic yields (TL) in 2014)
and the allocation of majority of ASK growth to Turkey, we believe Pegasus’s load
factor improvement will lose some momentum, with a 0.5 pp improvement per
annum between 2014 and 2016. We believe we are in line with the airline in our
assumptions, as Pegasus’s short-midterm target is to achieve load factors of over
80% by adding 12-16% of additional ASKs annually to its network over the next
three years, comparing to our forecast of 13% for 2013-2016.
Revenue Yield evolution(EUR cents)
Source: The Company, Garanti Securities
5.55.2
5.75.3
5.14.9 4.8
5.85.7
4.3
4.64.4
4.24.1
4.0 3.9
4.44.3
4.7 4.8 4.94.6
4.44.3 4.2
4.9 4.8
3.0
3.5
4.0
4.5
5.0
5.5
6.0
2010 2011 2012 2013E 2014E 2015E 2016E 9M12 9M13
Domestic International Total
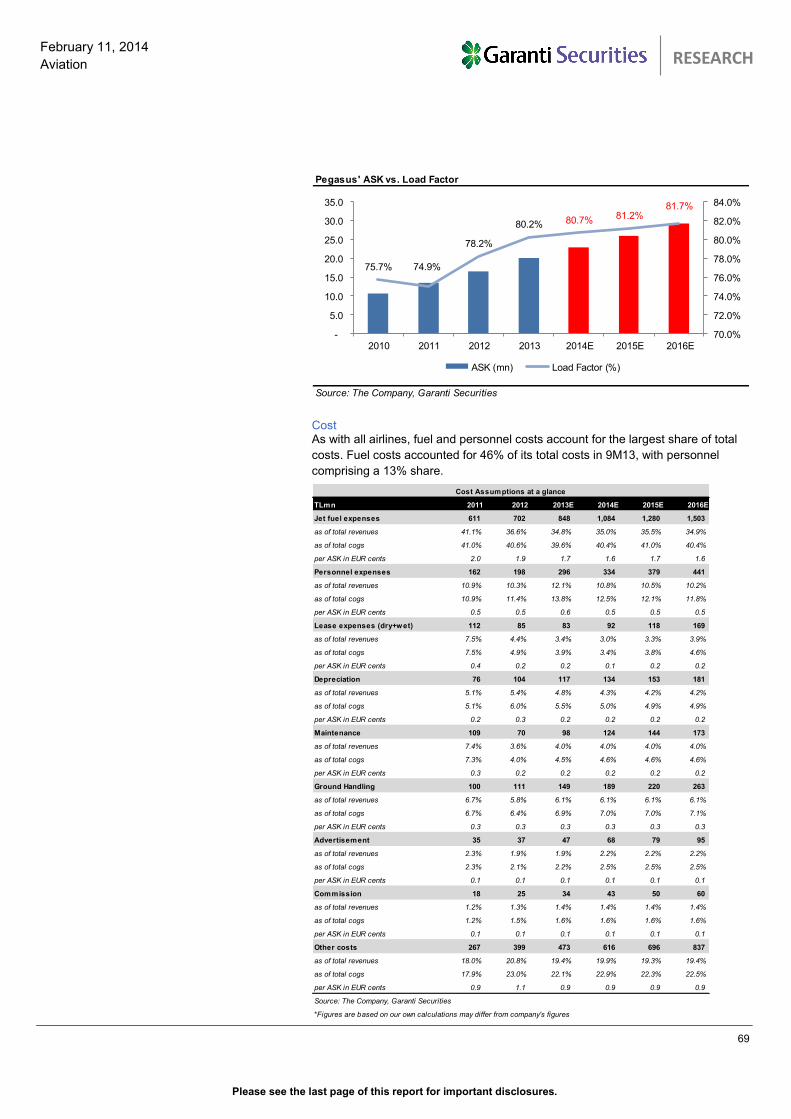
Please see the last page of this report for important disclosures.
69
February 11, 2014
Aviation
TURKISH AVIATION SECTOR
RESEARCH
Cost As with all airlines, fuel and personnel costs account for the largest share of total
costs. Fuel costs accounted for 46% of its total costs in 9M13, with personnel
comprising a 13% share.
Pegasus' ASK vs. Load Factor
Source: The Company, Garanti Securities
75.7% 74.9%
78.2%
80.2% 80.7%81.2%
81.7%
70.0%
72.0%
74.0%
76.0%
78.0%
80.0%
82.0%
84.0%
-
5.0
10.0
15.0
20.0
25.0
30.0
35.0
2010 2011 2012 2013 2014E 2015E 2016E
ASK (mn) Load Factor (%)
TLmn 2011 2012 2013E 2014E 2015E 2016E
Jet fuel expenses 611 702 848 1,084 1,280 1,503
as of total revenues 41.1% 36.6% 34.8% 35.0% 35.5% 34.9%
as of total cogs 41.0% 40.6% 39.6% 40.4% 41.0% 40.4%
per ASK in EUR cents 2.0 1.9 1.7 1.6 1.7 1.6
Personnel expenses 162 198 296 334 379 441
as of total revenues 10.9% 10.3% 12.1% 10.8% 10.5% 10.2%
as of total cogs 10.9% 11.4% 13.8% 12.5% 12.1% 11.8%
per ASK in EUR cents 0.5 0.5 0.6 0.5 0.5 0.5
Lease expenses (dry+wet) 112 85 83 92 118 169
as of total revenues 7.5% 4.4% 3.4% 3.0% 3.3% 3.9%
as of total cogs 7.5% 4.9% 3.9% 3.4% 3.8% 4.6%
per ASK in EUR cents 0.4 0.2 0.2 0.1 0.2 0.2
Depreciation 76 104 117 134 153 181
as of total revenues 5.1% 5.4% 4.8% 4.3% 4.2% 4.2%
as of total cogs 5.1% 6.0% 5.5% 5.0% 4.9% 4.9%
per ASK in EUR cents 0.2 0.3 0.2 0.2 0.2 0.2
Maintenance 109 70 98 124 144 173
as of total revenues 7.4% 3.6% 4.0% 4.0% 4.0% 4.0%
as of total cogs 7.3% 4.0% 4.5% 4.6% 4.6% 4.6%
per ASK in EUR cents 0.3 0.2 0.2 0.2 0.2 0.2
Ground Handling 100 111 149 189 220 263
as of total revenues 6.7% 5.8% 6.1% 6.1% 6.1% 6.1%
as of total cogs 6.7% 6.4% 6.9% 7.0% 7.0% 7.1%
per ASK in EUR cents 0.3 0.3 0.3 0.3 0.3 0.3
Advertisement 35 37 47 68 79 95
as of total revenues 2.3% 1.9% 1.9% 2.2% 2.2% 2.2%
as of total cogs 2.3% 2.1% 2.2% 2.5% 2.5% 2.5%
per ASK in EUR cents 0.1 0.1 0.1 0.1 0.1 0.1
Commission 18 25 34 43 50 60
as of total revenues 1.2% 1.3% 1.4% 1.4% 1.4% 1.4%
as of total cogs 1.2% 1.5% 1.6% 1.6% 1.6% 1.6%
per ASK in EUR cents 0.1 0.1 0.1 0.1 0.1 0.1
Other costs 267 399 473 616 696 837
as of total revenues 18.0% 20.8% 19.4% 19.9% 19.3% 19.4%
as of total cogs 17.9% 23.0% 22.1% 22.9% 22.3% 22.5%
per ASK in EUR cents 0.9 1.1 0.9 0.9 0.9 0.9
Source: The Company, Garanti Securities
*Figures are based on our own calculations may differ from company's figures
Cost Assumptions at a glance
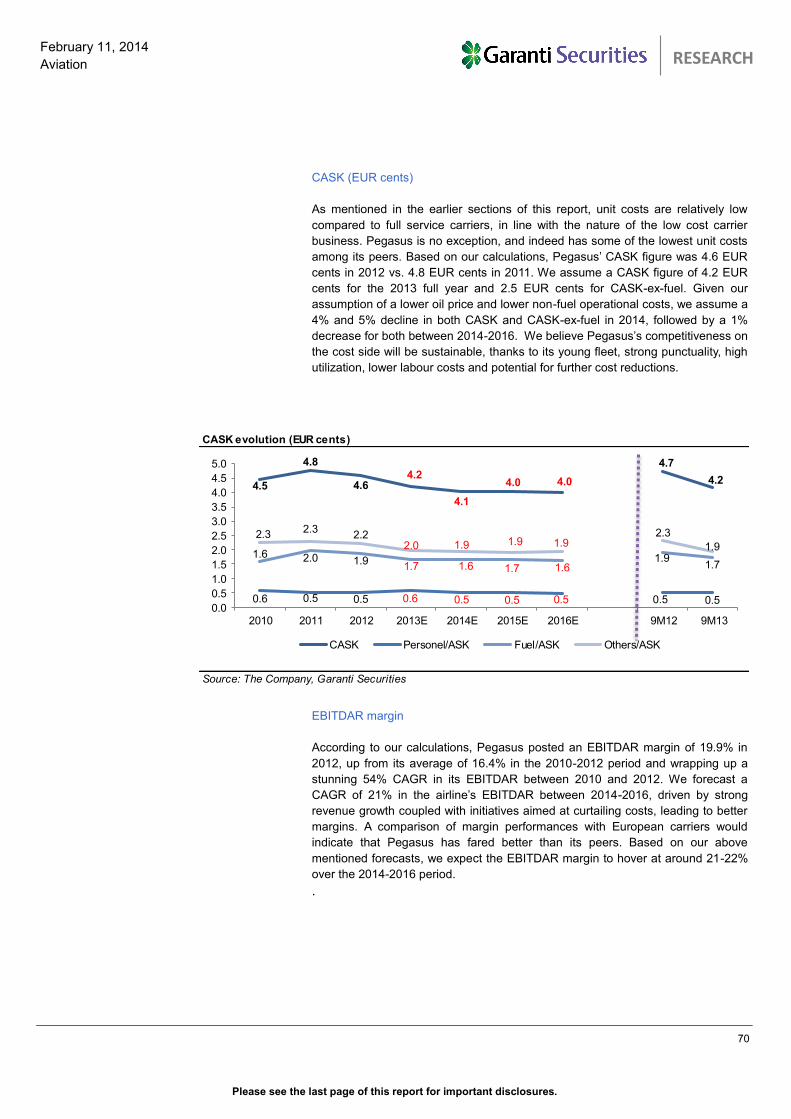
Please see the last page of this report for important disclosures.
70
February 11, 2014
Aviation
TURKISH AVIATION SECTOR
RESEARCH
CASK (EUR cents)
As mentioned in the earlier sections of this report, unit costs are relatively low
compared to full service carriers, in line with the nature of the low cost carrier
business. Pegasus is no exception, and indeed has some of the lowest unit costs
among its peers. Based on our calculations, Pegasus’ CASK figure was 4.6 EUR
cents in 2012 vs. 4.8 EUR cents in 2011. We assume a CASK figure of 4.2 EUR
cents for the 2013 full year and 2.5 EUR cents for CASK-ex-fuel. Given our
assumption of a lower oil price and lower non-fuel operational costs, we assume a
4% and 5% decline in both CASK and CASK-ex-fuel in 2014, followed by a 1%
decrease for both between 2014-2016. We believe Pegasus’s competitiveness on
the cost side will be sustainable, thanks to its young fleet, strong punctuality, high
utilization, lower labour costs and potential for further cost reductions.
EBITDAR margin
According to our calculations, Pegasus posted an EBITDAR margin of 19.9% in
2012, up from its average of 16.4% in the 2010-2012 period and wrapping up a
stunning 54% CAGR in its EBITDAR between 2010 and 2012. We forecast a
CAGR of 21% in the airline’s EBITDAR between 2014-2016, driven by strong
revenue growth coupled with initiatives aimed at curtailing costs, leading to better
margins. A comparison of margin performances with European carriers would
indicate that Pegasus has fared better than its peers. Based on our above
mentioned forecasts, we expect the EBITDAR margin to hover at around 21-22%
over the 2014-2016 period.
.
CASK evolution (EUR cents)
Source: The Company, Garanti Securities
4.5
4.8
4.64.2
4.1
4.0 4.0
4.7
4.2
0.6 0.5 0.5 0.6 0.5 0.5 0.5 0.5 0.5
1.6 2.0 1.91.7 1.6 1.7 1.6
1.91.7
2.32.3
2.22.0 1.9 1.9 1.9
2.3
1.9
0.0
0.5
1.0
1.5
2.0
2.5
3.0
3.5
4.0
4.5
5.0
2010 2011 2012 2013E 2014E 2015E 2016E 9M12 9M13
CASK Personel/ASK Fuel/ASK Others/ASK
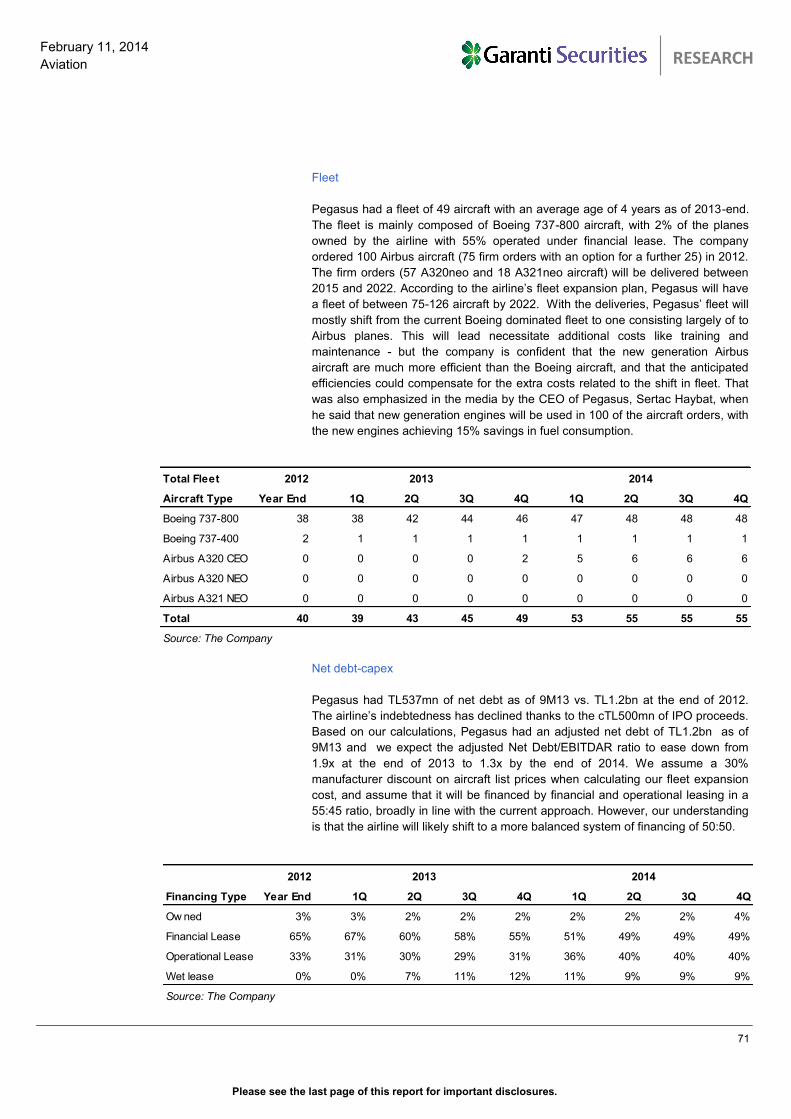
Please see the last page of this report for important disclosures.
71
February 11, 2014
Aviation
TURKISH AVIATION SECTOR
RESEARCH
Fleet
Pegasus had a fleet of 49 aircraft with an average age of 4 years as of 2013-end.
The fleet is mainly composed of Boeing 737-800 aircraft, with 2% of the planes
owned by the airline with 55% operated under financial lease. The company
ordered 100 Airbus aircraft (75 firm orders with an option for a further 25) in 2012.
The firm orders (57 A320neo and 18 A321neo aircraft) will be delivered between
2015 and 2022. According to the airline’s fleet expansion plan, Pegasus will have
a fleet of between 75-126 aircraft by 2022. With the deliveries, Pegasus’ fleet will
mostly shift from the current Boeing dominated fleet to one consisting largely of to
Airbus planes. This will lead necessitate additional costs like training and
maintenance - but the company is confident that the new generation Airbus
aircraft are much more efficient than the Boeing aircraft, and that the anticipated
efficiencies could compensate for the extra costs related to the shift in fleet. That
was also emphasized in the media by the CEO of Pegasus, Sertac Haybat, when
he said that new generation engines will be used in 100 of the aircraft orders, with
the new engines achieving 15% savings in fuel consumption.
Net debt-capex
Pegasus had TL537mn of net debt as of 9M13 vs. TL1.2bn at the end of 2012.
The airline’s indebtedness has declined thanks to the cTL500mn of IPO proceeds.
Based on our calculations, Pegasus had an adjusted net debt of TL1.2bn as of
9M13 and we expect the adjusted Net Debt/EBITDAR ratio to ease down from
1.9x at the end of 2013 to 1.3x by the end of 2014. We assume a 30%
manufacturer discount on aircraft list prices when calculating our fleet expansion
cost, and assume that it will be financed by financial and operational leasing in a
55:45 ratio, broadly in line with the current approach. However, our understanding
is that the airline will likely shift to a more balanced system of financing of 50:50.
Total Fleet 2012
Aircraft Type Year End 1Q 2Q 3Q 4Q 1Q 2Q 3Q 4Q
Boeing 737-800 38 38 42 44 46 47 48 48 48
Boeing 737-400 2 1 1 1 1 1 1 1 1
Airbus A320 CEO 0 0 0 0 2 5 6 6 6
Airbus A320 NEO 0 0 0 0 0 0 0 0 0
Airbus A321 NEO 0 0 0 0 0 0 0 0 0
Total 40 39 43 45 49 53 55 55 55
Source: The Company
2013 2014
2012
Financing Type Year End 1Q 2Q 3Q 4Q 1Q 2Q 3Q 4Q
Ow ned 3% 3% 2% 2% 2% 2% 2% 2% 4%
Financial Lease 65% 67% 60% 58% 55% 51% 49% 49% 49%
Operational Lease 33% 31% 30% 29% 31% 36% 40% 40% 40%
Wet lease 0% 0% 7% 11% 12% 11% 9% 9% 9%
Source: The Company
2013 2014
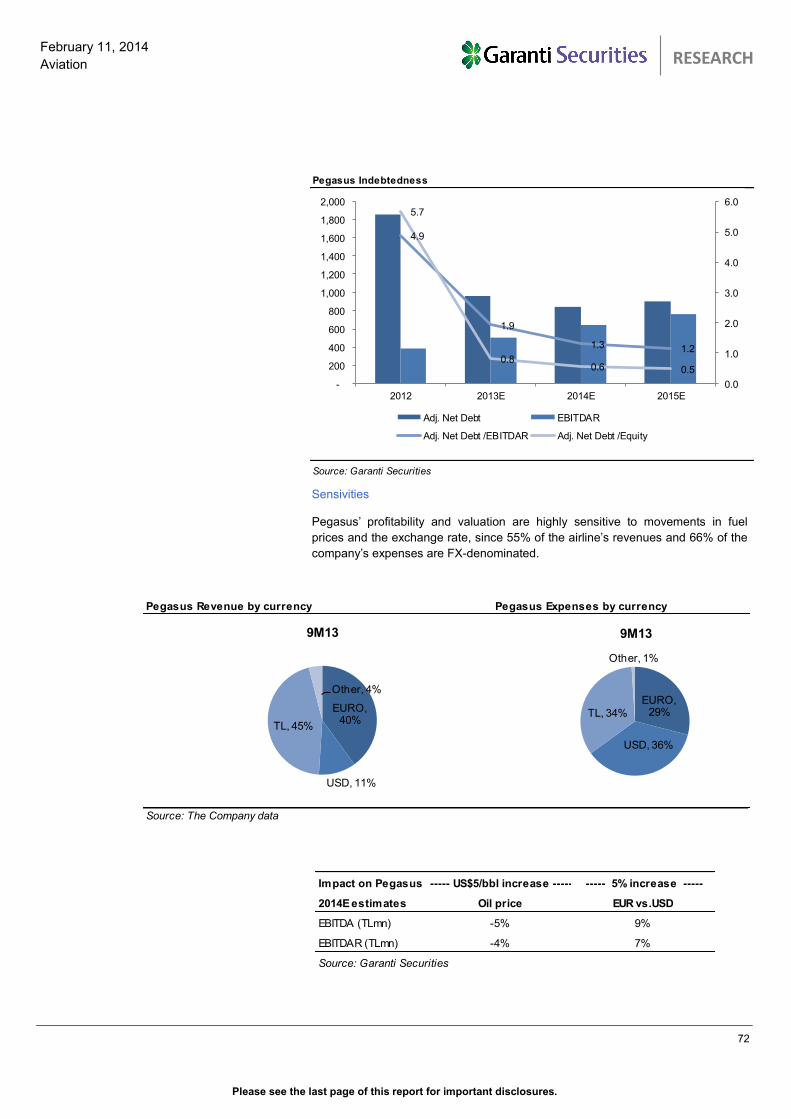
Please see the last page of this report for important disclosures.
72
February 11, 2014
Aviation
TURKISH AVIATION SECTOR
RESEARCH
Sensivities
Pegasus’ profitability and valuation are highly sensitive to movements in fuel
prices and the exchange rate, since 55% of the airline’s revenues and 66% of the
company’s expenses are FX-denominated.
Pegasus Indebtedness
Source: Garanti Securities
4.9
1.9
1.3 1.2
5.7
0.80.6 0.5
0.0
1.0
2.0
3.0
4.0
5.0
6.0
-
200
400
600
800
1,000
1,200
1,400
1,600
1,800
2,000
2012 2013E 2014E 2015E
Adj. Net Debt EBITDAR
Adj. Net Debt /EBITDAR Adj. Net Debt /Equity
Pegasus Revenue by currency Pegasus Expenses by currency
Source: The Company data
EURO, 40%
USD, 11%
TL, 45%
Other, 4%
9M13
EURO, 29%
USD, 36%
TL, 34%
Other, 1%
9M13
Impact on Pegasus ----- US$5/bbl increase ----- ----- 5% increase -----
2014E estimates Oil price EUR vs.USD
EBITDA (TLmn) -5% 9%
EBITDAR (TLmn) -4% 7%
Source: Garanti Securities
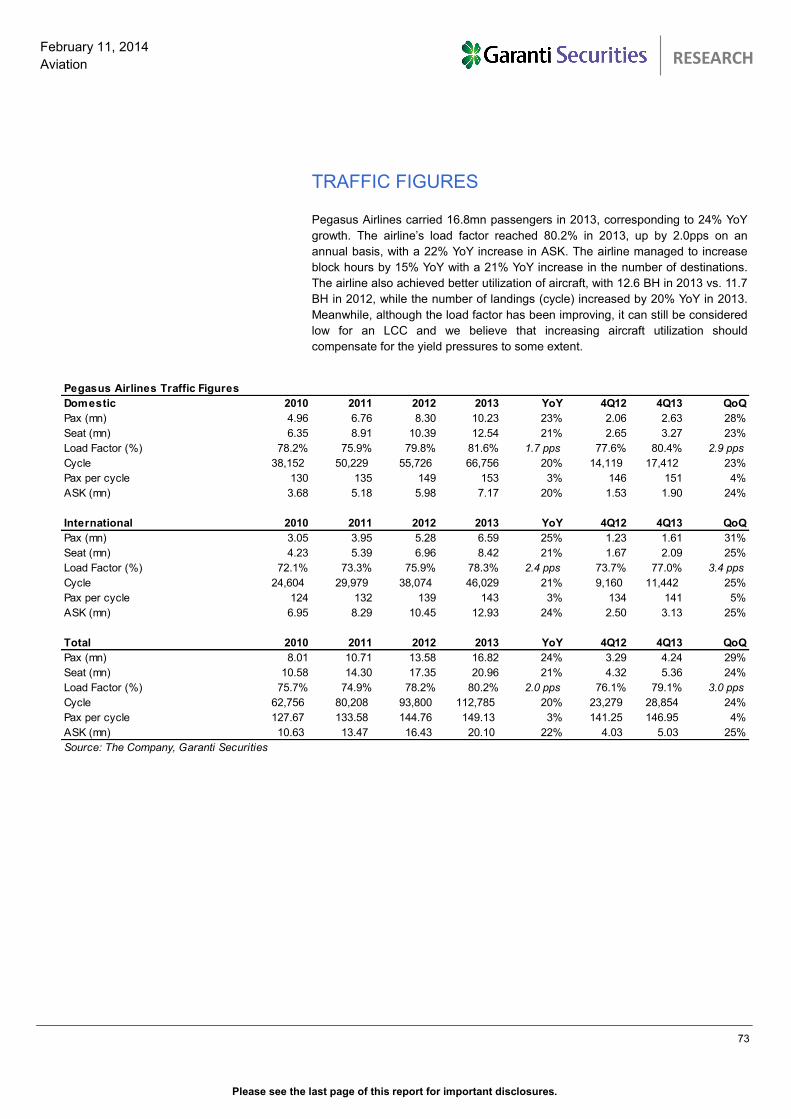
Please see the last page of this report for important disclosures.
73
February 11, 2014
Aviation
TURKISH AVIATION SECTOR
RESEARCH
TRAFFIC FIGURES
Pegasus Airlines carried 16.8mn passengers in 2013, corresponding to 24% YoY
growth. The airline’s load factor reached 80.2% in 2013, up by 2.0pps on an
annual basis, with a 22% YoY increase in ASK. The airline managed to increase
block hours by 15% YoY with a 21% YoY increase in the number of destinations.
The airline also achieved better utilization of aircraft, with 12.6 BH in 2013 vs. 11.7
BH in 2012, while the number of landings (cycle) increased by 20% YoY in 2013.
Meanwhile, although the load factor has been improving, it can still be considered
low for an LCC and we believe that increasing aircraft utilization should
compensate for the yield pressures to some extent.
Pegasus Airlines Traffic Figures
Domestic 2010 2011 2012 2013 YoY 4Q12 4Q13 QoQ
Pax (mn) 4.96 6.76 8.30 10.23 23% 2.06 2.63 28%
Seat (mn) 6.35 8.91 10.39 12.54 21% 2.65 3.27 23%
Load Factor (%) 78.2% 75.9% 79.8% 81.6% 1.7 pps 77.6% 80.4% 2.9 pps
Cycle 38,152 50,229 55,726 66,756 20% 14,119 17,412 23%
Pax per cycle 130 135 149 153 3% 146 151 4%
ASK (mn) 3.68 5.18 5.98 7.17 20% 1.53 1.90 24%
International 2010 2011 2012 2013 YoY 4Q12 4Q13 QoQ
Pax (mn) 3.05 3.95 5.28 6.59 25% 1.23 1.61 31%
Seat (mn) 4.23 5.39 6.96 8.42 21% 1.67 2.09 25%
Load Factor (%) 72.1% 73.3% 75.9% 78.3% 2.4 pps 73.7% 77.0% 3.4 pps
Cycle 24,604 29,979 38,074 46,029 21% 9,160 11,442 25%
Pax per cycle 124 132 139 143 3% 134 141 5%
ASK (mn) 6.95 8.29 10.45 12.93 24% 2.50 3.13 25%
Total 2010 2011 2012 2013 YoY 4Q12 4Q13 QoQ
Pax (mn) 8.01 10.71 13.58 16.82 24% 3.29 4.24 29%
Seat (mn) 10.58 14.30 17.35 20.96 21% 4.32 5.36 24%
Load Factor (%) 75.7% 74.9% 78.2% 80.2% 2.0 pps 76.1% 79.1% 3.0 pps
Cycle 62,756 80,208 93,800 112,785 20% 23,279 28,854 24%
Pax per cycle 127.67 133.58 144.76 149.13 3% 141.25 146.95 4%
ASK (mn) 10.63 13.47 16.43 20.10 22% 4.03 5.03 25%
Source: The Company, Garanti Securities
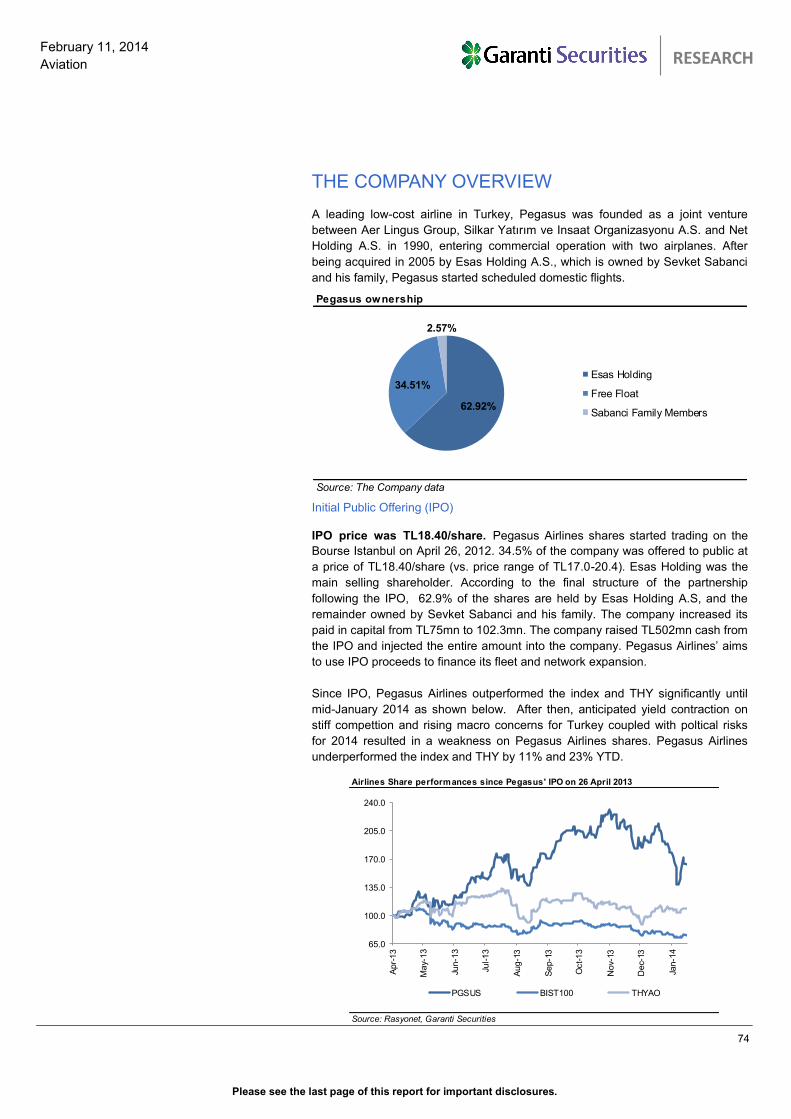
Please see the last page of this report for important disclosures.
74
February 11, 2014
Aviation
TURKISH AVIATION SECTOR
RESEARCH
THE COMPANY OVERVIEW A leading low-cost airline in Turkey, Pegasus was founded as a joint venture
between Aer Lingus Group, Silkar Yatırım ve Insaat Organizasyonu A.S. and Net
Holding A.S. in 1990, entering commercial operation with two airplanes. After
being acquired in 2005 by Esas Holding A.S., which is owned by Sevket Sabanci
and his family, Pegasus started scheduled domestic flights.
Initial Public Offering (IPO)
IPO price was TL18.40/share. Pegasus Airlines shares started trading on the
Bourse Istanbul on April 26, 2012. 34.5% of the company was offered to public at
a price of TL18.40/share (vs. price range of TL17.0-20.4). Esas Holding was the
main selling shareholder. According to the final structure of the partnership
following the IPO, 62.9% of the shares are held by Esas Holding A.S, and the
remainder owned by Sevket Sabanci and his family. The company increased its
paid in capital from TL75mn to 102.3mn. The company raised TL502mn cash from
the IPO and injected the entire amount into the company. Pegasus Airlines’ aims
to use IPO proceeds to finance its fleet and network expansion.
Since IPO, Pegasus Airlines outperformed the index and THY significantly until
mid-January 2014 as shown below. After then, anticipated yield contraction on
stiff compettion and rising macro concerns for Turkey coupled with poltical risks
for 2014 resulted in a weakness on Pegasus Airlines shares. Pegasus Airlines
underperformed the index and THY by 11% and 23% YTD.
Pegasus ownership
Source: The Company data
62.92%
34.51%
2.57%
Esas Holding
Free Float
Sabanci Family Members
Airlines Share performances since Pegasus' IPO on 26 April 2013
Source: Rasyonet, Garanti Securities
65.0
100.0
135.0
170.0
205.0
240.0
Apr-
13
May-
13
Jun-1
3
Jul-13
Aug-1
3
Sep-1
3
Oct-13
Nov-
13
Dec-
13
Jan-1
4
PGSUS BIST100 THYAOS
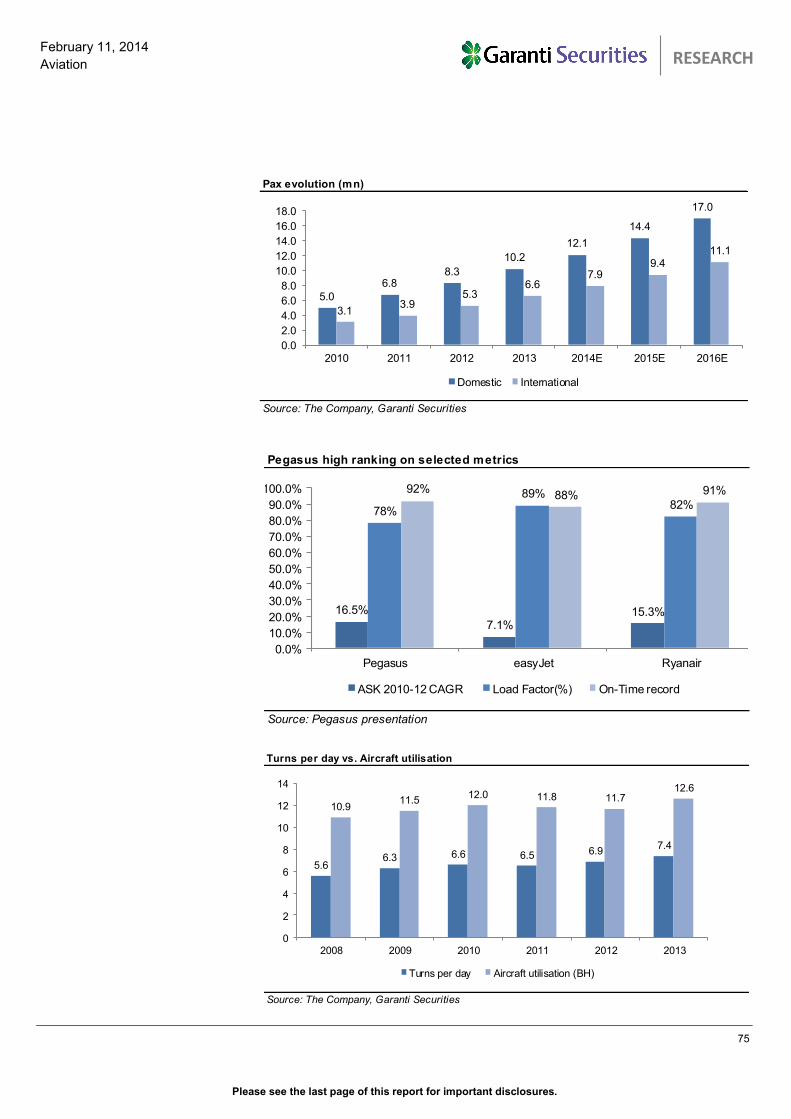
Please see the last page of this report for important disclosures.
75
February 11, 2014
Aviation
TURKISH AVIATION SECTOR
RESEARCH
Pegasus high ranking on selected metrics
Source: Pegasus presentation
16.5%
7.1%15.3%
78%
89%82%
92%88% 91%
0.0%
10.0%
20.0%
30.0%
40.0%
50.0%
60.0%
70.0%
80.0%
90.0%
100.0%
Pegasus easyJet Ryanair
ASK 2010-12 CAGR Load Factor(%) On-Time record
Turns per day vs. Aircraft utilisation
Source: The Company, Garanti Securities
5.66.3 6.6 6.5 6.9
7.4
10.911.5
12.0 11.8 11.712.6
0
2
4
6
8
10
12
14
2008 2009 2010 2011 2012 2013
Turns per day Aircraft utilisation (BH)
Pax evolution (mn)
Source: The Company, Garanti Securities
5.0
6.88.3
10.2
12.1
14.4
17.0
3.13.9
5.36.6
7.99.4
11.1
0.0
2.0
4.0
6.0
8.0
10.0
12.0
14.0
16.0
18.0
2010 2011 2012 2013 2014E 2015E 2016E
Domestic International
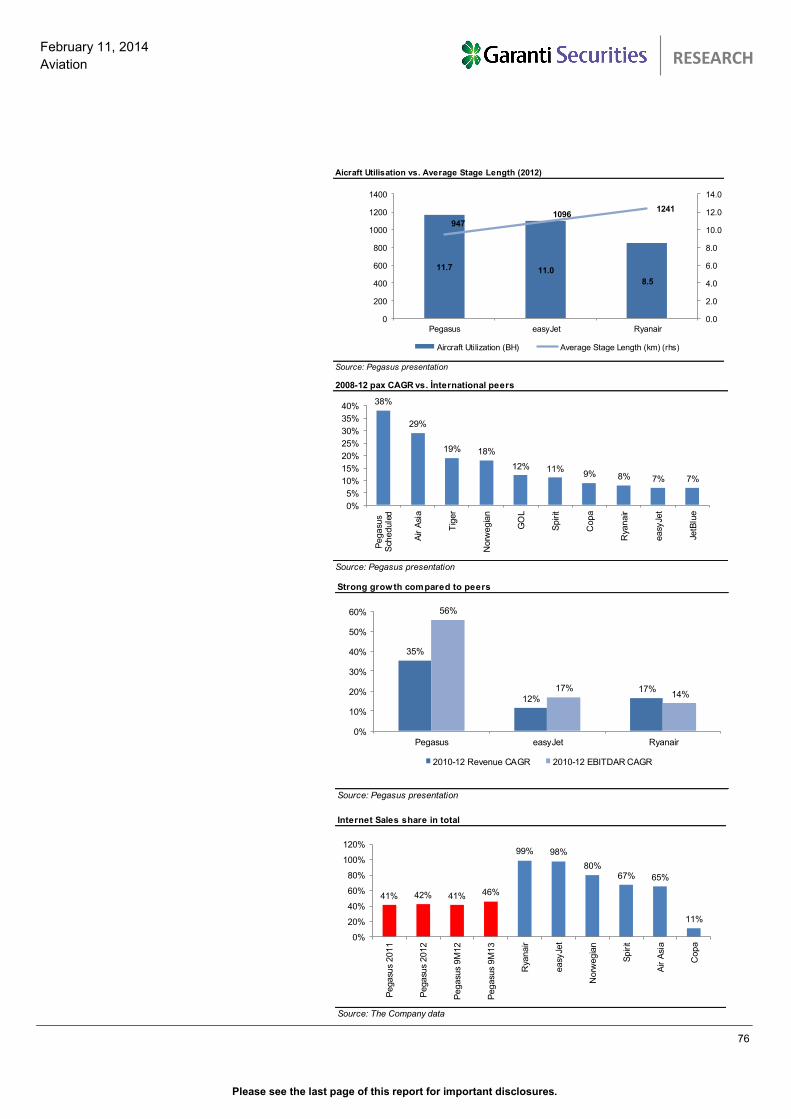
Please see the last page of this report for important disclosures.
76
February 11, 2014
Aviation
TURKISH AVIATION SECTOR
RESEARCH
Aicraft Utilisation vs. Average Stage Length (2012)
Source: Pegasus presentation
11.7 11.0
8.5
9471096
1241
0.0
2.0
4.0
6.0
8.0
10.0
12.0
14.0
0
200
400
600
800
1000
1200
1400
Pegasus easyJet Ryanair
Aircraft Utilization (BH) Average Stage Length (km) (rhs)
2008-12 pax CAGR vs. İnternational peers
Source: Pegasus presentation
38%
29%
19% 18%
12% 11%9% 8% 7% 7%
0%
5%
10%
15%
20%
25%
30%
35%
40%
Pegasu
sS
chedule
d
Air A
sia
Tig
er
Norw
egia
n
GO
L
Spirit
Copa
Rya
nair
easy
Jet
JetB
lue
Strong growth compared to peers
Source: Pegasus presentation
Source: Pegasus presentation
35%
12%17%
56%
17%14%
0%
10%
20%
30%
40%
50%
60%
Pegasus easyJet Ryanair
2010-12 Revenue CAGR 2010-12 EBITDAR CAGR
Internet Sales share in total
Source: The Company data
41% 42% 41% 46%
99% 98%
80%67% 65%
11%
0%
20%
40%
60%
80%
100%
120%
Pegasu
s 2
011
Pegasu
s 2
012
Pegasu
s 9
M12
Pegasu
s 9
M13
Rya
nair
easy
Jet
Norw
egia
n
Spirit
Air A
sia
Copa
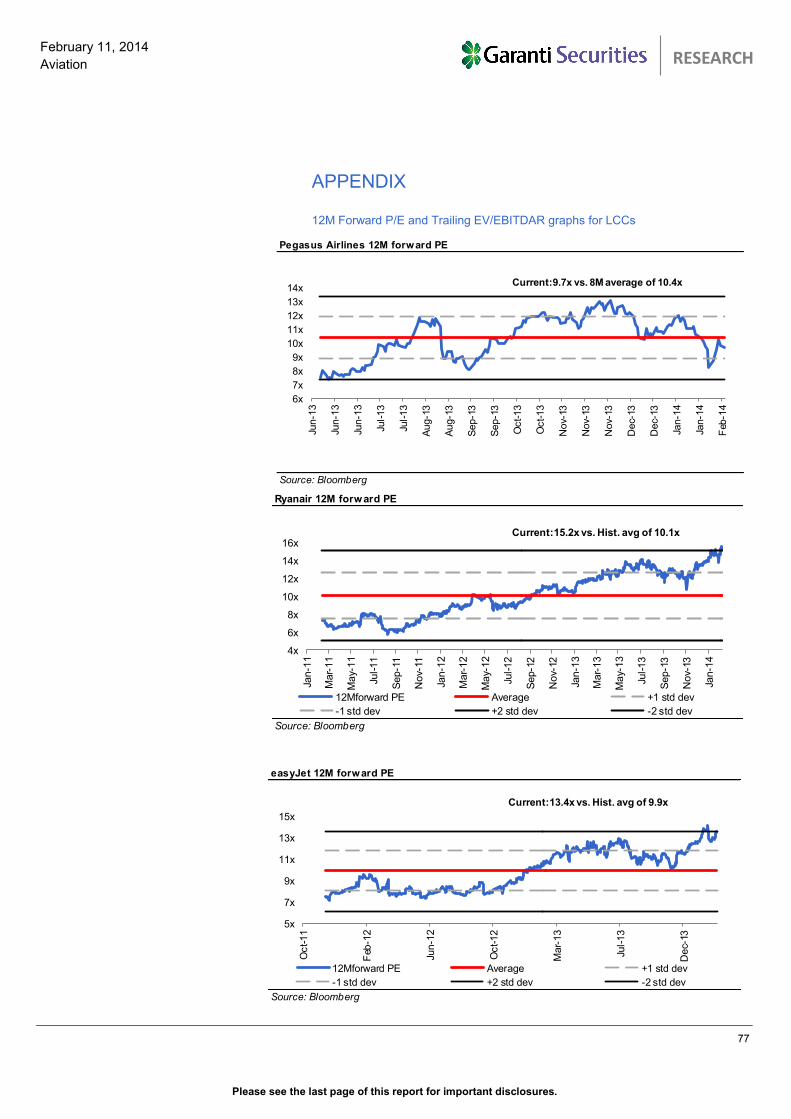
Please see the last page of this report for important disclosures.
77
February 11, 2014
Aviation
TURKISH AVIATION SECTOR
RESEARCH
APPENDIX 12M Forward P/E and Trailing EV/EBITDAR graphs for LCCs
Pegasus Airlines 12M forward PE
Source: Bloomberg
6x
7x
8x
9x
10x
11x
12x
13x
14x
Jun-1
3
Jun-1
3
Jun-1
3
Jul-13
Jul-13
Aug-1
3
Aug-1
3
Sep-1
3
Sep-1
3
Oct-13
Oct-13
Nov-
13
Nov-
13
Nov-
13
Dec-
13
Dec-
13
Jan-1
4
Jan-1
4
Feb
-14
Current:9.7x vs. 8M average of 10.4x
Ryanair 12M forward PE
Source: Bloomberg
4x
6x
8x
10x
12x
14x
16x
Jan-1
1
Mar-
11
May-
11
Jul-11
Sep-1
1
Nov-
11
Jan-1
2
Mar-
12
May-
12
Jul-12
Sep-1
2
Nov-
12
Jan-1
3
Mar-
13
May-
13
Jul-13
Sep-1
3
Nov-
13
Jan-1
412Mforward PE Average +1 std dev
-1 std dev +2 std dev -2 std dev
Current:15.2x vs. Hist. avg of 10.1x
easyJet 12M forward PE
Source: Bloomberg
5x
7x
9x
11x
13x
15x
Oct-11
Feb
-12
Jun-1
2
Oct-12
Mar-
13
Jul-13
Dec-
13
12Mforward PE Average +1 std dev
-1 std dev +2 std dev -2 std dev
Current:13.4x vs. Hist. avg of 9.9x
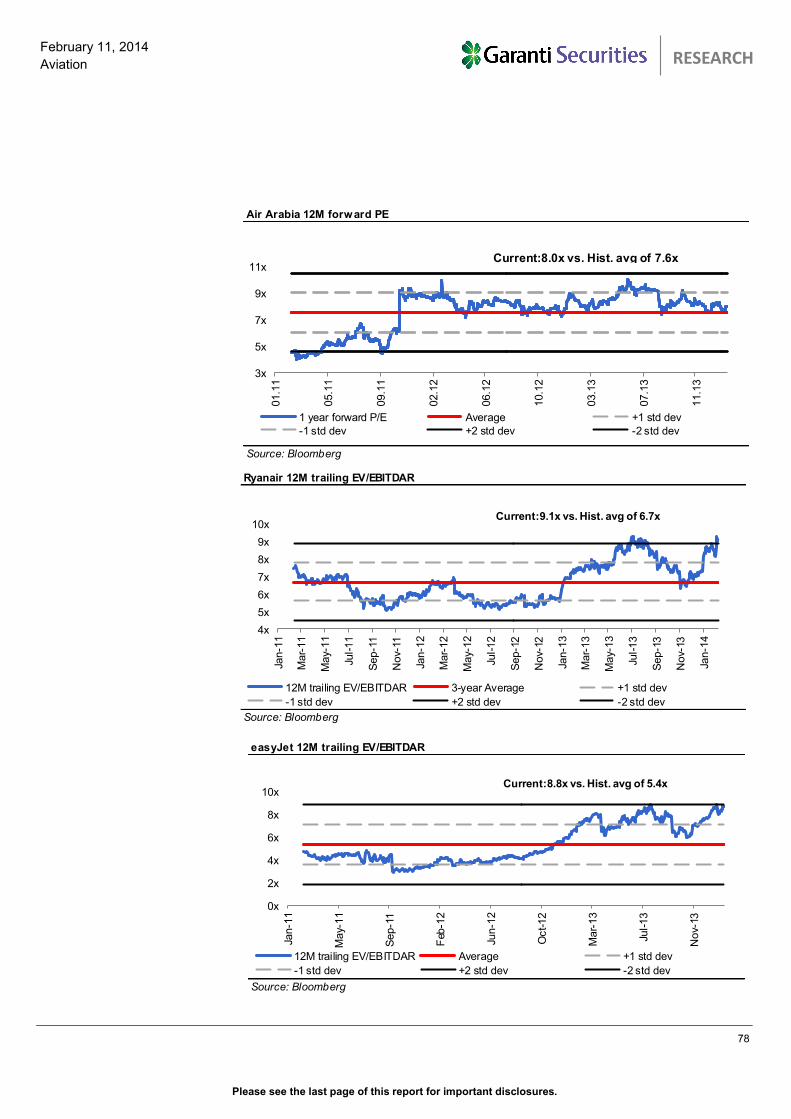
Please see the last page of this report for important disclosures.
78
February 11, 2014
Aviation
TURKISH AVIATION SECTOR
RESEARCH
Air Arabia 12M forward PE
Source: Bloomberg
3x
5x
7x
9x
11x01.1
1
05.1
1
09.1
1
02.1
2
06.1
2
10.1
2
03.1
3
07.1
3
11.1
3
1 year forward P/E Average +1 std dev
-1 std dev +2 std dev -2 std dev
Current:8.0x vs. Hist. avg of 7.6x
Ryanair 12M trailing EV/EBITDAR
Source: Bloomberg
4x
5x
6x
7x
8x
9x
10x
Jan-1
1
Mar-
11
May-
11
Jul-11
Sep-1
1
Nov-
11
Jan-1
2
Mar-
12
May-
12
Jul-12
Sep-1
2
Nov-
12
Jan-1
3
Mar-
13
May-
13
Jul-13
Sep-1
3
Nov-
13
Jan-1
4
12M trailing EV/EBITDAR 3-year Average +1 std dev
-1 std dev +2 std dev -2 std dev
Current:9.1x vs. Hist. avg of 6.7x
easyJet 12M trailing EV/EBITDAR
Source: Bloomberg
0x
2x
4x
6x
8x
10x
Jan-1
1
May-
11
Sep-1
1
Feb
-12
Jun-1
2
Oct-12
Mar-
13
Jul-13
Nov-
13
12M trailing EV/EBITDAR Average +1 std dev
-1 std dev +2 std dev -2 std dev
Current:8.8x vs. Hist. avg of 5.4x
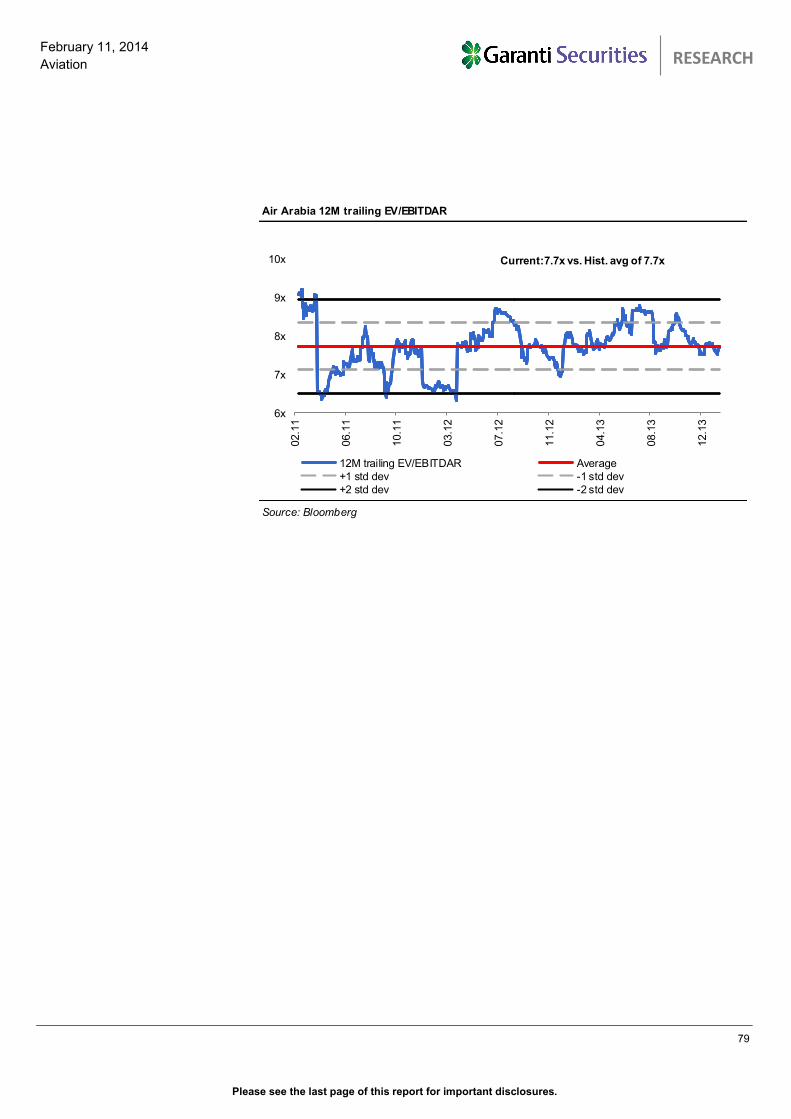
Please see the last page of this report for important disclosures.
79
February 11, 2014
Aviation
TURKISH AVIATION SECTOR
RESEARCH
Air Arabia 12M trailing EV/EBITDAR
Source: Bloomberg
6x
7x
8x
9x
10x
02.1
1
06.1
1
10.1
1
03.1
2
07.1
2
11.1
2
04.1
3
08.1
3
12.1
3
12M trailing EV/EBITDAR Average
+1 std dev -1 std dev
+2 std dev -2 std dev
Current:7.7x vs. Hist. avg of 7.7x
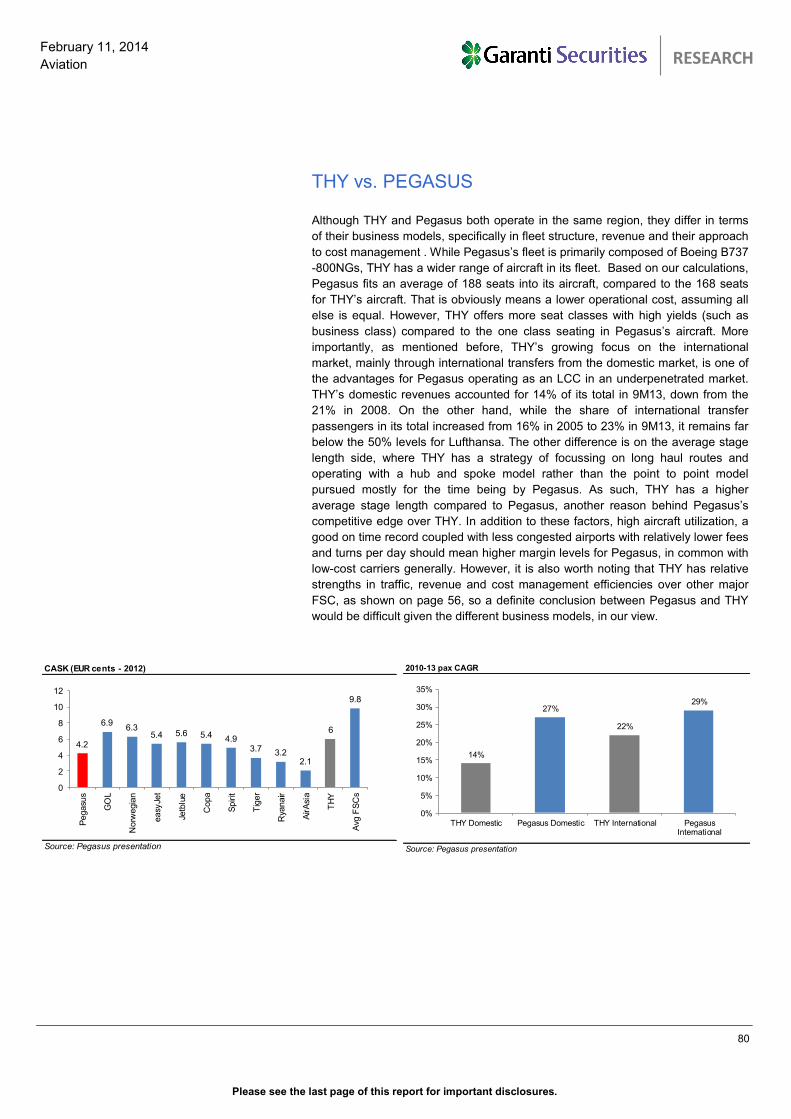
Please see the last page of this report for important disclosures.
80
February 11, 2014
Aviation
TURKISH AVIATION SECTOR
RESEARCH
THY vs. PEGASUS Although THY and Pegasus both operate in the same region, they differ in terms
of their business models, specifically in fleet structure, revenue and their approach
to cost management . While Pegasus’s fleet is primarily composed of Boeing B737
-800NGs, THY has a wider range of aircraft in its fleet. Based on our calculations,
Pegasus fits an average of 188 seats into its aircraft, compared to the 168 seats
for THY’s aircraft. That is obviously means a lower operational cost, assuming all
else is equal. However, THY offers more seat classes with high yields (such as
business class) compared to the one class seating in Pegasus’s aircraft. More
importantly, as mentioned before, THY’s growing focus on the international
market, mainly through international transfers from the domestic market, is one of
the advantages for Pegasus operating as an LCC in an underpenetrated market.
THY’s domestic revenues accounted for 14% of its total in 9M13, down from the
21% in 2008. On the other hand, while the share of international transfer
passengers in its total increased from 16% in 2005 to 23% in 9M13, it remains far
below the 50% levels for Lufthansa. The other difference is on the average stage
length side, where THY has a strategy of focussing on long haul routes and
operating with a hub and spoke model rather than the point to point model
pursued mostly for the time being by Pegasus. As such, THY has a higher
average stage length compared to Pegasus, another reason behind Pegasus’s
competitive edge over THY. In addition to these factors, high aircraft utilization, a
good on time record coupled with less congested airports with relatively lower fees
and turns per day should mean higher margin levels for Pegasus, in common with
low-cost carriers generally. However, it is also worth noting that THY has relative
strengths in traffic, revenue and cost management efficiencies over other major
FSC, as shown on page 56, so a definite conclusion between Pegasus and THY
would be difficult given the different business models, in our view.
2010-13 pax CAGR
Source: Pegasus presentation
14%
27%
22%
29%
0%
5%
10%
15%
20%
25%
30%
35%
THY Domestic Pegasus Domestic THY International PegasusInternational
CASK (EUR cents - 2012)
Source: Pegasus presentation
4.2
6.96.3
5.4 5.6 5.4 4.93.7 3.2
2.1
6
9.8
0
2
4
6
8
10
12
Pegasu
s
GO
L
Norw
egia
n
easy
Jet
Jetb
lue
Copa
Spirit
Tig
er
Rya
nair
AirA
sia
TH
Y
Avg
FS
Cs
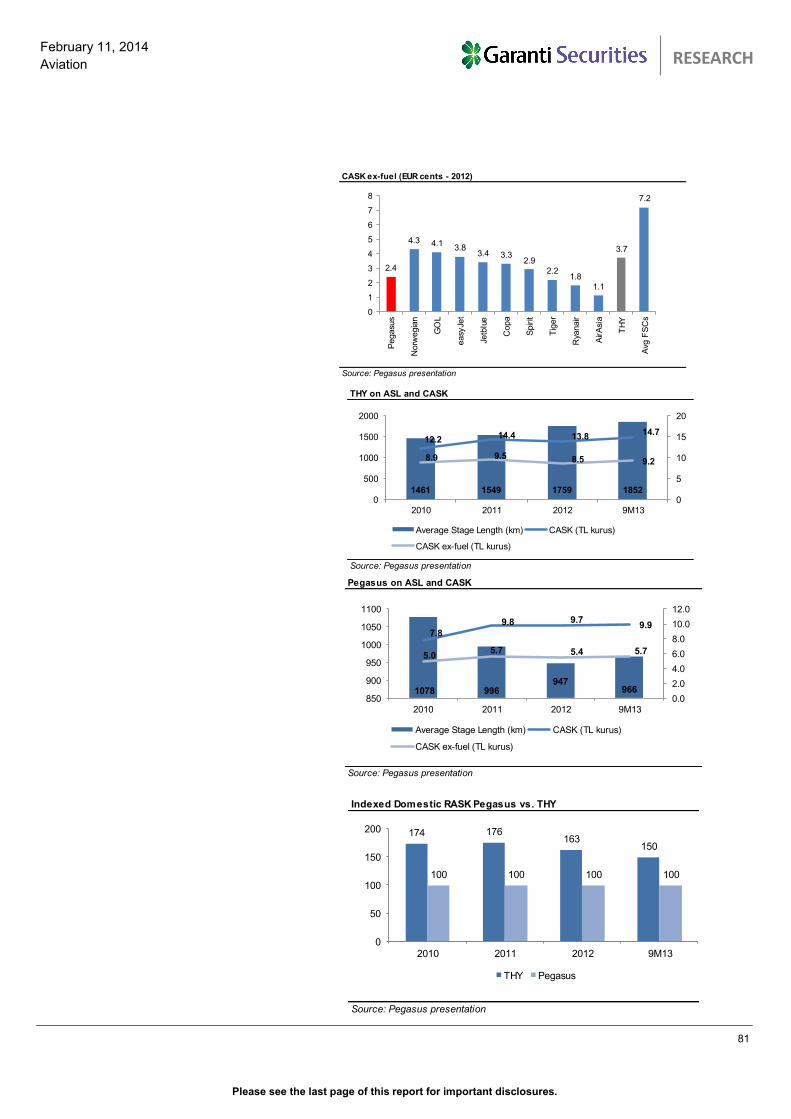
Please see the last page of this report for important disclosures.
81
February 11, 2014
Aviation
TURKISH AVIATION SECTOR
RESEARCH
CASK ex-fuel (EUR cents - 2012)
Source: Pegasus presentation
2.4
4.3 4.13.8
3.4 3.32.9
2.21.8
1.1
3.7
7.2
0
1
2
3
4
5
6
7
8
Pegasu
s
Norw
egia
n
GO
L
easy
Jet
Jetb
lue
Copa
Spirit
Tig
er
Rya
nair
AirA
sia
TH
Y
Avg
FS
Cs
Pegasus on ASL and CASK
Source: Pegasus presentation
1078 996947
966
7.8
9.8 9.79.9
5.05.7 5.4 5.7
0.0
2.0
4.0
6.0
8.0
10.0
12.0
850
900
950
1000
1050
1100
2010 2011 2012 9M13
Average Stage Length (km) CASK (TL kurus)
CASK ex-fuel (TL kurus)
Indexed Domestic RASK Pegasus vs. THY
Source: Pegasus presentation
174 176163
150
100 100 100 100
0
50
100
150
200
2010 2011 2012 9M13
THY Pegasus
THY on ASL and CASK
Source: Pegasus presentation
1461 1549 1759 1852
12.2 14.4 13.814.7
8.9 9.5 8.5 9.2
0
5
10
15
20
0
500
1000
1500
2000
2010 2011 2012 9M13
Average Stage Length (km) CASK (TL kurus)
CASK ex-fuel (TL kurus)
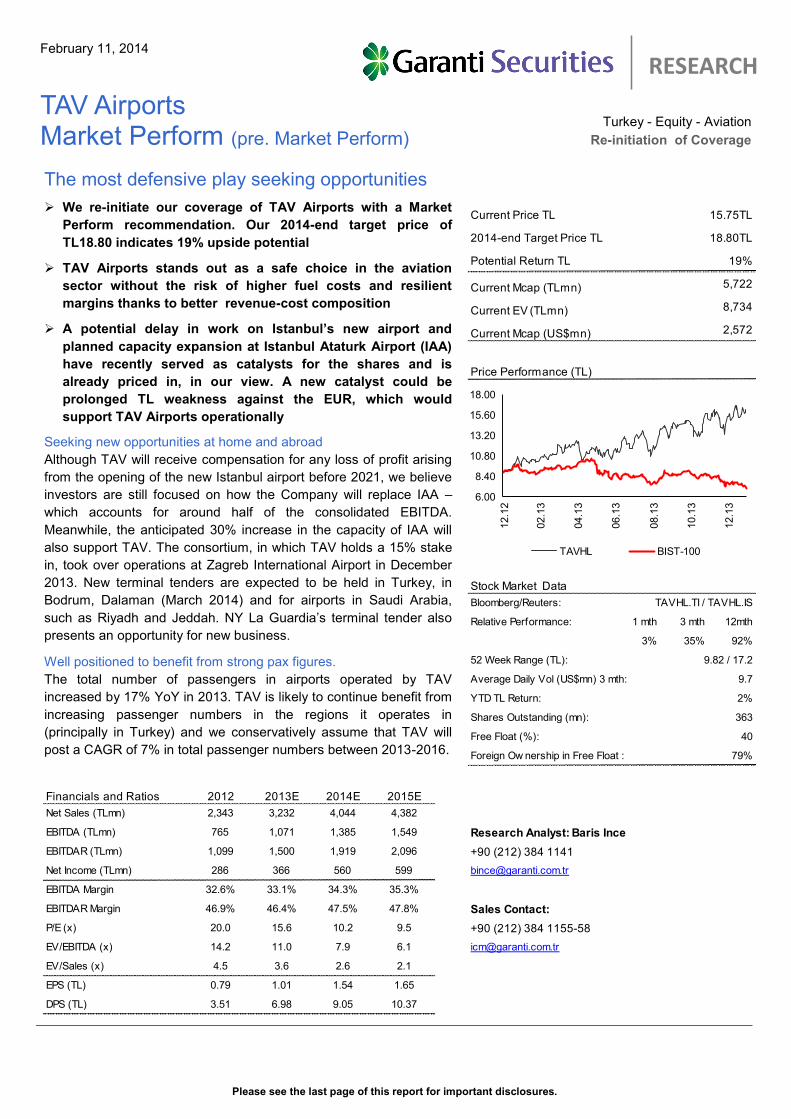
Please see the last page of this report for important disclosures.
RESEARCH
February 11, 2014
TAV Airports Market Perform (pre. Market Perform)
Current Price TL 15.75TL
2014-end Target Price TL 18.80TL
Potential Return TL 19%
Current Mcap (TLmn) 5,722
Current EV (TLmn) 8,734
2,572
Bloomberg/Reuters:
1 mth 3 mth 12mth
3% 35% 92%
9.7
YTD TL Return: 2%
363
Free Float (%): 40
79%
Financials and Ratios 2012 2013E 2014E 2015E
Net Sales (TLmn) 2,343 3,232 4,044 4,382
EBITDA (TLmn) 765 1,071 1,385 1,549 Research Analyst: Baris Ince
EBITDAR (TLmn) 1,099 1,500 1,919 2,096 +90 (212) 384 1141
Net Income (TLmn) 286 366 560 599 [email protected]
EBITDA Margin 32.6% 33.1% 34.3% 35.3%
EBITDAR Margin 46.9% 46.4% 47.5% 47.8% Sales Contact:
P/E (x) 20.0 15.6 10.2 9.5 +90 (212) 384 1155-58
EV/EBITDA (x) 14.2 11.0 7.9 6.1 [email protected]
EV/Sales (x) 4.5 3.6 2.6 2.1
EPS (TL) 0.79 1.01 1.54 1.65
DPS (TL) 3.51 6.98 9.05 10.37
Foreign Ow nership in Free Float :
Stock Market Data
TAVHL.TI / TAVHL.IS
Relative Performance:
52 Week Range (TL): 9.82 / 17.2
Average Daily Vol (US$mn) 3 mth:
Shares Outstanding (mn):
Current Mcap (US$mn)
Price Performance (TL)
6.00
8.40
10.80
13.20
15.60
18.00
12.1
2
02.1
3
04.1
3
06.1
3
08.1
3
10.1
3
12.1
3
TAVHL BIST-100
The most defensive play seeking opportunities
We re-initiate our coverage of TAV Airports with a Market
Perform recommendation. Our 2014-end target price of
TL18.80 indicates 19% upside potential
TAV Airports stands out as a safe choice in the aviation
sector without the risk of higher fuel costs and resilient
margins thanks to better revenue-cost composition
A potential delay in work on Istanbul’s new airport and
planned capacity expansion at Istanbul Ataturk Airport (IAA)
have recently served as catalysts for the shares and is
already priced in, in our view. A new catalyst could be
prolonged TL weakness against the EUR, which would
support TAV Airports operationally
Seeking new opportunities at home and abroad
Although TAV will receive compensation for any loss of profit arising
from the opening of the new Istanbul airport before 2021, we believe
investors are still focused on how the Company will replace IAA –
which accounts for around half of the consolidated EBITDA.
Meanwhile, the anticipated 30% increase in the capacity of IAA will
also support TAV. The consortium, in which TAV holds a 15% stake
in, took over operations at Zagreb International Airport in December
2013. New terminal tenders are expected to be held in Turkey, in
Bodrum, Dalaman (March 2014) and for airports in Saudi Arabia,
such as Riyadh and Jeddah. NY La Guardia’s terminal tender also
presents an opportunity for new business.
Well positioned to benefit from strong pax figures.
The total number of passengers in airports operated by TAV
increased by 17% YoY in 2013. TAV is likely to continue benefit from
increasing passenger numbers in the regions it operates in
(principally in Turkey) and we conservatively assume that TAV will
post a CAGR of 7% in total passenger numbers between 2013-2016.
Turkey - Equity - Aviation
Re-initiation of Coverage
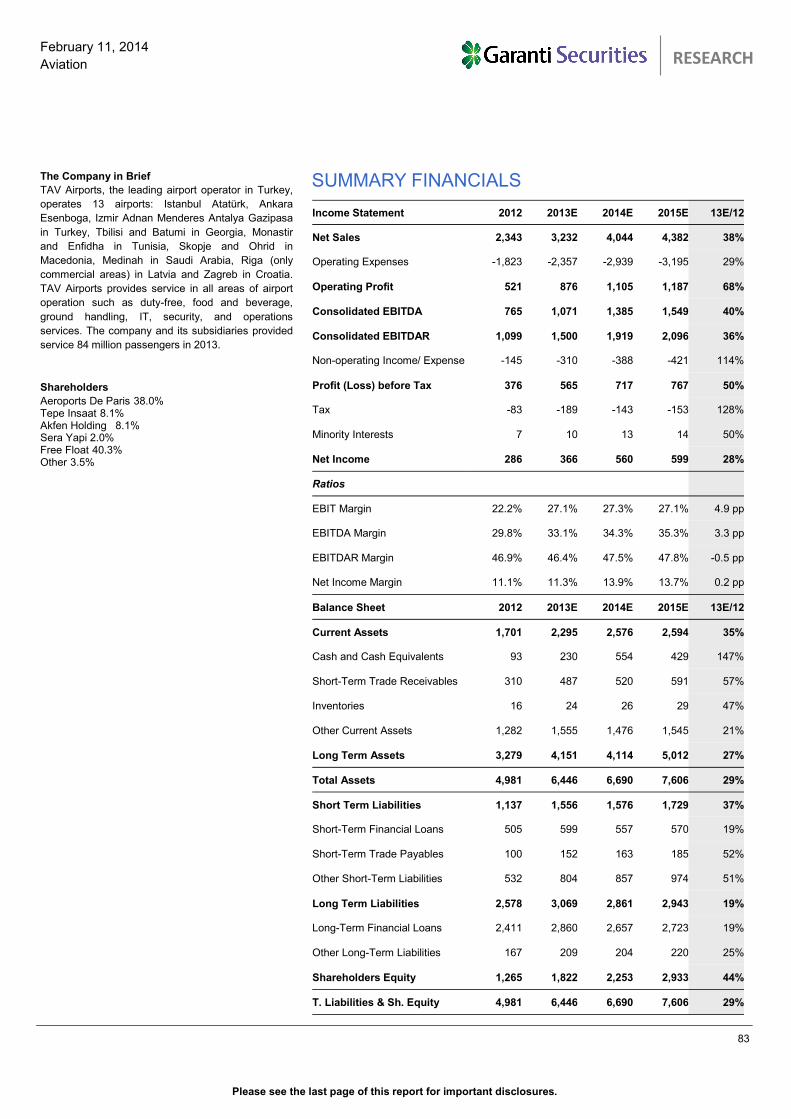
Please see the last page of this report for important disclosures.
83
February 11, 2014
Aviation
TURKISH AVIATION SECTOR
RESEARCH
SUMMARY FINANCIALS The Company in Brief
TAV Airports, the leading airport operator in Turkey,
operates 13 airports: Istanbul Atatürk, Ankara
Esenboga, Izmir Adnan Menderes Antalya Gazipasa
in Turkey, Tbilisi and Batumi in Georgia, Monastir
and Enfidha in Tunisia, Skopje and Ohrid in
Macedonia, Medinah in Saudi Arabia, Riga (only
commercial areas) in Latvia and Zagreb in Croatia.
TAV Airports provides service in all areas of airport
operation such as duty-free, food and beverage,
ground handling, IT, security, and operations
services. The company and its subsidiaries provided
service 84 million passengers in 2013.
Shareholders
Aeroports De Paris 38.0% Tepe Insaat 8.1% Akfen Holding 8.1% Sera Yapi 2.0% Free Float 40.3% Other 3.5%
Income Statement 2012 2013E 2014E 2015E 13E/12
Net Sales 2,343 3,232 4,044 4,382 38%
Operating Expenses -1,823 -2,357 -2,939 -3,195 29%
Operating Profit 521 876 1,105 1,187 68%
Consolidated EBITDA 765 1,071 1,385 1,549 40%
Consolidated EBITDAR 1,099 1,500 1,919 2,096 36%
Non-operating Income/ Expense -145 -310 -388 -421 114%
Profit (Loss) before Tax 376 565 717 767 50%
Tax -83 -189 -143 -153 128%
Minority Interests 7 10 13 14 50%
Net Income 286 366 560 599 28%
Ratios
EBIT Margin 22.2% 27.1% 27.3% 27.1% 4.9 pp
EBITDA Margin 29.8% 33.1% 34.3% 35.3% 3.3 pp
EBITDAR Margin 46.9% 46.4% 47.5% 47.8% -0.5 pp
Net Income Margin 11.1% 11.3% 13.9% 13.7% 0.2 pp
Balance Sheet 2012 2013E 2014E 2015E 13E/12
Current Assets 1,701 2,295 2,576 2,594 35%
Cash and Cash Equivalents 93 230 554 429 147%
Short-Term Trade Receivables 310 487 520 591 57%
Inventories 16 24 26 29 47%
Other Current Assets 1,282 1,555 1,476 1,545 21%
Long Term Assets 3,279 4,151 4,114 5,012 27%
Total Assets 4,981 6,446 6,690 7,606 29%
Short Term Liabilities 1,137 1,556 1,576 1,729 37%
Short-Term Financial Loans 505 599 557 570 19%
Short-Term Trade Payables 100 152 163 185 52%
Other Short-Term Liabilities 532 804 857 974 51%
Long Term Liabilities 2,578 3,069 2,861 2,943 19%
Long-Term Financial Loans 2,411 2,860 2,657 2,723 19%
Other Long-Term Liabilities 167 209 204 220 25%
Shareholders Equity 1,265 1,822 2,253 2,933 44%
T. Liabilities & Sh. Equity 4,981 6,446 6,690 7,606 29%
Please see the last page of this report for important disclosures.
84
February 11, 2014
Aviation
TURKISH AVIATION SECTOR
RESEARCH
Investment Positives
Well positioned to benefit from strong passenger volumes in growing markets
TAV Airports, the leading airport operator in Turkey, operates 13 airports (4 in
Turkey, 2 in Georgia, 2 in Tunisia, 2 in Macedonia, one in Saudi Arabia, one in
Latvia and one in Croatia). TAV Airports provides services in all areas of airport
operations such as duty free, food and beverage, ground handling, IT, security and
operations services. Going forward, we believe the outlook for traffic growth in the
regions where TAV Airports operates remains positive thanks to the
underpenetrated nature of the air traffic market in the high growth regions. The
Turkish aviation industry has demonstrated an outstanding performance on the
back of strong pax growth following the market deregulation in 2003. Between
2007 and 2013, period, total pax numbers in the Turkish aviation market increased
at a CAGR of 13% to reach 150mn. TAV Airports’ pax numbers increased at a
CAGR of 19% between 2007-2013. Outside Turkey, there was eye-catching
growth in passenger numbers in Macedonia (17%) and Georgia (18%) in 2013.
Overall, TAV Airports registered 17% pax growth in 2013 to reach a count of
84mn, with domestic passengers accounting for 43% of total pax.
Seeking new opportunities coupled with synergies with Aeroport de Paris
We expect TAV Airports, together with its main shareholder, Aeroports de Paris, to
seek new business opportunities both in Turkey and abroad. Aeroport de Paris
and TAV Airports now offer a global footprint with a platform of 37 airports under
management representing 200mn pax. The extensive know-how of both
companies in airport management and operations will enhance the
competitiveness of the duo in forthcoming tenders. The consortium, in which TAV
Airports holds a 15% stake, recently took over operations at the relatively small
Zagreb International Airport on December 5,2013. The Consortium will incur capex
until the end of 2016, increasing the airport’s capacity from 2mn to 5mn; the
capacity is eventually projected to increase to 8mn. New terminal tenders are
expected to held in Turkey like Bodrum, Dalaman (in March 2014) and for Saudi
Arabian cities like Riyadh and Jeddah. Dalaman and Bodrum airports served
7.7mn passengers in 2013, indicating 5% YoY growth. We expect TAV Airports to
participate in the tender but we believe the competition will be fierce - as observed
in Istanbul’s third airport tender back in May 2013, when TAV Airports placed the
third best offer. Furthermore, the company has shown an interest in the Indian
GMR’s entire 40% stake in Istanbul’s second largest airport, Sabiha Gokcen
Airport (SAW), but in regard to first right of refusal, the other partner in SAW -
Malaysia Airports - acquired the 40% stake for EUR225mn. We would also note
that La Guardia’s terminal improvement and management tender could prove
another source of new business. On a separate note, TAV Construction (not a
subsidiary but has same shareholder) is the world’s second largest airport
construction company, principally active in the MENA region, which could provide
opportunities for TAV Airports.
Please see the last page of this report for important disclosures.
85
February 11, 2014
Aviation
TURKISH AVIATION SECTOR
RESEARCH
A relatively defensive business in airline sector
We believe TAV Airports has a diversified balanced portfolio both operationally and
regionally. As mentioned before, TAV Airports has a presence in six different
countries where are underpenetrated in terms of air traffic, delivering above
average growth in passenger volumes which reduces country specific risks to
some extent. Furthermore, the company is exposed to both non-cyclical
operations (such as terminal operation and ground handling) as well as highly
cyclical operations (such as duty-free, food and beverage). Thanks to this
composition of operations, oil price fluctuations do not present a major risk for TAV
Airports, in contrast with airlines.
Operational leverage
Once the major investments in airport construction are completed, the majority of
cash cost become fixed as rent expenses with no immediate need for additional
recruitment due to surging passenger volumes. Rental expenses and personnel
expenses constitute 14% and 21% of total revenues, respectively. Therefore, by
the nature of business, growing volumes mean increasing operational leverage;
and we believe this is the main reason behind the improvement in EBITDA (a 50%
CAGR between 2006 and 2012) while revenues recorded an 18% CAGR during
the same period.
Capacity increase at Istanbul Ataturk Airport (IAA) is another plus
IAA is the flagship of TAV Airports, accounting for 36% of overall revenues and
61% of total passengers in 2013. In addition, IAA provides almost half of TAV
Airports’ consolidated EBITDA. Therefore, we attach more importance to IAA
regarding TAV Airports’ profitability. According to our calculations every 1%
increase on top of our 2013-2020E CAGR estimate of 5% in total pax of IAA
increases our target Mcap of TAV Airports by 2%. IAA served 51mn passengers in
2013 (up 15% YoY), just short of its 60-65mn capacity. However, the capacity
constraint is less of concern now as the government plans to increase the capacity
at the airport by 30%. We incorporate the above mentioned capacity
enhancements and forecast that pax numbers at IAA will rise to 73mn by 2020.
Investment Negatives
Lower than expected organic growth
The global economic slowdown has had a negative impact on the entire aviation
industry, including airport operators, through lower air traffic activities. A slowdown
in air traffic could be considered as the major risk for TAV Airports. On the other
hand, as most of TAV Airports’ investments have been completed in previous
years, and given that most of the countries where the company has a presence in
are developing countries, we believe TAV Airports is in a relatively advantageous
position. Although we believe there are strong growth prospects in terms of
passenger numbers and air traffic movement at the airports where TAV Airports
operates, the airline sector does face a number of risks such as terrorist attacks,
wars and natural disasters which could curb demand for air travel at any time,
curtailing the company’s organic growth. Hence, our valuation is obviously highly
sensitive to passenger growth forecasts.
Please see the last page of this report for important disclosures.
86
February 11, 2014
Aviation
TURKISH AVIATION SECTOR
RESEARCH
The difficulty of replacing IAA and its high dependence on the airport
Based on our assumptions, IAA accounts for 45% of our target net asset value.
TAV Airports hold the concession for IAA until 2021; however, IAA will be closed to
scheduled flights when Istanbul’s new airport enters operation. Although TAV
Airports will receive compensation for any loss of profit arising from the opening of
the new Istanbul airport opening before 2021, we believe investors are still
focused on how the Company will replace Istanbul Ataturk Airport. Although the
Aeroport de Paris partnership provides a global footprint when it comes to seeking
opportunities, we believe it could prove extremely difficult to find an asset to
compensate IAA’s profitability, as the tenders mentioned above on page 84 do not
offer the degree of growth offered by IAA, or add value to TAV Airports to any
extent comparable to IAA. High dependence on IAA is also means a high
dependence on THY’s business, since THY accounts for almost 75% of IAA pax
volumes.
Country specific risks
Operating in seven different countries, TAV Airports is vulnerable to country
specific risks such as political, regional and economic risks. For example, the
ongoing civil unrest in Tunisia limits the visibility of its operations there. We would
not rule out potential political tensions between Russia and Georgia, or regional
risks in Syria, Iraq or Iran.
Exposure to the retail business
Since the share of the retail business (duty-free and food & beverage) in total
revenues has been increasing, a deterioration in demand would result in lower
than expected revenues and could leave the company less resilient in the face of
economic downturns.
VALUATION
Sum-of-the-Part (SOTP) Valuation
2014-end target price of TL18.80/share. We value TAV Airports using sum-of
the parts (SOTP) analysis based on target Net Asset Value (NAV). We employed
DCF analysis to value each of the Company’s operations separately. Our valua-
tion is solely based on DCF, as we believe DCF analysis is the most appropriate
means of reflecting TAV Airports’ long-term growth potential as well as TAV Air-
ports’ well designed structure. We only valued TAV Airports’ existing airport opera-
tions, not taking into account any terminal value and assuming that the Company
would neither win any new tenders, nor would it be awarded another term upon
expiry of its current concession agreements. On the other hand, as the services
companies’ operations will not end with the expiry of operating rights at the air-
ports, we did include a terminal value in calculating the value of the services com-
panies. We put HAVAS to our valuation on its transaction value in late 2012. TAV
had paid EUR80mn for 35% of HAVAS at that time.
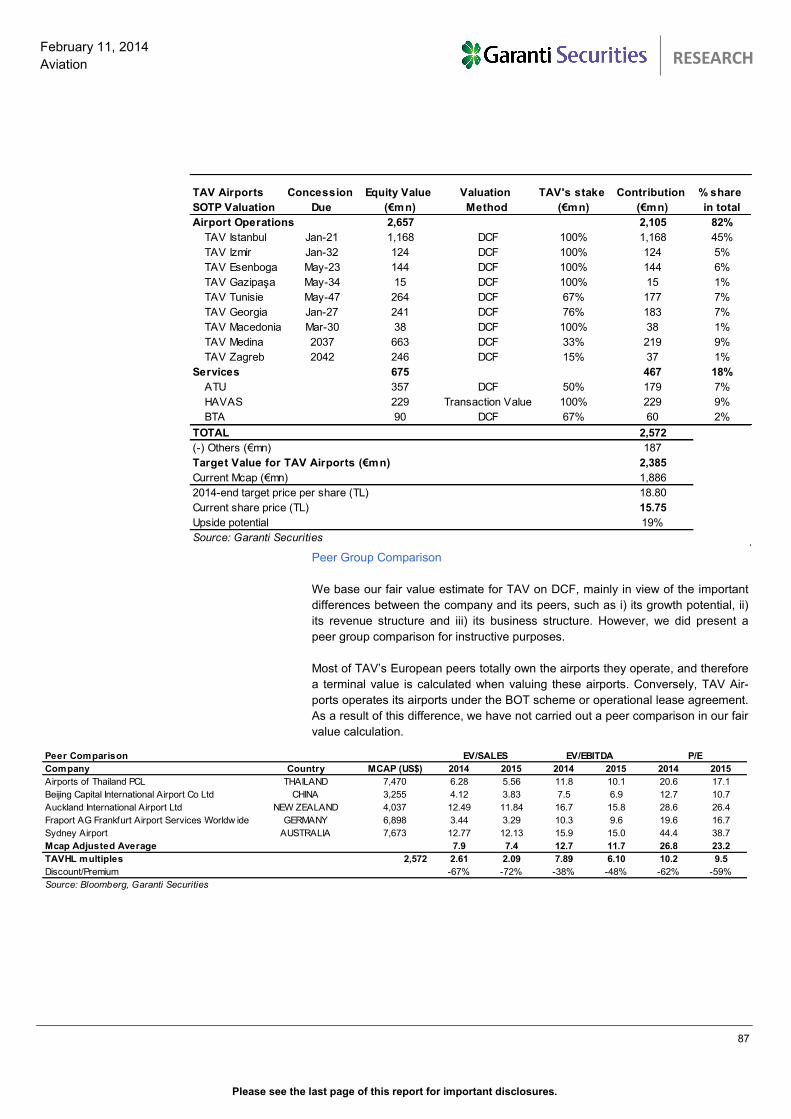
Please see the last page of this report for important disclosures.
87
February 11, 2014
Aviation
TURKISH AVIATION SECTOR
RESEARCH
Peer Group Comparison
We base our fair value estimate for TAV on DCF, mainly in view of the important
differences between the company and its peers, such as i) its growth potential, ii)
its revenue structure and iii) its business structure. However, we did present a
peer group comparison for instructive purposes.
Most of TAV’s European peers totally own the airports they operate, and therefore
a terminal value is calculated when valuing these airports. Conversely, TAV Air-
ports operates its airports under the BOT scheme or operational lease agreement.
As a result of this difference, we have not carried out a peer comparison in our fair
value calculation.
TAV Airports
SOTP Valuation
Concession
Due
Equity Value
(€mn)
Valuation
Method
TAV's stake
(€mn)
Contribution
(€mn)
% share
in total
Airport Operations 2,657 2,105 82%
TAV Istanbul Jan-21 1,168 DCF 100% 1,168 45%
TAV Izmir Jan-32 124 DCF 100% 124 5%
TAV Esenboga May-23 144 DCF 100% 144 6%
TAV Gazipaşa May-34 15 DCF 100% 15 1%
TAV Tunisie May-47 264 DCF 67% 177 7%
TAV Georgia Jan-27 241 DCF 76% 183 7%
TAV Macedonia Mar-30 38 DCF 100% 38 1%
TAV Medina 2037 663 DCF 33% 219 9%
TAV Zagreb 2042 246 DCF 15% 37 1%
Services 675 467 18%
ATU 357 DCF 50% 179 7%
HAVAS 229 Transaction Value 100% 229 9%
BTA 90 DCF 67% 60 2%
TOTAL 2,572
(-) Others (€mn) 187
Target Value for TAV Airports (€mn) 2,385
Current Mcap (€mn) 1,886
2014-end target price per share (TL) 18.80
Current share price (TL) 15.75
Upside potential 19%
Source: Garanti Securities
Peer Comparison
Company Country MCAP (US$) 2014 2015 2014 2015 2014 2015
Airports of Thailand PCL THAILAND 7,470 6.28 5.56 11.8 10.1 20.6 17.1
Beijing Capital International Airport Co Ltd CHINA 3,255 4.12 3.83 7.5 6.9 12.7 10.7
Auckland International Airport Ltd NEW ZEALAND 4,037 12.49 11.84 16.7 15.8 28.6 26.4
Fraport AG Frankfurt Airport Services Worldw ide GERMANY 6,898 3.44 3.29 10.3 9.6 19.6 16.7
Sydney Airport AUSTRALIA 7,673 12.77 12.13 15.9 15.0 44.4 38.7
Mcap Adjusted Average 7.9 7.4 12.7 11.7 26.8 23.2
TAVHL multiples 2,572 2.61 2.09 7.89 6.10 10.2 9.5
Discount/Premium -67% -72% -38% -48% -62% -59%
Source: Bloomberg, Garanti Securities
EV/SALES EV/EBITDA P/E
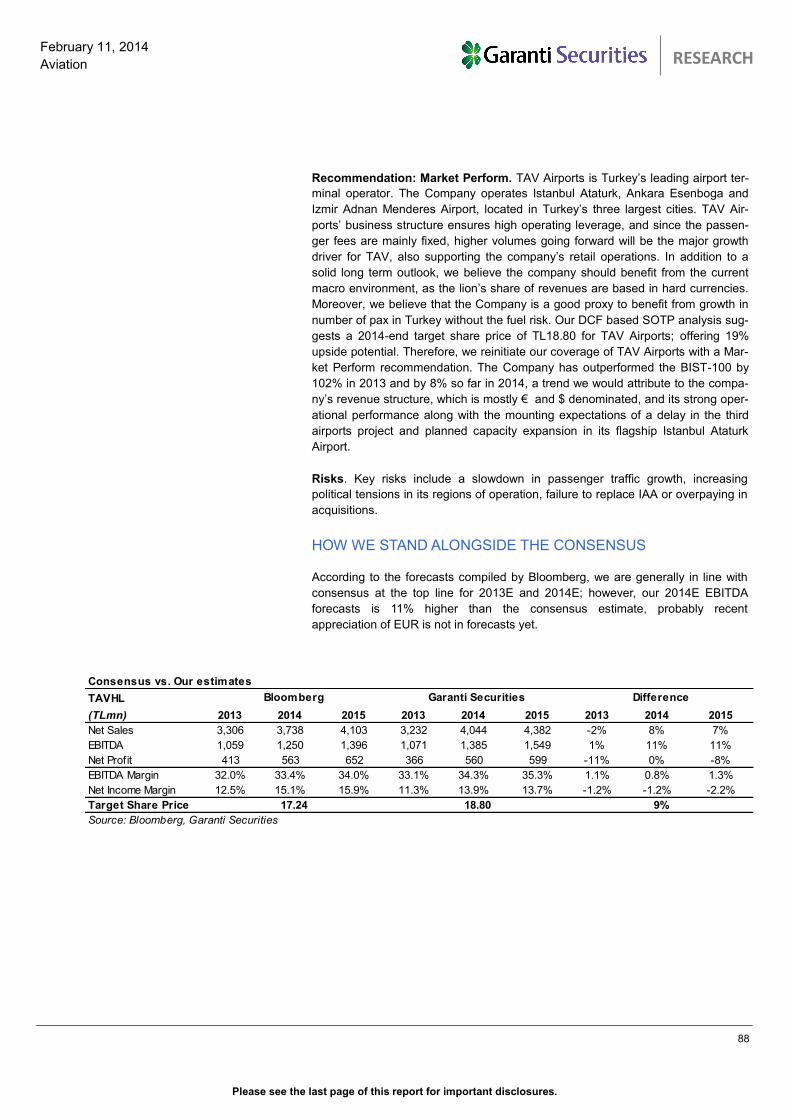
Please see the last page of this report for important disclosures.
88
February 11, 2014
Aviation
TURKISH AVIATION SECTOR
RESEARCH
Recommendation: Market Perform. TAV Airports is Turkey’s leading airport ter-
minal operator. The Company operates Istanbul Ataturk, Ankara Esenboga and
Izmir Adnan Menderes Airport, located in Turkey’s three largest cities. TAV Air-
ports’ business structure ensures high operating leverage, and since the passen-
ger fees are mainly fixed, higher volumes going forward will be the major growth
driver for TAV, also supporting the company’s retail operations. In addition to a
solid long term outlook, we believe the company should benefit from the current
macro environment, as the lion’s share of revenues are based in hard currencies.
Moreover, we believe that the Company is a good proxy to benefit from growth in
number of pax in Turkey without the fuel risk. Our DCF based SOTP analysis sug-
gests a 2014-end target share price of TL18.80 for TAV Airports; offering 19%
upside potential. Therefore, we reinitiate our coverage of TAV Airports with a Mar-
ket Perform recommendation. The Company has outperformed the BIST-100 by
102% in 2013 and by 8% so far in 2014, a trend we would attribute to the compa-
ny’s revenue structure, which is mostly € and $ denominated, and its strong oper-
ational performance along with the mounting expectations of a delay in the third
airports project and planned capacity expansion in its flagship Istanbul Ataturk
Airport.
Risks. Key risks include a slowdown in passenger traffic growth, increasing
political tensions in its regions of operation, failure to replace IAA or overpaying in
acquisitions.
HOW WE STAND ALONGSIDE THE CONSENSUS According to the forecasts compiled by Bloomberg, we are generally in line with
consensus at the top line for 2013E and 2014E; however, our 2014E EBITDA
forecasts is 11% higher than the consensus estimate, probably recent
appreciation of EUR is not in forecasts yet.
Consensus vs. Our estimates
TAVHL
(TLmn) 2013 2014 2015 2013 2014 2015 2013 2014 2015
Net Sales 3,306 3,738 4,103 3,232 4,044 4,382 -2% 8% 7%
EBITDA 1,059 1,250 1,396 1,071 1,385 1,549 1% 11% 11%
Net Profit 413 563 652 366 560 599 -11% 0% -8%
EBITDA Margin 32.0% 33.4% 34.0% 33.1% 34.3% 35.3% 1.1% 0.8% 1.3%
Net Income Margin 12.5% 15.1% 15.9% 11.3% 13.9% 13.7% -1.2% -1.2% -2.2%
Target Share Price
Source: Bloomberg, Garanti Securities
Bloomberg Garanti Securities Difference
17.24 18.80 9%
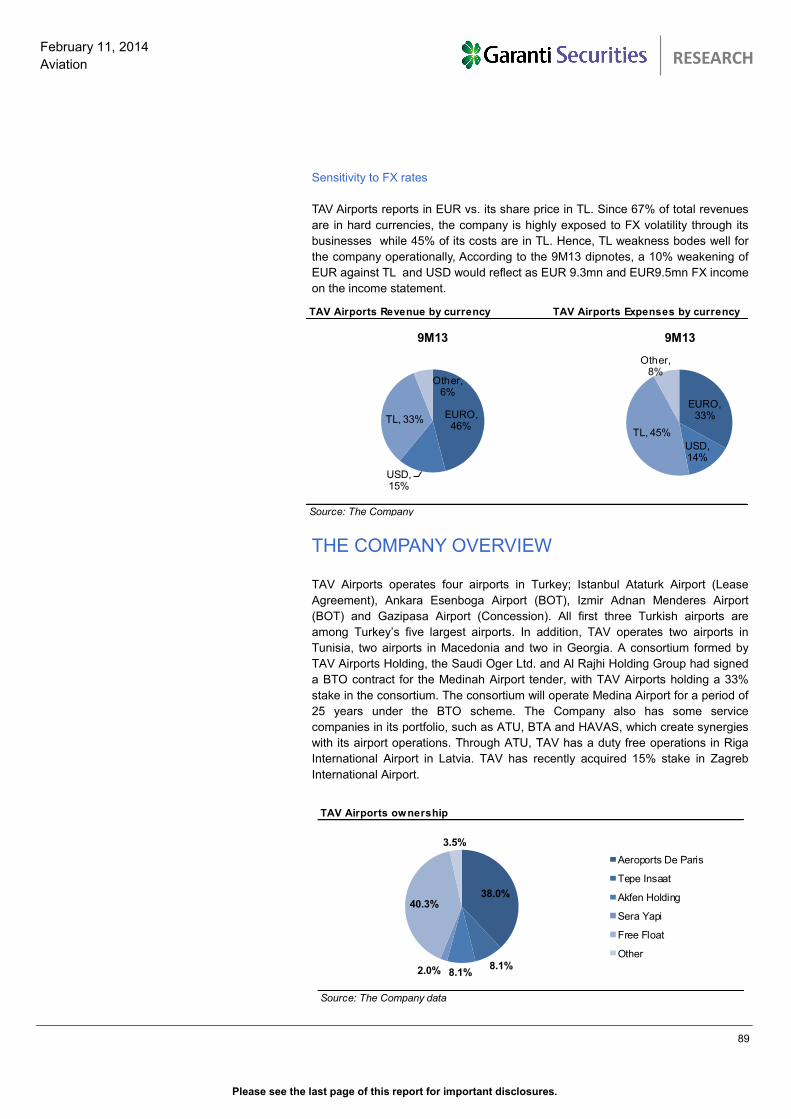
Please see the last page of this report for important disclosures.
89
February 11, 2014
Aviation
TURKISH AVIATION SECTOR
RESEARCH
Sensitivity to FX rates
TAV Airports reports in EUR vs. its share price in TL. Since 67% of total revenues
are in hard currencies, the company is highly exposed to FX volatility through its
businesses while 45% of its costs are in TL. Hence, TL weakness bodes well for
the company operationally, According to the 9M13 dipnotes, a 10% weakening of
EUR against TL and USD would reflect as EUR 9.3mn and EUR9.5mn FX income
on the income statement.
THE COMPANY OVERVIEW TAV Airports operates four airports in Turkey; Istanbul Ataturk Airport (Lease
Agreement), Ankara Esenboga Airport (BOT), Izmir Adnan Menderes Airport
(BOT) and Gazipasa Airport (Concession). All first three Turkish airports are
among Turkey’s five largest airports. In addition, TAV operates two airports in
Tunisia, two airports in Macedonia and two in Georgia. A consortium formed by
TAV Airports Holding, the Saudi Oger Ltd. and Al Rajhi Holding Group had signed
a BTO contract for the Medinah Airport tender, with TAV Airports holding a 33%
stake in the consortium. The consortium will operate Medina Airport for a period of
25 years under the BTO scheme. The Company also has some service
companies in its portfolio, such as ATU, BTA and HAVAS, which create synergies
with its airport operations. Through ATU, TAV has a duty free operations in Riga
International Airport in Latvia. TAV has recently acquired 15% stake in Zagreb
International Airport.
TAV Airports Revenue by currency TAV Airports Expenses by currency
Source: The Company
EURO, 46%
USD, 15%
TL, 33%
Other, 6%
9M13
EURO, 33%
USD, 14%
TL, 45%
Other, 8%
9M13
TAV Airports ownership
Source: The Company data
38.0%
8.1%8.1%2.0%
40.3%
3.5%
Aeroports De Paris
Tepe Insaat
Akfen Holding
Sera Yapi
Free Float
Other
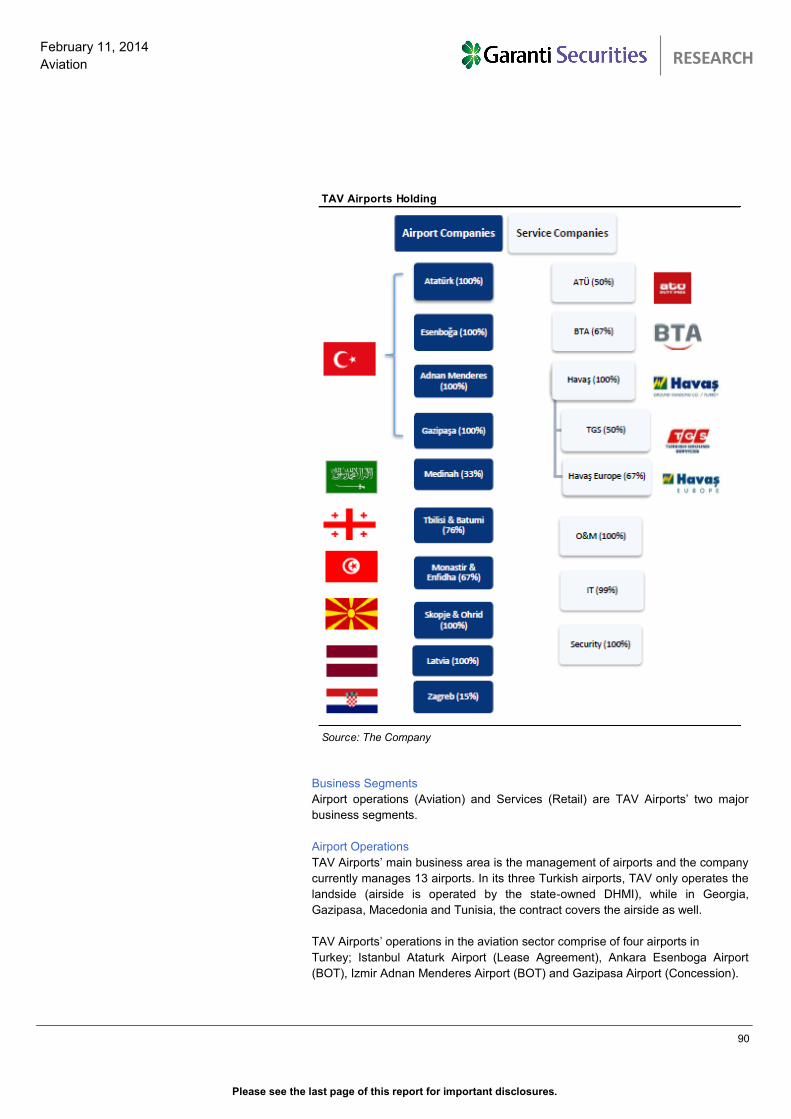
Please see the last page of this report for important disclosures.
90
February 11, 2014
Aviation
TURKISH AVIATION SECTOR
RESEARCH
Business Segments
Airport operations (Aviation) and Services (Retail) are TAV Airports’ two major
business segments.
Airport Operations
TAV Airports’ main business area is the management of airports and the company
currently manages 13 airports. In its three Turkish airports, TAV only operates the
landside (airside is operated by the state-owned DHMI), while in Georgia,
Gazipasa, Macedonia and Tunisia, the contract covers the airside as well.
TAV Airports’ operations in the aviation sector comprise of four airports in
Turkey; Istanbul Ataturk Airport (Lease Agreement), Ankara Esenboga Airport
(BOT), Izmir Adnan Menderes Airport (BOT) and Gazipasa Airport (Concession).
TAV Airports Holding
Source: The Company
Please see the last page of this report for important disclosures.
91
February 11, 2014
Aviation
TURKISH AVIATION SECTOR
RESEARCH
There are two major types of airport operation:
1-Concession/Lease: TAV pays a fixed rent payment in return for the right to
operate Istanbul Ataturk Airport and Gazipasa Airport.
2-BOT Contracts: TAV undertakes the necessary construction/investment to build
the airport in return for a guaranteed passenger number of pax in Ankara and
Izmir.
TAV Airports has BOT+ Concession model as well, briefly combining above two
types, in airports in Macedonia, Saudi Arabia and Croatia
The company aims to expand its non-regulated revenues (services and
commercial revenues) and expand its portfolio by bidding for new concessions in
and outside Turkey.
Service Operations
The Company runs its duty-free operations under the ATU umbrella. ATU is a
50/50 joint venture between TAV and Unifree (a Turkish retailer majority owned by
Heinemann, a retailer involved in duty-free operations in Germany) operating as
the sole operator of duty-free stores at airports operated by the Company
(excluding Monastir Airport, but including Riga Airport which is not operated by
TAV Airports). In addition, TAV Airports holds a 67% stake in BTA, which
manages restaurants and food shops. In Istanbul Ataturk Airport’s international
terminal, BTA manages 146 outlets with a total seating capacity of 12,500 and the
Airport Hotel in Istanbul.
KEY ASSUMPTIONS & FORECASTS
TAV Airports operates the terminals under lease agreements or BOT and BTO
contracts, and therefore all airport operations have a finite term. Although the
Company may well be in a favoured position to extend its contracts at the end of
the contract period, we have not assumed any terminal value for the airport
terminal operations.
TAV Airports also has interests in some services companies such as HAVAS, ATU
and BTA. In our view, these companies do deserve a terminal value, since they
will continue to operate after the airports’ concession period expires.
On the other hand, each airport runs under separate companies which are
focused only on their operations. Moreover, these companies have a different debt
structure and are faced with specific macro-economic risks as a result of their area
of operation. Therefore, we calculated a different WACC for each operation when
valuing the companies.

Please see the last page of this report for important disclosures.
92
February 11, 2014
Aviation
TURKISH AVIATION SECTOR
RESEARCH
Istanbul Ataturk Airport
Istanbul Ataturk Airport (IAA), Turkey’s largest airport in terms of passenger traffic,
accounts for more than 61% of TAV Airport’s total passenger traffic. Total
passenger traffic at Istanbul Ataturk Airport rose by 14% YoY in 2013, reaching
51mn (a total of 17mn domestic passengers used IAA, marking 13% YoY growth,
with 34mn international passengers using the airport, up 14% YoY). Istanbul
Ataturk Airport’s car park is also one of Europe’s largest car parks under a single
roof. We are very conservative on pax growth at IAA and we expect IAA to register
a 5% CAGR in pax numbers over the 2013-2021 period.
Revenue Per departure (RPD)
Type Expire Concession Fee (mn) TAV Stake Net Debt(mn)(1)Currency RPD
Guranteed Pax
(K)
Guranteed Pax Start
Year
Istanbul Lease 01-2021 $140 + VAT 100% € 68
International US$ 15.0
Transfer € 2.5
Domestic € 3.0
Ankara BOT 05-2023 - 100% € 83
International € 15 2007
Domestic € 3 2007
Izmir BOT + Lease 12-2032 €29mn starting from 2013 (6) 100% € 58
International € 15 2006
Domestic € 3
Gazipasa Lease 05-2034 $50,000+VAT(5) 100% € 16
International € 5
Domestic TRL 4
Tblisi BOT 11-2027 - 76% -€ 4
International US$ 22
Domestic US$ 6
Batumi BOT 08-2027 - 76% € 0
International US$ 12
Domestic US$ 7
Monastir&Enfidha BOT+Concession 05-2047 %11-26 of Revenues from 2010 to 2047 67% € 345
International € 9
Domestic € 1
Macedonia BOT+Concession 03-2030 %15 of the gross annual turnover (2) 100% € 57
Skopje € 17.5
Ohrid € 16.2
Medina BTO+Concession 2037 54.5%(4) 33% € 116 SAR 80 (3)
Zagreb BOT+Concession 04-2042 €2.0 - €11.5m fixed 15% - € €15 (7)
0.5% (2016) - 61% (2042) variable €4 (Transfer)
1) As of September 30, 2012
2) The concession fee is going to be 15% of gross annual turnover until the number of pax using the tw o airports reaches 1mn, and w hen the number of pax exceeds 1mn.
3) SAR 80 from both departing and arrivign international pax. Pax charge w ill be increase as per cumulative CPI in Saudi Arabia every 3 years.
4) The concession charge w ill be reduced to 27.3% for the f irst 2 years that follow the copletion of the construction.
5) TAV Gazipaşa shall make a yearly rent payent of US$50,000+VAT as a f ized amount, until the end of operation period; as w ell as a share of 65% of the net profit to the DHMI.
6) Cash basis
7) €10, €4, €4 before April 2014 respectively for international, domestic and transfer pax
0.6mn Dom.,
0.75mn Intn'l for
2007 +5% p.a.
1.0mn intn'l for
2006 + 3% p.a.
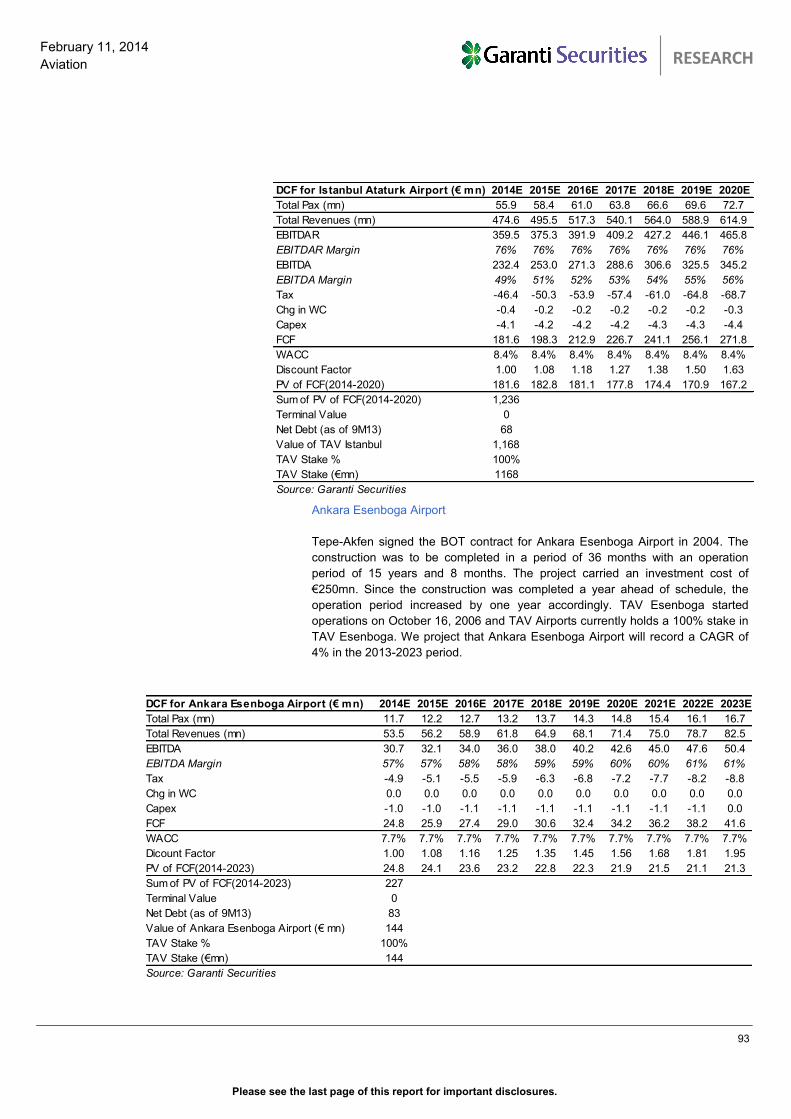
Please see the last page of this report for important disclosures.
93
February 11, 2014
Aviation
TURKISH AVIATION SECTOR
RESEARCH
Ankara Esenboga Airport
Tepe-Akfen signed the BOT contract for Ankara Esenboga Airport in 2004. The
construction was to be completed in a period of 36 months with an operation
period of 15 years and 8 months. The project carried an investment cost of
€250mn. Since the construction was completed a year ahead of schedule, the
operation period increased by one year accordingly. TAV Esenboga started
operations on October 16, 2006 and TAV Airports currently holds a 100% stake in
TAV Esenboga. We project that Ankara Esenboga Airport will record a CAGR of
4% in the 2013-2023 period.
DCF for Ankara Esenboga Airport (€ mn) 2014E 2015E 2016E 2017E 2018E 2019E 2020E 2021E 2022E 2023E
Total Pax (mn) 11.7 12.2 12.7 13.2 13.7 14.3 14.8 15.4 16.1 16.7
Total Revenues (mn) 53.5 56.2 58.9 61.8 64.9 68.1 71.4 75.0 78.7 82.5
EBITDA 30.7 32.1 34.0 36.0 38.0 40.2 42.6 45.0 47.6 50.4
EBITDA Margin 57% 57% 58% 58% 59% 59% 60% 60% 61% 61%
Tax -4.9 -5.1 -5.5 -5.9 -6.3 -6.8 -7.2 -7.7 -8.2 -8.8
Chg in WC 0.0 0.0 0.0 0.0 0.0 0.0 0.0 0.0 0.0 0.0
Capex -1.0 -1.0 -1.1 -1.1 -1.1 -1.1 -1.1 -1.1 -1.1 0.0
FCF 24.8 25.9 27.4 29.0 30.6 32.4 34.2 36.2 38.2 41.6
WACC 7.7% 7.7% 7.7% 7.7% 7.7% 7.7% 7.7% 7.7% 7.7% 7.7%
Dicount Factor 1.00 1.08 1.16 1.25 1.35 1.45 1.56 1.68 1.81 1.95
PV of FCF(2014-2023) 24.8 24.1 23.6 23.2 22.8 22.3 21.9 21.5 21.1 21.3
Sum of PV of FCF(2014-2023) 227
Terminal Value 0
Net Debt (as of 9M13) 83
Value of Ankara Esenboga Airport (€ mn) 144
TAV Stake % 100%
TAV Stake (€mn) 144
Source: Garanti Securities
DCF for Istanbul Ataturk Airport (€ mn) 2014E 2015E 2016E 2017E 2018E 2019E 2020E
Total Pax (mn) 55.9 58.4 61.0 63.8 66.6 69.6 72.7
Total Revenues (mn) 474.6 495.5 517.3 540.1 564.0 588.9 614.9
EBITDAR 359.5 375.3 391.9 409.2 427.2 446.1 465.8
EBITDAR Margin 76% 76% 76% 76% 76% 76% 76%
EBITDA 232.4 253.0 271.3 288.6 306.6 325.5 345.2
EBITDA Margin 49% 51% 52% 53% 54% 55% 56%
Tax -46.4 -50.3 -53.9 -57.4 -61.0 -64.8 -68.7
Chg in WC -0.4 -0.2 -0.2 -0.2 -0.2 -0.2 -0.3
Capex -4.1 -4.2 -4.2 -4.2 -4.3 -4.3 -4.4
FCF 181.6 198.3 212.9 226.7 241.1 256.1 271.8
WACC 8.4% 8.4% 8.4% 8.4% 8.4% 8.4% 8.4%
Discount Factor 1.00 1.08 1.18 1.27 1.38 1.50 1.63
PV of FCF(2014-2020) 181.6 182.8 181.1 177.8 174.4 170.9 167.2
Sum of PV of FCF(2014-2020) 1,236
Terminal Value 0
Net Debt (as of 9M13) 68
Value of TAV Istanbul 1,168
TAV Stake % 100%
TAV Stake (€mn) 1168
Source: Garanti Securities
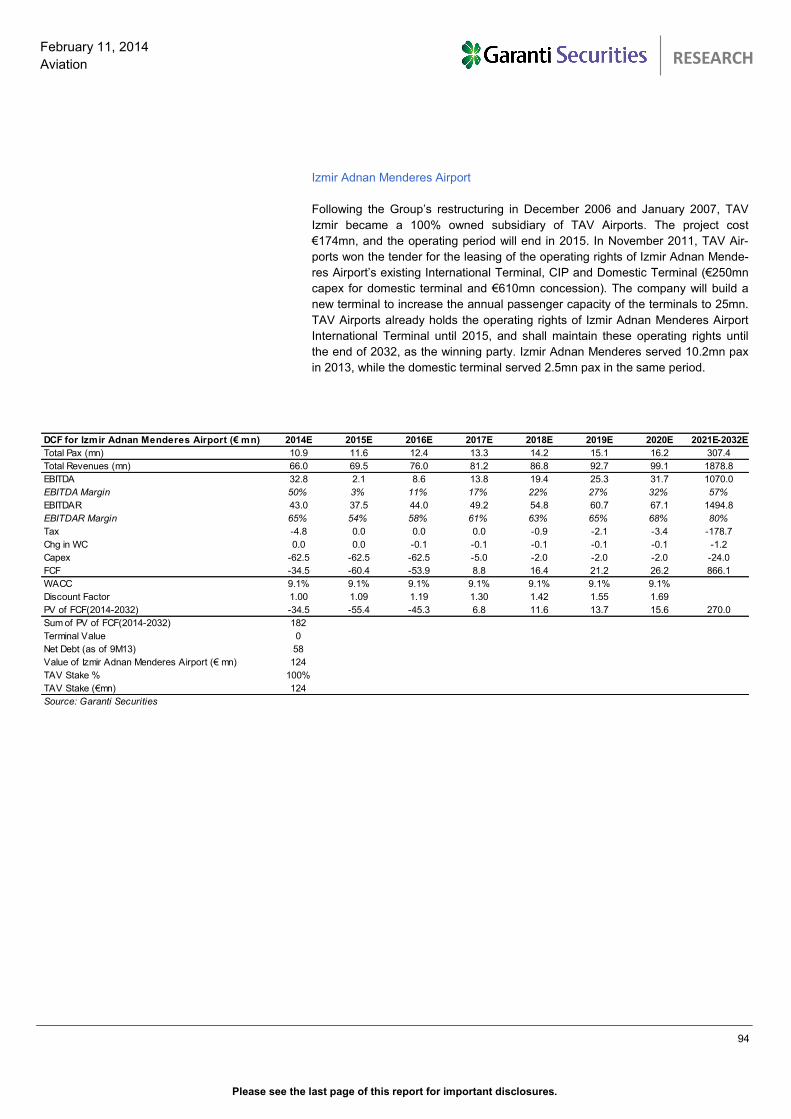
Please see the last page of this report for important disclosures.
94
February 11, 2014
Aviation
TURKISH AVIATION SECTOR
RESEARCH
Izmir Adnan Menderes Airport
Following the Group’s restructuring in December 2006 and January 2007, TAV
Izmir became a 100% owned subsidiary of TAV Airports. The project cost
€174mn, and the operating period will end in 2015. In November 2011, TAV Air-
ports won the tender for the leasing of the operating rights of Izmir Adnan Mende-
res Airport’s existing International Terminal, CIP and Domestic Terminal (€250mn
capex for domestic terminal and €610mn concession). The company will build a
new terminal to increase the annual passenger capacity of the terminals to 25mn.
TAV Airports already holds the operating rights of Izmir Adnan Menderes Airport
International Terminal until 2015, and shall maintain these operating rights until
the end of 2032, as the winning party. Izmir Adnan Menderes served 10.2mn pax
in 2013, while the domestic terminal served 2.5mn pax in the same period.
DCF for Izmir Adnan Menderes Airport (€ mn) 2014E 2015E 2016E 2017E 2018E 2019E 2020E 2021E-2032E
Total Pax (mn) 10.9 11.6 12.4 13.3 14.2 15.1 16.2 307.4
Total Revenues (mn) 66.0 69.5 76.0 81.2 86.8 92.7 99.1 1878.8
EBITDA 32.8 2.1 8.6 13.8 19.4 25.3 31.7 1070.0
EBITDA Margin 50% 3% 11% 17% 22% 27% 32% 57%
EBITDAR 43.0 37.5 44.0 49.2 54.8 60.7 67.1 1494.8
EBITDAR Margin 65% 54% 58% 61% 63% 65% 68% 80%
Tax -4.8 0.0 0.0 0.0 -0.9 -2.1 -3.4 -178.7
Chg in WC 0.0 0.0 -0.1 -0.1 -0.1 -0.1 -0.1 -1.2
Capex -62.5 -62.5 -62.5 -5.0 -2.0 -2.0 -2.0 -24.0
FCF -34.5 -60.4 -53.9 8.8 16.4 21.2 26.2 866.1
WACC 9.1% 9.1% 9.1% 9.1% 9.1% 9.1% 9.1%
Discount Factor 1.00 1.09 1.19 1.30 1.42 1.55 1.69
PV of FCF(2014-2032) -34.5 -55.4 -45.3 6.8 11.6 13.7 15.6 270.0
Sum of PV of FCF(2014-2032) 182
Terminal Value 0
Net Debt (as of 9M13) 58
Value of Izmir Adnan Menderes Airport (€ mn) 124
TAV Stake % 100%
TAV Stake (€mn) 124
Source: Garanti Securities
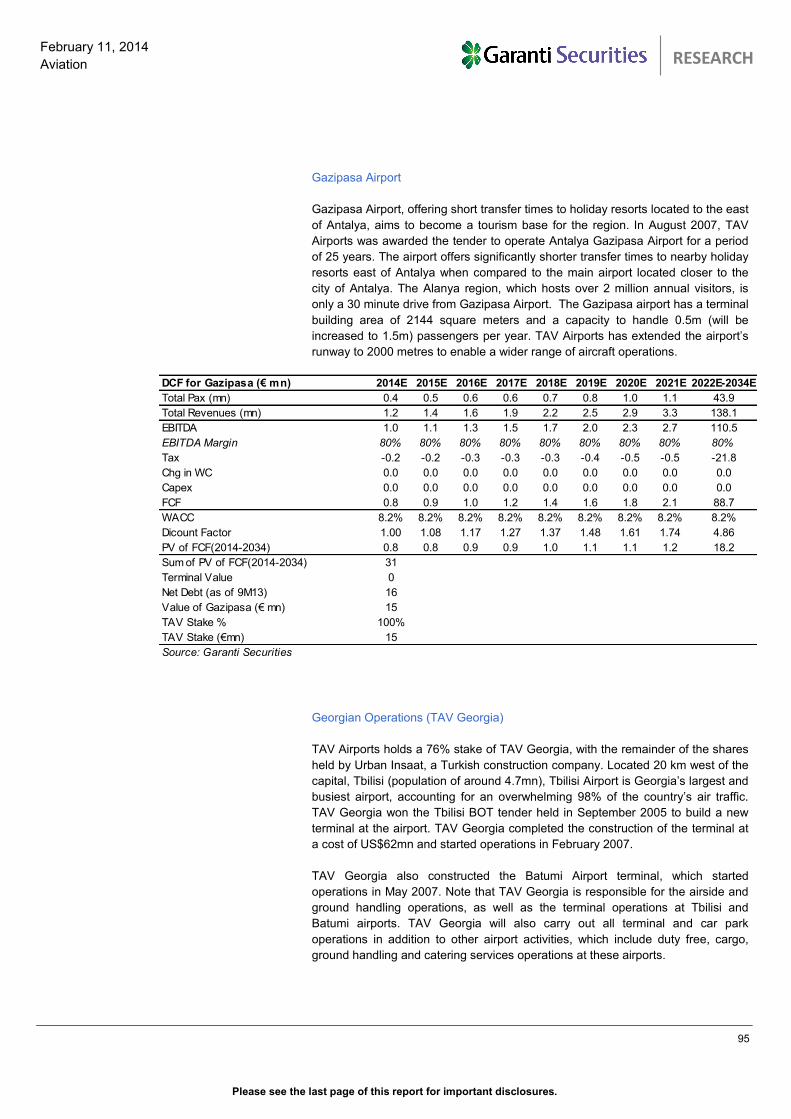
Please see the last page of this report for important disclosures.
95
February 11, 2014
Aviation
TURKISH AVIATION SECTOR
RESEARCH
Gazipasa Airport
Gazipasa Airport, offering short transfer times to holiday resorts located to the east
of Antalya, aims to become a tourism base for the region. In August 2007, TAV
Airports was awarded the tender to operate Antalya Gazipasa Airport for a period
of 25 years. The airport offers significantly shorter transfer times to nearby holiday
resorts east of Antalya when compared to the main airport located closer to the
city of Antalya. The Alanya region, which hosts over 2 million annual visitors, is
only a 30 minute drive from Gazipasa Airport. The Gazipasa airport has a terminal
building area of 2144 square meters and a capacity to handle 0.5m (will be
increased to 1.5m) passengers per year. TAV Airports has extended the airport’s
runway to 2000 metres to enable a wider range of aircraft operations.
Georgian Operations (TAV Georgia)
TAV Airports holds a 76% stake of TAV Georgia, with the remainder of the shares
held by Urban Insaat, a Turkish construction company. Located 20 km west of the
capital, Tbilisi (population of around 4.7mn), Tbilisi Airport is Georgia’s largest and
busiest airport, accounting for an overwhelming 98% of the country’s air traffic.
TAV Georgia won the Tbilisi BOT tender held in September 2005 to build a new
terminal at the airport. TAV Georgia completed the construction of the terminal at
a cost of US$62mn and started operations in February 2007.
TAV Georgia also constructed the Batumi Airport terminal, which started
operations in May 2007. Note that TAV Georgia is responsible for the airside and
ground handling operations, as well as the terminal operations at Tbilisi and
Batumi airports. TAV Georgia will also carry out all terminal and car park
operations in addition to other airport activities, which include duty free, cargo,
ground handling and catering services operations at these airports.
DCF for Gazipasa (€ mn) 2014E 2015E 2016E 2017E 2018E 2019E 2020E 2021E 2022E-2034E
Total Pax (mn) 0.4 0.5 0.6 0.6 0.7 0.8 1.0 1.1 43.9
Total Revenues (mn) 1.2 1.4 1.6 1.9 2.2 2.5 2.9 3.3 138.1
EBITDA 1.0 1.1 1.3 1.5 1.7 2.0 2.3 2.7 110.5
EBITDA Margin 80% 80% 80% 80% 80% 80% 80% 80% 80%
Tax -0.2 -0.2 -0.3 -0.3 -0.3 -0.4 -0.5 -0.5 -21.8
Chg in WC 0.0 0.0 0.0 0.0 0.0 0.0 0.0 0.0 0.0
Capex 0.0 0.0 0.0 0.0 0.0 0.0 0.0 0.0 0.0
FCF 0.8 0.9 1.0 1.2 1.4 1.6 1.8 2.1 88.7
WACC 8.2% 8.2% 8.2% 8.2% 8.2% 8.2% 8.2% 8.2% 8.2%
Dicount Factor 1.00 1.08 1.17 1.27 1.37 1.48 1.61 1.74 4.86
PV of FCF(2014-2034) 0.8 0.8 0.9 0.9 1.0 1.1 1.1 1.2 18.2
Sum of PV of FCF(2014-2034) 31
Terminal Value 0
Net Debt (as of 9M13) 16
Value of Gazipasa (€ mn) 15
TAV Stake % 100%
TAV Stake (€mn) 15
Source: Garanti Securities
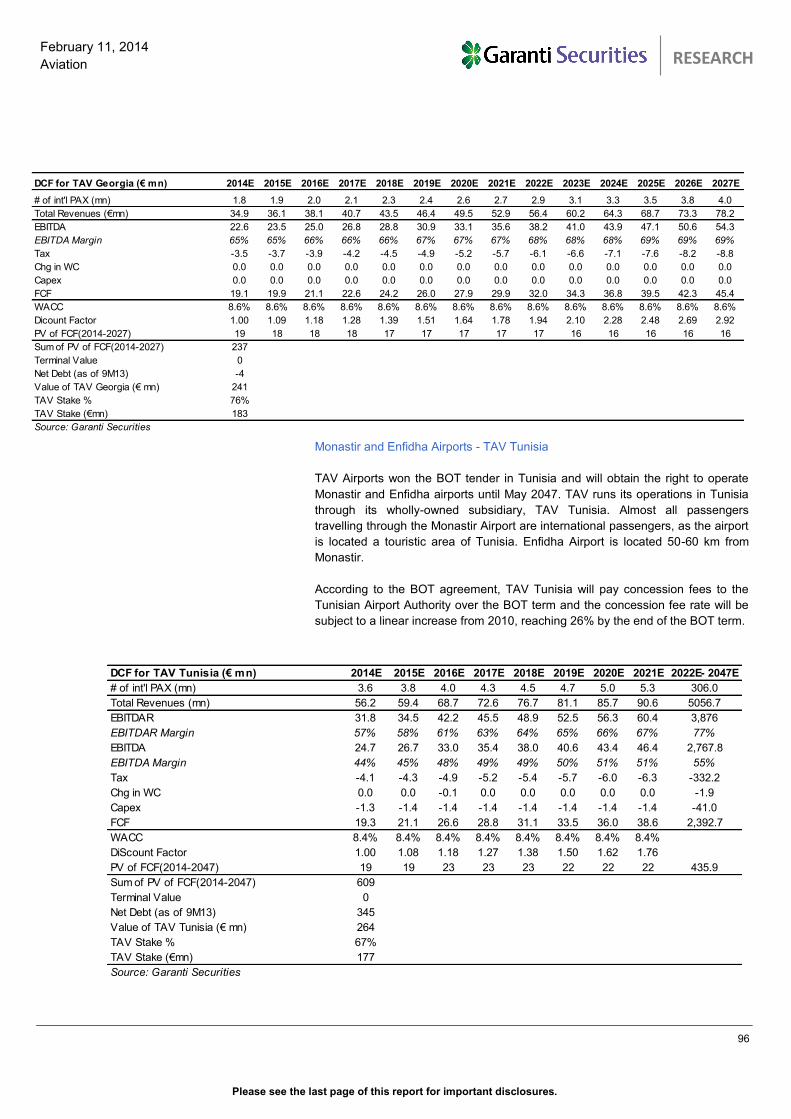
Please see the last page of this report for important disclosures.
96
February 11, 2014
Aviation
TURKISH AVIATION SECTOR
RESEARCH
Monastir and Enfidha Airports - TAV Tunisia
TAV Airports won the BOT tender in Tunisia and will obtain the right to operate
Monastir and Enfidha airports until May 2047. TAV runs its operations in Tunisia
through its wholly-owned subsidiary, TAV Tunisia. Almost all passengers
travelling through the Monastir Airport are international passengers, as the airport
is located a touristic area of Tunisia. Enfidha Airport is located 50-60 km from
Monastir.
According to the BOT agreement, TAV Tunisia will pay concession fees to the
Tunisian Airport Authority over the BOT term and the concession fee rate will be
subject to a linear increase from 2010, reaching 26% by the end of the BOT term.
DCF for TAV Tunisia (€ mn) 2014E 2015E 2016E 2017E 2018E 2019E 2020E 2021E 2022E- 2047E
# of int'l PAX (mn) 3.6 3.8 4.0 4.3 4.5 4.7 5.0 5.3 306.0
Total Revenues (mn) 56.2 59.4 68.7 72.6 76.7 81.1 85.7 90.6 5056.7
EBITDAR 31.8 34.5 42.2 45.5 48.9 52.5 56.3 60.4 3,876
EBITDAR Margin 57% 58% 61% 63% 64% 65% 66% 67% 77%
EBITDA 24.7 26.7 33.0 35.4 38.0 40.6 43.4 46.4 2,767.8
EBITDA Margin 44% 45% 48% 49% 49% 50% 51% 51% 55%
Tax -4.1 -4.3 -4.9 -5.2 -5.4 -5.7 -6.0 -6.3 -332.2
Chg in WC 0.0 0.0 -0.1 0.0 0.0 0.0 0.0 0.0 -1.9
Capex -1.3 -1.4 -1.4 -1.4 -1.4 -1.4 -1.4 -1.4 -41.0
FCF 19.3 21.1 26.6 28.8 31.1 33.5 36.0 38.6 2,392.7
WACC 8.4% 8.4% 8.4% 8.4% 8.4% 8.4% 8.4% 8.4%
DiScount Factor 1.00 1.08 1.18 1.27 1.38 1.50 1.62 1.76
PV of FCF(2014-2047) 19 19 23 23 23 22 22 22 435.9
Sum of PV of FCF(2014-2047) 609
Terminal Value 0
Net Debt (as of 9M13) 345
Value of TAV Tunisia (€ mn) 264
TAV Stake % 67%
TAV Stake (€mn) 177
Source: Garanti Securities
DCF for TAV Georgia (€ mn) 2014E 2015E 2016E 2017E 2018E 2019E 2020E 2021E 2022E 2023E 2024E 2025E 2026E 2027E
# of int'l PAX (mn) 1.8 1.9 2.0 2.1 2.3 2.4 2.6 2.7 2.9 3.1 3.3 3.5 3.8 4.0
Total Revenues (€mn) 34.9 36.1 38.1 40.7 43.5 46.4 49.5 52.9 56.4 60.2 64.3 68.7 73.3 78.2
EBITDA 22.6 23.5 25.0 26.8 28.8 30.9 33.1 35.6 38.2 41.0 43.9 47.1 50.6 54.3
EBITDA Margin 65% 65% 66% 66% 66% 67% 67% 67% 68% 68% 68% 69% 69% 69%
Tax -3.5 -3.7 -3.9 -4.2 -4.5 -4.9 -5.2 -5.7 -6.1 -6.6 -7.1 -7.6 -8.2 -8.8
Chg in WC 0.0 0.0 0.0 0.0 0.0 0.0 0.0 0.0 0.0 0.0 0.0 0.0 0.0 0.0
Capex 0.0 0.0 0.0 0.0 0.0 0.0 0.0 0.0 0.0 0.0 0.0 0.0 0.0 0.0
FCF 19.1 19.9 21.1 22.6 24.2 26.0 27.9 29.9 32.0 34.3 36.8 39.5 42.3 45.4
WACC 8.6% 8.6% 8.6% 8.6% 8.6% 8.6% 8.6% 8.6% 8.6% 8.6% 8.6% 8.6% 8.6% 8.6%
Dicount Factor 1.00 1.09 1.18 1.28 1.39 1.51 1.64 1.78 1.94 2.10 2.28 2.48 2.69 2.92
PV of FCF(2014-2027) 19 18 18 18 17 17 17 17 17 16 16 16 16 16
Sum of PV of FCF(2014-2027) 237
Terminal Value 0
Net Debt (as of 9M13) -4
Value of TAV Georgia (€ mn) 241
TAV Stake % 76%
TAV Stake (€mn) 183
Source: Garanti Securities
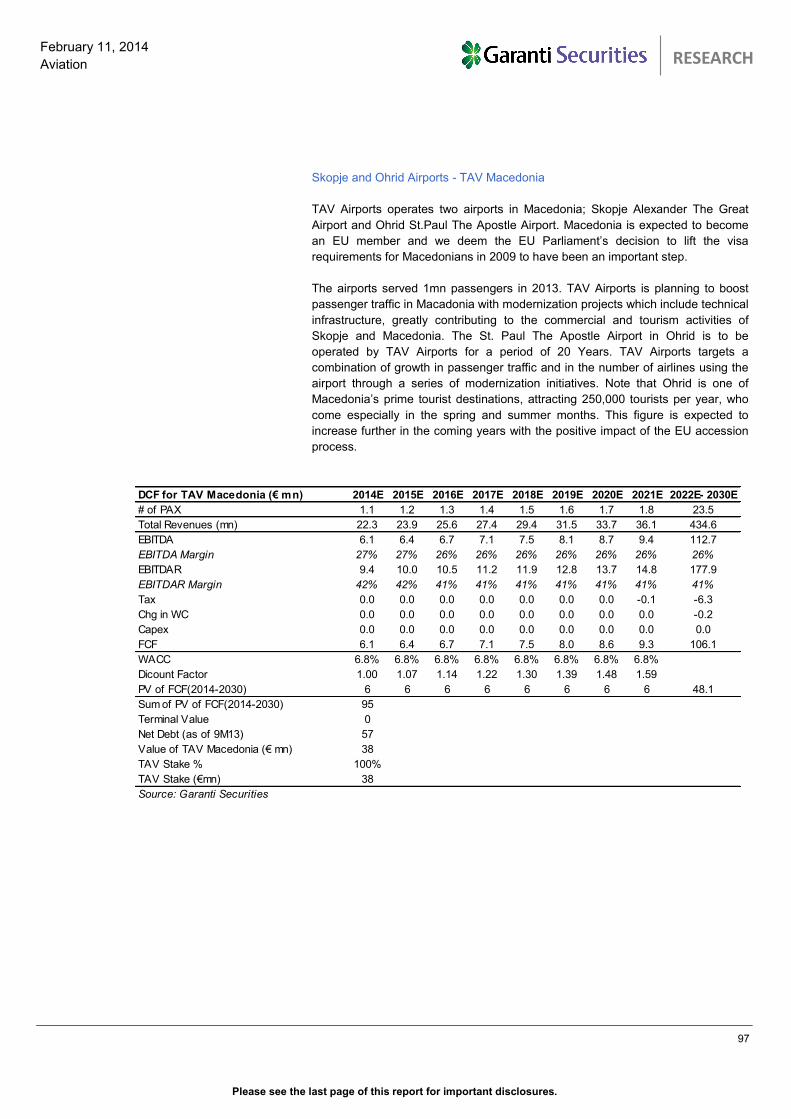
Please see the last page of this report for important disclosures.
97
February 11, 2014
Aviation
TURKISH AVIATION SECTOR
RESEARCH
Skopje and Ohrid Airports - TAV Macedonia
TAV Airports operates two airports in Macedonia; Skopje Alexander The Great
Airport and Ohrid St.Paul The Apostle Airport. Macedonia is expected to become
an EU member and we deem the EU Parliament’s decision to lift the visa
requirements for Macedonians in 2009 to have been an important step.
The airports served 1mn passengers in 2013. TAV Airports is planning to boost
passenger traffic in Macadonia with modernization projects which include technical
infrastructure, greatly contributing to the commercial and tourism activities of
Skopje and Macedonia. The St. Paul The Apostle Airport in Ohrid is to be
operated by TAV Airports for a period of 20 Years. TAV Airports targets a
combination of growth in passenger traffic and in the number of airlines using the
airport through a series of modernization initiatives. Note that Ohrid is one of
Macedonia’s prime tourist destinations, attracting 250,000 tourists per year, who
come especially in the spring and summer months. This figure is expected to
increase further in the coming years with the positive impact of the EU accession
process.
DCF for TAV Macedonia (€ mn) 2014E 2015E 2016E 2017E 2018E 2019E 2020E 2021E 2022E- 2030E
# of PAX 1.1 1.2 1.3 1.4 1.5 1.6 1.7 1.8 23.5
Total Revenues (mn) 22.3 23.9 25.6 27.4 29.4 31.5 33.7 36.1 434.6
EBITDA 6.1 6.4 6.7 7.1 7.5 8.1 8.7 9.4 112.7
EBITDA Margin 27% 27% 26% 26% 26% 26% 26% 26% 26%
EBITDAR 9.4 10.0 10.5 11.2 11.9 12.8 13.7 14.8 177.9
EBITDAR Margin 42% 42% 41% 41% 41% 41% 41% 41% 41%
Tax 0.0 0.0 0.0 0.0 0.0 0.0 0.0 -0.1 -6.3
Chg in WC 0.0 0.0 0.0 0.0 0.0 0.0 0.0 0.0 -0.2
Capex 0.0 0.0 0.0 0.0 0.0 0.0 0.0 0.0 0.0
FCF 6.1 6.4 6.7 7.1 7.5 8.0 8.6 9.3 106.1
WACC 6.8% 6.8% 6.8% 6.8% 6.8% 6.8% 6.8% 6.8%
Dicount Factor 1.00 1.07 1.14 1.22 1.30 1.39 1.48 1.59
PV of FCF(2014-2030) 6 6 6 6 6 6 6 6 48.1
Sum of PV of FCF(2014-2030) 95
Terminal Value 0
Net Debt (as of 9M13) 57
Value of TAV Macedonia (€ mn) 38
TAV Stake % 100%
TAV Stake (€mn) 38
Source: Garanti Securities
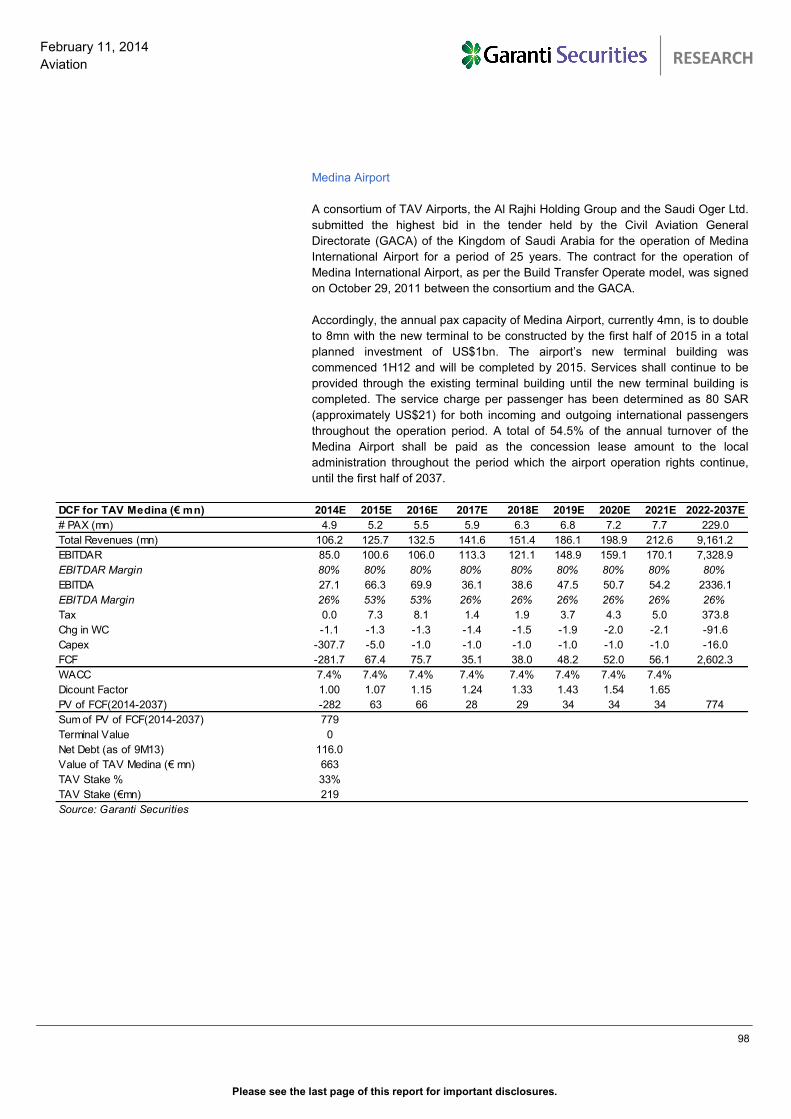
Please see the last page of this report for important disclosures.
98
February 11, 2014
Aviation
TURKISH AVIATION SECTOR
RESEARCH
Medina Airport
A consortium of TAV Airports, the Al Rajhi Holding Group and the Saudi Oger Ltd.
submitted the highest bid in the tender held by the Civil Aviation General
Directorate (GACA) of the Kingdom of Saudi Arabia for the operation of Medina
International Airport for a period of 25 years. The contract for the operation of
Medina International Airport, as per the Build Transfer Operate model, was signed
on October 29, 2011 between the consortium and the GACA.
Accordingly, the annual pax capacity of Medina Airport, currently 4mn, is to double
to 8mn with the new terminal to be constructed by the first half of 2015 in a total
planned investment of US$1bn. The airport’s new terminal building was
commenced 1H12 and will be completed by 2015. Services shall continue to be
provided through the existing terminal building until the new terminal building is
completed. The service charge per passenger has been determined as 80 SAR
(approximately US$21) for both incoming and outgoing international passengers
throughout the operation period. A total of 54.5% of the annual turnover of the
Medina Airport shall be paid as the concession lease amount to the local
administration throughout the period which the airport operation rights continue,
until the first half of 2037.
DCF for TAV Medina (€ mn) 2014E 2015E 2016E 2017E 2018E 2019E 2020E 2021E 2022-2037E
# PAX (mn) 4.9 5.2 5.5 5.9 6.3 6.8 7.2 7.7 229.0
Total Revenues (mn) 106.2 125.7 132.5 141.6 151.4 186.1 198.9 212.6 9,161.2
EBITDAR 85.0 100.6 106.0 113.3 121.1 148.9 159.1 170.1 7,328.9
EBITDAR Margin 80% 80% 80% 80% 80% 80% 80% 80% 80%
EBITDA 27.1 66.3 69.9 36.1 38.6 47.5 50.7 54.2 2336.1
EBITDA Margin 26% 53% 53% 26% 26% 26% 26% 26% 26%
Tax 0.0 7.3 8.1 1.4 1.9 3.7 4.3 5.0 373.8
Chg in WC -1.1 -1.3 -1.3 -1.4 -1.5 -1.9 -2.0 -2.1 -91.6
Capex -307.7 -5.0 -1.0 -1.0 -1.0 -1.0 -1.0 -1.0 -16.0
FCF -281.7 67.4 75.7 35.1 38.0 48.2 52.0 56.1 2,602.3
WACC 7.4% 7.4% 7.4% 7.4% 7.4% 7.4% 7.4% 7.4%
Dicount Factor 1.00 1.07 1.15 1.24 1.33 1.43 1.54 1.65
PV of FCF(2014-2037) -282 63 66 28 29 34 34 34 774
Sum of PV of FCF(2014-2037) 779
Terminal Value 0
Net Debt (as of 9M13) 116.0
Value of TAV Medina (€ mn) 663
TAV Stake % 33%
TAV Stake (€mn) 219
Source: Garanti Securities
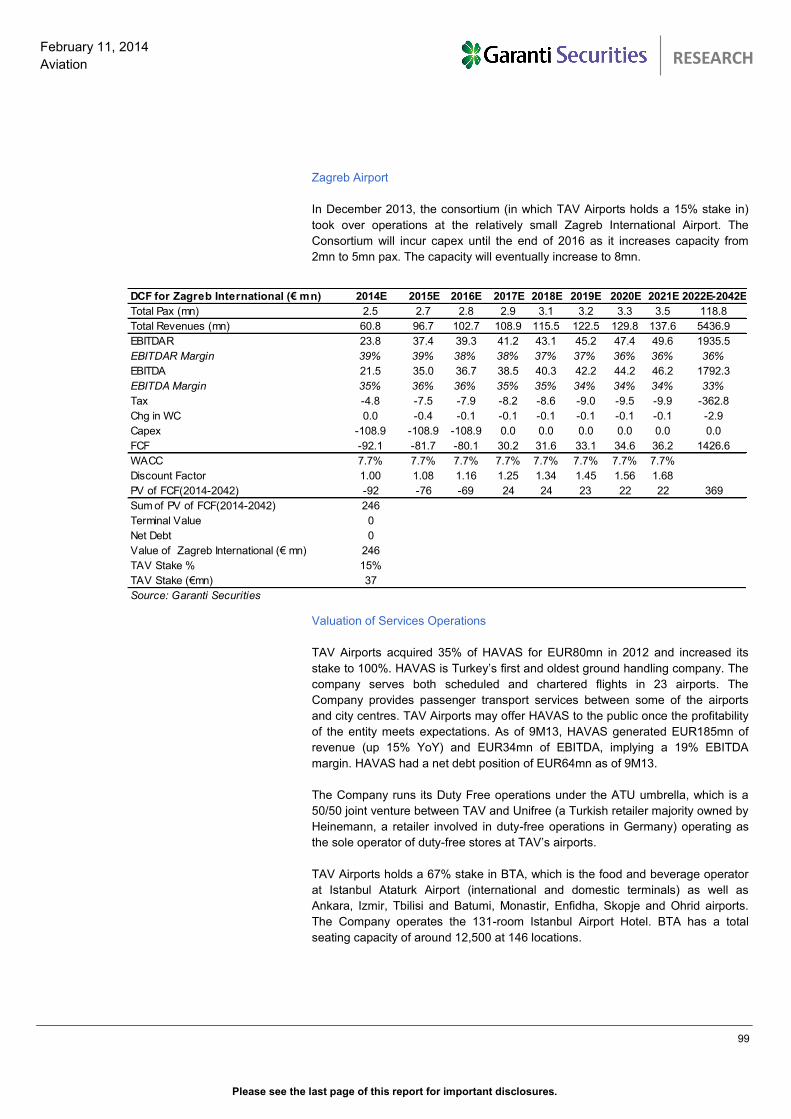
Please see the last page of this report for important disclosures.
99
February 11, 2014
Aviation
TURKISH AVIATION SECTOR
RESEARCH
Zagreb Airport
In December 2013, the consortium (in which TAV Airports holds a 15% stake in)
took over operations at the relatively small Zagreb International Airport. The
Consortium will incur capex until the end of 2016 as it increases capacity from
2mn to 5mn pax. The capacity will eventually increase to 8mn.
Valuation of Services Operations
TAV Airports acquired 35% of HAVAS for EUR80mn in 2012 and increased its
stake to 100%. HAVAS is Turkey’s first and oldest ground handling company. The
company serves both scheduled and chartered flights in 23 airports. The
Company provides passenger transport services between some of the airports
and city centres. TAV Airports may offer HAVAS to the public once the profitability
of the entity meets expectations. As of 9M13, HAVAS generated EUR185mn of
revenue (up 15% YoY) and EUR34mn of EBITDA, implying a 19% EBITDA
margin. HAVAS had a net debt position of EUR64mn as of 9M13.
The Company runs its Duty Free operations under the ATU umbrella, which is a
50/50 joint venture between TAV and Unifree (a Turkish retailer majority owned by
Heinemann, a retailer involved in duty-free operations in Germany) operating as
the sole operator of duty-free stores at TAV’s airports.
TAV Airports holds a 67% stake in BTA, which is the food and beverage operator
at Istanbul Ataturk Airport (international and domestic terminals) as well as
Ankara, Izmir, Tbilisi and Batumi, Monastir, Enfidha, Skopje and Ohrid airports.
The Company operates the 131-room Istanbul Airport Hotel. BTA has a total
seating capacity of around 12,500 at 146 locations.
DCF for Zagreb International (€ mn) 2014E 2015E 2016E 2017E 2018E 2019E 2020E 2021E 2022E-2042E
Total Pax (mn) 2.5 2.7 2.8 2.9 3.1 3.2 3.3 3.5 118.8
Total Revenues (mn) 60.8 96.7 102.7 108.9 115.5 122.5 129.8 137.6 5436.9
EBITDAR 23.8 37.4 39.3 41.2 43.1 45.2 47.4 49.6 1935.5
EBITDAR Margin 39% 39% 38% 38% 37% 37% 36% 36% 36%
EBITDA 21.5 35.0 36.7 38.5 40.3 42.2 44.2 46.2 1792.3
EBITDA Margin 35% 36% 36% 35% 35% 34% 34% 34% 33%
Tax -4.8 -7.5 -7.9 -8.2 -8.6 -9.0 -9.5 -9.9 -362.8
Chg in WC 0.0 -0.4 -0.1 -0.1 -0.1 -0.1 -0.1 -0.1 -2.9
Capex -108.9 -108.9 -108.9 0.0 0.0 0.0 0.0 0.0 0.0
FCF -92.1 -81.7 -80.1 30.2 31.6 33.1 34.6 36.2 1426.6
WACC 7.7% 7.7% 7.7% 7.7% 7.7% 7.7% 7.7% 7.7%
Discount Factor 1.00 1.08 1.16 1.25 1.34 1.45 1.56 1.68
PV of FCF(2014-2042) -92 -76 -69 24 24 23 22 22 369
Sum of PV of FCF(2014-2042) 246
Terminal Value 0
Net Debt 0
Value of Zagreb International (€ mn) 246
TAV Stake % 15%
TAV Stake (€mn) 37
Source: Garanti Securities
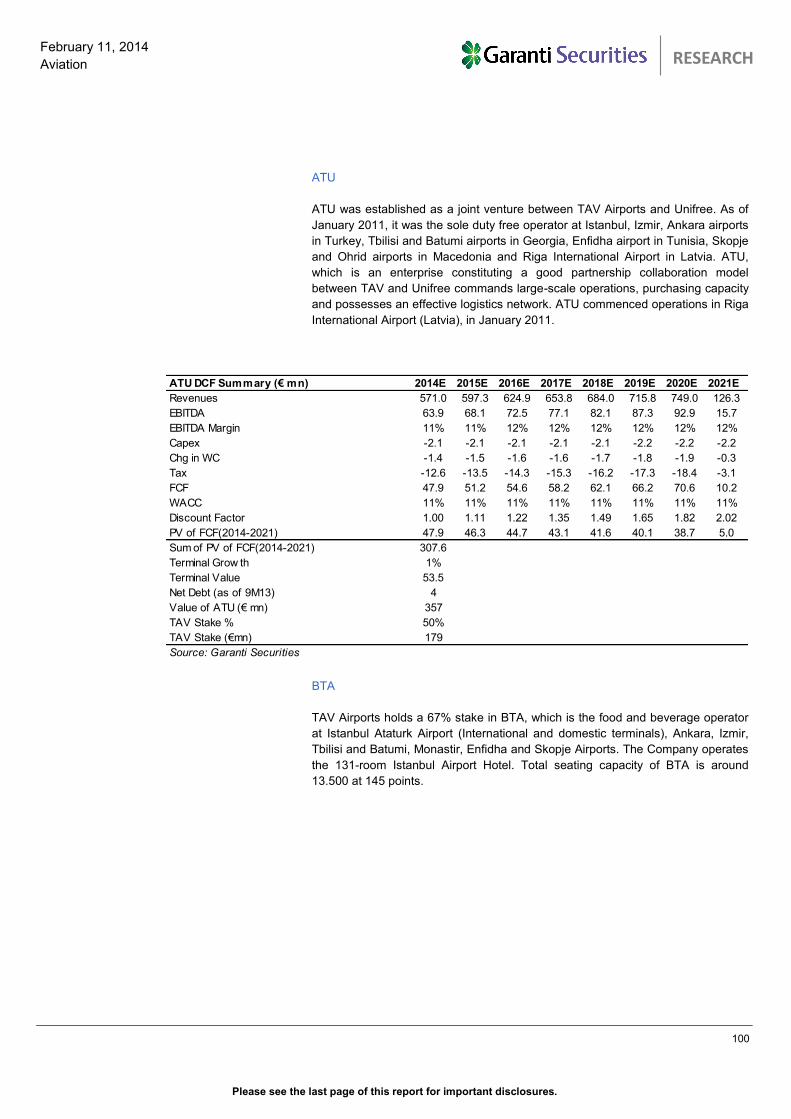
Please see the last page of this report for important disclosures.
100
February 11, 2014
Aviation
TURKISH AVIATION SECTOR
RESEARCH
ATU
ATU was established as a joint venture between TAV Airports and Unifree. As of
January 2011, it was the sole duty free operator at Istanbul, Izmir, Ankara airports
in Turkey, Tbilisi and Batumi airports in Georgia, Enfidha airport in Tunisia, Skopje
and Ohrid airports in Macedonia and Riga International Airport in Latvia. ATU,
which is an enterprise constituting a good partnership collaboration model
between TAV and Unifree commands large-scale operations, purchasing capacity
and possesses an effective logistics network. ATU commenced operations in Riga
International Airport (Latvia), in January 2011.
BTA
TAV Airports holds a 67% stake in BTA, which is the food and beverage operator
at Istanbul Ataturk Airport (International and domestic terminals), Ankara, Izmir,
Tbilisi and Batumi, Monastir, Enfidha and Skopje Airports. The Company operates
the 131-room Istanbul Airport Hotel. Total seating capacity of BTA is around
13.500 at 145 points.
ATU DCF Summary (€ mn) 2014E 2015E 2016E 2017E 2018E 2019E 2020E 2021E
Revenues 571.0 597.3 624.9 653.8 684.0 715.8 749.0 126.3
EBITDA 63.9 68.1 72.5 77.1 82.1 87.3 92.9 15.7
EBITDA Margin 11% 11% 12% 12% 12% 12% 12% 12%
Capex -2.1 -2.1 -2.1 -2.1 -2.1 -2.2 -2.2 -2.2
Chg in WC -1.4 -1.5 -1.6 -1.6 -1.7 -1.8 -1.9 -0.3
Tax -12.6 -13.5 -14.3 -15.3 -16.2 -17.3 -18.4 -3.1
FCF 47.9 51.2 54.6 58.2 62.1 66.2 70.6 10.2
WACC 11% 11% 11% 11% 11% 11% 11% 11%
Discount Factor 1.00 1.11 1.22 1.35 1.49 1.65 1.82 2.02
PV of FCF(2014-2021) 47.9 46.3 44.7 43.1 41.6 40.1 38.7 5.0
Sum of PV of FCF(2014-2021) 307.6
Terminal Grow th 1%
Terminal Value 53.5
Net Debt (as of 9M13) 4
Value of ATU (€ mn) 357
TAV Stake % 50%
TAV Stake (€mn) 179
Source: Garanti Securities
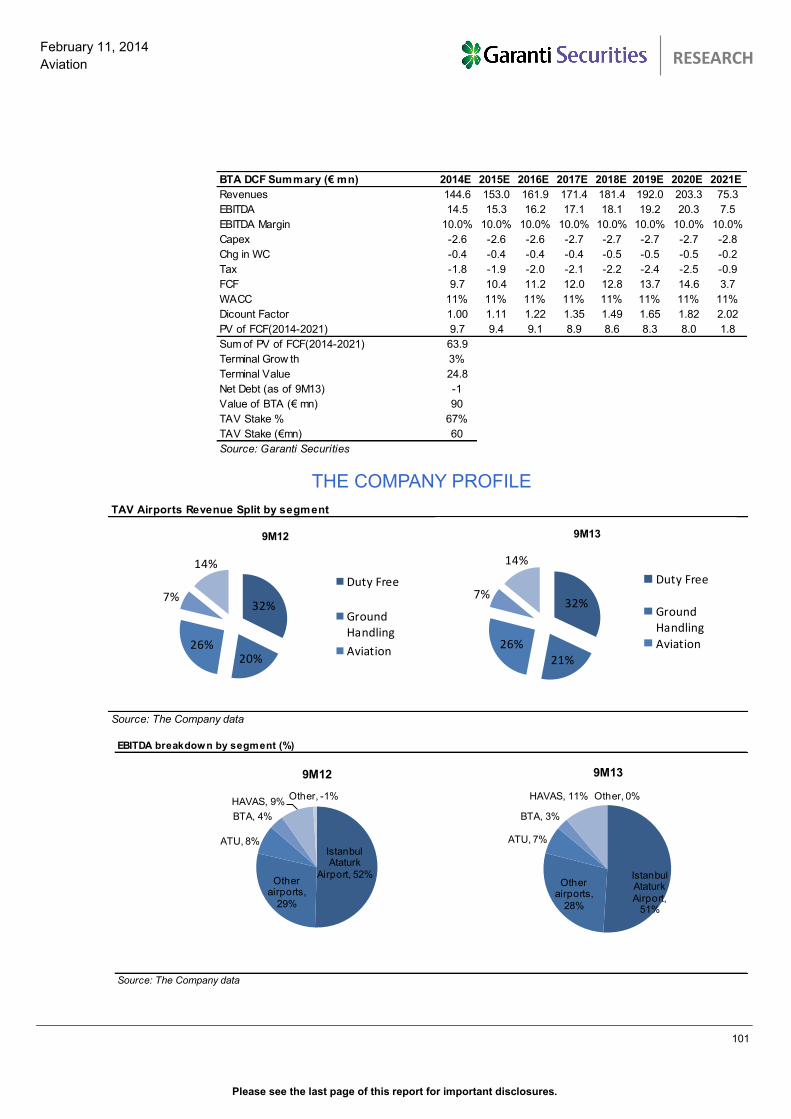
Please see the last page of this report for important disclosures.
101
February 11, 2014
Aviation
TURKISH AVIATION SECTOR
RESEARCH
THE COMPANY PROFILE
BTA DCF Summary (€ mn) 2014E 2015E 2016E 2017E 2018E 2019E 2020E 2021E
Revenues 144.6 153.0 161.9 171.4 181.4 192.0 203.3 75.3
EBITDA 14.5 15.3 16.2 17.1 18.1 19.2 20.3 7.5
EBITDA Margin 10.0% 10.0% 10.0% 10.0% 10.0% 10.0% 10.0% 10.0%
Capex -2.6 -2.6 -2.6 -2.7 -2.7 -2.7 -2.7 -2.8
Chg in WC -0.4 -0.4 -0.4 -0.4 -0.5 -0.5 -0.5 -0.2
Tax -1.8 -1.9 -2.0 -2.1 -2.2 -2.4 -2.5 -0.9
FCF 9.7 10.4 11.2 12.0 12.8 13.7 14.6 3.7
WACC 11% 11% 11% 11% 11% 11% 11% 11%
Dicount Factor 1.00 1.11 1.22 1.35 1.49 1.65 1.82 2.02
PV of FCF(2014-2021) 9.7 9.4 9.1 8.9 8.6 8.3 8.0 1.8
Sum of PV of FCF(2014-2021) 63.9
Terminal Grow th 3%
Terminal Value 24.8
Net Debt (as of 9M13) -1
Value of BTA (€ mn) 90
TAV Stake % 67%
TAV Stake (€mn) 60
Source: Garanti Securities
.
TAV Airports Revenue Split by segment
Source: The Company data
32%
20%26%
7%
14%
9M12
Duty Free
GroundHandling
Aviation
32%
21%26%
7%
14%
9M13
Duty Free
GroundHandling
Aviation
EBITDA breakdown by segment (%)
Source: The Company data
Istanbul Ataturk
Airport, 52%Other
airports,
29%
ATU, 8%
BTA, 4%
HAVAS, 9%Other, -1%
9M12
Istanbul Ataturk
Airport, 51%
Other airports,
28%
ATU, 7%
BTA, 3%
HAVAS, 11% Other, 0%
9M13
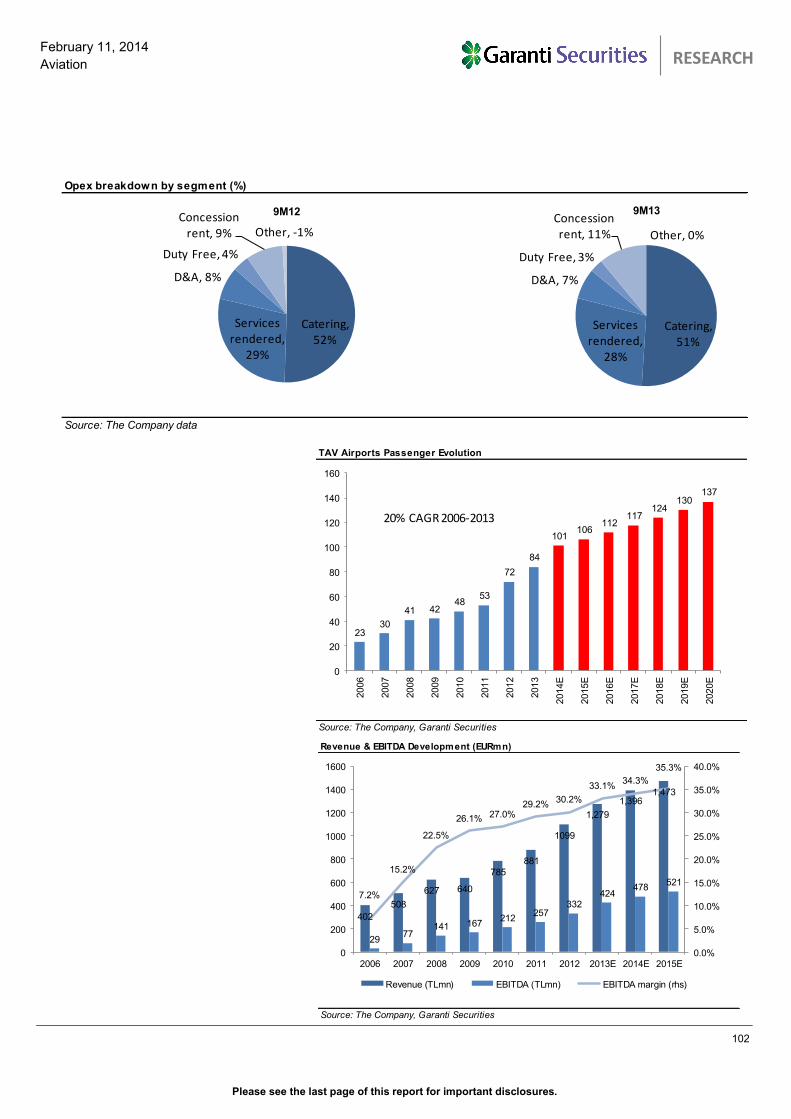
Please see the last page of this report for important disclosures.
102
February 11, 2014
Aviation
TURKISH AVIATION SECTOR
RESEARCH
Opex breakdown by segment (%)
Source: The Company data
Catering, 52%
Services rendered,
29%
D&A, 8%
Duty Free, 4%
Concession rent, 9% Other, -1%
9M12
Catering, 51%
Services rendered,
28%
D&A, 7%
Duty Free, 3%
Concession rent, 11% Other, 0%
9M13
TAV Airports Passenger Evolution
Source: The Company, Garanti Securities
2330
41 4248
53
72
84
101106
112117
124130
137
0
20
40
60
80
100
120
140
160
2006
2007
2008
2009
2010
2011
2012
2013
2014E
2015E
2016E
2017E
2018E
2019E
2020E
20% CAGR 2006-2013
Revenue & EBITDA Development (EURmn)
Source: The Company, Garanti Securities
402
508
627 640
785
881
1099
1,279
1,3961,473
2977
141 167212
257332
424478
521
7.2%
15.2%
22.5%
26.1% 27.0%29.2%
30.2%
33.1%34.3%
35.3%
0.0%
5.0%
10.0%
15.0%
20.0%
25.0%
30.0%
35.0%
40.0%
0
200
400
600
800
1000
1200
1400
1600
2006 2007 2008 2009 2010 2011 2012 2013E 2014E 2015E
Revenue (TLmn) EBITDA (TLmn) EBITDA margin (rhs)
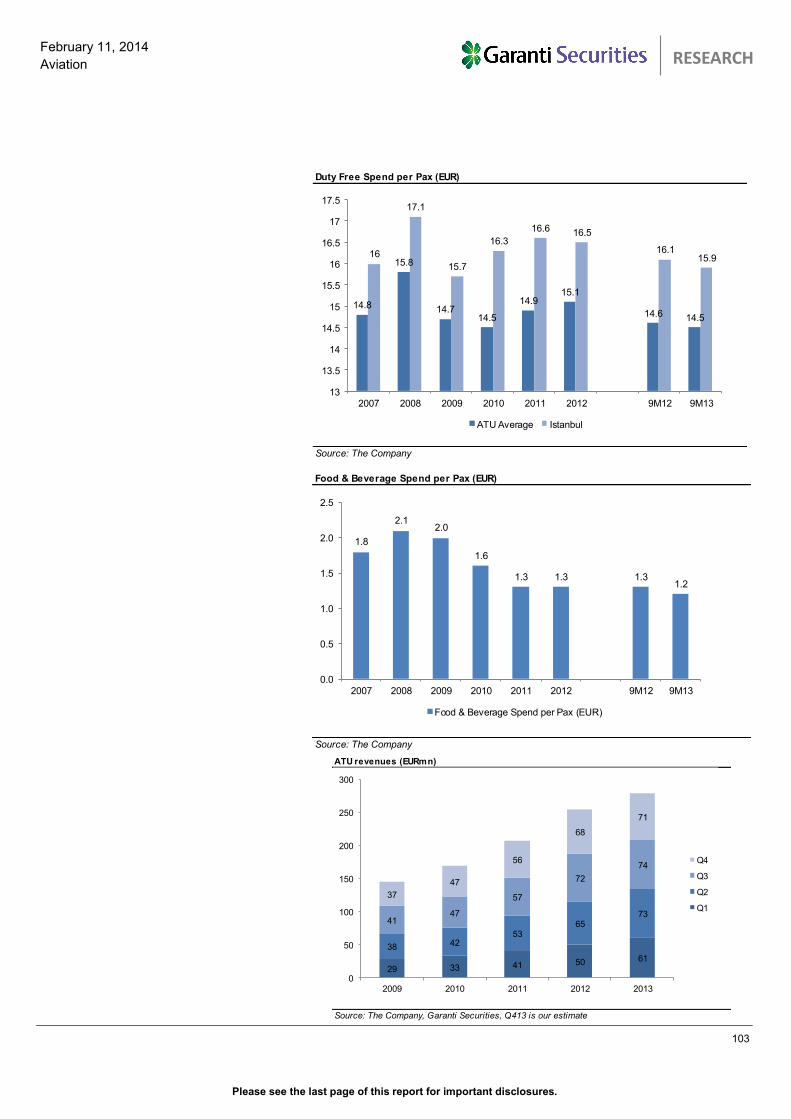
Please see the last page of this report for important disclosures.
103
February 11, 2014
Aviation
TURKISH AVIATION SECTOR
RESEARCH
Duty Free Spend per Pax (EUR)
Source: The Company
16
17.1
15.7
16.3
16.6 16.5
16.115.9
14.8
15.8
14.714.5
14.915.1
14.6 14.5
13
13.5
14
14.5
15
15.5
16
16.5
17
17.5
2007 2008 2009 2010 2011 2012 9M12 9M13
ATU Average Istanbul
Food & Beverage Spend per Pax (EUR)
Source: The Company
1.8
2.12.0
1.6
1.3 1.3 1.31.2
0.0
0.5
1.0
1.5
2.0
2.5
2007 2008 2009 2010 2011 2012 9M12 9M13
Food & Beverage Spend per Pax (EUR)
ATU revenues (EURmn)
Source: The Company, Garanti Securities, Q413 is our estimate
37
47
56
68
71
4147
57
72
74
38 4253
6573
29 33 41 50 61
0
50
100
150
200
250
300
2009 2010 2011 2012 2013
Q4
Q3
Q2
Q1
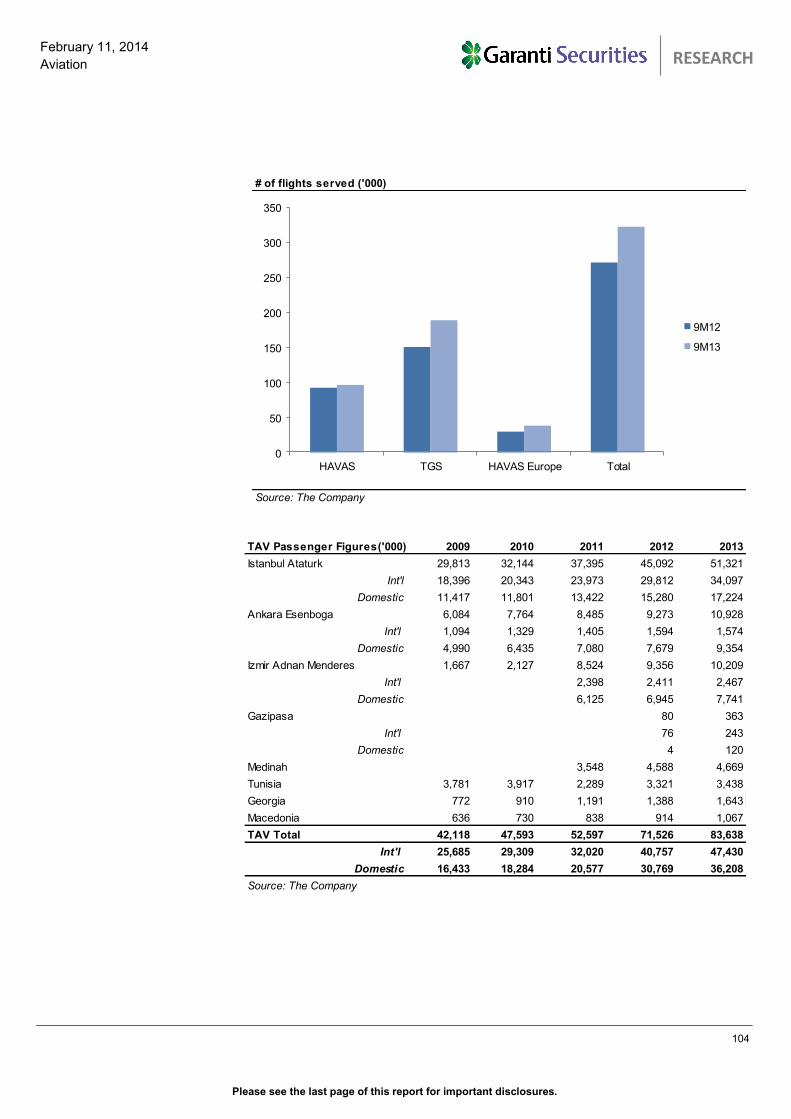
Please see the last page of this report for important disclosures.
104
February 11, 2014
Aviation
TURKISH AVIATION SECTOR
RESEARCH
# of flights served ('000)
Source: The Company
0
50
100
150
200
250
300
350
HAVAS TGS HAVAS Europe Total
9M12
9M13
TAV Passenger Figures('000) 2009 2010 2011 2012 2013
Istanbul Ataturk 29,813 32,144 37,395 45,092 51,321
Int'l 18,396 20,343 23,973 29,812 34,097
Domestic 11,417 11,801 13,422 15,280 17,224
Ankara Esenboga 6,084 7,764 8,485 9,273 10,928
Int'l 1,094 1,329 1,405 1,594 1,574
Domestic 4,990 6,435 7,080 7,679 9,354
Izmir Adnan Menderes 1,667 2,127 8,524 9,356 10,209
Int'l 2,398 2,411 2,467
Domestic 6,125 6,945 7,741
Gazipasa 80 363
Int'l 76 243
Domestic 4 120
Medinah 3,548 4,588 4,669
Tunisia 3,781 3,917 2,289 3,321 3,438
Georgia 772 910 1,191 1,388 1,643
Macedonia 636 730 838 914 1,067
TAV Total 42,118 47,593 52,597 71,526 83,638
Int'l 25,685 29,309 32,020 40,757 47,430
Domestic 16,433 18,284 20,577 30,769 36,208
Source: The Company
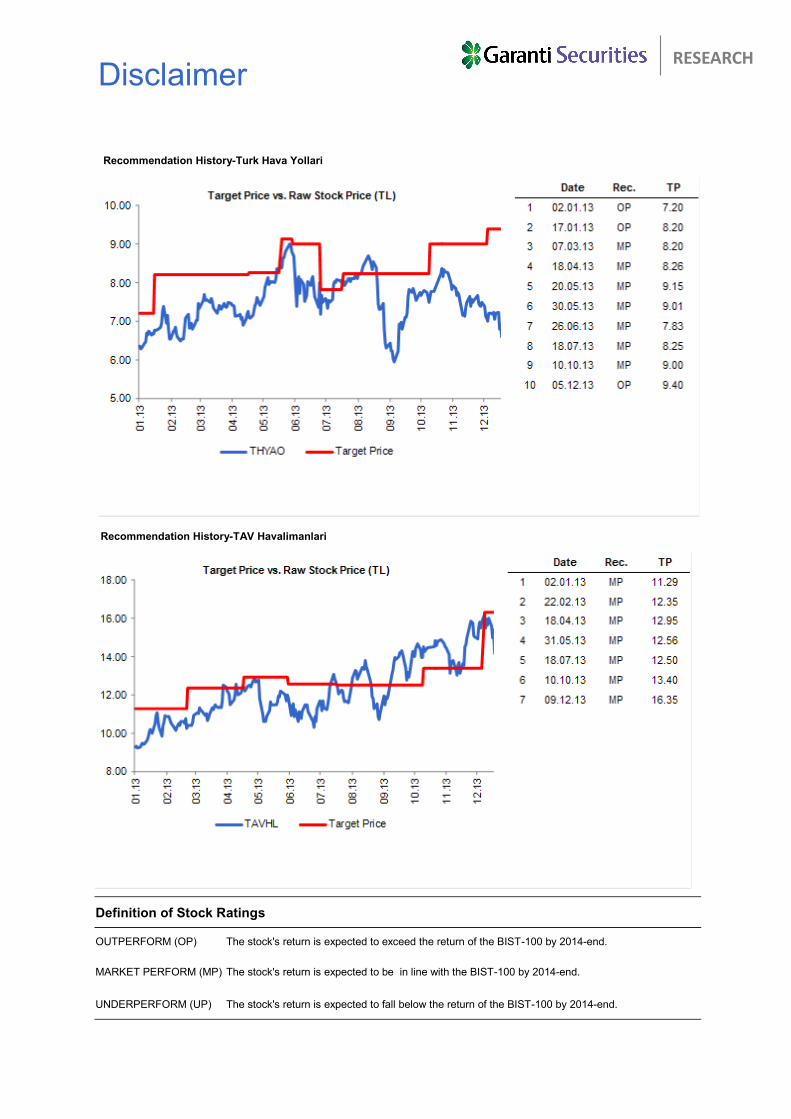
Disclaimer
Definition of Stock Ratings
OUTPERFORM (OP) The stock's return is expected to exceed the return of the BIST-100 by 2014-end.
MARKET PERFORM (MP) The stock's return is expected to be in line with the BIST-100 by 2014-end.
UNDERPERFORM (UP) The stock's return is expected to fall below the return of the BIST-100 by 2014-end.
RESEARCH
Recommendation History-Turk Hava Yollari
Recommendation History-TAV Havalimanlari
Disclaimer
This document and the information, opinions, estimates and recommendations expressed herein,
have been prepared by Garanti Securities Research Department, to provide its customers with
general information regarding the date of issue of the report and are subject to changes without prior
notice. All opinions and estimates included in this report constitute our judgment as of this date and
are subject to change without notice.
This document and its contents do not constitute an offer, invitation or solicitation to purchase or
subscribe to any securities or other instruments, or to undertake or divest investments. Neither shall
this document nor its contents form the basis of any contract, commitment or decision of any kind.
Investor who have access to this document should be aware that the securities, instruments or
investments to which it refers may not be appropriate for them due to their specific investment goals,
financial positions or risk profiles, as these have not been taken into account to prepare this report.
Therefore, investors should make their own investment decisions considering the said circumstances
and obtaining such specialized advice as may be necessary. The information in this report has been
obtained by Garanti Securities Research Department from sources believed to be reliable. However,
Garanti Securities cannot guarantee the accuracy, adequacy, or completeness of such information,
and cannot be responsible for the results of investment decisions made on account of this report.
The market prices of securities or instruments or the results of investments could fluctuate against
the interests of investors. Investors should be aware that they could even face a loss of their
investment. Transactions in futures, options and securities or high-yield securities can involve high
risks and are not appropriate for every investor. Indeed, in the case of some investments, the
potential losses may exceed the amount of initial investment and, in such circumstances, investors
may be required to pay more money to support those losses. Thus, before undertaking any
transaction with these instruments, investors should be aware of their operation, as well as the rights,
liabilities and risks implied by the same and the underlying stocks. Investors should also be aware
that secondary markets for the said instruments may be limited or even not exist.
This report is to be distributed to professional emerging markets investors only. This report is for
private use only and intended solely for the individual(s). No information in this report may be copied,
modified, republished or exploited in anyway without the prior consent of Garanti Securities.
Additionally, with respect to our statements above, all our claims and plea rights are covered in the
regulations which apply in the countries that this report has been sent to.
Garanti Securities
Etiler Mah. Tepecik Yolu
Demirkent Sokak No:1
34337 Besiktas, Istanbul / Turkey
Phone: +90 (212) 384-1155
Fax: +90 (212) 352-4240
RESEARCH