Embed Size (px)
Citation preview

Turbulent Flow Catalyst: Solution for Euro 5 and beyond
Rolf Brück, Lorenzo Pace, Manuel Presti 1. Introduction At the very beginning of exhaust aftertreatment technology, highly efficient pellet catalyst were used. This type of catalyst showed very high mass transfer rates, which were comparable to those of turbulent flow conditions. Nevertheless, catalyst beds made of pellets were condemned to fail due to abrasion caused by mechanical vibration and gas pulsation. After this first technology, both metallic and ceramic straight channel monolith were used. Due to the straight channels the chemical reaction is limited by the poor mass transfer rate to the channel wall. The governing factor in these laminar flow conditions is the pollutant diffusion from channel centre to the coated wall. The research and development during the past years have been focused on efficiency improvement of these type of channel, i.e. high cell density and thin foils, rather than on the research of innovative channel structure. For this reason many studies have been carried out in order to simulate, by means of different CFD techniques, the flow within the catalytical channel. Emitec has introduced in the last years two new channel structures that create turbulent like flow condition dramatically increasing the catalytical efficiency: Longitudinal Structure (LS-Design®) and Perforated Foils (PE-DesignTM) [1, 2, 3, 4]. The development of these structures was carried out using CFD simulation with turbulent flow model and experimental programs [7]. In the present paper, details on the turbulent like flow catalyst modelling and practical application example will be given. 2. Description of Longitudinal Structure (LS-Design®) Metallic substrates are made of flat and corrugated foils stapled alternatively in order to create the channels. Standard channels are, as known, straight and don’t allow any gas exchange with their neighbour channels. Under this conditions, the flow, behind the inlet zone where it is not jet developed, is fully laminar. It is well known, that in a laminar flow the catalytic process is diffusion governed and that the diffusion process is very slow. A way to enhance the catalytical efficiency is to repeat the inlet conditions as often as possible. An example of such a system in given in [Fig. 1]. It was not possible to use the disc catalyst in production because of the high cost and the complicated canning technology requested. On the other hand, the disc catalyst was very efficient [5, 6].
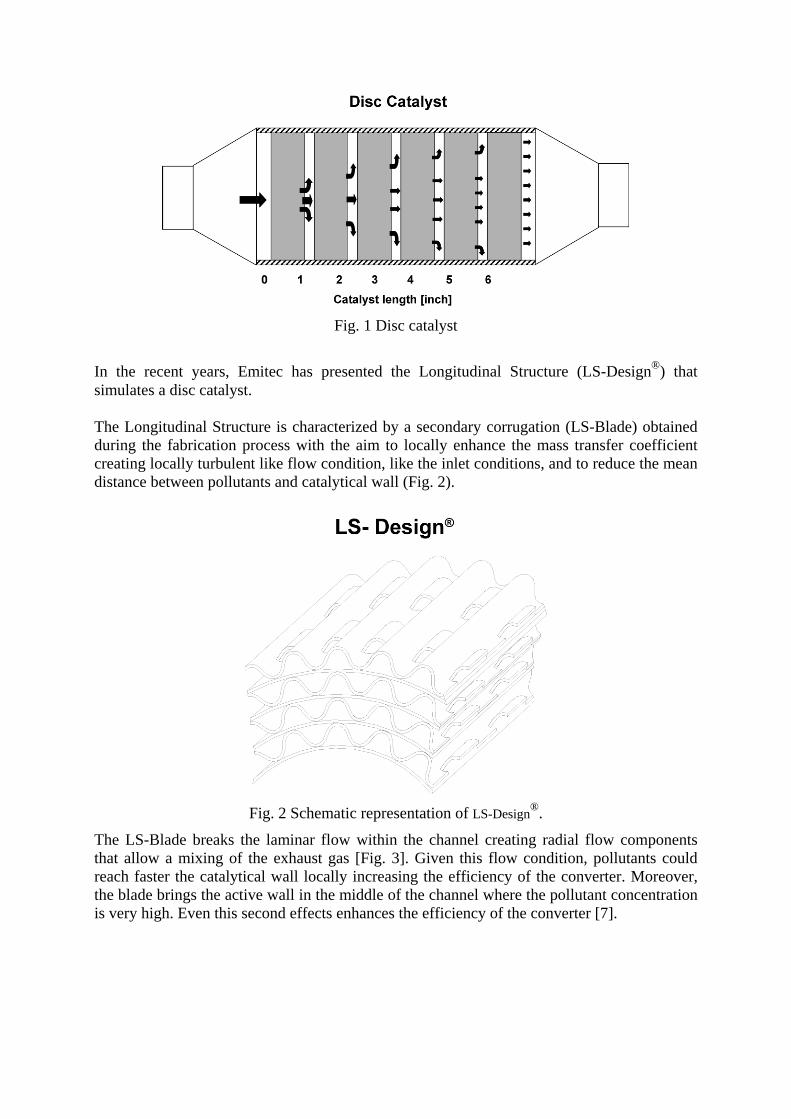
Fig. 1 Disc catalyst
In the recent years, Emitec has presented the Longitudinal Structure (LS-Design®) that simulates a disc catalyst. The Longitudinal Structure is characterized by a secondary corrugation (LS-Blade) obtained during the fabrication process with the aim to locally enhance the mass transfer coefficient creating locally turbulent like flow condition, like the inlet conditions, and to reduce the mean distance between pollutants and catalytical wall (Fig. 2).
Fig. 2 Schematic representation of LS-Design®.
The LS-Blade breaks the laminar flow within the channel creating radial flow components that allow a mixing of the exhaust gas [Fig. 3]. Given this flow condition, pollutants could reach faster the catalytical wall locally increasing the efficiency of the converter. Moreover, the blade brings the active wall in the middle of the channel where the pollutant concentration is very high. Even this second effects enhances the efficiency of the converter [7].

Fig. 3 Turbulent Flow Condition over the LS-Blade
A deeper description of the effect of LS-Blade will be showed later on a further chapter. 3. Description of Perforated Structure (PE-DesignTM) In close coupled applications, due to space constraint, quite oft the inlet flow distribution could not be optimised. The possibility to allow radial flow improving the inner flow distribution could be a key factor. The LS-Design® allows radial flow only with the first neighbour channels because the flat foils are not porous and a relevant flow distribution improvement is not possible. Emitec introduced in the past years the Perforated Structure that is characterized by the presence of 8mm diameters holes both in corrugated and flat foils [Fig. 4].
Fig. 4 Perforated flat and corrugated foil

During the stacking of perforated foils, due to the presence of the holes, some cylindrical caverns builds up. These caverns are then stretched during the wounding process and the final form of these caverns is like a spiral (Fig. 5).
Fig. 5 PE structure with “caverns”
The advantages of such a structure is to allow a radial mixing of the flow with a beneficial effect both on pressure and pollutant concentration gradient and to create turbulent like conditions in the cavern and each time the flow enter in the channel leaving the cavern. On the other hand, besides the beneficial effect of an equalized pressure distribution within the substrate, the total backpressure of a PE structure is usually lower compared to a standard substrate thanks to the low backpressure in the cavers (high hydraulic diameter on lower wall friction) that compensate the repeated inlet and outlet conditions. 4. Theoretical characterization of the LS-Design®
In the previous chapter it has been said, that in a standard channel, after the inlet zone where the flow is not completely developed but is turbulent like, the flow becomes laminar [8]. Fig. 6 shows the calculated CFD flow distribution for a standard 400 cpsi channel.
Fig. 6 Calculated velocity distribution within one channel (400 cpsi)

The mass transfer coefficient depends on the diffusion process that brings the pollutants from the middle of the channel where their concentration is high to the catalytical wall, where they fast reacts, through the laminar layer. In warmed up conditions this is usually the “bottle neck” of the entire catalytical process, determining the final process velocity. Using a CFD simulation program the pollutant concentration in a cell cross-section has been calculated [Fig. 7] . The simulation has been carried out for a 200 cpsi with a flow velocity in the channel of 5 m/s and exhaust gas temperature of 400°C. Two different channel structure have been compared: the standard 200 cpsi and the 200/400 LS-Design®.
Fig. 7 Layout and dimensions of the models used in the CFD-calculation of the cell structures, LS compared to standard. Fig. 8 shows the pollutant concentration profile of the two different channels (Standard and LS-Design®) calculated at four different axial positions of the catalyst. The axial position has been chosen to illustrate the pollutant concentration at the inlet, just behind the beginning of the first LS-Blade, just before the end of the first LS-Blade and just before the beginning of the second LS-Blade.
Fig. 8 Radial pollutant concentrations at different axial positions, LS compared to standard

It is possible to see how, just in the position 2, that means just before the end of the first LS-Blade, the pollutant concentration is much lower in the LS-Design® channel than in the standard channel.
Fig. 9 Mass Transfer coefficient along the substrate.
By means of a dedicated simulation program, it is possible to calculate the local value of the mass transfer coefficient [Fig. 9]. Each time that the flow goes through the LS-Blade, a significant increase of the local mass transfer coefficient value can be seen. Experimental characterization of the LS-Design®
A test program has been carried out to validate the CFD simulations. Three different engine load points have been chosen, as described in Table 1.
Table 1 Boundary conditions of the emissions measurement at constant load on engine test
bench, catalytic converters ø 98,4 x 101,5 mm / 300/600LS, 50 g/ft³ Pt:Rh:Pd = 5:0:1 The temperatures are the highest possible to reach with stable engine out emissions. All the three load points are above the mass transfer limited temperature, that means that it is possible to compare standard and LS-Design® catalyst considering only the mass diffusion process minimizing the kinetics effects. Moreover, it is possible to calculate the mass transfer coefficient and to compare it with the measurement.

The mass transfer coefficient β has been compared using the equation 1.
)1ln()1ln(
tantan dardS
LS
dardS
LS
EE
−−
=β
β Eq.. (1)
In the equation 1 the β value has been calculated according the equation 2.
)1(ln1 EAL
wVß
geoCat
ChannelCat −−=ε Eq.. (2)
Where:
β - Mass Transfer coefficient [m/s] E - Efficiency[-] VCat - Catalyst Volume [m³] ε Open frontal area w - Gas velocity in channel [m/s] L Catalyst length [m] Ageo - coated geometrical surface area [m²] Fig. 10 shows the measured THC and NOx emission at the three load points described in Table 1 both engine out and behind the catalyst.
Fig. 10 Measured THC and NOx emissions at three different constant loads
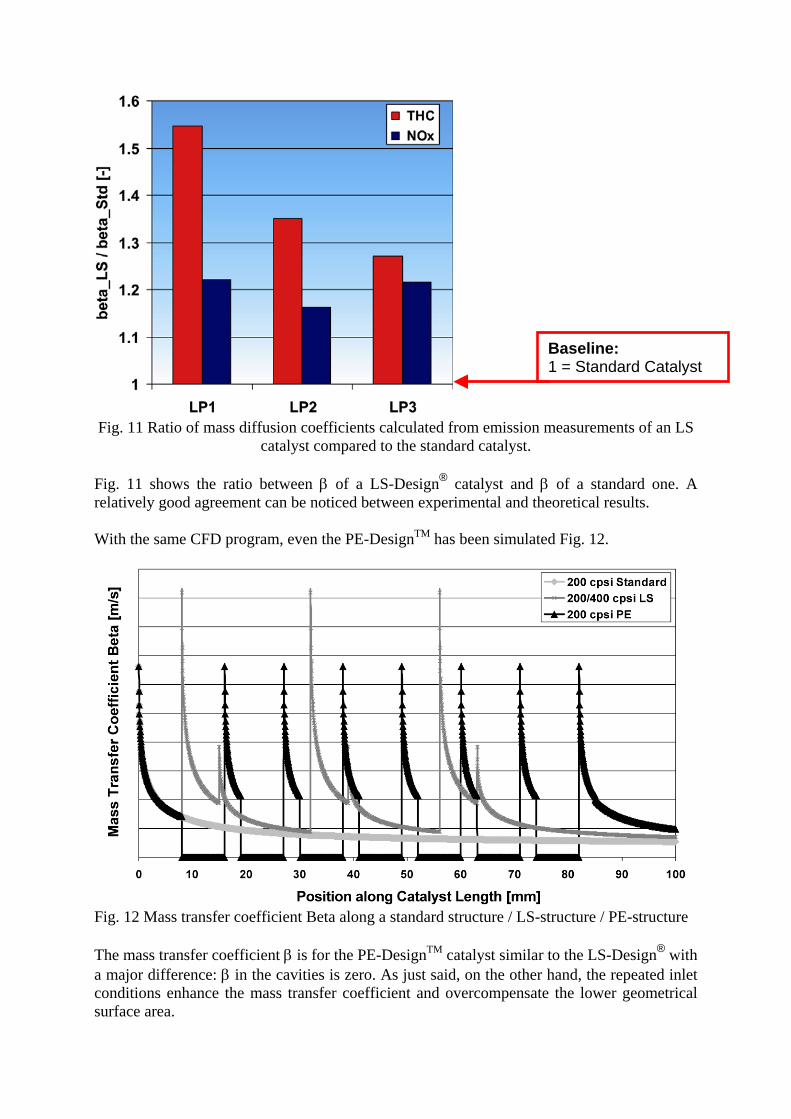
The advantage of LS-Design® is remarkable. Moreover, using equation 1 and 2, β coefficient has been compared Fig. 11.
t
Fig. 11 Ratio of mass diffusion coefficients calculated from emissioncatalyst compared to the standard catalyst.
Fig. 11 shows the ratio between β of a LS-Design® catalyst and relatively good agreement can be noticed between experimental and th With the same CFD program, even the PE-DesignTM has been simulat
Fig. 12 Mass transfer coefficient Beta along a standard structure / LS- The mass transfer coefficient β is for the PE-DesignTM catalyst similara major difference: β in the cavities is zero. As just said, on the otherconditions enhance the mass transfer coefficient and overcompensatsurface area.
Baseline: 1 = Standard Catalys
measurements of an LS
β of a standard one. A eoretical results.
ed Fig. 12.
structure / PE-structure
to the LS-Design® with hand, the repeated inlet e the lower geometrical

5. Experimental characterization of PE-DesignTM
In a previous chapter, some general characteristics of PE-DesignTM have been introduced: - homogeneous distribution of flow and pollutant concentrations (Fig. 13) - compensation of lambda cylinder-to-cylinder variations - reduction of heat capacity - back-pressure reduction
Standard Catalyst
Inlet Outlet
UI=0,830
PE-Catalyst
Inlet Outlet
Standard Catalyst
Inlet Outlet
UI=0,906UI=0,830
Standard Catalyst
Inlet
Standard Catalyst
Inlet
Standard Catalyst
InletInlet Outlet
PE-Catalyst
Inlet Outlet
UI=0,830
OutletOutletOutlet
UI=0,830 UI=0,906
PE-Catalyst
Inlet Outlet
PE-Catalyst
Inlet
PE-Catalyst
Inlet OutletOutlet
UI=0,906
Fig. 13 Improvement of flow distribution in a PE-DesignTM catalyst.
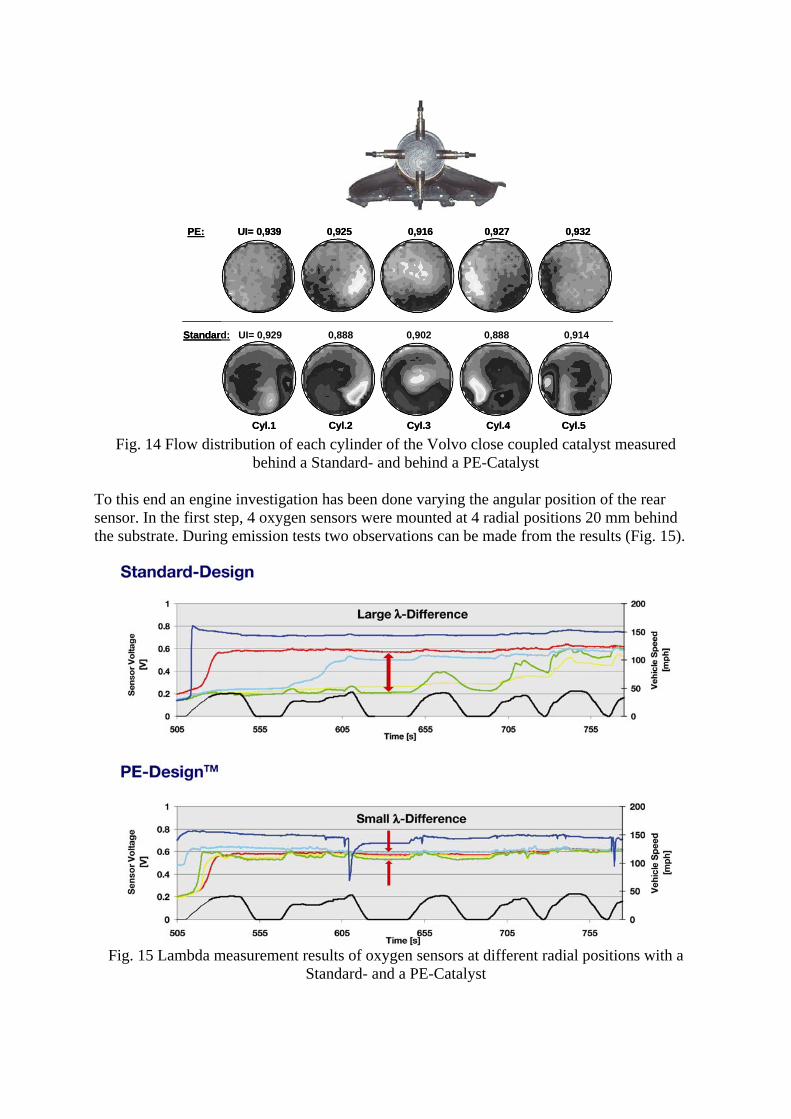
In the present chapter an investigation on Lambda Sensor quality signal depending on outlet flow distribution will be presented. Depending on the space layout in the underhood engine compartment the radial position of the Lambda sensor is limited. Taking a look at the flow distribution of each cylinder in the close coupled catalyst of the Volvo 5 cylinder (Fig. 14) it can be seen that each cylinder is using a different cross section of the std catalyst whereas in the PE-Catalyst flow is highly redistributed.
Cyl.1 Cyl.2 Cyl.3 Cyl.4 Cyl.5
Standard: UI= 0,929 0,888 0,902 0,888 0,914
PE: UI= 0,939 0,925 0,916 0,927 0,932
Cyl.1 Cyl.2 Cyl.3 Cyl.4 Cyl.5
Standard: UI= 0,929 0,888 0,902 0,888 0,914
PE: UI= 0,939 0,925 0,916 0,927 0,932
Fig. 14 Flow distribution of each cylinder of the Volvo close coupled catalyst measured
behind a Standard- and behind a PE-Catalyst To this end an engine investigation has been done varying the angular position of the rear sensor. In the first step, 4 oxygen sensors were mounted at 4 radial positions 20 mm behind the substrate. During emission tests two observations can be made from the results (Fig. 15).
Fig. 15 Lambda measurement results of oxygen sensors at different radial positions with a
Standard- and a PE-Catalyst

The four reference sensors are more aligned to each other when a PE substrate is used. Further, the control sensor and the reference sensor signals are more aligned when a PE substrate is used. To investigate the influence on tailpipe emissions of the radial sensor position on a vehicle, the sensor has been varied between two radial positions with 90° difference. The results in Fig. 16 show that, the radial position affected the emissions using a standard catalyst with straight channels. This explains the importance of a reliable sensor signal.
0
20
40
60
80
100
120
0 Degrees 90 Degrees
rel.
Em
issi
ons
[%] i
n FT
P
NOx Bag 2NMHC Bag 2
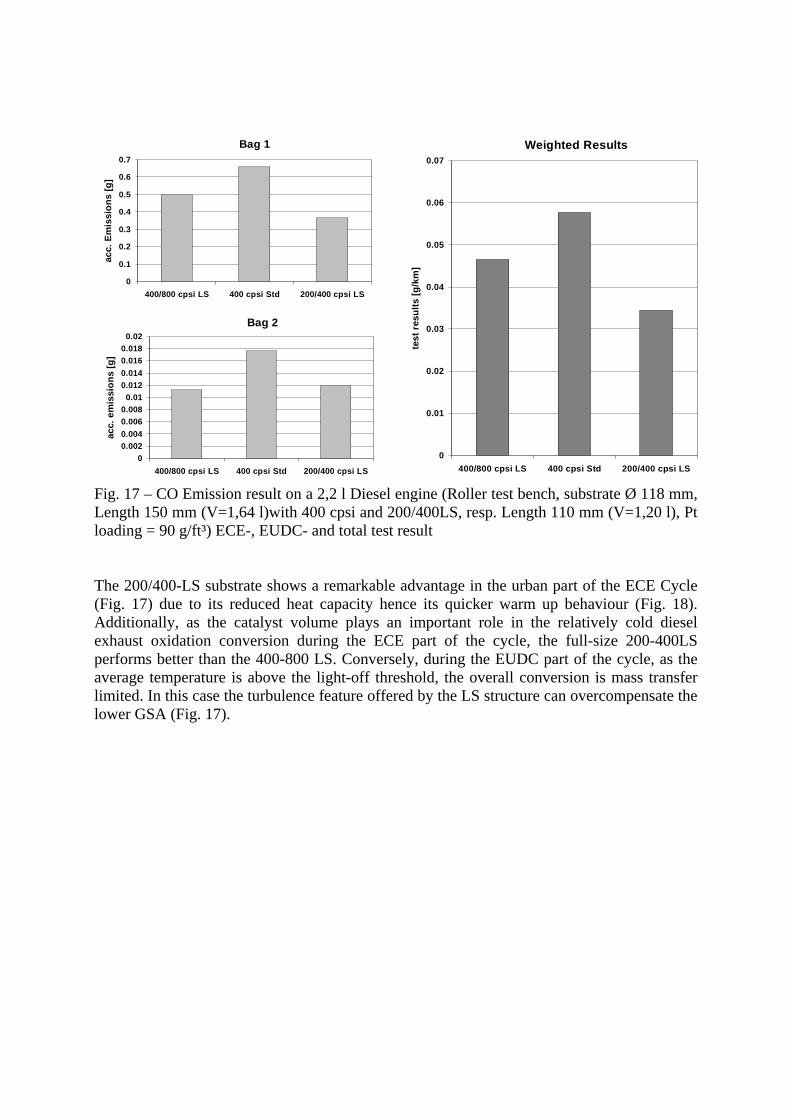
Fig. 16 Emission test results in the FTP Bag 2 depending on the rear sensor radial position. This difference is expected to be even more significant if the gas mixing zone (down-pipe) is shortened, which would be the case either in an extremely close-coupled catalyst type of installation or in an installation with biased flow distribution. 6. LS-Design®: an application case study as Diesel Oxidation catalyst In order to take advantage of the LS-design® features on a real-life application, a benchmark program has been carried out on a 2,2l Turbodiesel engine for Passenger Car. The baseline exhaust system consisted of a 400 cpsi standard converter. As alternatives both a volume-equal 200/400 cpsi LS and a 400/800 cpsi LS substrate with reduced volume have been compared according to the ECE Cycle.
Bag 1
0
0.1
0.2
0.3
0.4
0.5
0.6
0.7
400/800 cpsi LS 400 cpsi Std 200/400 cpsi LS
acc.
Em
issi
ons
[g]
Bag 2
00.0020.0040.0060.008
0.010.0120.0140.0160.018
0.02
400/800 cpsi LS 400 cpsi Std 200/400 cpsi LS
acc.
em
issi
ons
[g]
Weighted Results
0
0.01
0.02
0.03
0.04
0.05
0.06
0.07
400/800 cpsi LS 400 cpsi Std 200/400 cpsi LS
test
res
ults
[g/k
m]
Fig. 17 – CO Emission result on a 2,2 l Diesel engine (Roller test bench, substrate Ø 118 mm, Length 150 mm (V=1,64 l)with 400 cpsi and 200/400LS, resp. Length 110 mm (V=1,20 l), Pt loading = 90 g/ft³) ECE-, EUDC- and total test result The 200/400-LS substrate shows a remarkable advantage in the urban part of the ECE Cycle (Fig. 17) due to its reduced heat capacity hence its quicker warm up behaviour (Fig. 18). Additionally, as the catalyst volume plays an important role in the relatively cold diesel exhaust oxidation conversion during the ECE part of the cycle, the full-size 200-400LS performs better than the 400-800 LS. Conversely, during the EUDC part of the cycle, as the average temperature is above the light-off threshold, the overall conversion is mass transfer limited. In this case the turbulence feature offered by the LS structure can overcompensate the lower GSA (Fig. 17).

Fig. 18 Structure temperatures of various substrate designs 50 mm downstream from gas inlet side As a matter of fact the 400/800-LS converter shows similar efficiency as the baseline system despite its volume has been reduced by 27 % (1,2 Liter instead of 1,64 l). In the EUDC part of the cycle, the LS substrates perform 30% better in average as the baseline system. In conclusion the LS-Design® enables a significant material, weight and cost saving by replacing a 400 cpsi with a 200-400LS substrate on one hand or, on the other hand, a catalyst volume reduction at same cpsi leading to a Pt-content reduction. 7. PE-DesignTM: an application case study as Gasoline Three-Way catalyst The influence on emissions due to the Perforated Structure has been investigated in a Test program carried out on a 4 Cyl., 1.8 Liter Turbo-Engine. The emission tests have been performed according to the ECE Cycle. Several catalytic converters had identical dimensions and were loaded at 150 g/ft³ (Pt:Pd:Rh=1:27:2). The washcoat thickness was constant for all 300 cpsi substrates and was lower, in dependence to the higher GSA, for the 600 cpsi converters. Several catalytic systems have been tested before and after the aging profile according to the specifications of the ZDAKW. Several test parts have been preconditioned with a repetition of 3 EUD-Cycles. Detailed technical data of the systems are summarized in Table 2. Standard 300 cpsi PE 300 cpsi PE 600 cpsi Dimensions Ø 105 x 120 mm
300 cpsi / 40 µm / Standard
Ø 105 x 120 mm 300 cpsi / 40 µm / PE
Ø 105 x 120 mm 600 cpsi / 40 µm / PE
GSA [m²] 2,68 m² 1,81 m² 2,46 m² Backpressure [mbar] 58 52 87 Table 2: Technical data of tested converters. Washcoat loading 150 g/l on Standard substrates and 90 g/l on PE substrates. Backpressure calculation @ 500 kg / 950°C
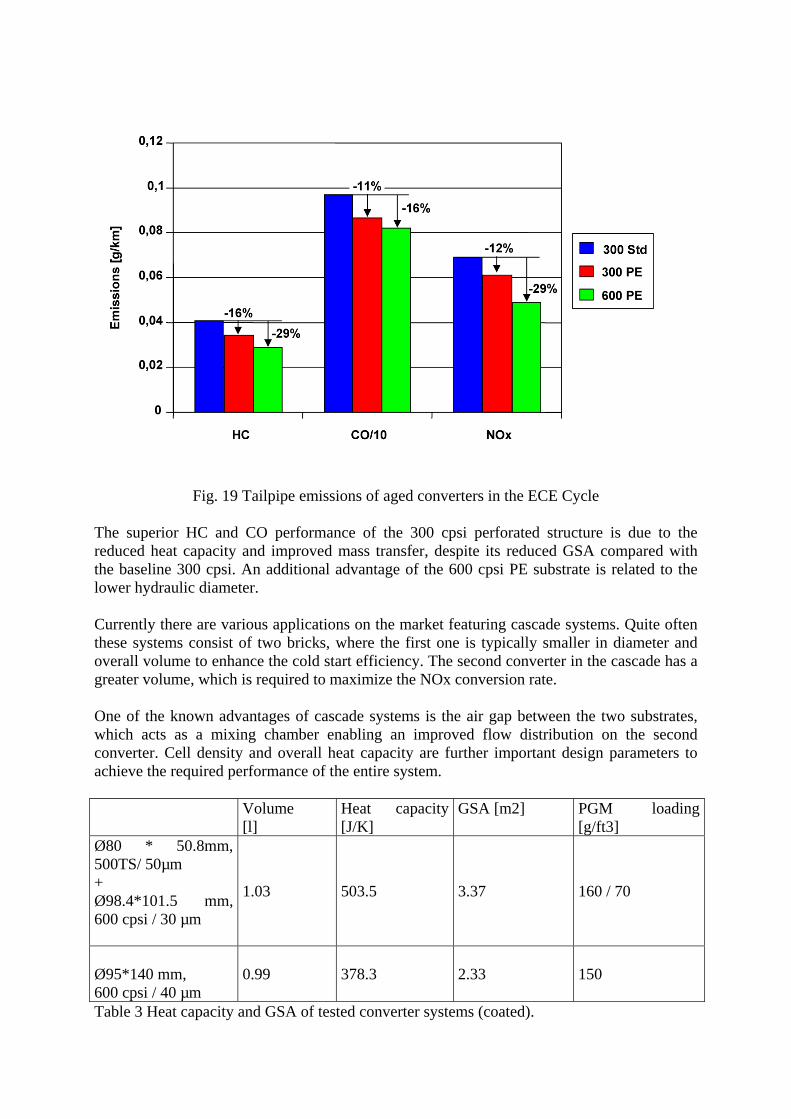
Fig. 19 Tailpipe emissions of aged converters in the ECE Cycle
The superior HC and CO performance of the 300 cpsi perforated structure is due to the reduced heat capacity and improved mass transfer, despite its reduced GSA compared with the baseline 300 cpsi. An additional advantage of the 600 cpsi PE substrate is related to the lower hydraulic diameter. Currently there are various applications on the market featuring cascade systems. Quite often these systems consist of two bricks, where the first one is typically smaller in diameter and overall volume to enhance the cold start efficiency. The second converter in the cascade has a greater volume, which is required to maximize the NOx conversion rate. One of the known advantages of cascade systems is the air gap between the two substrates, which acts as a mixing chamber enabling an improved flow distribution on the second converter. Cell density and overall heat capacity are further important design parameters to achieve the required performance of the entire system. Volume
[l] Heat capacity [J/K]
GSA [m2] PGM loading [g/ft3]
Ø80 * 50.8mm, 500TS/ 50µm + Ø98.4*101.5 mm, 600 cpsi / 30 µm
1.03 503.5 3.37 160 / 70
Ø95*140 mm, 600 cpsi / 40 µm
0.99 378.3 2.33 150
Table 3 Heat capacity and GSA of tested converter systems (coated).
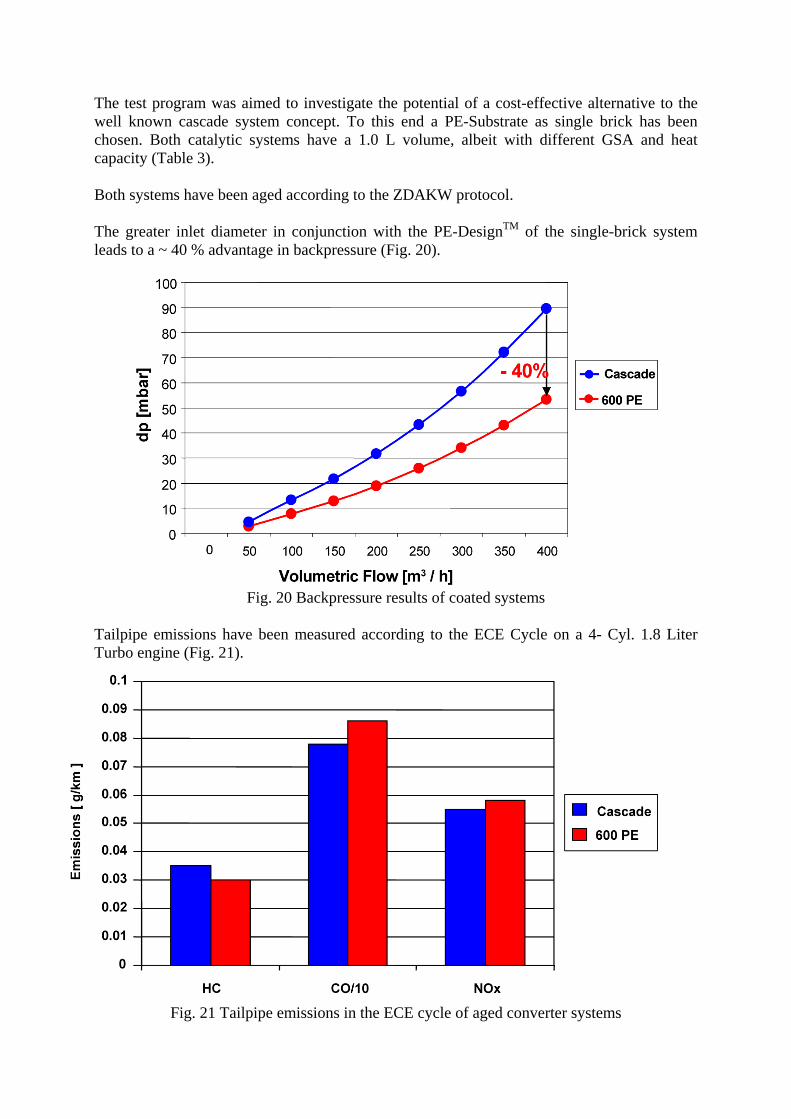
The test program was aimed to investigate the potential of a cost-effective alternative to the well known cascade system concept. To this end a PE-Substrate as single brick has been chosen. Both catalytic systems have a 1.0 L volume, albeit with different GSA and heat capacity (Table 3). Both systems have been aged according to the ZDAKW protocol. The greater inlet diameter in conjunction with the PE-DesignTM of the single-brick system leads to a ~ 40 % advantage in backpressure (Fig. 20).
Fig. 20 Backpressure results of coated systems
Tailpipe emissions have been measured according to the ECE Cycle on a 4- Cyl. 1.8 Liter Turbo engine (Fig. 21).
Fig. 21 Tailpipe emissions in the ECE cycle of aged converter systems
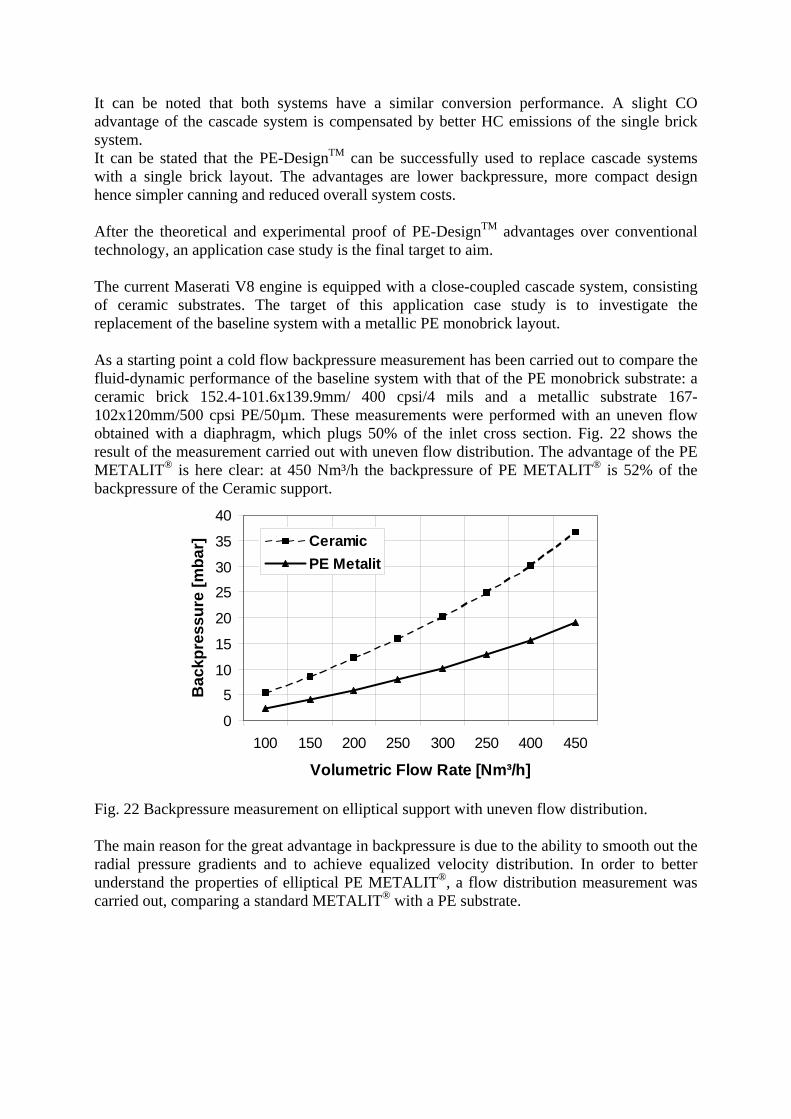
It can be noted that both systems have a similar conversion performance. A slight CO advantage of the cascade system is compensated by better HC emissions of the single brick system. It can be stated that the PE-DesignTM can be successfully used to replace cascade systems with a single brick layout. The advantages are lower backpressure, more compact design hence simpler canning and reduced overall system costs. After the theoretical and experimental proof of PE-DesignTM advantages over conventional technology, an application case study is the final target to aim. The current Maserati V8 engine is equipped with a close-coupled cascade system, consisting of ceramic substrates. The target of this application case study is to investigate the replacement of the baseline system with a metallic PE monobrick layout. As a starting point a cold flow backpressure measurement has been carried out to compare the fluid-dynamic performance of the baseline system with that of the PE monobrick substrate: a ceramic brick 152.4-101.6x139.9mm/ 400 cpsi/4 mils and a metallic substrate 167-102x120mm/500 cpsi PE/50µm. These measurements were performed with an uneven flow obtained with a diaphragm, which plugs 50% of the inlet cross section. Fig. 22 shows the result of the measurement carried out with uneven flow distribution. The advantage of the PE METALIT® is here clear: at 450 Nm³/h the backpressure of PE METALIT® is 52% of the backpressure of the Ceramic support.
0
5
10
15
20
25
30
35
40
100 150 200 250 300 250 400 450
Volumetric Flow Rate [Nm³/h]
Bac
kpre
ssur
e [m
bar] Ceramic
PE Metalit
Fig. 22 Backpressure measurement on elliptical support with uneven flow distribution. The main reason for the great advantage in backpressure is due to the ability to smooth out the radial pressure gradients and to achieve equalized velocity distribution. In order to better understand the properties of elliptical PE METALIT®, a flow distribution measurement was carried out, comparing a standard METALIT® with a PE substrate.
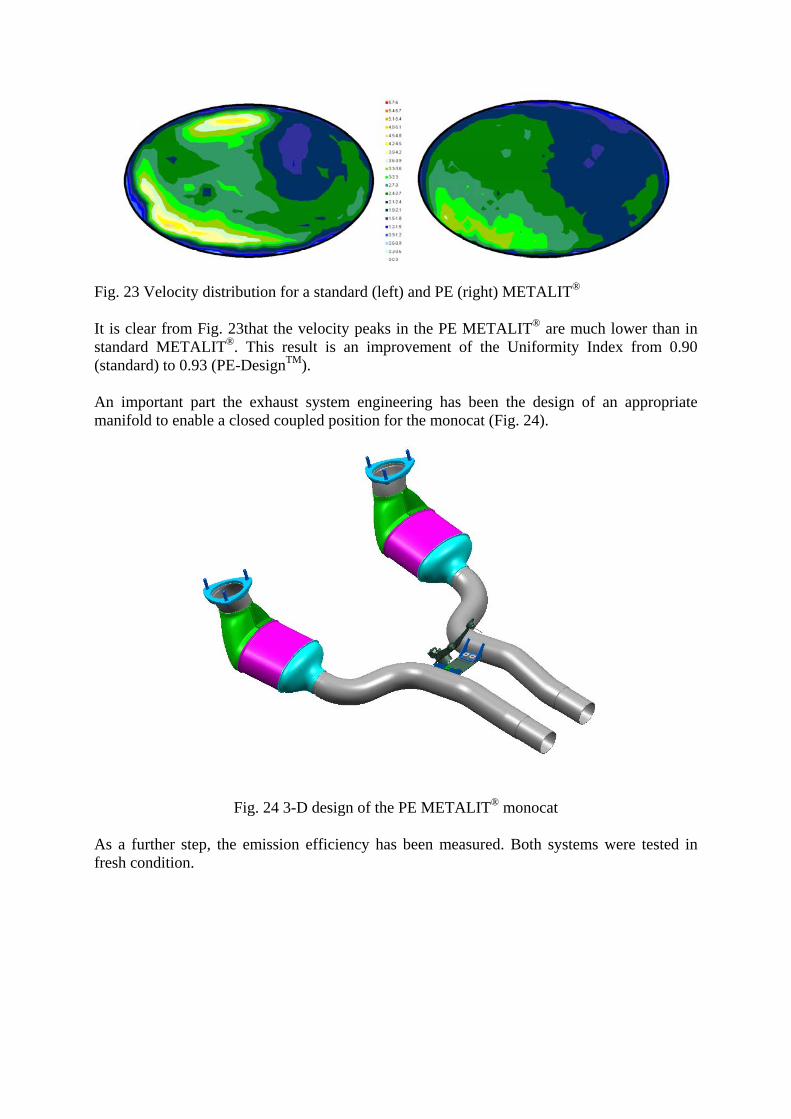
Fig. 23 Velocity distribution for a standard (left) and PE (right) METALIT®
It is clear from Fig. 23that the velocity peaks in the PE METALIT® are much lower than in standard METALIT®. This result is an improvement of the Uniformity Index from 0.90 (standard) to 0.93 (PE-DesignTM). An important part the exhaust system engineering has been the design of an appropriate manifold to enable a closed coupled position for the monocat (Fig. 24).
Fig. 24 3-D design of the PE METALIT® monocat
As a further step, the emission efficiency has been measured. Both systems were tested in fresh condition.
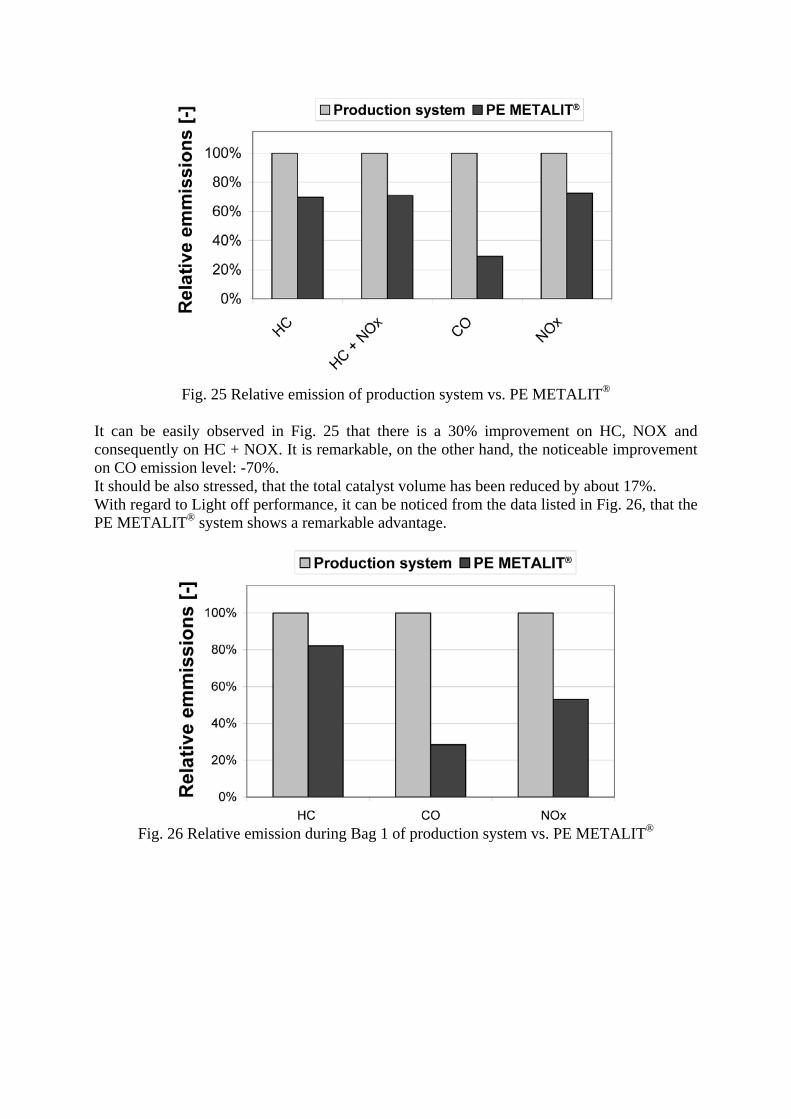
Fig. 25 Relative emission of production system vs. PE METALIT®
It can be easily observed in Fig. 25 that there is a 30% improvement on HC, NOX and consequently on HC + NOX. It is remarkable, on the other hand, the noticeable improvement on CO emission level: -70%. It should be also stressed, that the total catalyst volume has been reduced by about 17%. With regard to Light off performance, it can be noticed from the data listed in Fig. 26, that the PE METALIT® system shows a remarkable advantage.
Fig. 26 Relative emission during Bag 1 of production system vs. PE METALIT®

As a conclusion it can be stated that the PE-DesignTM can be successfully adopted in single-brick systems to replace an existing cascade converter layout. Simpler and more cost effective canning, optimisation of PGM loading and improved catalyst utilization factor, hence reduced backpressure are key to the superior overall performance of PE-DesignTM. 8. Conclusion Both theoretical and experimental investigation work has been carried out on innovative structured foils such as LS and PE-DesignTM. In particular, thorough comparisons between baseline systems featuring conventional technology and alternative converter layouts with the use of turbulent-flow substrates have been performed on both engine bench and vehicle measurement programs. As a result LS-Design® enables a significant material, weight and cost saving in DOC applications by replacing a 400 cpsi with a 200-400LS substrate. Additional strategies consist of catalyst volume reduction at same cpsi leading to a Pt-content reduction using a 400-800LS substrate instead of a 400 cpsi standard converter. PE-DesignTM. has been investigated on gasoline TWC applications. The work has been particularly focused on cascade systems. These dual-brick layouts have been successfully adopted in recent years due to the advantageous characteristics of flow mixing between the bricks hence optimal flow distribution. On both cold flow measurements, engine bench test and vehicle application PE-DesignTM. single-Brick systems proved successfully as a cost effective replacement of cascade converter layouts due to simpler canning, PGM loading optimisation and reduced backpressure.

References
1. W. Maus, R. Brück; Emitec GmbH; „Die Zukunft der heterogenen Katalyse im Automobil; Turbulente Katalysatoren für Otto- und Dieselanwendungen“; 26. Internationales Motorensymposium, Wien, 27.04.2005
2. J. Dahlgren, M. Laurell, N. Vollmer; Volvo Car Corp.; R. Brück, P. Hirth, W. Maus; Emitec GmbH; „Der Lambdasondenkatalysator; ein neues Konzept für kompakte Hochleistungs-Katalysatorsysteme“; 14. Aachener Kolloquium „Fahrzeug- und Motorentechnik“; 2005
3. C. Iotti, V. Rossi, L. Poggio; Ferrari S.p.A.; M. Holzinger; ArvinMeritor; L. Pace, M. Presti; Emitec GmbH; “Backpressure Optimized Close Coupled PE-Catalyst - First Application on a Maserati Powertrain”; SAE-Paper 2005-01-1105
4. M. Ganz, S. Hackmayer; quattro GmbH; C. Kruse, A. Reck, Emitec GmbH; “Innovatives Katalysatorsystem für den Audi RS6, 8 Zyl, 4,2ltr, 331 KW mit LEV Zertifizierung”; 25. Internationales Motorensymposium, Wien, 29.04.2004
5. VDI-Wärmeatlas, Springer-Verlag, 1997; A12-A13
6. E. Koberstein, J. Hensel; Degussa AG; “Katalytische Abgasreinigung – Neuere Entwicklung“; Vortragsreihe Abgas, Abwasser, Abfall und Recycling; Dechema-Monographien; Band 80, Teil 2; 1976, Seite 523-525
7. Dipl. Ing. Rolf Brück, Dipl. Ing. Peter Hirth, Dipl. Ing. Wolfgang Maus, Emitec GmbH; Olaf Deutschmann, Nikolay Mladenov, Universität Karlsruhe; Grundlagen der „laminaren“ und „turbulenten“ Katalyse; „Turbulent“ schlägt „Laminar“; 27. Internationales Motorensymposium, Wien, 2005
8. M. Nonnemann; Süddeutsche Kühlerfabrik; „New High Performance Gas Flow Equalizing Metal Supports for Automotive Exhaust Gas Catalysts”; SAE 900270