Embed Size (px)
Citation preview

GLOBEFISH RESEARCH PROGRAMME
Turbot - Production Technology and Markets
Volume 103
Turbot: Production Technology and Markets
by
Trond Bjørndal
and
Victor Øiestad
(February 2011)
The GLOBEFISH Research Programme is an activity initiated by FAO's Products, Trade and Marketing Service, Fisheries and Aquaculture Policy and Economics Division, Rome, Italy and financed jointly by:
- NMFS (National Marine Fisheries Service), Washington, DC, USA - FROM, Ministerio de Agricultura, Pesca y Alimentación, Madrid, Spain - Ministry of Food, Agriculture and Fisheries, Copenhagen, Denmark - European Commission, Directorate General for Fisheries, Brussels, EU - Norwegian Seafood Export Council, Tromsoe, Norway - FranceAgriMer, Montreuil-sous-Bois Cedex, France - ASMI (Alaska Seafood Marketing Institute), USA - DFO (Department of Fisheries and Oceans), Canada - SSA (Seafood Services Australia), Australia
Food and Agriculture Organization of the United Nations, GLOBEFISH, Products, Trade and Marketing Service, Fisheries and Aquaculture Policy and Economics Division Viale delle Terme di Caracalla, 00153 Rome, Italy – Tel.: (39) 06570 52692 E-mail: [email protected] - Fax: (39) 06570 53020 – www.globefish.org

ii
The designation employed and the presentation of material in this publication do not imply the expression of any opinion whatsoever on the part of the Food and Agriculture Organization of the United Nations concerning the legal status of any country, territory, city or area or of its authorities, or concerning the delimitation of its frontiers or boundaries.
Trond Bjørndal and Victor Øiestad: TURBOT - PRODUCTION TECHNOLOGY AND MARKETS. GLOBEFISH Research Programme, Vol. 103. Rome, FAO 2011. p. 31
Turbot (Scophthalmus maximus) is a high-value fish that is much favoured in many market segments. Aquaculture of turbot started first in Scotland in the 1970s, but from the early 1980s the expansion in production volume and number of farms took place in Galicia, Spain. Still the main production takes place in Galicia with modest culture in France, Portugal, Denmark, Germany, Iceland, Ireland, Italy, Norway and Wales. This picture may change as a result of plans for substantial expansion of production in Portugal. As a consequence, aquaculture’s share of the market will dominate compared with the contribution from the wild fishery. The purpose of this report is to analyse current developments and make a forecast of future trends in turbot production and markets. There are important developments in farming technology that may impact on future supply and cost of production. With this background, an analysis of the future sustainability of turbot farming from a technological and economic point of view is given. Acknowledgement: We are grateful to Dr Jose Manuel Fernandez Polanco for valuable assistance. Layout: Gloria Loriente Cover photograph: Courtesy of Stolt Sea Farm
All rights reserved. No part of this publication may be reproduced, stored in a retrieval system, or transmitted in any means, electronic, mechanical, photocopying or otherwise, without the prior permission of the copyright owner. Applications for such permission, with a statement of the purpose and extent of the reproduction, should be addressed to the Director, Information Division, Food and Agriculture Organization of the United Nations, Viale delle Terme di Caracalla, 00153 Rome, Italy.
© FAO 2011

iii
TABLE OF CONTENT INTRODUCTION 1 1. WILD CATCHES OF TURBOT 2 2. EU FARMED TURBOT PRODUCTION 3
2.1 EU production 3 2.2 EU value of aquaculture production 6 2.3 Galicia, Spain 6 2.4 EU trade balance 7
3. MARKETS FOR TURBOT 7 3.1 National turbot markets 7 3.2 Turbot prices 9 3.3 Prices of wild turbot 11
4. FARMING TECHNOLOGIES 15 4.1 Hatchery practices 15 4.2 Grow-out 15 4.3 Industrial aquaculture parks 16 4.4 Planned parks 17 4.5 Cost of production 18
5. FUTURE OUTLOOK 18 6. REFERENCES 20 APPENDIX – STATISTICAL DATA 21
Figure A1. Volume of farmed turbot production for key nations 1984–2007 21 Table A1. Prices of wild turbot Belgium 1992–2006 22 Table A2. Prices of wild turbot the Netherlands 1994–2006 22 Table A3. EU production of farmed turbot, value, nominal and real prices 1989–2007 23 Table A4. Global catch of turbot 1950–2008, in tonnes 24 Table A5. Aquaculture production of turbot 1985–2007, in tonnes 30 Table A6. Value of EU farmed production of turbot for key nations 1985–2007 (EUR ’000) 31 Table A7. Spanish origin turbot prices in Spain, fresh, whole, cultured, 1–2 kg/pc, monthly in EUR/kg 31

iv
LIST OF TABLES Table 1. Production of farmed turbot in Spain (95% Galicia) and world production 1999–2010, in tonnes 7 Table 2. Sales in the main retail channels in Spain 2004–2009, in tonnes 8 Table 3. Net supply of turbot in Italy 2000–2006, in tonnes 9 Table 4. Ex-farm price of farmed turbot in Galicia EUR/kg 2003–2009 10 Table 5. Prices in the main retail channels in Spain EUR/kg 2004–2009 11
LIST OF FIGURES Figure 1. EU25 and global catch of turbot 1970–2008, in tonnes 2 Figure 2. Turbot harvest by selected countries 1990–2008, in tonnes 3 Figure 3. EU25 aquaculture production of turbot 1984–2007, in tonnes 4 Figure 4. EU production of farmed turbot for key nations 1984–2006, in tonnes 5 Figure 5. Value of EU turbot aquaculture production for key nations
1984–2007, in euros 6 Figure 6. Spanish origin turbot prices, in Spain, fresh, whole, cultured,
1–2 kg/pc, monthly January 2000 to February 2011 10 Figure 7. Annual nominal price of wild turbot, Belgium (1992–2006) and the Netherlands (1994–2006), EUR/kg 12 Figure 8. Average annual wild turbot prices for Belgium (1992–2006) and the Netherlands (1994–2006); average annual farmed turbot price for the EU (1992–2006) EUR/kg 13 Figure 9. EU farmed turbot production (in tonnes) and real price 14 EUR/kg (2005 = 100) 1989–2007 14

1
INTRODUCTION Turbot (Scophthalmus maximus) is a high-value fish that is much favoured in many market segments such as white tablecloth restaurants. Its natural range of distribution is in the Northeast Atlantic along European coasts to the Arctic Circle, throughout the Mediterranean and in the western part of the Baltic Sea. It lives in shallow water to 100 metre depths, inhabiting sandy, muddy bottoms and is both fished and farmed commercially. Turbot is marketed fresh and frozen. Aquaculture of turbot started first in Scotland in the 1970s, but from the early 1980s the expansion in production volume and number of farms took place in Galicia, Spain. Techno-biological improvements in the early 1990s triggered a steady, albeit slow, growth in production across numerous European countries. Still the main production takes place in Galicia with modest culture in France, Portugal, Denmark, Germany, Iceland, Ireland, Italy, Norway and Wales. This picture will likely change from 2011, when Portugal is expected to become the leading producer, resulting from the planned production of 7 000 tonnes at Pescanova’s aquaculture cluster in the northern part of the country. European production, at about 11 000 tonnes in 2010, may expand to around 16 500 tonnes in 2012. As a consequence, aquaculture’s share of the market will dominate compared with the contribution from the wild fishery (6 700 tonnes in 2008). The purpose of this report is to analyse current developments and make a forecast of future trends in turbot production and markets. Production of this species is likely to increase considerably in coming years. In addition, there are important developments in farming technology that may impact on future supply and cost of production. Turbot is a high-value species, much favoured in good quality restaurants. Increased production is likely to have an impact on price, as larger quantities will necessitate entry into new market segments. With this background, an analysis of the future sustainability of turbot farming from a technological, as well as economical point of view, is given. The report provides information on the state of wild catches of turbot, of farmed production and markets. It includes an overview of the pros and cons of existing and new farming technologies, including a brief analysis of cost of production. Finally, the report presents an outlook for the farming of turbot. The Appendix contains additional data.

2
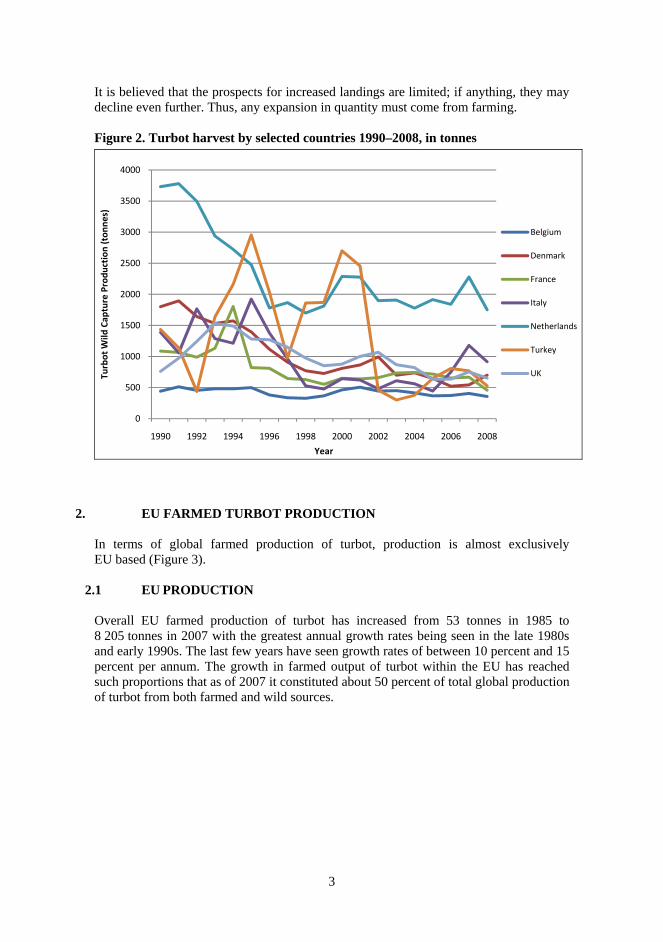
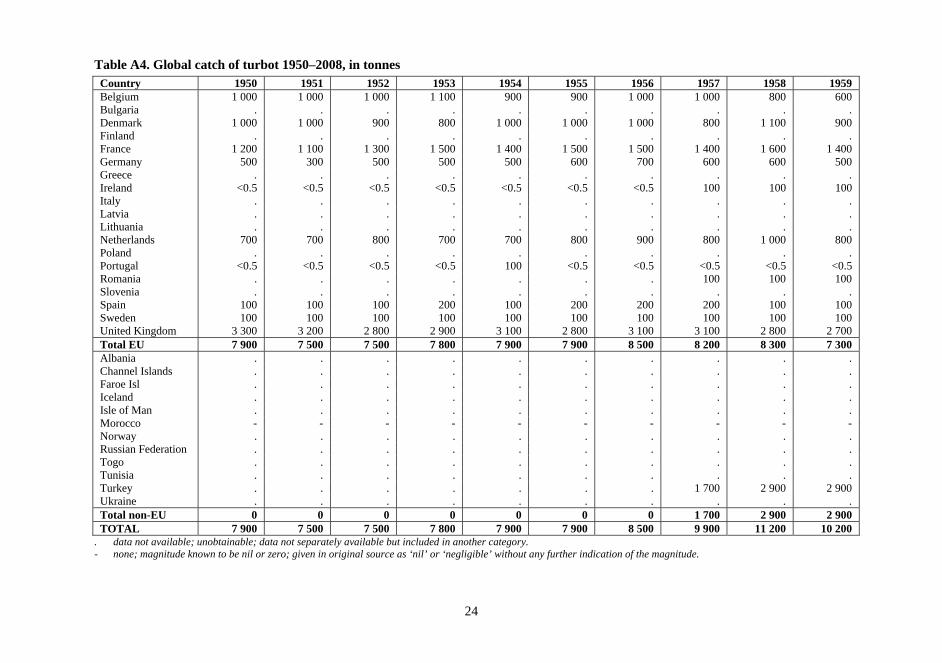
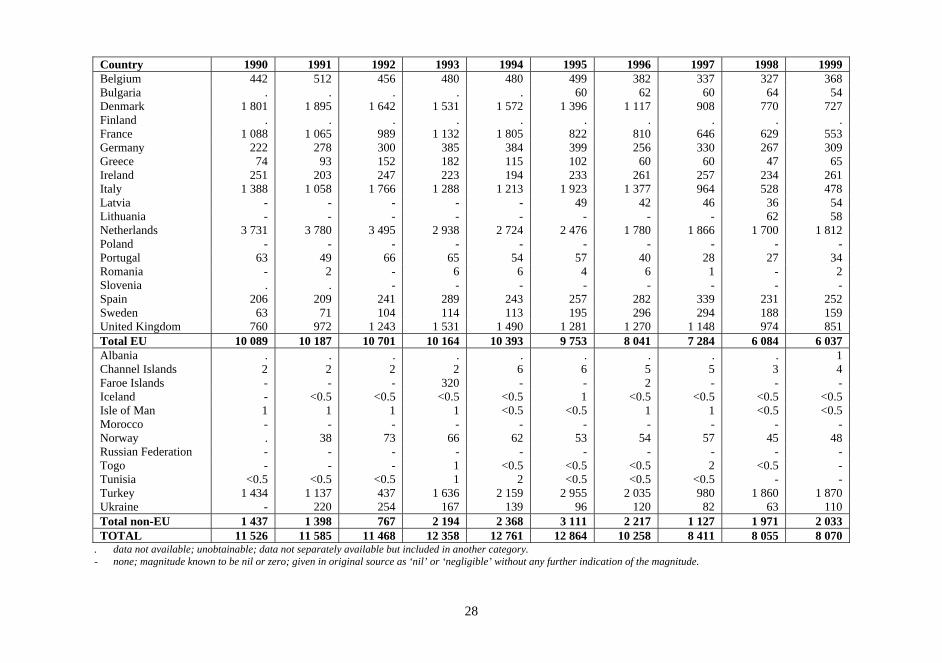
1. WILD CATCHES OF TURBOT Catches of turbot by all countries of the world and by the European Union (EU) nations for 1970–2008 are shown in Figure 1. There is a cyclical pattern for both global and EU catches. The global catch of turbot in 1970 was 10 800 tonnes, whereas the EU catch was 6 600 tonnes (Appendix, Table A4). Global catches peaked at 15 000 tonnes in 1979. Subsequently, they declined to a minimum catch of 5 500 tonnes in 1985. After a period of increase, catches have again shown a general downward trend since the mid-1990s, however with sporadic/temporary increases in some years. The catch at the global level was 6 665 tonnes in 2008 with 5 740 tonnes for the EU, the lowest levels recorded. Thus, the EU countries accounted for 86 percent of global catch in 2008. Outside the EU, Turkey is by far the most important country harvesting turbot with 528 tonnes recorded in 2008. However, this is considerably lower than catch levels in the 1980s and 1990s. Other countries that harvest turbot include Ukraine, Norway, Morocco and the Russian Federation (Appendix, Table A4). Within Europe, the principle fleets catching turbot are from the Netherlands, United Kingdom, Denmark, France, Belgium, Germany, Ireland, Spain, Portugal and Greece (Figure 2). Since 1970 these countries have accounted for between 88–97 percent of the EU25 catch, with their dominance decreasing over time. Most harvesting nations have seen their catches fall since the mid-1990s. The Netherlands catches the largest tonnage, peaking at 4 098 tonnes in 1979 and 3 780 tonnes in 1991. In 2008 catch was down to 1 751 tonnes. Figure 1. EU25 and global catch of turbot 1970–2008, in tonnes
0
2,000
4,000
6,000
8,000
10,000
12,000
14,000
16,000
Turbot Wild
Cap
ture Production (€/Kg)
YearTotal EU Total World
3
It is believed that the prospects for increased landings are limited; if anything, they may decline even further. Thus, any expansion in quantity must come from farming. Figure 2. Turbot harvest by selected countries 1990–2008, in tonnes
2. EU FARMED TURBOT PRODUCTION
In terms of global farmed production of turbot, production is almost exclusively EU based (Figure 3).
2.1 EU PRODUCTION Overall EU farmed production of turbot has increased from 53 tonnes in 1985 to 8 205 tonnes in 2007 with the greatest annual growth rates being seen in the late 1980s and early 1990s. The last few years have seen growth rates of between 10 percent and 15 percent per annum. The growth in farmed output of turbot within the EU has reached such proportions that as of 2007 it constituted about 50 percent of total global production of turbot from both farmed and wild sources.
0
500
1000
1500
2000
2500
3000
3500
4000
1990 1992 1994 1996 1998 2000 2002 2004 2006 2008
Turbot Wild
Cap
ture Production (tonnes)
Year
Belgium
Denmark
France
Italy
Netherlands
Turkey
UK

4
Figure 3. EU25 aquaculture production of turbot 1984–2007, in tonnes
Outside of the EU, small quantities are farmed in Iceland (peaking at 115 tonnes in 2005, down to 100 tonnes in 2006–07). South Africa has also appeared in the production statistics for some years1. Within Europe, as shown in Figure 4, farmed production comes from five main countries, with the bulk coming from Spain (84 percent in 2007). Spanish production2 has grown consistently from 38 tonnes in 1985 to 6 838 tonnes in 2007, with a slight downward move in 1997 and 1998.
1 China is not considered in this report, although this country is belived to produce over 50 000 tonnes of turbot. See http://books.google.es/books?id=hj-ypUJKkgYC&pg=PT205 &dq=china+turbot+2010&hl=es&ei=_XKgTIuaHdm5jAeH4JnCDQ&sa=X&oi=book_result&ct=result&resnum=2&ved=0CDUQ6AEwAQ#v=onepage&q=china%20turbot%202010&f=false. 2 Worldwide, Spain is the largest producer of turbot with Stolt Sea Farm SA, the world’s leading producer of farmed turbot. The company produces 1 million juveniles from two hatcheries, which in turn supplies grow out facilities in the region.
0
1000
2000
3000
4000
5000
6000
7000
8000
90001984
1985
1986
1987
1988
1989
1990
1991
1992
1993
1994
1995
1996
1997
1998
1999
2000
2001
2002
2003
2004
2005
2006
2007
Tonnes
EU 25 Aquaculture Production ‐ turbot (tonnes)

5
French production has also risen, going from 15 tonnes in 1985 to 980 tonnes in 1997 (with a very poor year in 1996), before levelling out. In 2007, French turbot production was 850 tonnes (12 percent of EU production)3. Portuguese turbot farming is relatively more recent in origin. Records start in 1994 at 35 tonnes, since when they have risen to a peak of 386 tonnes in 2002 before dropping to 167 tonnes in 20074. As a consequence of new investments, Portuguese production is expected to increase considerably in coming years (see below). Figure 4. EU production of farmed turbot for key nations 1984–2006, in tonnes
Despite turbot farming having started in Scotland in 1970, commercial turbot farming records for the United Kingdom are also only recent, recording 107 tonnes in 2000 and peaking at 233 tonnes in 2004 before dropping to only 62 tonnes in 20075. A similar magnitude of production from the Netherlands6 was recorded in the same year.
3 Although France produces turbot, it imports additional turbot, mostly from Spain. It is also the world’s leading producer of juvenile turbot most of which is exported to China. A proportion of French production is exported live. 4 All turbot production takes place via land-based systems, with the majority operated by Stolt Sea Farm S.A. 5 Production comes from one operation. 6 Seafarm BV is the only company culturing turbot, raising them from fry to market size using a land-based system. Live fish are supplied to markets in China and Japan.
0
1000
2000
3000
4000
5000
6000
7000
8000
1984
1986
1988
1990
1992
1994
1996
1998
2000
2002
2004
2006
Tonnes
Spain
France
Netherlands
Portugal
United Kingdom
6
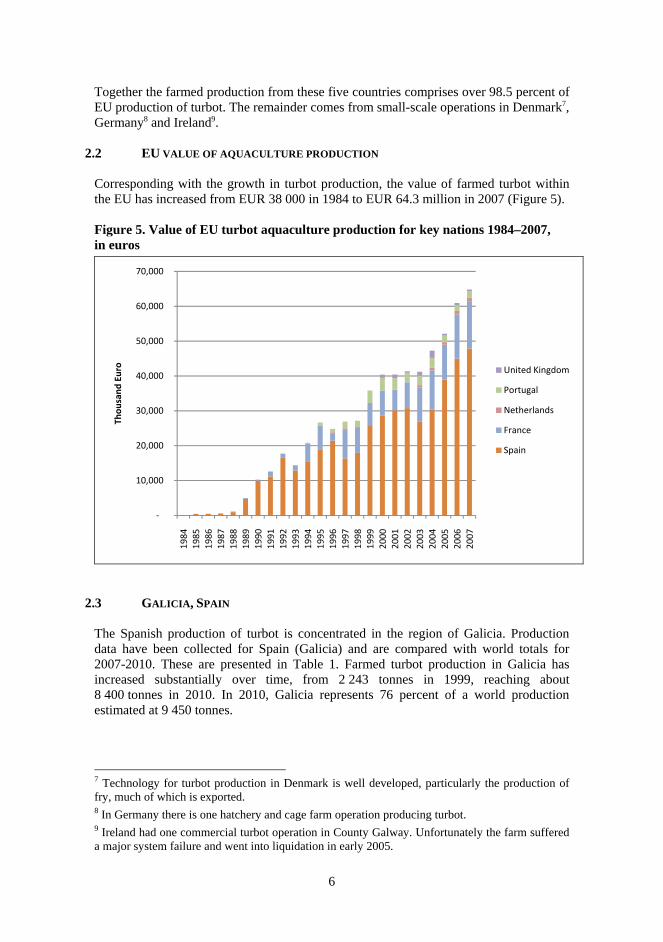
Together the farmed production from these five countries comprises over 98.5 percent of EU production of turbot. The remainder comes from small-scale operations in Denmark7, Germany8 and Ireland9.
2.2 EU VALUE OF AQUACULTURE PRODUCTION
Corresponding with the growth in turbot production, the value of farmed turbot within the EU has increased from EUR 38 000 in 1984 to EUR 64.3 million in 2007 (Figure 5). Figure 5. Value of EU turbot aquaculture production for key nations 1984–2007, in euros
2.3 GALICIA, SPAIN The Spanish production of turbot is concentrated in the region of Galicia. Production data have been collected for Spain (Galicia) and are compared with world totals for 2007-2010. These are presented in Table 1. Farmed turbot production in Galicia has increased substantially over time, from 2 243 tonnes in 1999, reaching about 8 400 tonnes in 2010. In 2010, Galicia represents 76 percent of a world production estimated at 9 450 tonnes.
7 Technology for turbot production in Denmark is well developed, particularly the production of fry, much of which is exported. 8 In Germany there is one hatchery and cage farm operation producing turbot. 9 Ireland had one commercial turbot operation in County Galway. Unfortunately the farm suffered a major system failure and went into liquidation in early 2005.
‐
10,000
20,000
30,000
40,000
50,000
60,000
70,000
1984
1985
1986
1987
1988
1989
1990
1991
1992
1993
1994
1995
1996
1997
1998
1999
2000
2001
2002
2003
2004
2005
2006
2007
Thousand Euro United Kingdom
Portugal
Netherlands
France
Spain

7
Acuinova has built a turbot farm with a 7 000 tonne capacity in Mira, Portugal, with capital subsidies from the EU. In 2010, an output of 1 500 tonnes is expected, while full capacity is expected to be reached in 2012 (Fish Farming Expert, 2010). If this materialises, world production may increase to 16 500 tonnes in 2012. It will also reduce Galicia’s dominance of turbot production. Table 1. Production of farmed turbot in Spain (95% Galicia) and world production 1999–2010, in tonnes
Year Production World production 1999 2 243 - 2000 3 347 - 2001 3 759 - 2002 3 998 - 2003 3 440 - 2004 4 256 - 2005 4 275 - 2006 5 975 - 2007 6 080 7 800 2008 7 870 9 450 2009 8 320 - 2010 9 400 11 000
Sources: Farmed production: 1999–2009: Spanish Marine Fish Farmers Association (APROMAR), several years. Available at: http://www.apromar.es/Informes/; 2010 (estimate): industry sources. World production: industry sources.
2.4 EU TRADE BALANCE In terms of trade, imports by the EU25 nations ceased completely after 1991. Exports in contrast continued, although at low levels. In 2006 the EU25 nations exported 464 tonnes of turbot, down from 879 tonnes in 1979. Correspondingly, the balance of trade in recent years has been synonymous with exports, however, as quantities are limited, more than 95 percent of all turbot – farmed and wild – is consumed in Europe.
3. MARKETS FOR TURBOT
Availability of market data for turbot is limited, for both consumption and trade. In the following, quantity data are presented for a few countries, and an overview on develepments in prices is presented.
3.1 NATIONAL TURBOT MARKETS
Some of the main markets for turbot will be examined. Spain is not only the largest producer of turbot, but also one of the largest markets. Landings of wild turbot, on the other hand, are negligible (Appendix, Table A4). Thus, the market is served almost entirely by farmed product. Retail sales by sales channel for the period 2004–2009 are given in Table 2. These figures, which represent estimates of turbot consumption, are based on consumer surveys. Although there are variations from year to year, there is an upward trend in

8
sales, which increased from 2 787 tonnes in 2004 to 3 894 tonnes in 2009 with a very noticeable increase from 2007 to 2008. The 2009 quantity represents almost half of annual production, which was 8 320 tonnes in 2009 (Table 1). Table 2. Sales in the main retail channels in Spain 2004–2009, in tonnes
Year Hyper-market
Super-market
Food market
Fish-monger
Frozen shop
General food
Others Total
2004 527 830 374 527 361 25 143 2.787 2005 440 593 337 567 97 60 102 2 196 2006 537 839 407 730 139 51 188 2 891 2007 473 711 342 807 150 26 97 2 606 2008 556 1 290 482 803 166 13 201 3 511 2009 932 1 536 396 764 68 33 165 3 894
Source: Panel of Food Consumption. Spanish Ministry of Rural and Marine Environment. Formerly Agriculture, Fisheries and Food. Available at: http://www.mapa.es/es/alimentacion/pags/consumo/BD/consulta.asp. In 2009, supermarkets represented the most important retail channel, with 39 percent of total sales, followed by hypermarkets (24 percent) and fishmongers (19 percent). The relative shares of supermarkets and hypermarkets appear to have increased over time, while that of fishmongers has declined. Although turbot is a traditional species Spain, mainly in the northern area, it is consumed less than other farmed species such as seabream or seabass10. In the period 2005–2007 about 18 percent of the Spaniards consumed turbot with maximum frequency of once per month11. Consumers scored turbot as a good quality and safe fish to eat, but somewhat expensive. Being a more expensive product than other species commonly consumed in Spain, high education level and high income are characteristic of turbot consumers, as well as middle age segments. Turbot is not easy to prepare, which implies that a large amount is consumed in the hospitality sector. Consumption in restaurants helped to increase the final price of this product; however, it also resulted in a brake on expanding consumption in the period studied. Like several other species that are supplied by both capture fisheries and aquaculture, farmed origin is not well recognized by turbot consumers. However, the percentage of turbot consumers who are aware of the availability of farmed turbot has increased from 19 percent to 32 percent between 2005 and 2007. This trend may continue as the supply from aquaculture increases.
10 The following paragraphs are based on a survey of farmed fish consumption in Spain for 2005-07, see UC - MARM (2009). 11 MARM. Panel de Consumo Alimentario, 2008. Available at: http://www.mapa.es/es/alimentacion/pags/consumo/BD/consulta.asp.

9
Consumers who are eating farmed turbot scored farmed turbot as cheaper than wild, but of lower quality and safety. These scores are common for all farmed species that were studied (bass, bream, turbot and trout), but in the case of turbot they were homogeneous across consumer segments and places of purchase. Export data for Spain are not available. A production of more than 8 000 tonnes in 2009 and a domestic consumption of slightly less than 4 000 tonnes indicates that Spanish exports for that year may have been more than 4 000 tonnes. Spain is, without doubt, the largest exporter of turbot in Europe. Export markets include Italy, France, Germany and the United Kingdom. Net supply of turbot in Italy for the period 2000–2007 is given in Table 3. In addition to domestic landings, turbot is imported, while exports are negligible. In the period 2000-2003 the annual net supply was around 1 400 tonnes. Since then, there appears to have been an upward trend in net supply, which reached 1 675 tonnes in 2006. Table 3. Net supply of turbot in Italy 2000–2006, in tonnes
Year Imports Exports Turbot Catch Net Supply 2000 793 5 643 1 431 2001 786 14 622 1 394 2002 789 4 482 1 267 2003 829 11 610 1 428 2004 904 13 561 1 452 2005 1 037 20 445 1 462 2006 942 16 749 1 675
Sources: For imports and exports: www.ismea.it http://.ismea.it++%22rombo+chiodata%22&ei=LzGiS_CkH5KTjAeR_sWQCg&usg=AFQjCNEsV2gsLWaIrnVBlP79OpnegAiwzg&sig2=VMwXKb1DDnH-E2ce1PDaAQ; For turbot catch: Table A1. In France, annual catches have varied between 457–744 tonnes since 2000. Farmed production in 2007 was 850 tonnes. Since 2000, the annual United Kingdom harvest has varied between 633–1 065 tonnes. Farmed production is very small. It is known that the United Kingdom imports turbot, in particular from Spain. As turbot is combined with other species in trade statistics, it is not known how much is imported – or exported, for that matter.
3.2 TURBOT PRICES Spain As mentioned above, Galicia is the main producer of turbot in Europe. Price observations for this region are presented in Table 4. The ex-farm price was relatively stable around EUR 8.90/kg for the period 2003–2006. It then increased to EUR 9.62/kg in 2007. Subsequently there has been a fairly substantial price reduction; in July 2009, the price was EUR 6.77/kg. The recession is believed to be one of the reasons for this price reduction. Also, a number of companies have experienced cash flow problems, which have forced them to sell fish of lower than optimal size. This puts pressure on prices.

10
Table 4. Ex-farm price of farmed turbot in Galicia EUR/kg 2003–2009
Year Price (size 1–2 kg)
2003 8.89 2004 8.80 2005 8.78 2006 8.90 2007 9.62 2008 8.31 2009 6.77
Source: Spanish Marine Fish Farmers Association (APROMAR), several years. Available at: http://www.apromar.es/Informes/. Prices continued falling in 2010, with a price of EUR 6/kg recorded in February (Fish Farming Expert, 2010). According to industry sources, prices recovered later in the year and may reach EUR 8.50/kg as an average for 2010. Most turbot is harvested at a weight of 1.5–2.0 kg per fish. It must be noted that the price varies with fish size, with larger fish fetching a higher price per kg. Monthly prices for farmed turbot for the period January 2000–February 2011 are presented in Figure 6. For the first five years, the prices generally varied between EUR 8-10/kg. Prices then showed an increasing trend, from EUR 8/kg in early 2006 reaching a peak of EUR 13.50/kg in September 2007, the highest price recorded in this time period. Subsequently, the price trend was negative until the end of 2009/early 2010, reaching a low of EUR 6.25/kg. Subsequently, there was a recovery to EUR 9.10/kg in October and November 2010, with EUR 9.80/kg recorded for February 2011. Figure 6. Spanish origin turbot prices, in Spain, fresh, whole, cultured, 1–2 kg/pc, monthly January 2000 to February 2011
5.0
7.0
9.0
11.0
13.0
15.0
Jan‐00
Jul‐00
Jan‐01
Jul‐01
Jan‐02
Jul‐02
Jan‐03
Jul‐03
Jan‐04
Jul‐04
Jan‐05
Jul‐05
Jan‐06
Jul‐06
Jan‐07
Jul‐07
Jan‐08
Jul‐08
Jan‐09
Jul‐09
Jan‐10
Jul‐10
Jan‐11
Price (EU
R/kg)
Month

11
Prices for the main retail channels are also available (Table 5). It is interesting to note that the development in prices is different for the different sales channels. In 2009 fishmongers fetched the highest prices; moreover, their prices have increased in recent years in contrast to other channels. Table 5. Prices in the main retail channels in Spain EUR/kg 2004–2009
Year Hypermarket Supermarket Food market Fishmonger Frozen shop
2004 9.78 8.45 8.49 8.75 6.79 2005 9.84 9.49 8.77 8.62 6.69 2006 10.06 10.12 8.94 9.22 6.35 2007 10.62 9.61 8.26 9.11 7.15 2008 9.46 9.44 9.20 8.89 7.42 2009 9.39 9.01 9.39 9.50 8.11
Source: Panel of Food Consumption. Spanish Ministry of Rural and Marine Environment. Formerly Agriculture, Fisheries and Food. Available at: http://www.mapa.es/es/alimentacion/pags/consumo/BD/consulta.asp.
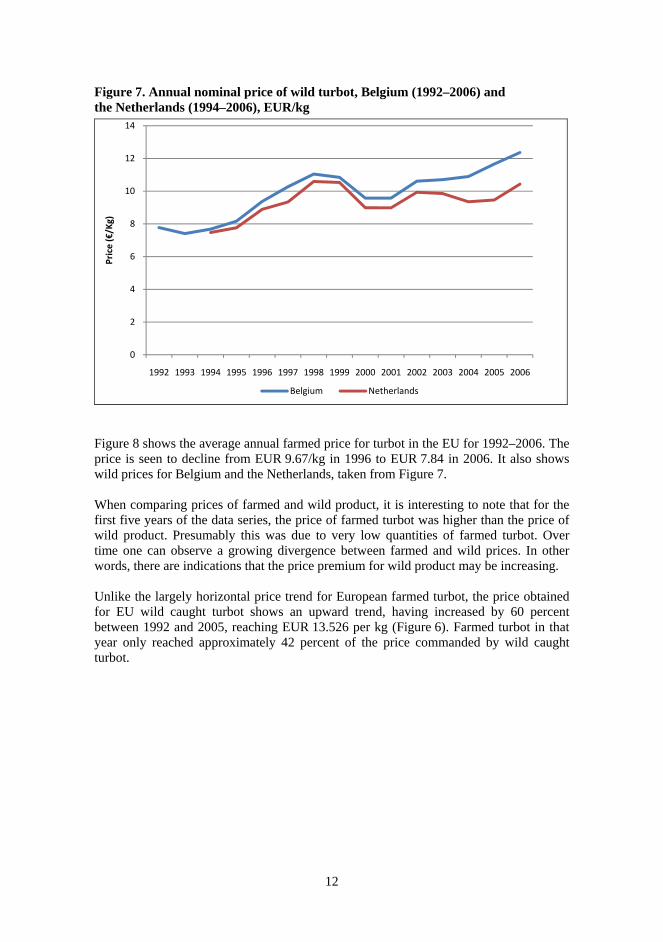
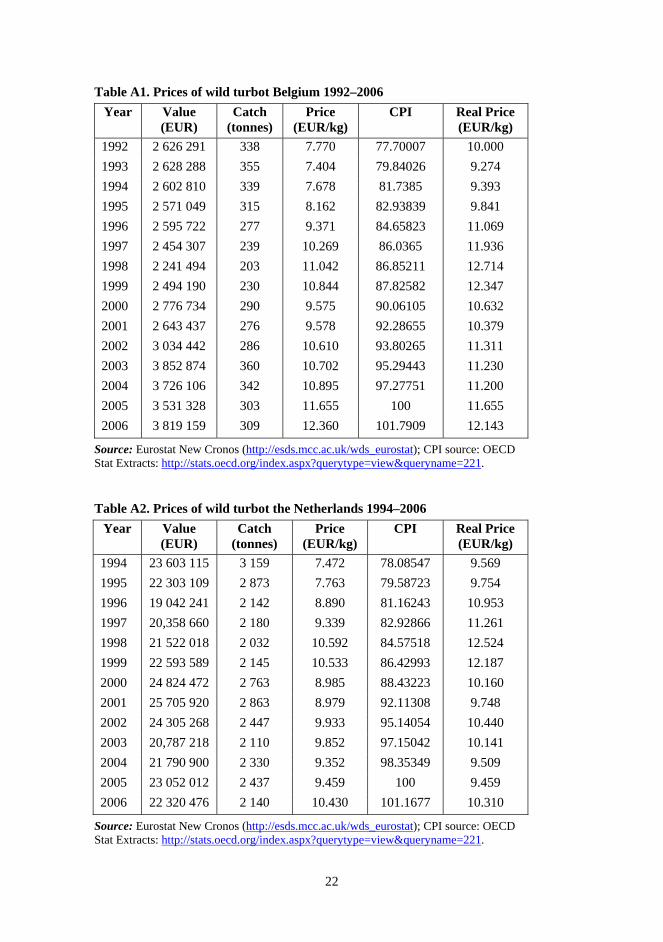
3.3 PRICES OF WILD TURBOT Time series data for the price of wild turbot could be found for only two countries; the Netherlands (1994–2006) and Belgium (1992–2006). As mentioned, the Netherlands has the largest catches in the EU. For Belgium, annual catch for the period under consideration has varied between 203–355 tonnes. Average annual ex-vessel prices for the two countries are given in Figure 7. As can be seen, the price pattern is similar for the two countries. There was an upward price trend until 1997, followed by a temporary decline. After that the price in Belgium increased from EUR 9.58/kg in 1997 to EUR 12.36/kg in 2006 while in the Netherlands the price increased from EUR 9.34/kg to EUR 10.43 in the same period. Nevertheless, there appears to be a widening price gap after 2000, with turbot fetching the highest price in Belgium, presumably because of lower quantity.
12
Figure 7. Annual nominal price of wild turbot, Belgium (1992–2006) and the Netherlands (1994–2006), EUR/kg
Figure 8 shows the average annual farmed price for turbot in the EU for 1992–2006. The price is seen to decline from EUR 9.67/kg in 1996 to EUR 7.84 in 2006. It also shows wild prices for Belgium and the Netherlands, taken from Figure 7. When comparing prices of farmed and wild product, it is interesting to note that for the first five years of the data series, the price of farmed turbot was higher than the price of wild product. Presumably this was due to very low quantities of farmed turbot. Over time one can observe a growing divergence between farmed and wild prices. In other words, there are indications that the price premium for wild product may be increasing. Unlike the largely horizontal price trend for European farmed turbot, the price obtained for EU wild caught turbot shows an upward trend, having increased by 60 percent between 1992 and 2005, reaching EUR 13.526 per kg (Figure 6). Farmed turbot in that year only reached approximately 42 percent of the price commanded by wild caught turbot.
0
2
4
6
8
10
12
14
1992 1993 1994 1995 1996 1997 1998 1999 2000 2001 2002 2003 2004 2005 2006
Price (€/Kg)
Belgium Netherlands

13
Figure 8. Average annual wild turbot prices for Belgium (1992–2006) and the Netherlands (1994–2006); average annual farmed turbot price for the EU (1992–2006) EUR/kg
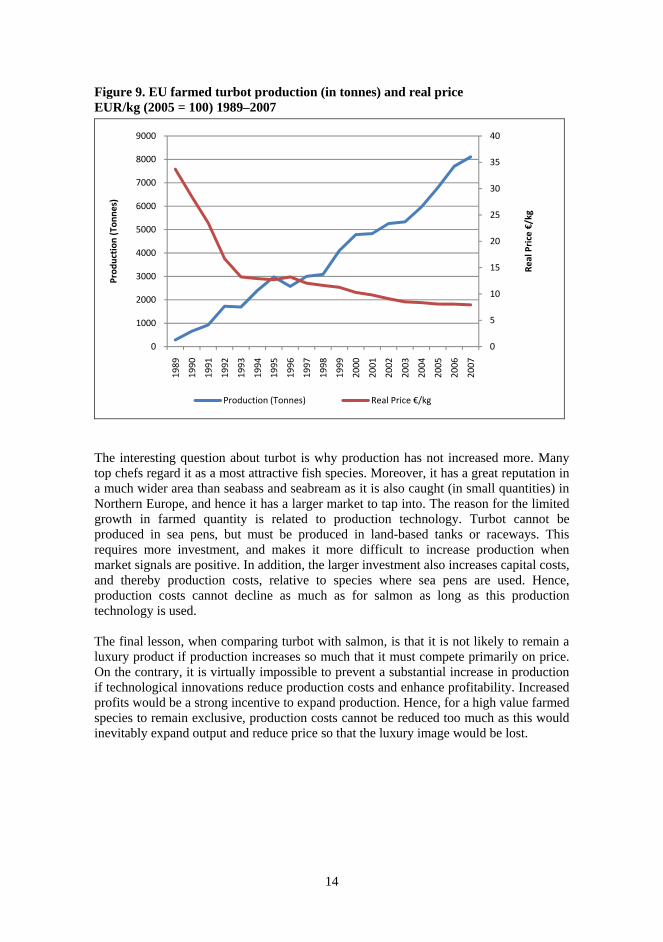
Figure 9 shows EU farmed production and real price12 of turbot per kg for the period 1989–2007. As the EU represents the lion’s share of turbot farming, the figure is representative of the world market and world price for turbot. In this period, production increased from 287 tonnes in 1989 to 8 105 tonnes in 2007. The real price initially fell sharply, from EUR 33.68/kg in 1989 to EUR 13.24/kg in 1993. Subsequently, it has shown a more gradual decline. The 2007 price was EUR 7.93/kg, down from EUR 8.08 in 2005 and EUR 10.29 in 2000. The price-quantity development of a newly farmed species has been analysed by Asche and Bjørndal (2011). Salmon, seabass and seabream are species that were highly valued before aquaculture increased the supply, but lost that position as prices decreased. Turbot, however, is a species that has maintained its exclusive image. Part of the explanation is, of course, that production has increased only moderately, as shown in Figure 9, from about 300 tonnes in 1989 to 8 200 tonnes in 2007. As expected, this has lead to a decline in price. The price in 2007 was EUR 7.45 kg, slightly less than half of the 1992 price, but about 60 percent of the 1993 price.
12 Nominal prices have been converted into real prices by use of the Consumer Price Index for Spain. This is because Spain is the largest producer of farmed turbot in Europe.
0
2
4
6
8
10
12
141992
1993
1994
1995
1996
1997
1998
1999
2000
2001
2002
2003
2004
2005
2006
Price (€/kg)
Belgium (wild)
Netherlands (wild)
EU (farmed)
14
Figure 9. EU farmed turbot production (in tonnes) and real price EUR/kg (2005 = 100) 1989–2007
The interesting question about turbot is why production has not increased more. Many top chefs regard it as a most attractive fish species. Moreover, it has a great reputation in a much wider area than seabass and seabream as it is also caught (in small quantities) in Northern Europe, and hence it has a larger market to tap into. The reason for the limited growth in farmed quantity is related to production technology. Turbot cannot be produced in sea pens, but must be produced in land-based tanks or raceways. This requires more investment, and makes it more difficult to increase production when market signals are positive. In addition, the larger investment also increases capital costs, and thereby production costs, relative to species where sea pens are used. Hence, production costs cannot decline as much as for salmon as long as this production technology is used. The final lesson, when comparing turbot with salmon, is that it is not likely to remain a luxury product if production increases so much that it must compete primarily on price. On the contrary, it is virtually impossible to prevent a substantial increase in production if technological innovations reduce production costs and enhance profitability. Increased profits would be a strong incentive to expand production. Hence, for a high value farmed species to remain exclusive, production costs cannot be reduced too much as this would inevitably expand output and reduce price so that the luxury image would be lost.
0
5
10
15
20
25
30
35
40
0
1000
2000
3000
4000
5000
6000
7000
8000
9000
1989
1990
1991
1992
1993
1994
1995
1996
1997
1998
1999
2000
2001
2002
2003
2004
2005
2006
2007
Real Price €/kg
Production (To
nnes)
Production (Tonnes) Real Price €/kg

15
4. FARMING TECHNOLOGIES
A description of farming technologies currently in use, from hatchery practices to grow-out is given below. The prospects of new hyperintensive technologies are considered. Finally, results from a cost of production analysis are presented.
4.1 HATCHERY PRACTICES
Broodstocks are built up mainly from farmed individuals as part of more than decade-long selection programmes among producers. Individually tagged breeders are maintained in concrete tanks at low density (about 5 kg/m2) and are fed specially designed broodstock pellets. An optimized light and temperature regime for broodstock throughout the year is of great importance to obtain high egg quality and to obtain egg production all year round. Turbot do not spawn spontaneously in captivity, so gametes are routinely hand-stripped. Turbot females may produce 1–10 million eggs during the season, depending on fish size. Newly hatched larvae, 6–7 days after fertilization, are about 3 mm long. Larval rearing is typically intensive with densities of about 20 million larvae per litre in tanks with rather low water renewal, although with increasing exchange rate as they grow bigger. At the beginning of the exogenous feeding stage (about three days after hatching), larvae are fed the rotifer Brachionus plicatilis for about 10 days followed by Artemia nauplii. Green water-technology is often applied based on on-site-produced phytoplankton or commercially available algal paste. Metamorphosis ends after 40-50 days when larvae are about 25 mm long. For the next two months, the juveniles are nursed in small tanks and are fed dry granules of increasing size until they reach a weight of 5–10 g. Larval survival is generally 10–25 percent to metamorphosis and the percentage of juveniles without deformities – and thus selected for on-growing – is now typically above 90 percent. All juveniles are vaccinated against important fish diseases, but occasionally “new” diseases or parasites are introduced among juveniles causing severe problems, if undetected, for on-growing companies, as seen in Galicia in 2006–2007.
4.2 GROW-OUT
The 5–10 g turbot juveniles are subsequently stocked in a nursery section and when they reach a size of 200–400 g they are transferred to permanent on-growing tanks that typically have a surface of 60–120 m2 and with a water depth of 0.5–1 m. Initial density of 20 kg/m2 will increase to 50–70 kg/m2 for market-sized turbot. The tanks are self-cleaning owing to tank design and the circulation pattern of water. The oxygen level in the outlet water is kept above 60 percent saturation while intake water will normally have oxygen injected by venturi in the intake pipe to achieve a level of 120–150 percent saturation in the incoming water and thus reduce pumping of water to less than half. Repeated feedings take place with pellets by feeding machines of different types, although small farms still use hand-feeding. Size grading is undertaken 2–4 times during the next 1–1½ years to keep together equal-sized fish and thus obtain a more homogeneous growth pattern. As males have a slower growth rate, they will be graded out and sent to market at below 1 kg, while females will be in the size range of 1–2 kg

16
with a modest quantity of fish larger than 2 kg. A population or cohort of 5–10 g fish will thus be harvested within two years. At the large-sized turbot farms, rearing takes place in outdoor tanks with an open-circuit flow-through system for seawater, and using a tank cover to prevent fish from being sunburned. Still only a small part of the European turbot production is undertaken in recirculation aquaculture system (RAS). Most farms are located in places with a seawater temperature in the range of 10–20 ºC throughout the year and with close-to-optimal temperature (~15 ºC) most of the year.
4.3 INDUSTRIAL AQUACULTURE PARKS
Currently, most land-based seafood production requires significant land area. One alternative to reduce the amount of space needed is to use production technologies that require a smaller area, such as shallow raceway systems where production takes place in a rack with raceways on three to six levels. The smaller footprint and high compactness of this hyperintensive aquafarming technology is well-suited for use in industrial aquaculture parks, which typically yield 5–10 times higher production per surface area than conventional farming technology. Industrial parks are generally developed to make industrial activities more efficient and physically separate them from other activities. These parks are often characterized by a cluster structure that provides advantages from being co-located with other activities. Industrial aquaculture parks are a promising alternative for further expansion of the fast-growing, land-based production of seafood in many coastal and inland regions. Aquaculture industry development from small units to industrial parks is possible and advantageous because it could allow even high-cost countries to become competitive producers of valuable seafood through the use of compact land-based facilities. Resource-saving approaches can support low-cost production based on advanced technology in combination with production methods that comply with product traceability, animal welfare rules, environmental regulations and other criteria for sustainability. It is significantly easier to meet these demands within the framework of a cluster structure in an industrial park, with coordination of main operations and services, than at single, dispersed production units. For example, a land-based operation for the production of 10 000 tonnes of a niche species would demand more than 300 000 m2 of industrial buildings when conventional technology is used. This represents a huge economic challenge. With hyperintensive technology, the goal is to reduce the industrial building size by 80 percent, or to produce the same volume within a 60 000 m2 building. This implies a production increase from 30 to more than 150 kg/m2 of building surface. The hyperintensive concept is also expected to reduce the use of other input elements, such as feed, water, oxygen, energy and manpower. Another important aspect is labour productivity. With conventional technology, output per employee has been 20-50 tonnes/year for a species like turbot. With shallow raceway systems, the goal is to increase production to 50–200 tonnes/year/employee, depending on the overall size of the farm. This higher productivity is needed to obtain stable and high profit margins for investors. As the raceway systems are designed to facilitate automation, it is easier to

17
achieve ambitious improvements in productivity with this technology than with other alternatives. Possible synergistic effects include hyperintensive fish production coupled with the use of industrial cooling waters, which would open up possibilities in regions where this resource is available. With water chemistry adjustments now available13, it may also be possible to install industrial parks close to important markets, opening up the farming of marine species in almost freshwater conditions.
4.4 PLANNED PARKS
In Galicia in Northwestern Spain, the regional government has launched a plan for 25 separate industrial aquaculture parks covering 300 ha, with a planned annual fish production of 22 500 tonnes. This could represent a paradigm for European aquaculture and have a cascading effect in the industry. The parks are planned with conventional aquatechnology, but could undertake a transition to hyperintensive technology for those still at the planning stage. The prospective impact of the technology transition could be very significant, increasing the production volume to about 200 000 tonnes with application of hyperintensive technology. Advantages of shallow raceway systems include: Minimal land requirements. Depending on the number of production layers, shallow
raceways may require only about 20 percent of the area for the same biomass production as needed for conventional systems. They can be built on inexpensive land at some distance from the coast or on low-value agriculture land at the coast.
Water conservation. Shallow raceway systems are easy to connect to water sources and support water reuse or recirculation. In a flow-through system with reuse, shallow raceways require only about 30 percent of the water used with conventional technology for equivalent biomass.
High-density production. The use of floating pellets and movable screens in raceway systems supports high fish density and 30 percent higher standing biomass for the same tank surface.
Species flexibility. Shallow raceways can be used for both pelagic and benthic-pelagic fish species.
Feed efficiency. The use of floating pellets in raceways can reduce feed-conversion ratios up to 10 percent.
Operational efficiency. Raceway systems can be installed as modules called “towers” to keep pace with increases in biomass and reduce start-up costs.
Reduced labour requirements. Shallow raceways are expected to require only 50–75 percent of the staff needed to run conventional systems for the same production capacity.
13 http://www.marical.biz.

18
4.5 COST OF PRODUCTION Bjørndal and Palmieri (2008) undertook an analysis of cost of production for turbot, based on data from a number of farms in Spain and Portugal. In the base case with an annual output of 133 tonnes, average cost per kg of turbot has been estimated at EUR 7.54. An expansion in production capacity to an annual output level of 400 tonnes per year was also considered. This would reduce the average cost per kg of turbot produced to EUR 5.07, a reduction of about 33 percent per kg compared with the smaller farms. This indicates quite substantial economies of scale. Investments in a turbot farm with production capacity of about 133 tonnes per year represent about EUR 4.3 million. To treble the production capacity to 400 tonnes, additional investments of about EUR 1.80 million are required. As additional investment costs are considerably less, relatively speaking, than the increase in output, this indicates a source of economies of scale. In addition, with larger output the labour force and management are utilized more efficiently, which will also bring down the cost of production. A number of sensitivity analyses were also undertaken for the farm with a 400 tonne production capacity. A doubling of the natural mortality compared with the base case causes cost of production to increase from EUR 5.07 to EUR 5.41, a 7 percent increase. An increase in the growth rate so that the average weight per fish is 1.5 kg as opposed to 1.2 kg in the baseline, leads to a reduction in production cost to EUR 4.32 per kg, or 15 percent less than in the base case. Deterioration in the feed conversion ratio from 0.95 to 1.10 causes cost of production per kg to increase by 4 percent to EUR 5.27, while a reduction in the fry cost from EUR 1.38 to EUR 1.20 per unit leads to a 3.5 percent decrease in cost of production to EUR 4.89. Overall, these results represent moderate sensitivity of cost of production to changes in these important biological parameters.
5. FUTURE OUTLOOK
The actual seafood market in Europe reflects the traditional pattern of availability of seafood from wild stocks. However, this is increasingly changing as aquaculture enables production to be better geared to market demand. Therefore, it should be expected that, as aquaculture production continues to grow, the balance of seafood products will also change. Consumer preference will be an increasingly important driver for aquaculture development (Sturrock et al., 2008). A number of factors will influence the development of the market for turbot. These include consumer purchasing behaviour and responses of the multiple retailers to the increase in production. Turbot is a popular, but nevertheless premium, fish species. Prospects for steady growth within limits are to a great extent determined by price. Innovative processes and institutional support will be important factors in the potential development of turbot aquaculture (Sturrock et al., 2008). The further development of commercial aquaculture systems suitable for the production of turbot is key to the

19
expansion of the market for this species. Site availability and cost, taking into consideration physical availability and government regulations, affect supply. Support for innovation, taking into account government and business investment in research and development education and training, and the support of government and financial institutions for commercial (technology-based) risk takers will also influence the future of the industry. The introduction of new technology would enable production to expand considerably, as discussed above. As noted above, Galicia is the largest producing area for turbot in the world, with an expected output of 8 400 tonnes for 2010. World production of turbot, excluding Chinese production, was 9 500 tonnes in 2008 and is expected to reach almost 11 000 tonnes in 2010 and 16 500 tonnes in 2010. Among other factors, this increase is the consequence of Acuinova’s establishment of a turbot farm with a 7 000 tonne production capacity in Portugal. Cost of production for large farms is EUR 5.00–5.50 per kg in Galicia. Packaging and transport are an additional EUR 1.00. Smaller farms, however, will have higher costs of production. Portugal may possibly have lower production costs than Galicia. Firstly, large production volumes may give rise to economies of scale. Secondly, EU subsidies may reduce capital costs, and labour costs are lower than in Spain. Finally, transportation routes may be better than in Galicia, giving rise to lower distribution costs. Turbot prices have been high over the past few years, but have shown a reduction since 2007 (although there are signs of a recovery in the second part of 2010). One reason for this is likely to be the current recession which, among other things, has reduced restaurant consumption. In addition, some companies have experienced financial problems. As a consequence, some had to sell products at lower than optimal weight in order to maintain cash flow. These developments have put pressure on prices. According to the forecast mentioned above, world turbot production may increase by more than 70 percent from 2008 to 2012. Turbot is a popular product, and many markets remain to be exploited, in Europe and elsewhere. Nevertheless, such a large production increase in a four year period is likely to put negative pressure on prices. The impetus therefore is on the producers to develop new markets.
20
6. REFERENCES Asche, F. & Bjørndal, T. 2011. The Economics of Salmon Aquaculture – 2nd Edition.
Blackwell (forthcoming).
Banks, R., Des Clers, S. & MacFadyen, G. 2001. Economics Research Project: Fish Prices and Electronic Auctions – Final Report. Richard Banks Limited. London: Ministry of Agriculture, Fisheries and Food.
Bjørndal, T. & Palmieri, M.-G. . An Economic Analysis of a Turbot Farm. CEMARE (unpublished).
Bostock, J. et al. (Editors) 2008. Prospective Analysis of the Aquaculture Sector in the EU” Part 1: Synthesis Report. EC Joint Research Centre, Institute for Prospective Technological Studies. http://ipts.jrc.ec.europa.eu/publications/pub.cfm?id=1739
FishFarmingExpert. 2010. “A Wave of Change for the Spanish Turbot Industry”. 2010 (No. 4): pp. 37–41.
Sturrock, H. et al. (Editors). 2008. Prospective Analysis of the Aquaculture Sector in the EU. Part 2: Characterisation of emerging aquaculture systems. EC Joint Research Centre, Institute for Prospective Technological Studies. http://ipts.jrc.ec.europa.eu/publications/pub.cfm?id=1740.
Eurostat New Cronos. © European Communities, 26th April 2007, 21st May 2008. Eurostat delivered by ESDS International.
FAO. 2008. Fisheries and Aquaculture Information and Statistics Service. FISHSTAT Plus.
UC–MARM. 2009. Valoración de la acuicultura en España 2003–2007. Universidad de Cantabria y Ministerio de Medio Ambiente, Rural y Marino. Madrid.

21
APPENDIX
STATISTICAL DATA This report uses data from the following sources: Eurostat New Cronos, © European Communities, 26th April 2007, Source Eurostat
delivered by ESDS International, (MIMAS) University of Manchester; and FAO Fisheries and Aquaculture Information and Statistics Service 2007. Fisheries
commodities production and trade 1976–2006. FISHSTAT Plus – Universal software for fishery statistical time series [online or CD-ROM]. Food and Agriculture Organization of the United Nations. Available at: http://www.fao.org/fi/statist/FISOFT/FISHPLUS.asp.
Figure A1. Volume of farmed turbot production for key nations 1984–2007
0
1000
2000
3000
4000
5000
6000
7000
8000
9000
1984
1985
1986
1987
1988
1989
1990
1991
1992
1993
1994
1995
1996
1997
1998
1999
2000
2001
2002
2003
2004
2005
2006
2007
Tonnes
United Kingdom Portugal Netherlands France Spain
22
Table A1. Prices of wild turbot Belgium 1992–2006
Year Value (EUR)
Catch (tonnes)
Price (EUR/kg)
CPI Real Price (EUR/kg)
1992 2 626 291 338 7.770 77.70007 10.000
1993 2 628 288 355 7.404 79.84026 9.274
1994 2 602 810 339 7.678 81.7385 9.393
1995 2 571 049 315 8.162 82.93839 9.841
1996 2 595 722 277 9.371 84.65823 11.069
1997 2 454 307 239 10.269 86.0365 11.936
1998 2 241 494 203 11.042 86.85211 12.714
1999 2 494 190 230 10.844 87.82582 12.347
2000 2 776 734 290 9.575 90.06105 10.632
2001 2 643 437 276 9.578 92.28655 10.379
2002 3 034 442 286 10.610 93.80265 11.311
2003 3 852 874 360 10.702 95.29443 11.230
2004 3 726 106 342 10.895 97.27751 11.200
2005 3 531 328 303 11.655 100 11.655
2006 3 819 159 309 12.360 101.7909 12.143
Source: Eurostat New Cronos (http://esds.mcc.ac.uk/wds_eurostat); CPI source: OECD Stat Extracts: http://stats.oecd.org/index.aspx?querytype=view&queryname=221. Table A2. Prices of wild turbot the Netherlands 1994–2006
Year Value (EUR)
Catch (tonnes)
Price (EUR/kg)
CPI Real Price (EUR/kg)
1994 23 603 115 3 159 7.472 78.08547 9.569
1995 22 303 109 2 873 7.763 79.58723 9.754
1996 19 042 241 2 142 8.890 81.16243 10.953
1997 20,358 660 2 180 9.339 82.92866 11.261
1998 21 522 018 2 032 10.592 84.57518 12.524
1999 22 593 589 2 145 10.533 86.42993 12.187
2000 24 824 472 2 763 8.985 88.43223 10.160
2001 25 705 920 2 863 8.979 92.11308 9.748
2002 24 305 268 2 447 9.933 95.14054 10.440
2003 20,787 218 2 110 9.852 97.15042 10.141
2004 21 790 900 2 330 9.352 98.35349 9.509
2005 23 052 012 2 437 9.459 100 9.459
2006 22 320 476 2 140 10.430 101.1677 10.310
Source: Eurostat New Cronos (http://esds.mcc.ac.uk/wds_eurostat); CPI source: OECD Stat Extracts: http://stats.oecd.org/index.aspx?querytype=view&queryname=221.

23
Table A3. EU production of farmed turbot, value, nominal and real prices 1989–2007
Year Production (tonnes)
Value (‘000 EUR)
Nominal Price
(EUR/kg)
Consumer Price Index
Spain
Real Price (EUR/kg)
1989 287 4 960.80 17.285 51.31 33.68
1990 656 10,247.60 15.621 54.79 28.51
1991 925 12 623.70 13.647 58.08 23.50
1992 1 725 17 718.90 10.272 61.47 16.71
1993 1 693 14 410.30 8.5117 64.28 13.24
1994 2 399 20,849.50 8.691 67.29 12.91
1995 2 978 26 680.30 8.959 70.49 12.71
1996 2 571 24 847.70 9.665 73.03 13.23
1997 3 001 26 924.80 8.972 74.44 12.05
1998 3 087 27 186.50 8.807 75.75 11.63
1999 4 103 35 854.80 8.739 77.54 11.27
2000 4 785 39 454.60 8.245 80.17 10.29
2001 4 829 39 360.40 8.151 83.08 9.81
2002 5 258 40 933.60 7.785 85.62 9.09
2003 5 331 40 060.20 7.515 88.25 8.51
2004 5 962 45 281.40 7.595 90.88 8.36
2005 6 792 51 575.50 7.594 93.98 8.08
2006 7 703 60 373.60 7.838 97.27 8.06
2007 8 105 64 250.80 7.927 100 7.93
Source: Consumer Price Index: http://stats.oecd.org.
24
Table A4. Global catch of turbot 1950–2008, in tonnes Country 1950 1951 1952 1953 1954 1955 1956 1957 1958 1959 Belgium 1 000 1 000 1 000 1 100 900 900 1 000 1 000 800 600 Bulgaria . . . . . . . . . . Denmark 1 000 1 000 900 800 1 000 1 000 1 000 800 1 100 900 Finland . . . . . . . . . . France 1 200 1 100 1 300 1 500 1 400 1 500 1 500 1 400 1 600 1 400 Germany 500 300 500 500 500 600 700 600 600 500 Greece . . . . . . . . . . Ireland <0.5 <0.5 <0.5 <0.5 <0.5 <0.5 <0.5 100 100 100 Italy . . . . . . . . . . Latvia . . . . . . . . . . Lithuania . . . . . . . . . . Netherlands 700 700 800 700 700 800 900 800 1 000 800 Poland . . . . . . . . . . Portugal <0.5 <0.5 <0.5 <0.5 100 <0.5 <0.5 <0.5 <0.5 <0.5 Romania . . . . . . . 100 100 100 Slovenia . . . . . . . . . . Spain 100 100 100 200 100 200 200 200 100 100 Sweden 100 100 100 100 100 100 100 100 100 100 United Kingdom 3 300 3 200 2 800 2 900 3 100 2 800 3 100 3 100 2 800 2 700 Total EU 7 900 7 500 7 500 7 800 7 900 7 900 8 500 8 200 8 300 7 300 Albania . . . . . . . . . . Channel Islands . . . . . . . . . . Faroe Isl . . . . . . . . . . Iceland . . . . . . . . . . Isle of Man . . . . . . . . . . Morocco - - - - - - - - - - Norway . . . . . . . . . . Russian Federation . . . . . . . . . . Togo . . . . . . . . . . Tunisia . . . . . . . . . . Turkey . . . . . . . 1 700 2 900 2 900 Ukraine . . . . . . . . . . Total non-EU 0 0 0 0 0 0 0 1 700 2 900 2 900 TOTAL 7 900 7 500 7 500 7 800 7 900 7 900 8 500 9 900 11 200 10 200
. data not available; unobtainable; data not separately available but included in another category. - none; magnitude known to be nil or zero; given in original source as ‘nil’ or ‘negligible’ without any further indication of the magnitude.

25
Country 1960 1961 1962 1963 1964 1965 1966 1967 1968 1969 Belgium 600 600 600 700 400 400 400 400 300 300 Bulgaria . . . . 500 400 400 300 300 200 Denmark 900 900 900 1 300 900 600 800 600 900 900 Finland . . . . . . . . . . France 1 200 1 300 1 200 1 100 1 000 1 000 1 000 1 000 800 800 Germany 500 600 500 700 600 400 600 600 500 400 Greece . . . . . . . . . . Ireland 100 100 100 100 100 100 100 100 100 100 Italy . . . . . . . 600 900 800 Latvia . . . . . . . . . . Lithuania . . . . . . . . . . Netherlands 1 100 1 300 1 400 1 200 1 300 1 200 1 500 1 700 2 100 2 300 Poland . . . . . . . . . . Portugal <0.5 <0.5 <0.5 <0.5 <0.5 <0.5 <0.5 <0.5 <0.5 <0.5 Romania 100 200 200 300 400 200 100 100 100 100 Slovenia . . . . . . . . . . Spain 100 100 200 200 200 100 300 100 100 100 Sweden 100 100 100 100 <0.5 <0.5 <0.5 <0.5 <0.5 <0.5 United Kingdom 2 500 2 500 2 100 2 200 2 100 1 900 1 700 1 400 1 100 1 200 Total EU 7 200 7 700 7 300 7 900 7 500 6 300 6 900 6 900 7 200 7 200 Albania . . . . . . . . . . Channel Islands . . . . . . . . . . Faroe Isl . . . . . . . . . . Iceland . . . . . . . . . . Isle of Man . . . . . . . . . . Morocco - - - - - - - - - - Norway . . . . . . . . . . Russian Federation . . . . . . . . . . Togo . . . . . . . . . . Tunisia . . . . . . . . . . Turkey 1 300 1 400 1 200 1 600 1 600 1 700 2 500 1 800 2 100 2 700 Ukraine . . . . . . . . . . Total non-EU 1 300 1 400 1 200 1 600 1 600 1 700 2 500 1 800 2 100 2 700 TOTAL 8 500 9 100 8 500 9 500 9 100 8 000 9 400 8 700 9 300 9 900
. data not available; unobtainable; data not separately available but included in another category. - none; magnitude known to be nil or zero; given in original source as ‘nil’ or ‘negligible’ without any further indication of the magnitude.

26
Country 1970 1971 1972 1973 1974 1975 1976 1977 1978 1979 Belgium 200 200 200 200 185 218 318 213 232 252 Bulgaria 268 222 175 249 312 204 217 63 121 70 Denmark 600 700 700 600 420 632 822 882 1 153 1 539 Finland . . . . . . . . . . France 685 761 700 700 602 658 713 1 824 848 739 Germany 300 300 300 200 172 232 228 242 216 200 Greece . . . . . . . . . . Ireland 100 100 100 100 104 108 180 158 141 149 Italy 1 135 1 374 1 037 798 1 107 1 012 1 380 1 640 1 416 1 331 Latvia . . . . . . . . . . Lithuania . . . . . . . . . . Netherlands 1 900 2 500 2 500 2 600 2 890 3 364 3 458 3 392 3 410 4 098 Poland - - - - - - - - - - Portugal <0.5 100 100 100 65 79 109 92 74 94 Romania 89 43 70 118 29 16 36 11 - 7 Slovenia . . . . . . . . . . Spain - - - - - - - - - 135 Sweden <0.5 <0.5 <0.5 <0.5 13 15 15 13 16 17 United Kingdom 1 300 1 000 1 100 1 000 916 724 869 923 1 034 1 086 Total EU 6 577 7 300 6 982 6 665 6 815 7 262 8 345 9 453 8 661 9 717 Albania . . . . . . . . . . Channel Islands - - - - - - - - . . Faroe Isl - - - - - - - - - - Iceland - - - - - - - - - - Isle of Man . . . . . . . . . 1 Morocco - - - - - - - - - - Norway - - - - - - - - - - Russian Federation . . . . . . . . . . Togo - - - - - - - - - - Tunisia <0.5 1 3 - <0.5 - - - - - Turkey 4 181 2 689 2 394 3 982 986 808 1 173 1 913 1 958 5 314 Ukraine . . . . . . . . . . Total non-EU 4 181 2 690 2 397 3 982 986 808 1 173 1 913 1 958 5 315 TOTAL 10 758 9 990 9 379 10 647 7 801 8 070 9 518 11 366 10 619 15 032
. data not available; unobtainable; data not separately available but included in another category. - none; magnitude known to be nil or zero; given in original source as ‘nil’ or ‘negligible’ without any further indication of the magnitude.

27
Country 1980 1981 1982 1983 1984 1985 1986 1987 1988 1989 Belgium 237 228 243 303 356 345 292 266 254 318 Bulgaria 89 9 9 7 21 51 12 3 4 1 Denmark 1 626 1 323 1 130 1 141 1 234 1 345 1 393 1 414 1 297 1 102 Finland . . . . . . . . . . France 748 843 727 970 880 861 823 889 1 051 1 243 Germany 186 142 78 68 72 78 97 98 111 134 Greece . . 20 12 18 17 80 320 160 150 Ireland 171 199 274 232 223 198 201 283 346 263 Italy 1 154 938 1 213 1 608 1 402 1 308 1 716 1 831 1 988 1 485 Latvia . . . . . . . . - - Lithuania . . . . . . . . - - Netherlands 3 260 3 089 3 046 3 199 . . . . 2 670 3 666 Poland - - - - - - - - - - Portugal 111 106 93 93 84 93 96 105 113 82 Romania 9 2 2 3 4 11 7 1 2 - Slovenia . . . . . . . . . . Spain 203 189 132 143 111 151 232 210 246 196 Sweden 21 15 18 20 22 28 30 40 54 44 United Kingdom 771 630 570 560 588 616 607 743 788 670 Total EU 8 586 7 713 7 555 8 359 5 015 5 102 5 586 6 203 9 084 9 354 Albania . . . . . . . . . . Channel Islands . . . . . 6 8 6 4 2 Faroe Isl - - - - - - - - - - Iceland - - - - - - - - - - Isle of Man <0.5 1 1 <0.5 9 1 <0.5 1 <0.5 <0.5 Morocco - - - - - - - - - - Norway . . . . . . . . . . Russian Federation . . . . . . . . - - Togo - - - - - - - - - - Tunisia - - - - - - - - - 1 Turkey 2 771 3 785 4 723 5 398 2 920 435 449 939 1 259 1 481 Ukraine . . . . . . . . - - Total non-EU 2 771 3 786 4 724 5 398 2 929 442 457 946 1 263 1 484 TOTAL 11 357 11 499 12 279 13 757 7 944 5 544 6 043 7 149 10 347 10 838
. data not available; unobtainable; data not separately available but included in another category. - none; magnitude known to be nil or zero; given in original source as ‘nil’ or ‘negligible’ without any further indication of the magnitude.
28
Country 1990 1991 1992 1993 1994 1995 1996 1997 1998 1999 Belgium 442 512 456 480 480 499 382 337 327 368 Bulgaria . . . . . 60 62 60 64 54 Denmark 1 801 1 895 1 642 1 531 1 572 1 396 1 117 908 770 727 Finland . . . . . . . . . . France 1 088 1 065 989 1 132 1 805 822 810 646 629 553 Germany 222 278 300 385 384 399 256 330 267 309 Greece 74 93 152 182 115 102 60 60 47 65 Ireland 251 203 247 223 194 233 261 257 234 261 Italy 1 388 1 058 1 766 1 288 1 213 1 923 1 377 964 528 478 Latvia - - - - - 49 42 46 36 54 Lithuania - - - - - - - - 62 58 Netherlands 3 731 3 780 3 495 2 938 2 724 2 476 1 780 1 866 1 700 1 812 Poland - - - - - - - - - - Portugal 63 49 66 65 54 57 40 28 27 34 Romania - 2 - 6 6 4 6 1 - 2 Slovenia . . - - - - - - - - Spain 206 209 241 289 243 257 282 339 231 252 Sweden 63 71 104 114 113 195 296 294 188 159 United Kingdom 760 972 1 243 1 531 1 490 1 281 1 270 1 148 974 851 Total EU 10 089 10 187 10 701 10 164 10 393 9 753 8 041 7 284 6 084 6 037 Albania . . . . . . . . . 1 Channel Islands 2 2 2 2 6 6 5 5 3 4 Faroe Islands - - - 320 - - 2 - - - Iceland - <0.5 <0.5 <0.5 <0.5 1 <0.5 <0.5 <0.5 <0.5 Isle of Man 1 1 1 1 <0.5 <0.5 1 1 <0.5 <0.5 Morocco - - - - - - - - - - Norway . 38 73 66 62 53 54 57 45 48 Russian Federation - - - - - - - - - - Togo - - - 1 <0.5 <0.5 <0.5 2 <0.5 - Tunisia <0.5 <0.5 <0.5 1 2 <0.5 <0.5 <0.5 - - Turkey 1 434 1 137 437 1 636 2 159 2 955 2 035 980 1 860 1 870 Ukraine - 220 254 167 139 96 120 82 63 110 Total non-EU 1 437 1 398 767 2 194 2 368 3 111 2 217 1 127 1 971 2 033 TOTAL 11 526 11 585 11 468 12 358 12 761 12 864 10 258 8 411 8 055 8 070
. data not available; unobtainable; data not separately available but included in another category. - none; magnitude known to be nil or zero; given in original source as ‘nil’ or ‘negligible’ without any further indication of the magnitude.

29
Country 2000 2001 2002 2003 2004 2005 2006 2007 2008 Belgium 464 506 445 451 415 367 373 406 357 Bulgaria 55 57 136 41 16 13 15 67 55 Denmark 809 864 994 700 737 647 522 543 700 Finland 6 4 3 3 3 1 3 1 1 France 650 639 660 734 744 718 654 668 457 Germany 454 363 343 353 343 334 288 282 261 Greece 63 77 75 75 54 71 48 81 106 Ireland 236 185 183 231 321 215 198 194 171 Italy 643 622 482 610 561 445 749 1 179 916 Latvia 16 6 9 9 8 7 6 2 2 Lithuania 23 18 18 13 8 18 10 12 10 Netherlands 2 287 2 277 1 899 1 908 1 778 1 915 1 839 2 279 1 751 Poland - - - - 43 76 99 91 111 Portugal 63 83 69 62 67 73 53 31 29 Romania 2 13 17 24 42 37 32 57 47 Slovenia - - - 1 - - <0.5 1 1 Spain 124 122 43 42 37 50 50 45 55 Sweden 106 64 55 41 33 41 40 40 55 United Kingdom 877 1 001 1 067 868 822 633 635 754 653 Total EU 6 878 6 901 6 498 6 166 6 032 5 661 5 614 6 733 5 738 Albania 1 . . 3 2 3 3 10 7 Channel Islands 6 9 6 8 14 18 7 3 3 Faroe Isl - <0.5 1 7 1 1 1 <0.5 - Iceland <0.5 <0.5 <0.5 <0.5 - - - - - Isle of Man - <0.5 - 4 - - - - - Morocco 96 49 86 118 96 73 76 61 63 Norway 69 94 99 84 86 78 55 58 44 Russian Federation 53 69 50 28 15 28 - 30 21 Togo 1 2 2 <0.5 1 <0.5 - - - Tunisia - - - - - - - - - Turkey 2 700 2 455 459 300 376 649 807 769 528 Ukraine 118 171 157 199 168 188 245 279 261 Total non-EU 3 044 2 849 860 751 759 1 038 1 194 1 210 927 TOTAL 9 922 9 750 7 358 6 917 6 791 6 699 6 808 7 943 6 665
. data not available; unobtainable; data not separately available but included in another category. - none; magnitude known to be nil or zero; given in original source as ‘nil’ or ‘negligible’ without any further indication of the magnitude.
Source: Fishstat Plus.

30
Table A5. Aquaculture production of turbot 1985–2007, in tonnes
Country 1985 1986 1987 1988 1989 1990 1991 1992 1993 1994 1995 1996 1997 1998 1999 Denmark - - - - - - - - - - - - - - - France 15 10 15 15 15 15 100 100 150 550 694 225 980 900 868 Germany . . . . 1 1 <0.5 <0.5 <0.5 <0.5 <0.5 - - <0.5 - Ireland . . . . . . . 3 4 3 15 30 . 5 8 Italy - - - - - - - - - - - - - - - Malta - - - - - - - - - 1 1 <0.5 - - - Netherlands - - - - - - - - - - 12 25 25 25 . Portugal . . . . . . . . . 35 82 102 196 188 378 Spain 38 40 50 97 271 640 825 1 622 1 539 1 810 2 174 2 189 1 800 1 969 2 849 United Kingdom - - - - - - - - - - - - - - - Total EU 53 50 65 112 287 656 925 1 725 1 693 2 399 2 978 2 571 3 001 3 087 4 103 Iceland - - - - - - - - - - - - - - - South Africa - - - - - - - - - - - - - - - Total non-EU - - - - - - - - - - - - - - - Total 53 50 65 112 287 656 925 1 725 1 693 2 399 2 978 2 571 3 001 3 087 4 103
Country 2000 2001 2002 2003 2004 2005 2006 2007 Denmark - - 1 4 6 8 7 38 France 908 702 924 909 949 791 870 850 Germany - - 2 . 58 68 60 60 Ireland 12 28 50 40 25 6 . - Italy - - 3 . . . . - Malta - - - - - - - - Netherlands . . . 75 75 75 100 90 Portugal 380 343 386 323 269 214 185 167 Spain 3 378 3 636 3 847 3 852 4 347 5 572 6 419 6 838 United Kingdom 107 120 45 128 233 58 62 62 Total EU 4 785 4 829 5 258 5 331 5 962 6 792 7 703 8 105 Iceland - 27 9 32 46 115 100 100 South Africa 1 - 2 14 2 1 - - Total non-EU 1 27 11 46 48 116 100 100 Total 4 786 4 856 5 269 5 377 6 010 6 908 7 803 8 205
. data not available; unobtainable; data not separately available but included in another category. - none; magnitude known to be nil or zero; given in original source as ‘nil’ or ‘negligible’ without any further indication of the magnitude.
Source: Fishstat Plus.

31
Table A6. Value of EU farmed production of turbot for key nations 1985–2007 (EUR ’000)
Country 1985 1986 1987 1988 1989 1990 1991 1992 1993 1994 1995 1996 1997 1998 France 87.5 75.2 129.9 161.5 240 270 1 400 1 200 1 500 4 963.2 6 957.9 2 199.7 8 406 7 200 Netherlands - - - - - - - - - - 108 245 245 245 Portugal . . . . . . . . . 350 820 999.6 1 901.2 1 823.6 Spain 380 400 500 970 4 720.8 9 977.6 11 226.7 16 518.9 12 910.3 15 536.3 18 794.4 21 403.4 16 372.6 17 917.9 United Kingdom - - - - - - - - - - - - - - Total 467.5 475.2 629.9 1 131.5 4 960.8 10 247.6 12 623.7 17 718.9 14 410.3 20 849.5 26 680.3 24 847.7 26 924.8 27 186.5
Country 1999 2000 2001 2002 2003 2004 2005 2006 2007 France 6 622.8 7 131.6 5 923.1 7 429.9 9 717.1 11 173.6 9 952.5 12 693.9 13 619.3 Netherlands . . . . 675.3 746 747.5 1 004.5 925.2 Portugal 3 591 3 610 3 258.5 2 727.7 2 703.8 2 832.8 1 871.5 1 742.2 1 840.3 Spain 25 641 28 713 30 178.8 30,776 26 964 30 429 39 004 44 933 47 866 United Kingdom - 963 1 080 405 1 152 2 097 522 558 558 Total 39 454.6 39 360.4 40 933.6 40 060.2 4 5281.4 51 575.5 60 373.6 64 250.8
. data not available; unobtainable; data not separately available but included in another category. - none; magnitude known to be nil or zero; given in original source as ‘nil’ or ‘negligible’ without any further indication of the magnitude.
Source: Fishstat Plus. Table A7. Spanish origin turbot prices, in Spain, fresh, whole, cultured, 1–2 kg/pc, monthly in EUR/kg
Jan Feb Mar Apr May Jun Jul Aug Sep Oct Nov Dec
2000 8.04 8.19 7.59 7.59 7.59 7.89 7.59 7.29 7.29 7.06 7.51 7.14
2001 7.66 7.66 8.49 8.49 9.77 10.67 10.67 10.67 10.29 10.44 10.44 8.41
2002 8.41 8.41 8.70 8.70 8.70 8.48 8.33 8.55 8.55 8.23 8.53 8.68
2003 9.15 9.15 9.15 9.15 9.45 9.20 9.00 8.75 8.75 10.10 10.10 9.05
2004 9.40 9.70 9.70 8.95 8.55 7.90 7.90 7.55 7.50 8.15 8.75 na
2005 8.65 8.55 8.55 8.55 8.70 9.10 9.75 9.90 10.15 10.15 9.25 8.25
2006 8.25 8.25 8.90 9.00 9.20 9.90 9.90 9.20 9.20 9.70 10.15 10.15
2007 10.40 10.40 10.00 10.00 10.00 10.20 10.20 11.65 13.35 13.35 12.55 10.05
2008 10.05 9.65 9.65 9.25 9.10 8.95 8.65 8.15 8.15 7.25 7.25 7.25
2009 7.25 7.25 7.05 7.10 7.70 7.80 7.25 na 6.60 6.60 6.25 6.25
2010 6.25 6.50 7.60 8.70 8.70 8.60 8.40 8.65 8.65 9.10 9.10 8.45
2011 8.15 8.80
Source: Globefish EPR 15 Feb 2011.

GLOBEFISH MARKET RESEARCH PROGRAMME Vol 80 Fishery Industry in Russia (70P.) JUN 2005 €30 Vol 81 Trends in European Groundfish Markets (153P.) NOV 2005 €50 Vol 82 Freshwater species on the European Market (119P.) DEC 2005 €30 Vol 83 Fish Supply and Demand in the Near East Region (67P.) JAN 2006 €30 Vol 84 The market for Nile Perch (94P.) APR 2006 €30 Vol 85 Supermarkets and the Artisanal Fisheries Sector in Latin America (79P.) APR 2006 €30 Vol 86 Markets and Marketing of Aquaculture Finfish in Europe (50P.) AUG 2006 €30 Vol 87 Lobster Markets (92P.) OCT 2006 €30 Vol 88 Republic of Korea - Fishery Industry Profile (72P.) NOV 2006 €30 Vol 89 World Surimi Market (125P.) NOV 2006 €30 Vol 90 Market Penetration of Developing Country Seafood Products (57P.) APR 2008 €30 Vol 91 Ecolabels and Marine Capture Fisheries (52P.) APR 2008 €30 Vol 92 The Seafood market in Italy (59P.) APR 2008 €30 Vol 93 Global Production and Marketing of Canned Tuna (44P.) APR 2008 €30 Vol 94 World Octopus Markets (65P.) JUL 2008 €30 Vol 95 The Seafood market in Southern EU: Cyprus, Malta and Slovenia (46P.) JUL 2008 €30 Vol 96 The Seafood market in Spain (59P.) NOV 2008 €30 Vol 97 Private standards in fisheries and aquaculture (64P.) APR 2009 €30 Vol 98 The Seafood market in Greece (33P.) MAR 2010 €30 Vol 99 VietNam Seafood from waterland (124P.) MAR 2010 €30 Vol 100 Importance of APEC in world fisheries and aquaculture (34P.) MAR 2010 €30 Vol 101 Markets for Tilapia (37P.) JUN 2010 €30 Vol 102 The Ornamental Fish Trade (134P.) NOV 2010 €40 Vol 103 Turbot - Production Technology and Markets (31P.) FEB 2011 €30 ***********************************************************************
ORDER FORM COPIES ARE AVAILABLE FROM:
FAO - GLOBEFISH - Fisheries and Aquaculture Policy and Economics Division
Viale delle Terme di Caracalla, 00153 Rome, Italy Tel: (39-06) 570 52692 - Fax: (39-06) 570 53020 - Email: [email protected] - http://www.globefish.org
20% DISCOUNT IS OFFERED IF YOU ORDER TWO OR MORE COPIES
I would like to order _________ copy(ies) of the following GRPs ________________________ €_________ By bank cheque/draft in €_______ payable to GLOBEFISH (see address above) By credit card: Card No: ______________________ Visa Mastercard Expiry date: ____________________ Signature: _____________________ Bank transfer to: FAO Trust Fund (EUR), HSBC Bank Plc, 8 Canada Square, London E14 5HQ, UK A/C No: 67115083 (Swift Code MIDLGB22) - IBAN GB04MIDL40051567115083, referencing GLOBEFISH Name: _________________________________ Company: ______________________________ Street Address: ____________________________________________________________________________ City and Postcode: _______________________ Country: _______________________________ Tel: ________________ Fax: _______________ E-mail: _________________________________