Embed Size (px)
Citation preview

Tuning the E-Business Suite
Ahmed AlomariApplications Performance GroupApplications DevelopmentOracle Corporation

Agenda• Application Services Tier
– Forms– Reports– Concurrent Manager– Apache– Jserv/JVM– Portal– Discoverer
• Network Performance• Data Server Tier• Application Tuning• 11i10 and R12 Performance Improvements• Q & A

Tuning the Applications Tier

Application Services Tier• Forms
– Deploy with socket mode for internal users:• connectMode=socket (appsweb.cfg)
– Enable Forms Dead Client Detection• Value specified in minutes• Terminates f60webmx processes for dead clients.• FORMS60_TIMEOUT=10
– Enable Forms Abnormal Termination Handler• Do not set FORMS60_CATCHTERM
– If you are running 11.5.10 and Jinitiator 1.3, you should apply patch 4517707.• Without this patch, a new Jinitiator session is open
for every form.
Application Services Tier• Forms
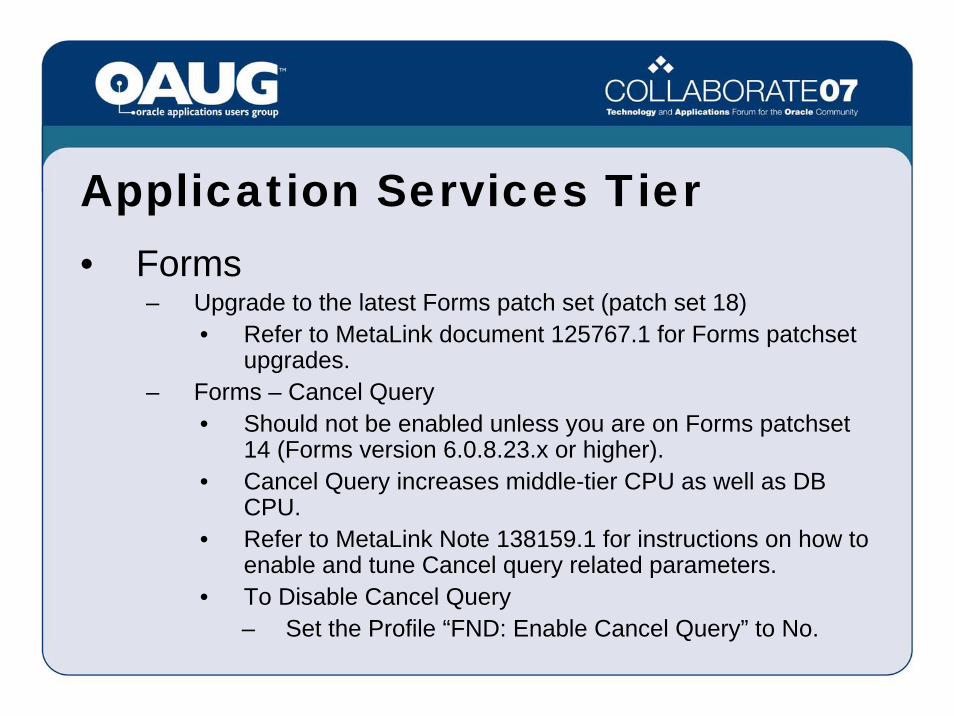
– Upgrade to the latest Forms patch set (patch set 18)• Refer to MetaLink document 125767.1 for Forms patchset
upgrades.– Forms – Cancel Query
• Should not be enabled unless you are on Forms patchset 14 (Forms version 6.0.8.23.x or higher).
• Cancel Query increases middle-tier CPU as well as DB CPU.
• Refer to MetaLink Note 138159.1 for instructions on how to enable and tune Cancel query related parameters.
• To Disable Cancel Query– Set the Profile “FND: Enable Cancel Query” to No.

Application Services Tier• Forms
– Ensure users are optimally utilizing the professional Forms interfaces.• Avoid Blind queries• Provide selective criteria in Find windows and LOVs.• Avoid opening and closing forms across transactions.
– Users which need to switch responsibility in order to complete a business transaction should instead keep the relevant Forms open.

• Forms (Tracing – SQL Trace)
Application Services Tier• Reports
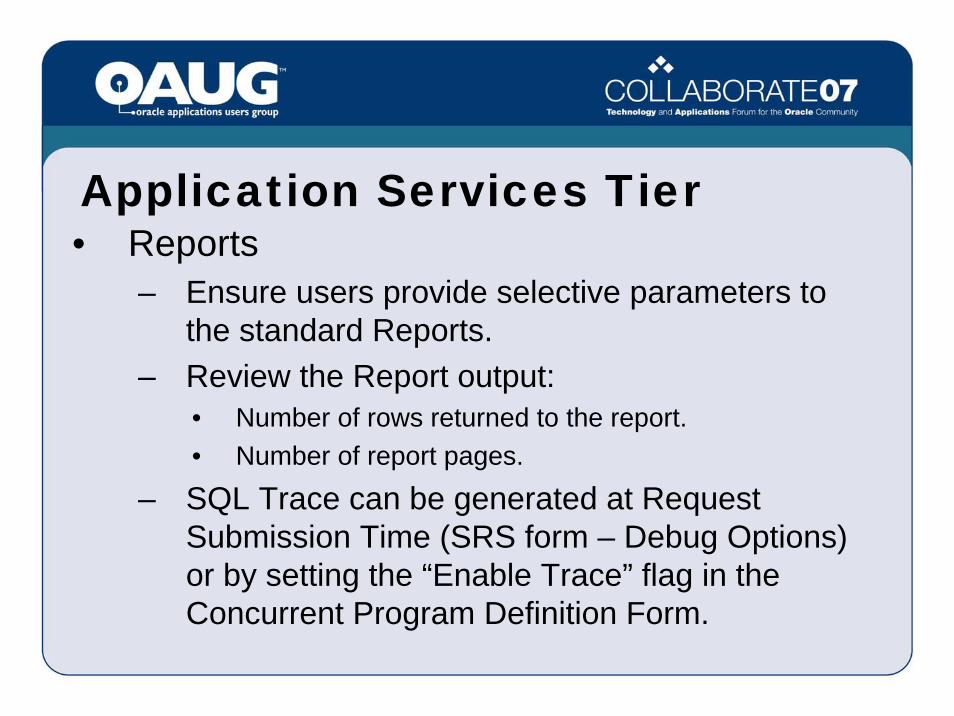
– Ensure users provide selective parameters to the standard Reports.
– Review the Report output:• Number of rows returned to the report.• Number of report pages.
– SQL Trace can be generated at Request Submission Time (SRS form – Debug Options) or by setting the “Enable Trace” flag in the Concurrent Program Definition Form.

Application Services Tier• Concurrent Manager
– Avoid enabling an excessive number of standard or specialized managers.
– Use specialization rules and work shifts to bind specific jobs to specific time windows.• Helps avoid scheduling resource intensive batch
requests during peak activity.– For jobs which spawn parallel workers such as
Auto Invoice or Payroll, set the sleep time of the Conflict Resolution Manager (CRM) to null (i.e. 10 seconds). The default value is 60 seconds.

• Concurrent Manager – Transaction Managers– Used for Inventory Transactions as well as other synchronous
online processing.– Ensure enough transaction managers exist to service the
request load.– Set the profile “Concurrent:Wait for Available TM” to 1 (second).– Set “TP:INV Transaction processing mode” to “On-line
processing” for small inventory requests from the UI.– Set the sleep time on the transaction managers to a high
number (e.g. 10 minutes).• Avoids constant polls to check for shutdown requests.
– Pipes be gone!• Requires RUP3 (4334965) or higher• Set the profile “Concurrent:TM Transport Type”• Avoids the need to run a transaction manager instance per
database instance for RAC deployments.

Application Services Tier• Concurrent Manager
– Enabling Tracing• Program Level
– Enable the trace option in the concurrent program definition form.
• Request Level (new in 11i10)– Use the Debug Options button in the Request
Submission Form» The profile “Concurrent: Allow Debugging” should be
set to “Yes.”

• Concurrent Manager– Enabling Trace at the Program Level

• Concurrent Manager– Enabling Trace at the Request Level
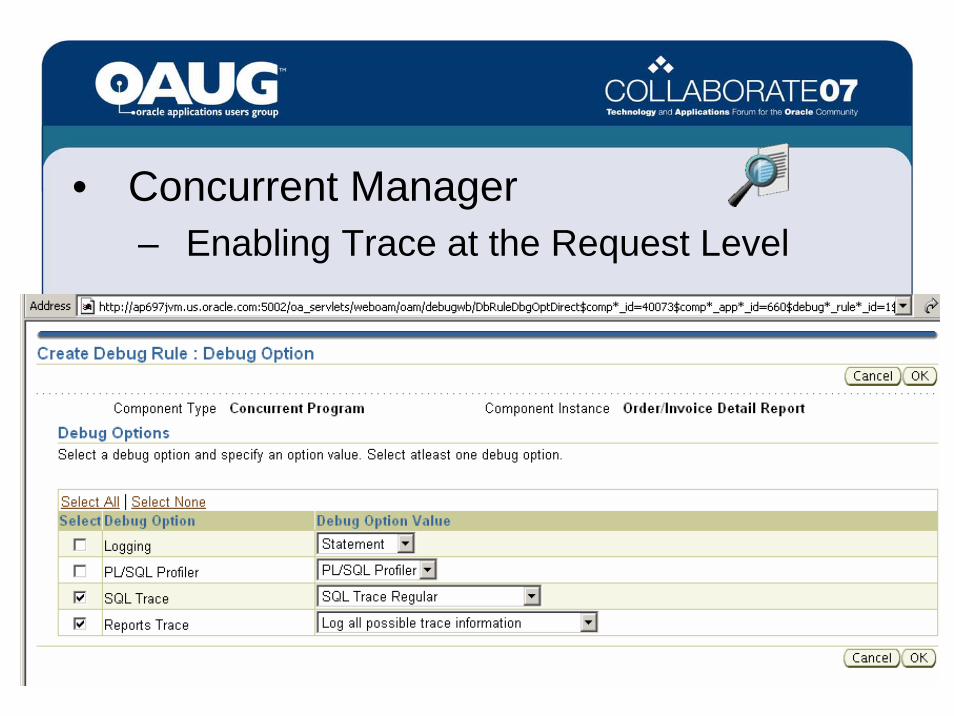
• Concurrent Manager– Enabling Trace at the Request Level

Application Services Tier• Apache
– On UNIX, Apache is process based (httpd), and mods such as mod PL/SQL run within the process address space of the httpd processes.
– On Windows, Apache is multi-threaded (Apache.exe).– Tune the number of processes and number of clients
(httpds.conf):• MinSpareServers 5• MaxSpareServers 10• StartServers 5• MaxClients 512

Application Services Tier• Apache
– Minimize levels of logging (httpds.conf):• LogLevel warn• SSLLogLevel warn
– Ensure non-HTML resources including images, style sheets, and Java script are being cached.• Caches content in the browser cache.
– Reduces network round-trips– Reduces network bandwidth utilization
• Included in AutoConfig templates in 11.5.8 (or higher).

• Apache – Review Apache Access Log file to ensure
images are being satisfied from the browser cache. • Http code 200 (request for document)• Http code 304 (request for time stamp)
130.35.127.106 - - [21/Oct/2006:14:00:21 -0700] "GET /OA_MEDIA/FNDINVDT.gif HTTP/1.1" 200 821130.35.127.106 - - [21/Oct/2006:14:38:23 -0700] "GET /OA_MEDIA/FNDINVDT.gif HTTP/1.1" 304 -130.35.127.106 - - [21/Oct/2006:14:38:23 -0700] "GET /OA_MEDIA/FNDWATHS.gif HTTP/1.1" 200 190130.35.127.106 - - [21/Oct/2006:14:38:23 -0700] "GET /OA_MEDIA/FNDREDPT.gif HTTP/1.1" 200 70130.35.127.106 - - [21/Oct/2006:14:39:23 -0700] "GET /OA_HTML/OA.jsp?page=/oracle/apps/icx/por/rcv/pages/ReceivingHomePage&OAHP=ICXPOR_MENU&OASF=ICXPOR_RCV_HOME_PAGE&dbc=ap107fam_ipdev11i&language_code=US&transactionid=70A5819F04C0F411 HTTP/1.1" 200 14130.35.127.106 - - [21/Oct/2006:14:39:34 -0700] "GET /servlets/PoolMonitor?jvm HTTP/1.1" 200 7954130.35.127.106 - - [21/Oct/2006:14:41:03 -0700] "GET /OA_HTML/US/ICXINDEX_ipdev11i.htm HTTP/1.1" 304 -130.35.127.106 - - [21/Oct/2006:14:41:03 -0700] "GET /OA_MEDIA/logo.gif HTTP/1.1" 304 -130.35.127.106 - - [21/Oct/2006:14:41:03 -0700] "GET /OA_MEDIA/appslogo.gif HTTP/1.1" 304 -130.35.127.106 - - [21/Oct/2006:14:41:03 -0700] "GET /OA_MEDIA/FNDJLFRL.gif HTTP/1.1" 304 -130.35.127.106 - - [21/Oct/2006:14:41:03 -0700] "GET /OA_MEDIA/FNDINVDT.gif HTTP/1.1" 304 -130.35.127.106 - - [21/Oct/2006:14:41:03 -0700] "GET /OA_MEDIA/FNDJLFRR.gif HTTP/1.1" 304 -

• Apache Jserv / JVM– Minimize Jserv logging
• ApJServLogLevel warn• log=false• log.channel.warning=true • log.file=/d1/ias/Apache/Jserv/logs/jserv_7000.log
– Review error log files for exceptions.– Disable auto reload in production environments:
• autoreload.classes=false• autoreload.file=false
– Use Jserv Auto Load Balancing• Configure Multiple Zones.• Provides higher availability and improves scalability.
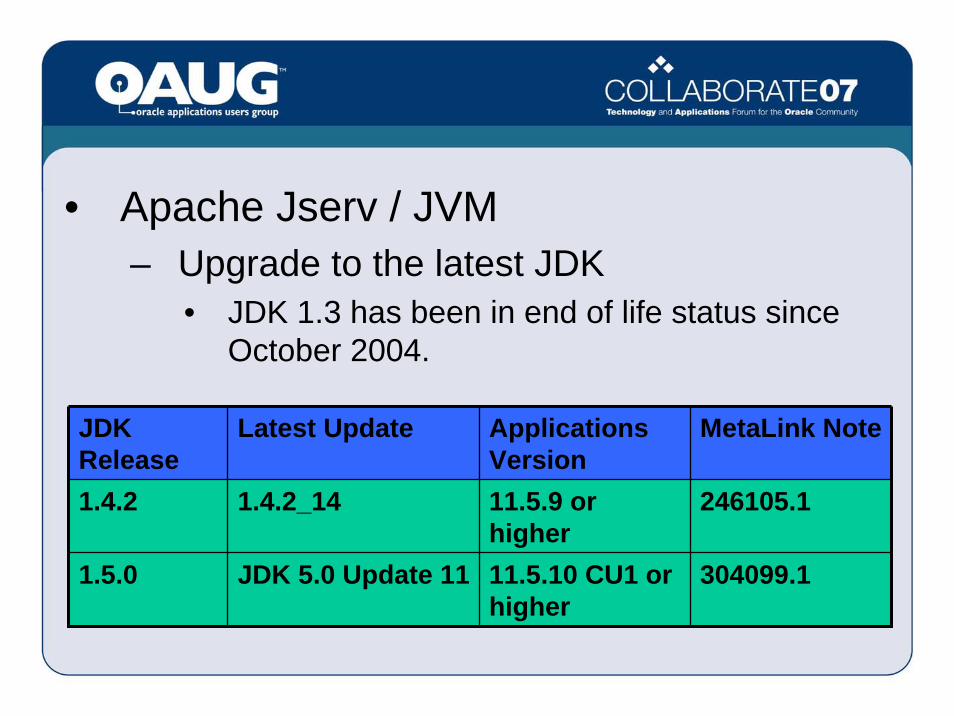
• Apache Jserv / JVM– Upgrade to the latest JDK
• JDK 1.3 has been in end of life status since October 2004.
JDK Release
Latest Update Applications Version
MetaLink Note
1.4.2 1.4.2_14 11.5.9 or higher11.5.10 CU1 or higher
246105.1
1.5.0 JDK 5.0 Update 11 304099.1

• Apache Jserv / JVM– Do not disable hotspot or the JIT
• Do not set -DCOMPILER=NONE or –Xint– Enable verbose GC in order to optimally
tune the heap sizes based on the GC traffic.• Minor Collections• Major Collections• Elapsed Time of GC

• Apache Jserv / JVM– Verbose GC Output (11.5.10 or higher)
• In 11.5.10, JVM logs re-directed to the directory $APACHE_TOP/Apache/Jserv/logs/jvm
• File name format is– <coregroupname>.<core#>.stdout | stderr
DiscoGroup.0.stderrDiscoGroup.0.stdoutFormsGroup.0.stderrFormsGroup.0.stdoutOACoreGroup.0.stderrOACoreGroup.0.stdoutXmlSvcsGrp.0.stderrXmlSvcsGrp.0.stdout

• Apache Jserv / JVM– Verbose GC Data
• Can use the GC Timestamp and GC Details to print additional information (JDK 1.4 or higher):– -XX:+PrintGCTimeStamps – -XX:+PrintGCDetails
0.000: [GC [PSYoungGen: 43008K->3698K(50176K)] 43008K->3698K(160768K), 0.0770625 secs]1.483: [GC [PSYoungGen: 46706K->3786K(50176K)] 46706K->3786K(160768K), 0.0748696 secs]2.903: [GC [PSYoungGen: 46794K->3784K(50176K)] 46794K->3784K(160768K), 0.0115077 secs]4.150: [GC [PSYoungGen: 46751K->3795K(93184K)] 46751K->3795K(203776K), 0.0852725 secs]6.613: [GC [PSYoungGen: 89811K->3790K(95232K)] 89811K->3790K(205824K), 0.0751701 secs]8.899: [GC [PSYoungGen: 91854K->3744K(176384K)] 91854K->3744K(286976K), 0.0476447 secs]13.919: [GC [PSYoungGen: 176224K->3831K(176320K)] 176224K->6472K(286912K), 0.0565599 secs]18.286: [GC [PSYoungGen: 176311K->4831K(346688K)] 178952K->7472K(457280K), 0.0690990 secs]26.784: [GC [PSYoungGen: 346335K->5371K(346880K)] 348976K->10041K(457472K), 0.0372240 secs]34.182: [GC [PSYoungGen: 346875K->5370K(342016K)] 351545K->13105K(452608K), 0.0187100 secs]41.384: [GC [PSYoungGen: 342010K->6734K(343424K)] 349745K->16053K(454016K), 0.0480950 secs]

• Apache Jserv / JVM– Utilize the verbose GC output to tune the JVM
heaps (-Xmx and –Xms) accordingly.– Review the frequency of collections, especially
major collections (i.e. Full GC).• Start with:
– -Xms512M and –Xmx512M – -XX:NewRatio=2
– Above settings have been incorporated in 11i10.

• Java Memory and Connection Leaks– Apply ATG Rollup 4 (Bug 4676589)
• Refer to MetaLink note 365228.1– As of JDK 1.5 (Update 7) and 1.4.2_12, a new
option was added to generate a heap dump.• Add –XX:+HeapDumpOnOutOfMemoryError –
XX:HeapDumpPath=/tmp to the JVM startup options• If an OutOfMemoryError occurs, a heap dump will be
generated in the path specified by –XX:HeapDumpPath
• The heap dump file can be read by the Heap Analysis Tool (HAT), or jhat (in JDK 6), or a profiler that supports the binary heap dump format (e.g. YourKit Java Profiler)
• Apache Jserv / JVM– Use Garbage Collection Tools to display the
data graphically• HPjtune
– -verbose:gc -Xloggc:/logs/gc.out– http://www.hp.com/products1/unix/java/java2/hpjtune/
• visualgc (jvmstat)– http://java.sun.com/performance/jvmstat/

• Apache Jserv / JVM - Upgrade to JDK 5.0– Refer to MetaLink note 304099.1 upgrade
instructions.– ~15% performance improvement.– Parallel Collector is used– Adaptive Heap Sizing– Improved scalability– New Manageability framework and monitoring tools
• Jconsole• jps• jstat• visualgc
– Download from http://java.sun.com/performance/jvmstat/

• Portal Tuning– Ensure that the mod PL/SQL cache is
enabled and sized appropriately:$APACHE_TOP/modplsql/cfg/cache.cfg:
[PLSQL Cache]enabled=yestotal_size=100000000cleanup_size=75000000cleanup_interval=86400;
[Cookie Cache]enabled=yestotal_size=25000000cleanup_size=15000000cleanup_interval=86400max_size = 0
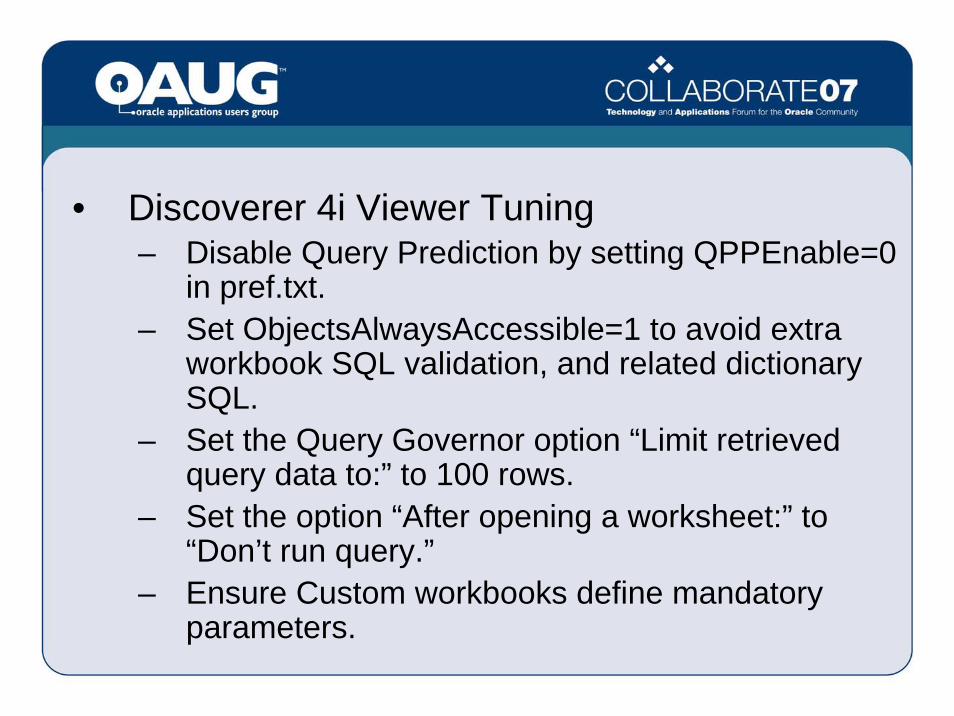
• Discoverer 4i Viewer Tuning– Disable Query Prediction by setting QPPEnable=0
in pref.txt.– Set ObjectsAlwaysAccessible=1 to avoid extra
workbook SQL validation, and related dictionary SQL.
– Set the Query Governor option “Limit retrieved query data to:” to 100 rows.
– Set the option “After opening a worksheet:” to “Don’t run query.”
– Ensure Custom workbooks define mandatory parameters.

• Upgrade to Discoverer 10g (10.1.2) – Refer to MetaLink Note 313418.1
• Discoverer 10g Tuning– Enable SQL Flattening Feature
• SQLFlatten=1• Significantly reduces sharable memory and parse time of
SQL statements generated by Discoverer– Enable Item trimming
• SQLItemTrim=1• Eliminates unused items from the SQL statement
– Enable Join trimming• SQLJoinTrim=1• Eliminates joins which are not needed based on the
selection.

Tuning the Network

Network Performance• Network performance is often neglected.• Networks with poor latency or low bandwidth
impacts user response time.• Can also impact concurrent programs if the
network between the application tier and data server tier is not optimal.
• A direct switch should be used between the application tier and data server tier– Latency should ideally be ~1 per round-trip.
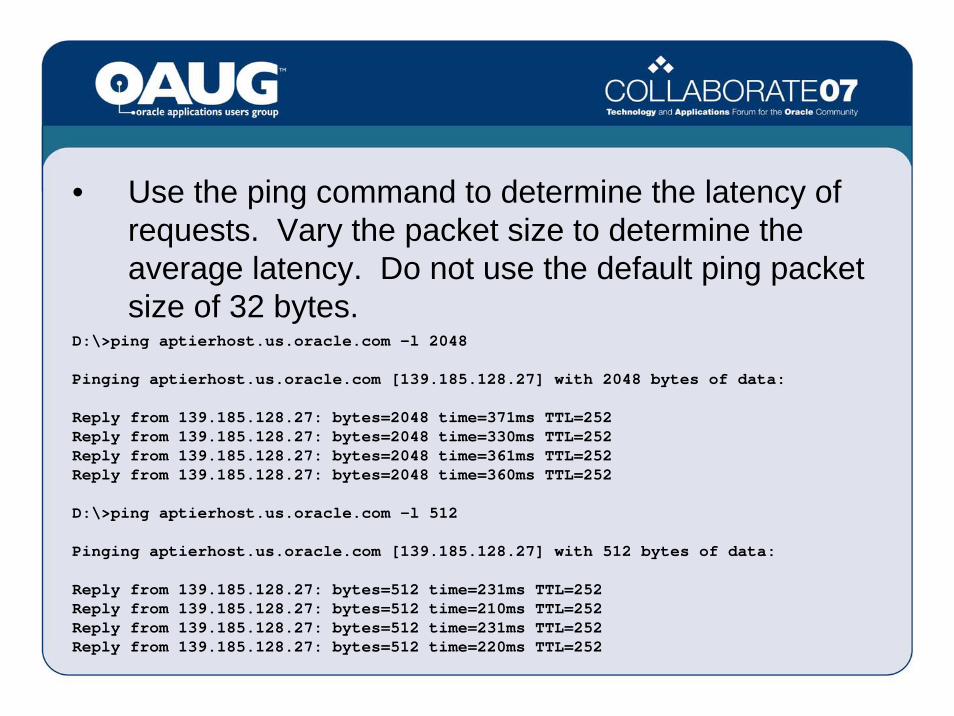
• Use the ping command to determine the latency of requests. Vary the packet size to determine the average latency. Do not use the default ping packet size of 32 bytes.
D:\>ping aptierhost.us.oracle.com -l 2048
Pinging aptierhost.us.oracle.com [139.185.128.27] with 2048 bytes of data:
Reply from 139.185.128.27: bytes=2048 time=371ms TTL=252Reply from 139.185.128.27: bytes=2048 time=330ms TTL=252Reply from 139.185.128.27: bytes=2048 time=361ms TTL=252Reply from 139.185.128.27: bytes=2048 time=360ms TTL=252
D:\>ping aptierhost.us.oracle.com -l 512
Pinging aptierhost.us.oracle.com [139.185.128.27] with 512 bytes of data:
Reply from 139.185.128.27: bytes=512 time=231ms TTL=252Reply from 139.185.128.27: bytes=512 time=210ms TTL=252Reply from 139.185.128.27: bytes=512 time=231ms TTL=252Reply from 139.185.128.27: bytes=512 time=220ms TTL=252

• Use the ping command to determine the latency between the application server and the data server. Use a packet size of 2K since this the default size for SQL*Net traffic.
aptierhost{applmgr}-2-> ping -s dbtierhost 2048
PING dbtierhost.us.oracle.com: 2048 data bytes2056 bytes from dbtierhost.us.oracle.com (144.25.76.250): icmp_seq=0. time=1. ms2056 bytes from dbtierhost.us.oracle.com (144.25.76.250): icmp_seq=1. time=1. ms2056 bytes from dbtierhost.us.oracle.com (144.25.76.250): icmp_seq=2. time=1. ms2056 bytes from dbtierhost.us.oracle.com (144.25.76.250): icmp_seq=3. time=1. ms2056 bytes from dbtierhost.us.oracle.com (144.25.76.250): icmp_seq=4. time=1. ms2056 bytes from dbtierhost.us.oracle.com (144.25.76.250): icmp_seq=5. time=1. Ms
---- dbtierhost.us.oracle.com PING Statistics----6 packets transmitted, 6 packets received, 0% packet lossround-trip (ms) min/avg/max = 1/1/1

Network Performance• Application Server Web Cache can be
used to reduce network traffic between the client and middle-tiers.– Compression– Caching of images, style sheets, and Java
script• Web Cache 10.1.2 is certified with 11i• Refer to MetaLink note 306653.1
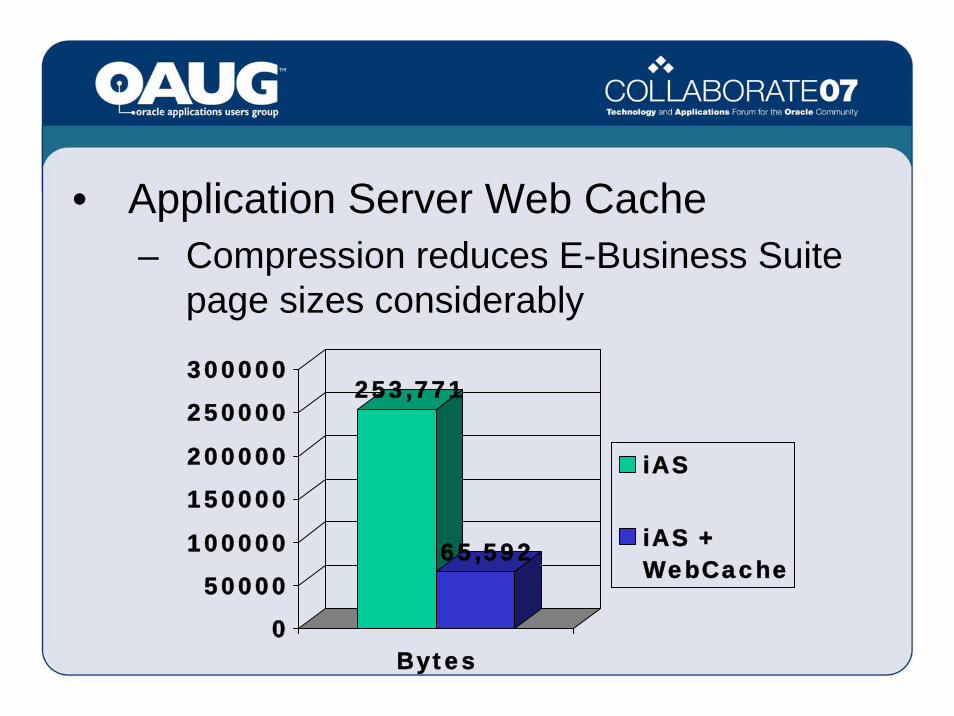
• Application Server Web Cache– Compression reduces E-Business Suite
page sizes considerably
253,771
65,592
0
50000
100000
150000
200000
250000
300000
Bytes
iAS
iAS +WebCache

• Application Server Web Cache– Compression reduces E-Business Suite
page sizes considerably
104
29
0
20
40
60
80
100
120
TCP Turns
iAS
iAS +WebCache

• Application Server Web CacheR e s p o n s e T im e
5 3 .3
5 8 . 7
1 3 . 29 . 0
1 1 . 7
2 2 .0 2 3 .1
8 .5
0 . 0
1 0 . 0
2 0 . 0
3 0 . 0
4 0 . 0
5 0 . 0
6 0 . 0
7 0 . 0
L a n -1 0 0M b p s
D S L - 5 1 2K b p s
IS D N - 6 4K b p s
D ia lu p - 5 6K b p s
Seco
nds
iA SW e b C a c h e

Tuning the Database Tier
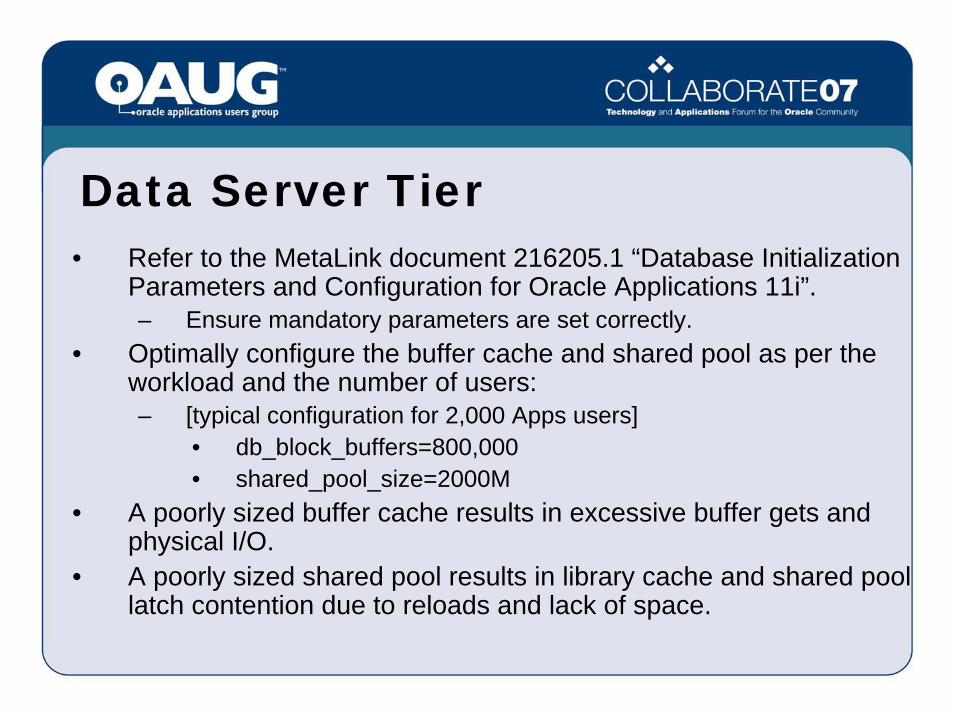
Data Server Tier• Refer to the MetaLink document 216205.1 “Database Initialization
Parameters and Configuration for Oracle Applications 11i”.– Ensure mandatory parameters are set correctly.
• Optimally configure the buffer cache and shared pool as per the workload and the number of users:– [typical configuration for 2,000 Apps users]
• db_block_buffers=800,000• shared_pool_size=2000M
• A poorly sized buffer cache results in excessive buffer gets andphysical I/O.
• A poorly sized shared pool results in library cache and shared pool latch contention due to reloads and lack of space.

• Enable asynchronous I/O• Consider using Quick I/O or equivalent if using file
system based files for the DB files.– Quick I/O improves performance and scalability by simulating
raw devices, and avoiding file system cache traffic for the DB files.
• Use locally managed temp files (uniform) for the temporary tablespace.
• 9iR2: – Install Stats Pack (spcreate.sql) and use spauto.sql to
automate hourly snapshots.– Stats Pack reports can be used to trend transaction rates and
business flows.• 10g – Use the AWR Reports

• Stats Pack Report (Instance Summary)
STATSPACK report for
DB Name DB Id Instance Inst Num Release Cluster Host------------ ----------- ------------ -------- ----------- ------- ------------PROD 317772662 crmprod 1 9.2.0.7.0 YES aproddbs1
Snap Id Snap Time Sessions Curs/Sess Comment------- ------------------ -------- --------- -------------------
Begin Snap: 523410 19-Oct-06 11:00:01 ####### .0End Snap: 523505 19-Oct-06 16:00:04 ####### .0Elapsed: 300.05 (mins)
Cache Sizes (end)~~~~~~~~~~~~~~~~~
Buffer Cache: 5,313M Std Block Size: 8KShared Pool Size: 2,864M Log Buffer: 1,024K
. . . . . . . . . . . .
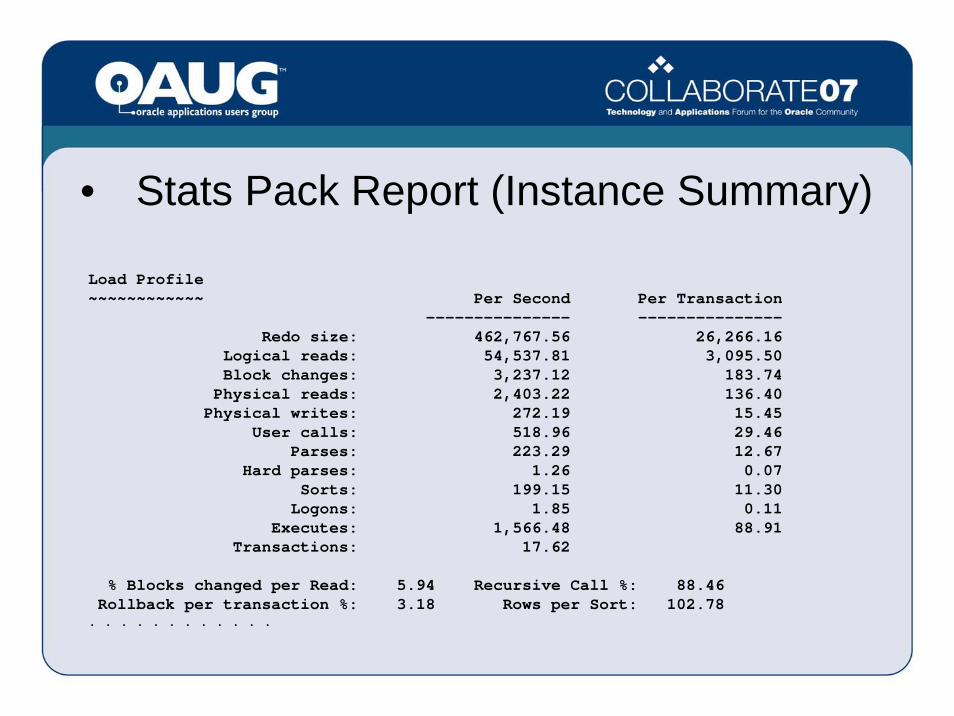
• Stats Pack Report (Instance Summary)
Load Profile~~~~~~~~~~~~ Per Second Per Transaction
--------------- ---------------Redo size: 462,767.56 26,266.16
Logical reads: 54,537.81 3,095.50Block changes: 3,237.12 183.74
Physical reads: 2,403.22 136.40Physical writes: 272.19 15.45
User calls: 518.96 29.46Parses: 223.29 12.67
Hard parses: 1.26 0.07Sorts: 199.15 11.30
Logons: 1.85 0.11Executes: 1,566.48 88.91
Transactions: 17.62
% Blocks changed per Read: 5.94 Recursive Call %: 88.46Rollback per transaction %: 3.18 Rows per Sort: 102.78
. . . . . . . . . . . .

• Stats Pack Report (Instance Summary)Instance Efficiency Percentages (Target 100%)~~~~~~~~~~~~~~~~~~~~~~~~~~~~~~~~~~~~~~~~~~~~~
Buffer Nowait %: 99.90 Redo NoWait %: 100.00Buffer Hit %: 96.03 In-memory Sort %: 99.96Library Hit %: 99.87 Soft Parse %: 99.44
Execute to Parse %: 85.75 Latch Hit %: 99.82Parse CPU to Parse Elapsd %: 69.57 % Non-Parse CPU: 97.34
Shared Pool Statistics Begin End------ ------
Memory Usage %: 90.55 76.14% SQL with executions>1: 66.70 75.37
% Memory for SQL w/exec>1: 60.86 71.08
Top 5 Timed Events~~~~~~~~~~~~~~~~~~ % TotalEvent Waits Time (s) Ela Time-------------------------------------------- ------------ ----------- --------db file sequential read 16,187,270 134,274 31.12CPU time 110,764 25.67global cache cr request 21,410,811 66,129 15.33db file scattered read 3,184,765 23,571 5.46KJC: Wait for msg sends to complete 10,722,532 20,446 4.74

• Stats Pack Report (Wait Events)Avg
Total Wait wait WaitsEvent Waits Timeouts Time (s) (ms) /txn---------------------------- ------------ ---------- ---------- ------ --------db file sequential read 16,187,270 0 134,274 8 51.0global cache cr request 21,410,811 56,241 66,129 3 67.5db file scattered read 3,184,765 0 23,571 7 10.0KJC: Wait for msg sends to c 10,722,532 194,069 20,446 2 33.8row cache lock 74,583 5,842 17,796 239 0.2wait for unread message on b 73,977 4,624 13,054 176 0.2SQL*Net more data to client 6,021,483 0 8,873 1 19.0enqueue 114,204 19,898 7,427 65 0.4buffer busy global CR 516,382 18 4,735 9 1.6buffer busy waits 434,054 192 3,857 9 1.4direct path read 1,239,648 0 3,226 3 3.9inactive session 1,774 1,774 1,784 1006 0.0latch free 242,171 19,203 1,694 7 0.8db file parallel read 121,670 0 1,280 11 0.4direct path write 1,270,008 0 1,110 1 4.0log file sync 604,002 244 1,097 2 1.9SQL*Net message from dblink 20,365 0 1,080 53 0.1

Data Server Tier• If you are currently on 9iR2, plan for
your upgrade to 10gR2.– Many manageability and performance
improvements.• AWR• ADDM• ASH
– Improved Applications performance

10g Certification with 11i• 10gR1 Database (10.1.0.5)
– Certified with 11i – MetaLink Note 282038.1 (10gR1 Interoperability
note for Oracle Applications 11i)• 10gR2 Database (10.2.0.3)
– Certified with 11i– MetaLink Note 362203.1 (10gR2 Interoperability
note for Oracle Applications 11i)

10g Features - Manageability• Automatic Workload Repository (AWR)
– “Data Warehouse” of the Database– Replacement for StatsPack– Takes periodic snapshots– Diff Report (compare two snapshot intervals)
• Automatic Database Diagnostic Monitor (ADDM)– Performance Diagnostic engine in the database– Automatically diagnoses performance problems – Provides Root Cause Analysis with recommended solutions– Identifies non-problems areas
• Active Session History (ASH)– A repository of session wait details

D E M O N S T R A T I O N
AWR Report
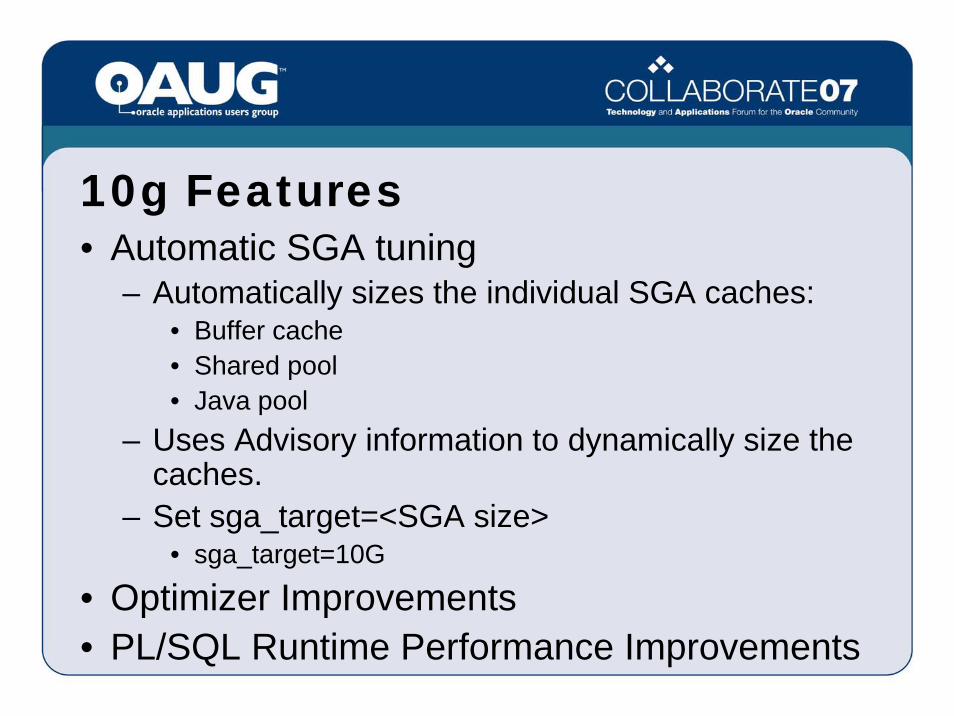
10g Features• Automatic SGA tuning
– Automatically sizes the individual SGA caches:• Buffer cache• Shared pool• Java pool
– Uses Advisory information to dynamically size the caches.
– Set sga_target=<SGA size>• sga_target=10G
• Optimizer Improvements• PL/SQL Runtime Performance Improvements

Data Server Tier• Database Resource Manager Integration
– Define Resource Consumer Groups and associate specific concurrent programs with a resource group.
– Allows an administrator to constrain the amount of CPU resources used by a concurrent program.
– Resource Groups can also be defined for online users and concurrent requests using the profile:• “FND: Resource Consumer Group”.
– Useful for Discoverer users or ad-hoc reporting users.
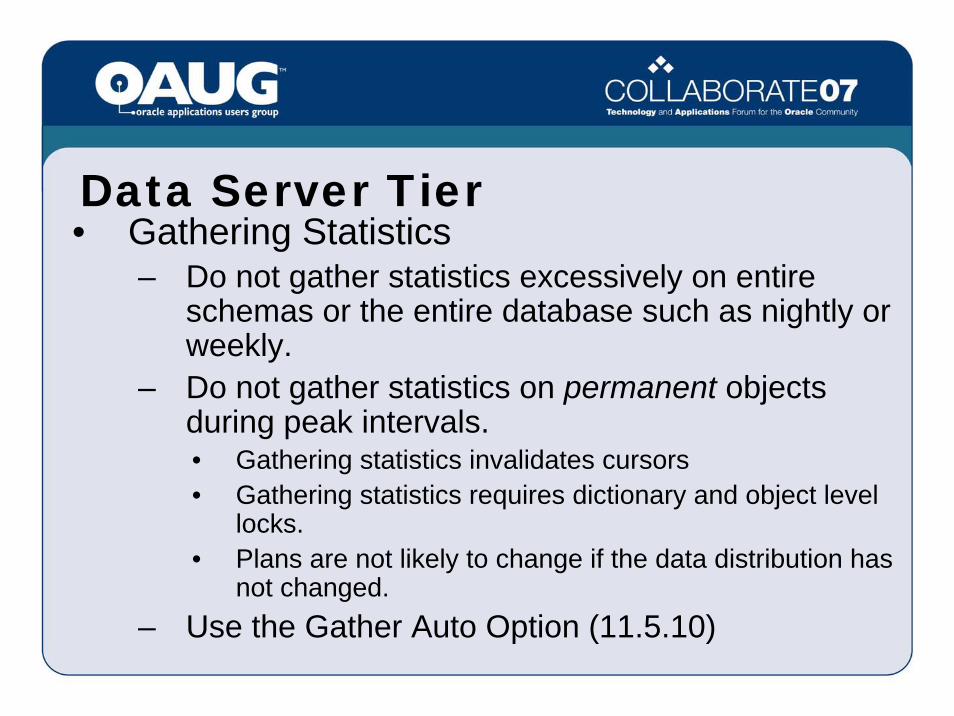
Data Server Tier• Gathering Statistics
– Do not gather statistics excessively on entire schemas or the entire database such as nightly or weekly.
– Do not gather statistics on permanent objects during peak intervals.• Gathering statistics invalidates cursors• Gathering statistics requires dictionary and object level
locks.• Plans are not likely to change if the data distribution has
not changed.– Use the Gather Auto Option (11.5.10)

• Gathering Statistics Enhancements (11i10)

Data Server Tier• New Tablespace Model for the E-Business Suite:
– Consolidates the number of Apps tablespaces from 400 tablespaces to 10.
– Optimizes performance via the wide stripe model.– Ideal for customers migrating to RAC or migrating to raw
devices.– Uniform extents, locally managed
• No more fragmentation!– Migration script can be used to migrate a schema at a time.

• New Tablespace Model for the E-Business Suite:– Objects are classified by object type and access patterns:
• Transaction tables• Transaction indexes• Reference/SEED • Interface • Summary Management • Archive • NoLogging• Queue • Media• Temporary• Undo• System• Total = 12 Tablespaces

Data Server Tier• Applications Tablespace Migration Utility
– MetaLink note 248857.1– ARU # is 3942506
• Migration timings: (complete migration)– 1.4 Terabyte customer DB
• 24 hours• New size of DB after migration (850 GB).
– 180 GB customer DB• 4 hours • New size of DB after migration (120 GB).
Tuning the Application

Application Tuning• Review the MetaLink note
“Recommended Performance Patches for the Oracle E-Business Suite”, 244040.1.– Recommended performance patches for all
the modules and tech. stack components are consolidated in this note.

• Workflow– When starting background engines via Concurrent
Manager, set the Process Stuck parameter to No.– Start a separate background engine to handle
stuck processes with a very low frequency such as once or twice a day.
– Use deferred activities to improve online response times and facilitate asynchronous processing for flows such as Scheduling, PO Document Approval, etc..
– Establish a regular frequency for purging Workflow runtime data (FNDWFPR - Purge Obsolete Workflow Runtime Data).

• Workflow– Disable retention on Workflow Queues
• SQL> select owner,name,queue_table,retention from dba_queueswhere owner='APPLSYS' and retention != 0;
• SQL> exec DBMS_AQADM.ALTER_QUEUE(queue_name=>:b1,retention_time=>0);
– Avoid dequeuing by correlation• When starting the Workflow Background Process, avoid
specifying the Item Type parameter.• When starting the Workflow Agent Listener, do not
specify the Correlation ID.• For 11.5.9 or OWF G, apply patch 3940679.
– Apply RDBMS patch 4519477
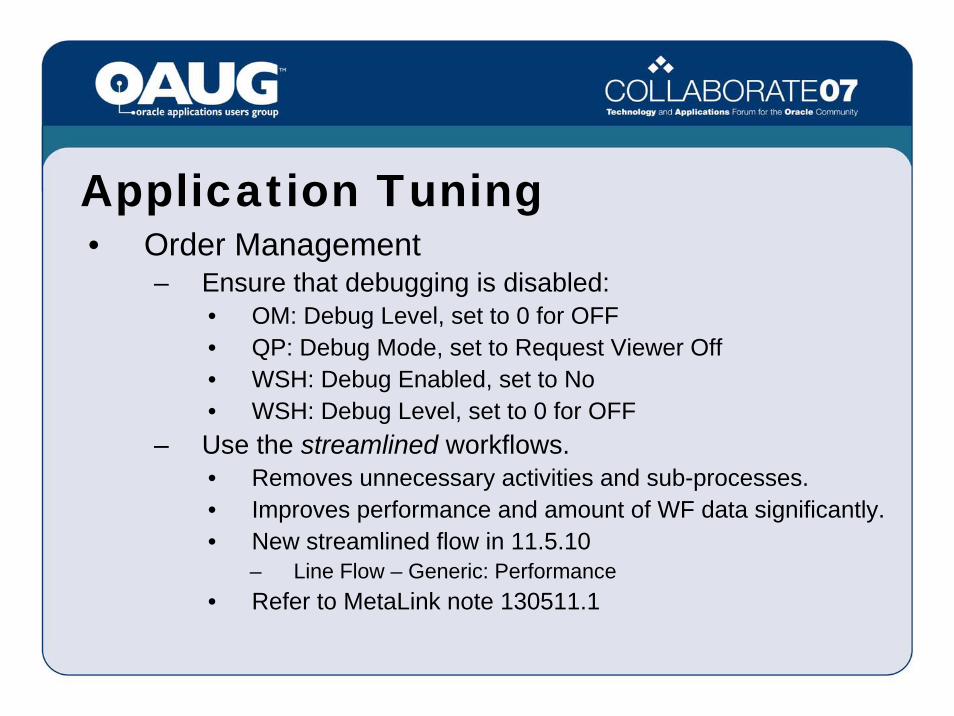
Application Tuning• Order Management
– Ensure that debugging is disabled:• OM: Debug Level, set to 0 for OFF• QP: Debug Mode, set to Request Viewer Off• WSH: Debug Enabled, set to No• WSH: Debug Level, set to 0 for OFF
– Use the streamlined workflows.• Removes unnecessary activities and sub-processes.• Improves performance and amount of WF data significantly.• New streamlined flow in 11.5.10
– Line Flow – Generic: Performance• Refer to MetaLink note 130511.1

Application Tuning• Order Management
– For online order entry, use the new Quick Sales Order Form• Provides a checkbox “deferred pricing” which can be
used to defer price calculation until the order is saved.• Also improves overall speed of order entry from a
functional / navigational perspective.– Enable AutoScheduling– Use deferred activities
• Tax Calculation• Credit Check

Application Tuning• Payroll
– Tune the number of threads, chunk size and the buffer sizes (pay_action_parameters):• THREADS=25• CHUNK_SIZE = 20• BAL BUFFER SIZE=550• EE BUFFER SIZE =550• RR BUFFER SIZE =550• COST BUFFER SIZE=550
– Set threads to ~1.5 times the number of data server processors.
– Set LOW_VOLUME=N to enable optimal plans.

• Web Applications– Ensure the users are trained to use the Logout
or Home global buttons when completing their transactions.
• Do not train them to use the browser close (“x”) link.
– Logging out gracefully releases the memory and corresponding resources (i.e. connections, etc..)
• Avoids memory leaks and timeout based invalidation.

• Logging– FND: Debug Log Enabled
• Prior to RUP3: Set it to No.• RUP3 and beyond: Set it to Yes.
– FND: Debug Log Level• Should be set to Unexpected (Level=6)
– Query fnd_log_messages to determine the logging traffic.
– If the profiles are set as recommended above, you should not see many messages logged.
• If the query shows a large number of rows being created, there could be exceptions and errors which need to be investigated.
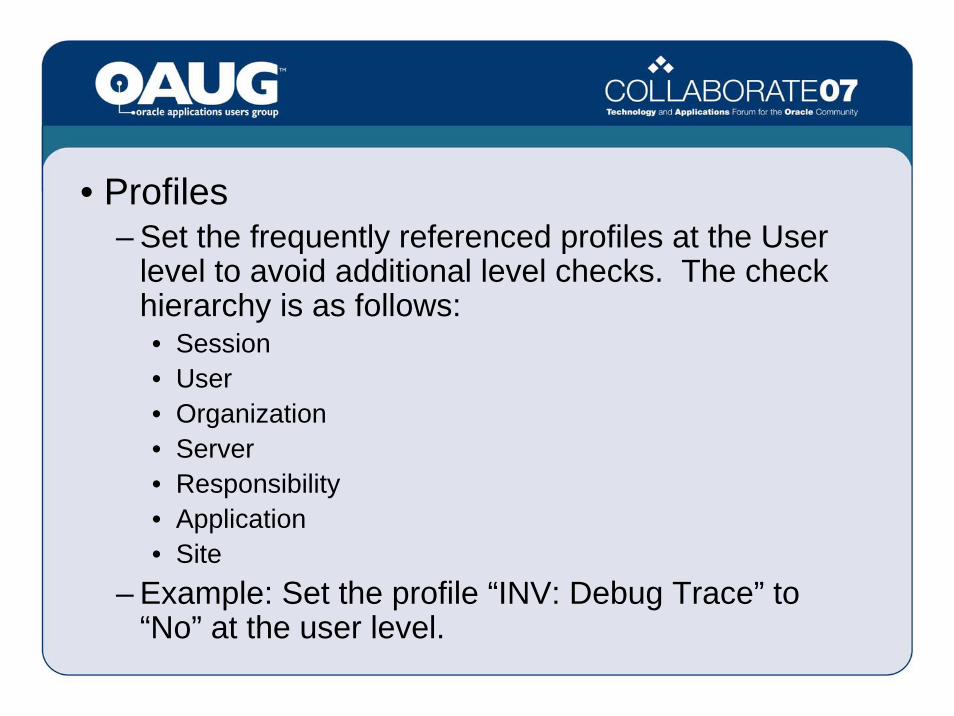
• Profiles– Set the frequently referenced profiles at the User
level to avoid additional level checks. The check hierarchy is as follows:• Session• User• Organization• Server• Responsibility• Application• Site
– Example: Set the profile “INV: Debug Trace” to “No” at the user level.

11i10 and R12 Performance Enhancements

• Help->About Oracle Applications shows performance information including time spent in the Form and time spent in the DB.
• Trace file identifier is automatically set to the Applications user name – prod11i_ora_2738_BASMITH.trc
• New Report (PL/SQL Profiler)– Generates an HTML report of the PL/SQL profiler
data.
11i10 Tracing Improvements

• PL/SQL Profiler Report

• PL/SQL Profiler Report

• Performance Info
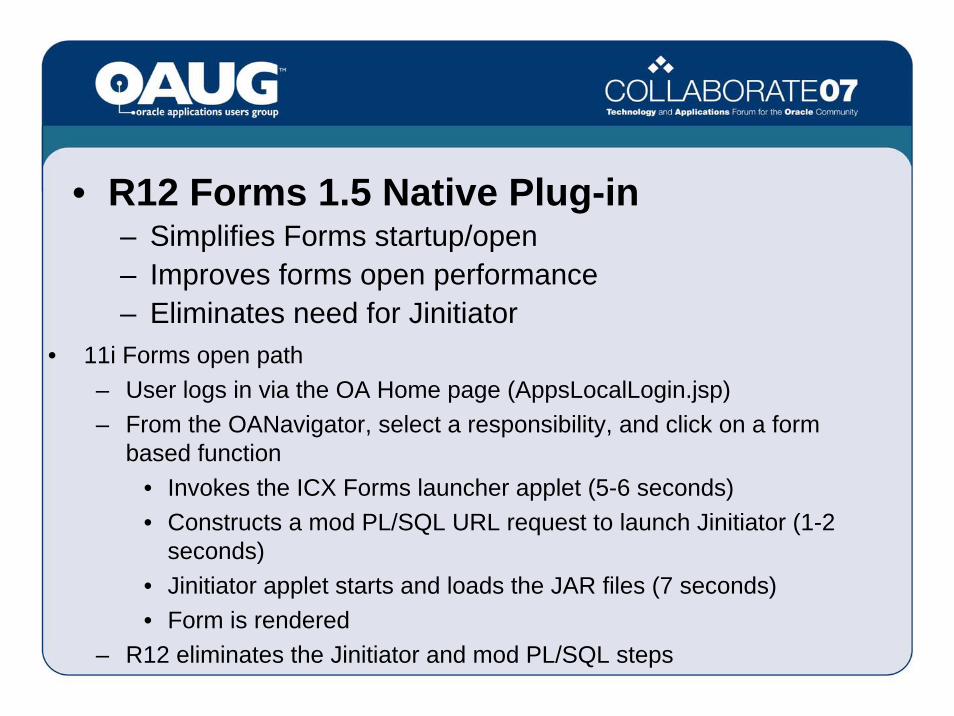
• R12 Forms 1.5 Native Plug-in– Simplifies Forms startup/open– Improves forms open performance– Eliminates need for Jinitiator
• 11i Forms open path– User logs in via the OA Home page (AppsLocalLogin.jsp)– From the OANavigator, select a responsibility, and click on a form
based function• Invokes the ICX Forms launcher applet (5-6 seconds)• Constructs a mod PL/SQL URL request to launch Jinitiator (1-2
seconds)• Jinitiator applet starts and loads the JAR files (7 seconds)• Form is rendered
– R12 eliminates the Jinitiator and mod PL/SQL steps

• R12 Application Server (AS 10.1.3)– OC4J container is used– Cold user performance is improved due to class
loading being done as part of JVM startup– Scales much better than Jserv– Better diagnostics and management screens– OC4J maintains a Java thread pool which avoids
expensive thread creation on each request– 10.1.3 also uses Java NIO which should reduce
number of threads required to service large number of requests

R12 Multi-org Performance• Eliminated 1,100 Multi-Org views
– Replaced the 11i Multi-org filter • NVL(ORG_ID,NVL(TO_NUMBER(DECODE(SUBSTRB(USERENV('CLIENT_INFO')
,1,1),'',NULL,SUBSTRB(USERENV('CLIENT_INFO'),1,10))),-99)) =NVL(TO_NUMBER(DECODE(SUBSTRB(USERENV('CLIENT_INFO'),1,1),' ,NULL,SUBSTRB(USERENV('CLIENT_INFO'),1,10))),-99)
• With a VPD policy which optimizes for the context– Single org returns the predicate
» Org_id = sys_context()– Multi-org access returns the predicate
» EXISTS (SELECT 1 FROM mo_glob_org_access_tmp oa WHERE oa.organization_id = org_id)
– Reduces shared pool cursor footprint– Execution plans and costing improve considerably– Allows customers to partition by org_id
R12 Index Reduction• Dropped ~1,100 “redundant” indexes which were no
longer needed due to 10gR2 optimizer enhancements• Improves DML performance• Reduces backup/restore/cloning times
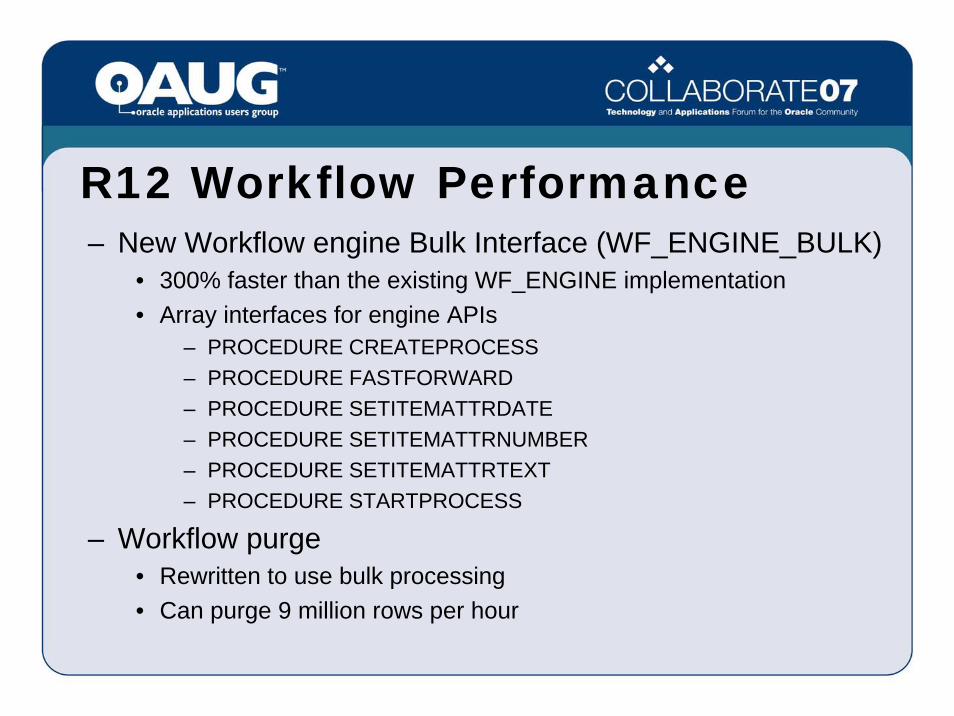
R12 Workflow Performance– New Workflow engine Bulk Interface (WF_ENGINE_BULK)
• 300% faster than the existing WF_ENGINE implementation• Array interfaces for engine APIs
– PROCEDURE CREATEPROCESS– PROCEDURE FASTFORWARD– PROCEDURE SETITEMATTRDATE– PROCEDURE SETITEMATTRNUMBER– PROCEDURE SETITEMATTRTEXT– PROCEDURE STARTPROCESS
– Workflow purge• Rewritten to use bulk processing• Can purge 9 million rows per hour

• R12 Pick Release – New Parallel Interface– New parameter “Number of Child Processes”

R12 Application Performance Improvements
• Order Management– Order creation and booking
• Pick Release• Payroll and Archiver• Quoting• Service

R12 Apps JDBC Connection Pool • Connection Leaks………gone forever!
–Leaked connections can automatically be reclaimed and closed!–Connection leak will be logged in FND_LOG_MESSAGES
»Allows a single view of all leaked connections for all JVMs»No need to monitor per JVM
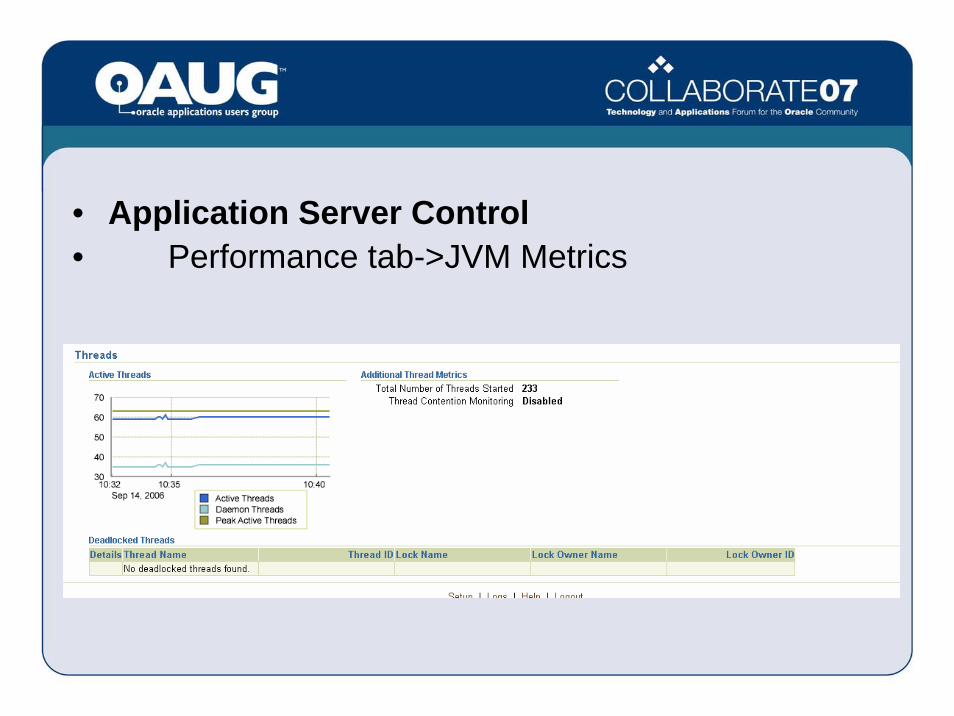
–Performance page• Monitor JVM metrics• Heap Utilization• Garbage Collections• Thread information • Thread deadlocks
R12 10g Application Server Control (ASControl)
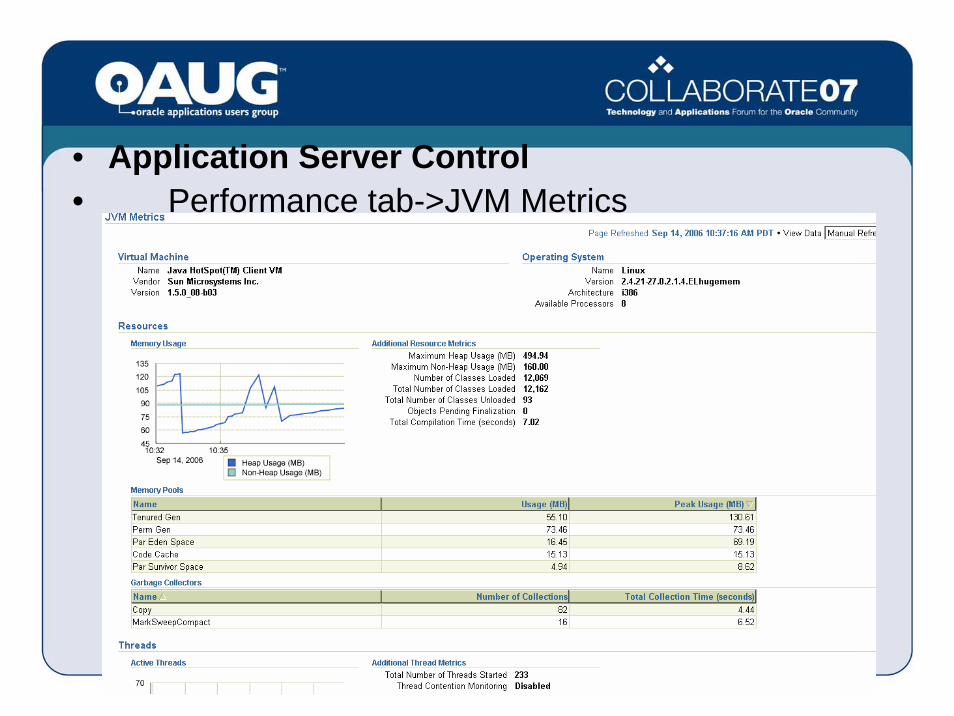
• Application Server Control• Performance tab->JVM Metrics
• Application Server Control• Performance tab->JVM Metrics

R12 Upgrade Sizing Note• Oracle Applications Release 12 Upgrade
Sizing and Best Practices– MetaLink Note 399362.1– Contains Database and Tablespace Sizing– Upgrade timings from several customer upgrades– Also includes best practices to improve upgrade
performance

Note #: Description:
125767.1 Upgrading Developer 6i with Oracle Applications 11i138159.1 Canceling Long Running Queries in Oracle Applications 11i164317.1 Upgrading Oracle JDBC Drivers with Oracle E-Business Suite 11i
306653.1 Installing and Configuring Web Cache 10.1.2 and Oracle E-Business Suite 11i
313418.1 Using Discoverer 10.1.2 with Oracle E-Business Suite 11i
216205.1 Database Initialization Parameters and Configuration for Oracle Applications 11i
244040.1 Recommended Performance Patches for Oracle E-Business Suite304099.1 Using J2SE Version 5.0 with Oracle E-Business Suite 11i, Release
11.5.10
275880.1 Oracle Applications Framework Release 11i Documentation Road Map

Questions & Answers