Embed Size (px)
Citation preview

Professor Ronald K. Hanson, Dr. Jay B. Jeffries, and Kai SunHigh Temperature Gasdynamics Laboratory, Dept. of Mechanical Engineering, Stanford University
Professor Kevin J. Whitty and Randy J. PummillInstitute for Clean and Secure Energy, The University of Utah
DoE NETL Kick-off December 16, 2009
Tunable Diode Laser Sensors to Monitor Temperature and Gas Composition
in High Temperature Coal Gasifiers
Vision for tunable diode laser (TDL) sensors Goals Challenges University of Utah sensor test bed Stanford sensor concept TDL fundamentals Prior measurements reduce risk
Proposed work plan Current status
2
Vision and Goals for TDL Sensing in IGCC
X
XCoal
Oxygen or Steam
Oxygen/CoalRatio Control
Sensor for T & SyngasComposition
3 4
Fuel/air Ratio Control1
Gasifier
ReactorCore
Quench
2SyngasCleanup Gas Turbine
X
XCoal
Oxygen or Steam
Oxygen/CoalRatio Control
Sensor for T & SyngasComposition
3 4
Fuel/air Ratio Control1
Gasifier
ReactorCore
Quench
ReactorCore
Quench
2SyngasCleanup Gas Turbine
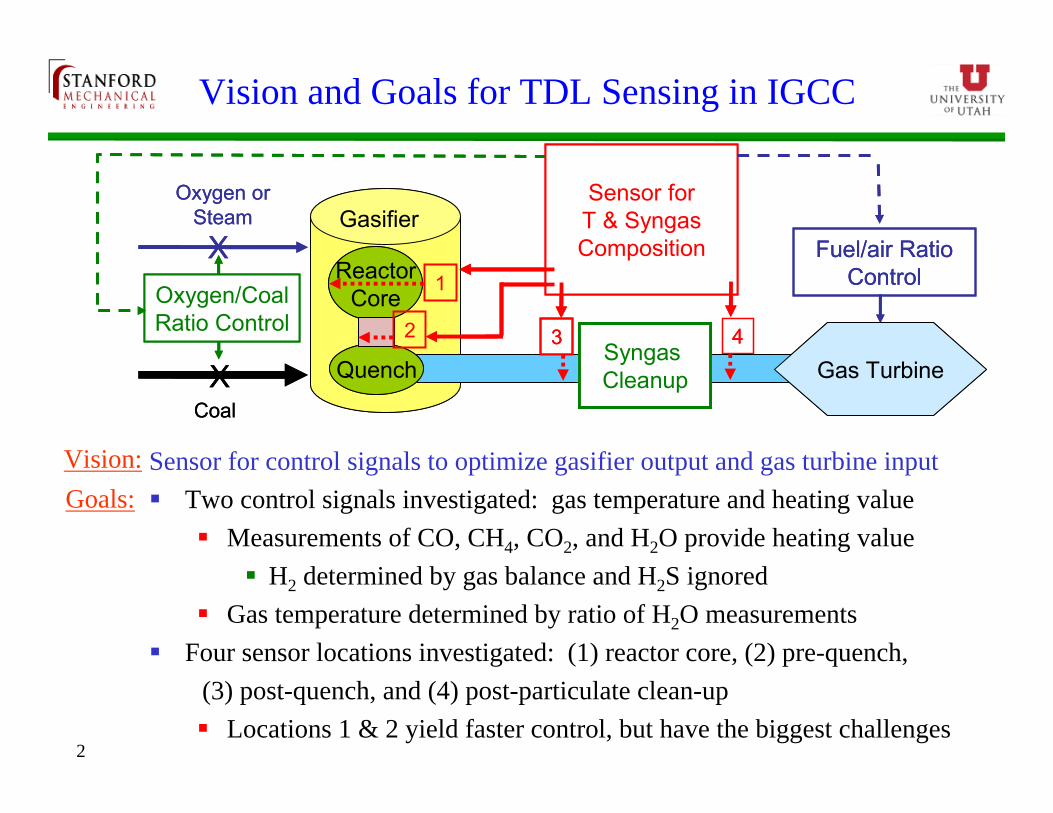
Sensor for control signals to optimize gasifier output and gas turbine input Two control signals investigated: gas temperature and heating value
Measurements of CO, CH4, CO2, and H2O provide heating value H2 determined by gas balance and H2S ignored
Gas temperature determined by ratio of H2O measurements Four sensor locations investigated: (1) reactor core, (2) pre-quench,
(3) post-quench, and (4) post-particulate clean-up Locations 1 & 2 yield faster control, but have the biggest challenges
Vision:Goals:
3
Challenges to TDL Sensing in Coal Gasification
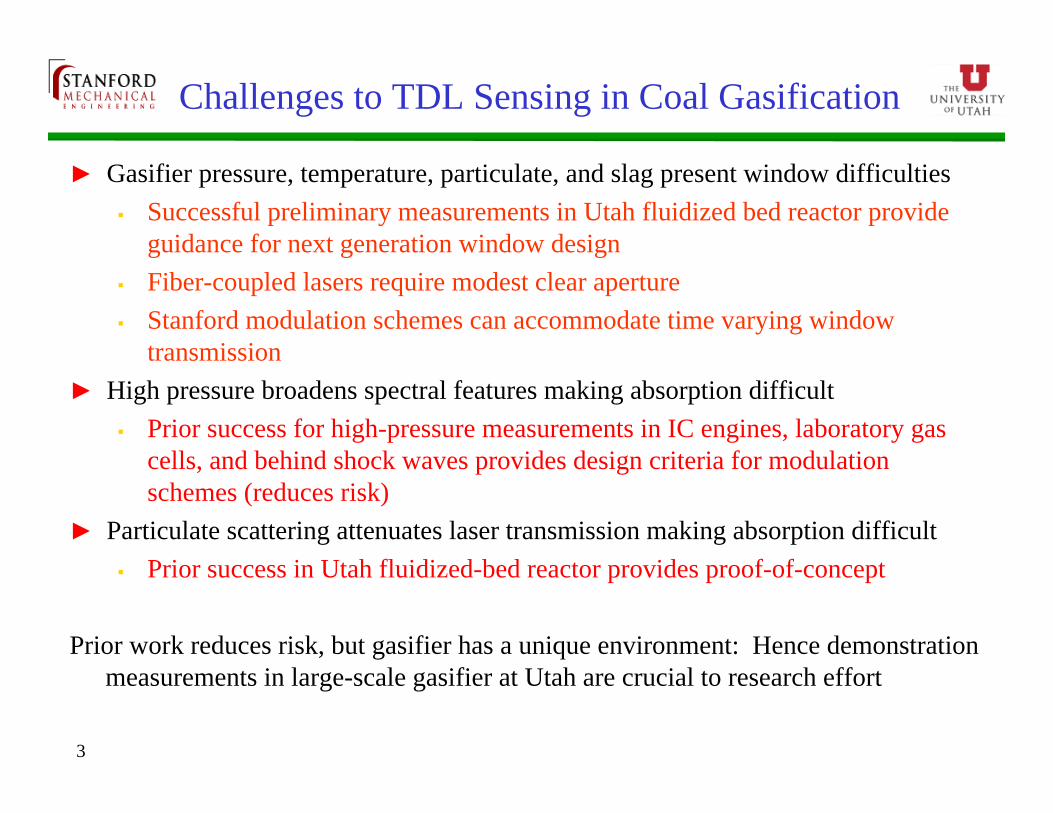
► Gasifier pressure, temperature, particulate, and slag present window difficulties Successful preliminary measurements in Utah fluidized bed reactor provide
guidance for next generation window design Fiber-coupled lasers require modest clear aperture Stanford modulation schemes can accommodate time varying window
transmission► High pressure broadens spectral features making absorption difficult
Prior success for high-pressure measurements in IC engines, laboratory gas cells, and behind shock waves provides design criteria for modulation schemes (reduces risk)
► Particulate scattering attenuates laser transmission making absorption difficult Prior success in Utah fluidized-bed reactor provides proof-of-concept
Prior work reduces risk, but gasifier has a unique environment: Hence demonstration measurements in large-scale gasifier at Utah are crucial to research effort

University of Utah Gasification Facility
PressurizedEntrained-Flow
Gasifier
PressurizedFluidized Bed
Gasifier

4
University of Utah Entrained-Flow Gasifier
Max. 450 psi Max. 3100 °F Throughput (coal)
1 ton/day 0.4 MW
Overall dimensions 17 feet tall 30 inch vessel
Reactor dimensions 8 inch ID 60 inch length
Analytical Continuous
analyzer for H2/CO/CO2/CH4
GC for 18 gases

Sensor Locations
14
3
Location 1 Reactor “core” ~2600°F / 250 psi Molten slag
Location 2 Pre-quench ~2000°F / 250 psi No slag blockage
Location 3 Post-quench ~250°F / 250 psi Possible particles
Location 4 Post filter ~200°F / 250 psi Particle-free
2
7
Stanford Has Long History of Successful TDL Measurements in Harsh Environments
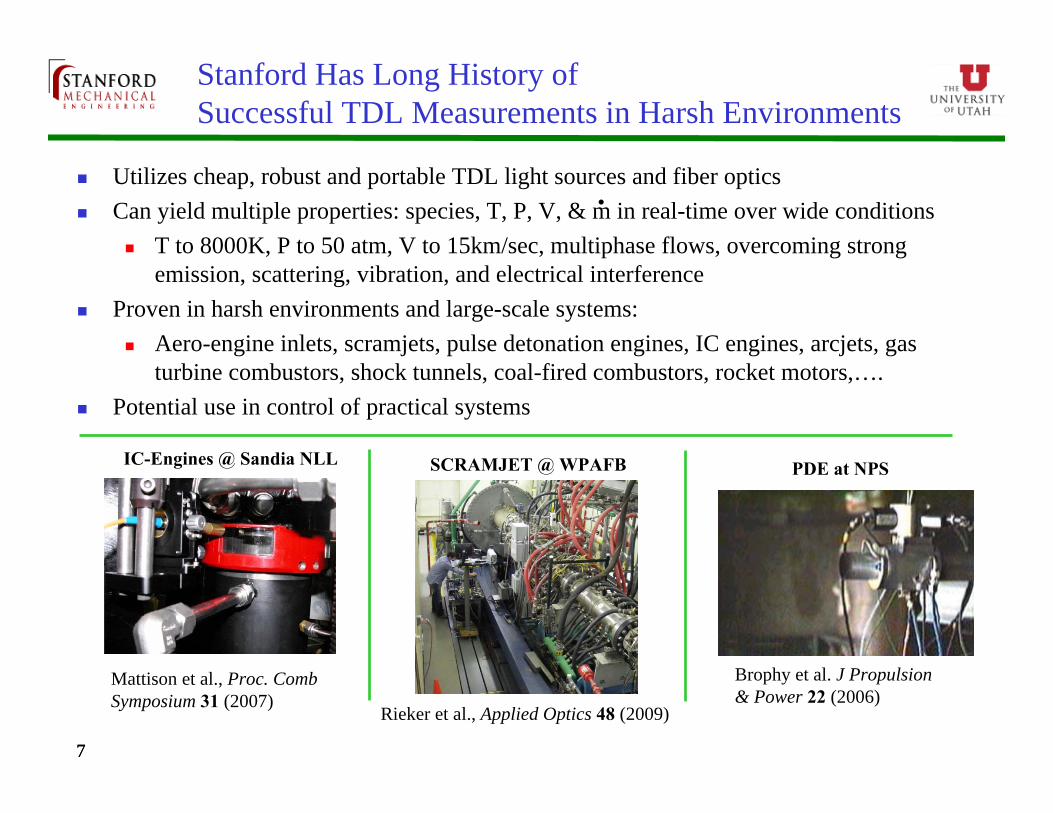
Utilizes cheap, robust and portable TDL light sources and fiber optics Can yield multiple properties: species, T, P, V, & m in real-time over wide conditions
T to 8000K, P to 50 atm, V to 15km/sec, multiphase flows, overcoming strong emission, scattering, vibration, and electrical interference
Proven in harsh environments and large-scale systems: Aero-engine inlets, scramjets, pulse detonation engines, IC engines, arcjets, gas
turbine combustors, shock tunnels, coal-fired combustors, rocket motors,…. Potential use in control of practical systems
PDE at NPS
Brophy et al. J Propulsion & Power 22 (2006)
.
Rieker et al., Applied Optics 48 (2009)
SCRAMJET @ WPAFB
7
IC-Engines @ Sandia NLL
Mattison et al., Proc. Comb Symposium 31 (2007)
888
Absorption Fundamentals: The Basics
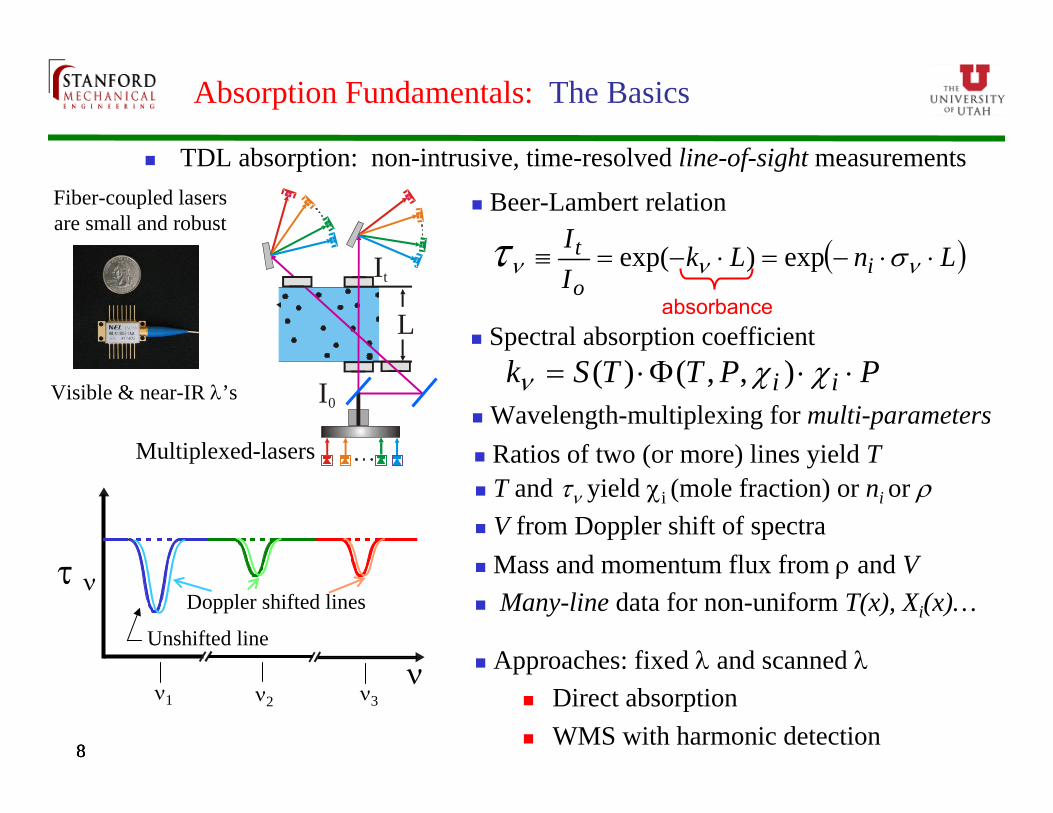
TDL absorption: non-intrusive, time-resolved line-of-sight measurements
Beer-Lambert relation
Spectral absorption coefficient
Ratios of two (or more) lines yield T T and yield i (mole fraction) or ni or V from Doppler shift of spectra Mass and momentum flux from and V Many-line data for non-uniform T(x), Xi(x)…
Approaches: fixed and scanned Direct absorption WMS with harmonic detection
LnLkII
io
t exp)exp(
PPTTSk ii ),,()( Wavelength-multiplexing for multi-parameters
absorbance
Unshifted line
1 2 3
Doppler shifted lines
Multiplexed-lasers
Fiber-coupled lasers are small and robust
Visible & near-IR ’s I0
It
L

9
Absorption Fundamentals:Direct Absorption & Wavelength Modulation Spectroscopy
WMS
Direct Absorption
Gas sample
Io It
Direct absorption: Simpler, if absorption is strong enough WMS: More sensitive (x10 or more); better noise rejection
WMS-2f signal approximates 2nd derivative of line shape at small modulation amplitude Ratio of two WMS-2f signals provides T Injection current FM produces intensity modulation @1f enables normalization
Injection current tuning
+ Injection current modulation
9
i’
i 0.4 0.5 0.6 0.7
0.00
0.25
0.50
0.75
Abs
orba
nce
W avelength (relative cm -1)
D irect absorption lineshape
0.4 0.5 0.6 0.7 0.8 0.9 1.00.0
0.1
0.2
0.3 Direct Absorption Scan
Lase
r Int
ensi
ty S
igna
l
T ime(ms)
Baselinefit
for Io
0
2
4
6
8
WMS Scan
WM
S S
igna
l
Time (ms)
-0.02
0.00
0.02
0.04
WMS-2f lineshapeNor
mal
ized
2f s
igna
l
Wavelength (relative cm-1)
Lockin@2f
0.4 0.5 0.6 0.70.4 0.5 0.6 0.7 0.8 0.9 1.0

10
Measure ambient H2O (T=296 K, 60% RH, L=29.5 cm, ~6% absorbance) Attenuate the beam by partial blocking: Normalized 2f/1f signal constant Attenuate the beam by mechanical vibration: Normalized signal constant Expect strategy to provide immunity from window fouling and particulate loading
Experiments Demonstrate WMS Normalization
0.00 0.05 0.10 0.15 0.20 0.25 0.30 0.350.00
0.03
0.06
0.09
0.12
2f/1
f Mag
nitu
de
Time (s)
0.0
0.2
0.4
0.6
1f M
agni
tude
0.00
0.02
0.04
0.06
2f/1f
1f Magnitude
2f M
agni
tude
2f Magnitude
0.0 0.1 0.2 0.3 0.4 0.5 0.6 0.70.00
0.03
0.06
0.09
0.12
2f/1
f Mag
nitu
de
Time (s)
0.0
0.2
0.4
0.6
1f M
agni
tude
0.00
0.02
0.04
0.06
2f/1f
1f Magnitude
2f M
agni
tude
2f Magnitude
1392 nm, Partially Blocking Beam 1392 nm, Vibrating Pitch Lens
Modulated TDL near 1392nm
Pitch LensDetector

11
Examples of Stanford TDL Sensing in Harsh, High-P, High-T Environments
IC-Engines Crank-angle-resolved measurements of temperature and EGR
T-sensing for HCCI research with Sandia National Labs Development of WMS-based T-sensor for production engines
Crank-angle-resolved measurements of gasoline
Fluidized-bed gasification of black liquor (funded by EPRI) TDL absorption measurements in the presence of particulate
Successful measurements with 92% beam attenuation Provides proof-of-concept for gasification application
TDL in the Utah fluidized-bed rig discussed below
12
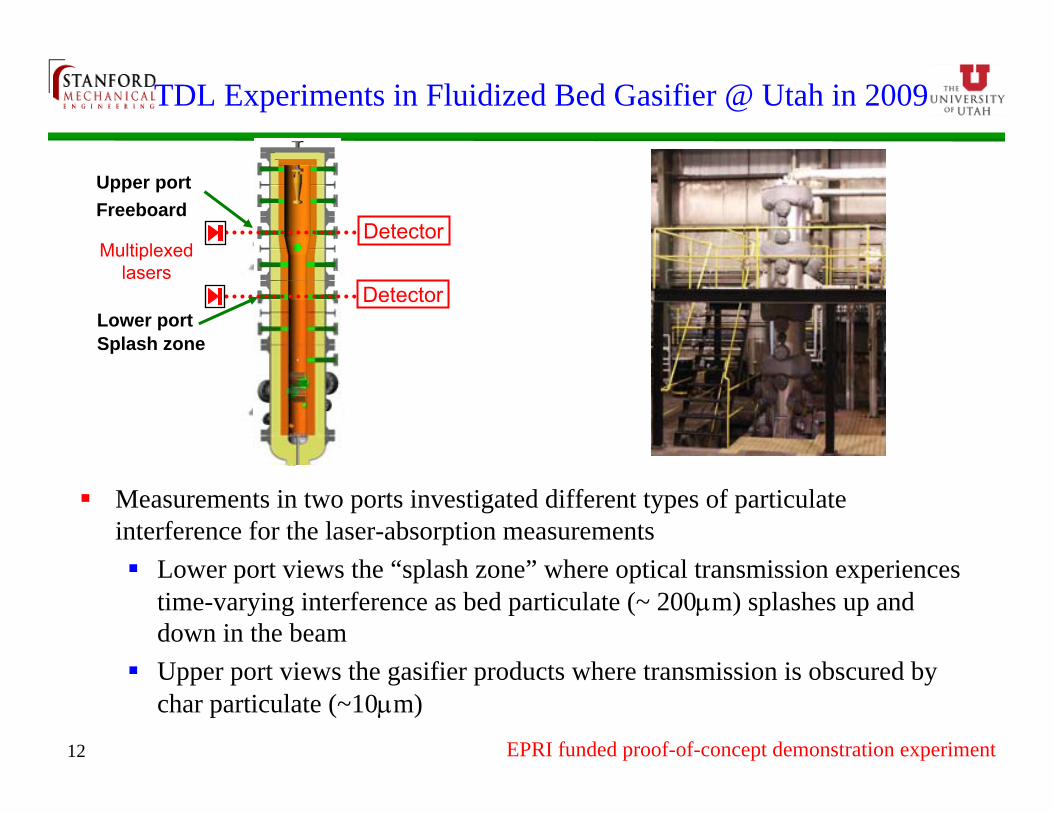
Measurements in two ports investigated different types of particulate interference for the laser-absorption measurements Lower port views the “splash zone” where optical transmission experiences
time-varying interference as bed particulate (~ 200m) splashes up and down in the beam
Upper port views the gasifier products where transmission is obscured by char particulate (~10m)
Multiplexed lasers
Upper portFreeboard
Detector
DetectorLower portSplash zone
TDL Experiments in Fluidized Bed Gasifier @ Utah in 2009
EPRI funded proof-of-concept demonstration experiment

13
Sinusoid @ f1
Sensor Concept for Fluidized-Bed Gasifier Measurements
Two-color TDL sensor for T and XH2OTest RegionIn Gasifier
DAQComputer
& Lock‐in Amplifier
Diode Lasers @ λ1, λ2 Detector
Two lasers (1 & 2) wavelength-modulated at 40 and 60 kHz respectively Signals detected @ 2f and 1f for each laser scanned at 2 kHz across H2O absorption line Normalization of 2f by the 1f signal corrects each laser for scattering losses Temperature from the ratio of 2f/1f signals @ 1 & 2 Concept tested with EPRI support in U Utah fluidized-bed gasifier
Sinusoid @ f2
EPRI funded proof-of-concept demonstration experiment

14
Fiber-coupled lasers and electronics located in the control room Transmitted light collected onto a fiber to allow remote location of detector
Two different diode laser detection strategies tested Wavelength-scanned direct absorption Normalized (1f) wavelength-modulation spectroscopy with 2f detection (WMS-2f/1f)
Optical Fibers Enable Remote Location of Lasers
Fiber launch of laser beam
Fiber collection transmitted light
Lasers and electronics
Stanford student Andrew Fahrlandin gasifier control room
Optical fiber30m long
Remote detector
Just looking at the raw signals shows potential of TDL sensing
EPRI funded proof-of-concept demonstration experiment

15
1f Normalized WMS-2f Accounts for Scattering Losses
Char particles made during gasification attenuate the transmitted signals by 92% Normalization of 2f by 1f signals recovers a quantitative WMS-2f signal Excellent SNR provides proof-of-concept for TDL sensing in highly scattering
reactor environments
Raw 2f signals
Single-scan data at 2kHz (measurement time = 0.5ms)Measurements in reactor core to test influence of char particle scattering on WMS
1f Normalized 2f signals
92% scattering lossNo scattering 92% scattering lossNo scattering
1f Normalized
EPRI funded proof-of-concept demonstration experiment

16
Time record of temperature agrees well with facility thermocouple Statistical temperature uncertainty used to characterize precision of sensor
Temperature Versus Time Without Particulate
TDL measurements on lower port without bedin nitrogen-diluted steam
Single-scan data at 2kHz(measurement time = 0.5ms)
EPRI funded proof-of-concept demonstration experiment
17
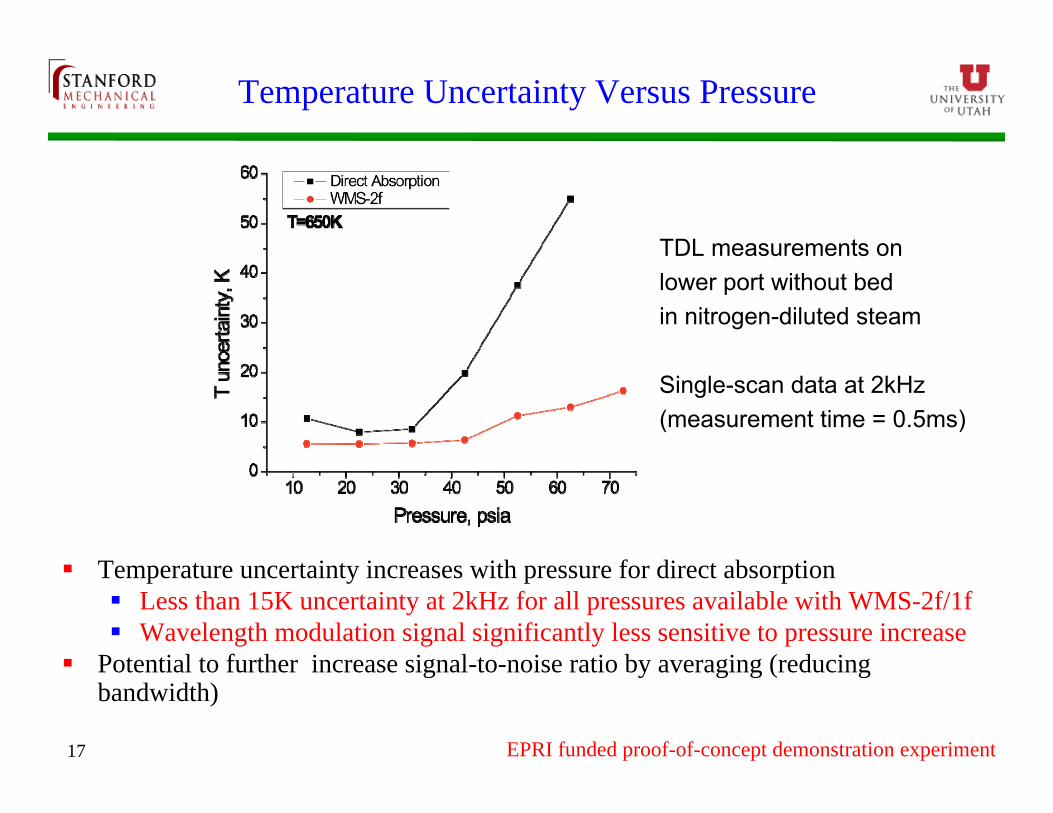
Temperature uncertainty increases with pressure for direct absorption Less than 15K uncertainty at 2kHz for all pressures available with WMS-2f/1f Wavelength modulation signal significantly less sensitive to pressure increase
Potential to further increase signal-to-noise ratio by averaging (reducing bandwidth)
Temperature Uncertainty Versus Pressure
TDL measurements on lower port without bedin nitrogen-diluted steam
Single-scan data at 2kHz(measurement time = 0.5ms)
EPRI funded proof-of-concept demonstration experiment

18
Picture/movie shows cold flow model of fluidized bed Large bed particles (200 m) are splashing in the bed of the reactor
This particulate bounces up and down through the beam, sometimes completely blocking the beam
TDL data taken in actual fluidized bed reactor and 300 seconds of data is binned by transmission for analysis of T vs transmission
Splash Zone Transmission Time-VaryingLaser Transmission vs Time in Splash Zone
EPRI funded proof-of-concept demonstration experiment

19
Temperature Uncertainty With Particulate
TDL measurements on lower port with bed fluidized by steam flow
Beam attenuated by scattering from bed particle splash
Single-scan data at 2kHz(measurement time = 0.5ms)
Splash Zone
Bed particle splash produces time-varying transmission (2kHz data rate)Wavelength modulation less sensitive to signal attenuation Signal binned by transmission, analyzed for temperature uncertainty Less than 15K uncertainty at 2kHz for >5% transmission with WMS-2f/1f Illustrates potential for WMS-2f/1f strategy for DoE gasifier measurements
EPRI funded proof-of-concept demonstration experiment

20
Proposed DoE Work Plan 2010
Design TDL sensors for H2O and CO (SU) Design and fabricate optical access for pre-quench, post-quench, clean output (Utah) Validate H2O and CO spectroscopic database (SU) Controlled environment sensor tests (SU) Field measurements at Utah with SU sensor for H2O and CO (SU & Utah) Designs to extend the TDL sensor for methane and carbon dioxide begin (SU)
2011 Validate CO2 and CH4 spectroscopic database (SU) Laboratory tests of gas composition (H2O, CO, CO2, and CH4) (SU) Optical access for the reactor core will be designed and tested (Utah) The water and temperature sensor design will be finalized (SU) Initial field measurements for gas composition (H2O, CO, CH4, CO2) (SU & Utah)
2012 Optical access to the reactor core will be completed (Utah) Sensor design will be finalized (SU) Final field measurements of gas composition (heating value) & T (SU & Utah)

21
Progress & Current Status: Sensor Design
Estimate gas composition, temperature, pressure and pathlength @ Utah Use this data to estimate relative contributions to lower heating value Use this data to simulate absorption spectra for sensor design
location 1. Reactor 2. Pre-quench 3. Post-quench 4. Output T 1500K 1200K 500K 500KP 7-18 atm 7-18 atm 7-18 atm 6-17 atm
Path Length 20 cm 34 cm 5 cm 5 cmCO 34% 34% 44% 44%CH4 1.6% 1.6% 2% 2%H2 20% 20% 26% 26%
H2S 1.3% 1.3% 1.6% 1.6%CO2 17% 17% 21% 21%H2O 26% 26% 6% 6%
22
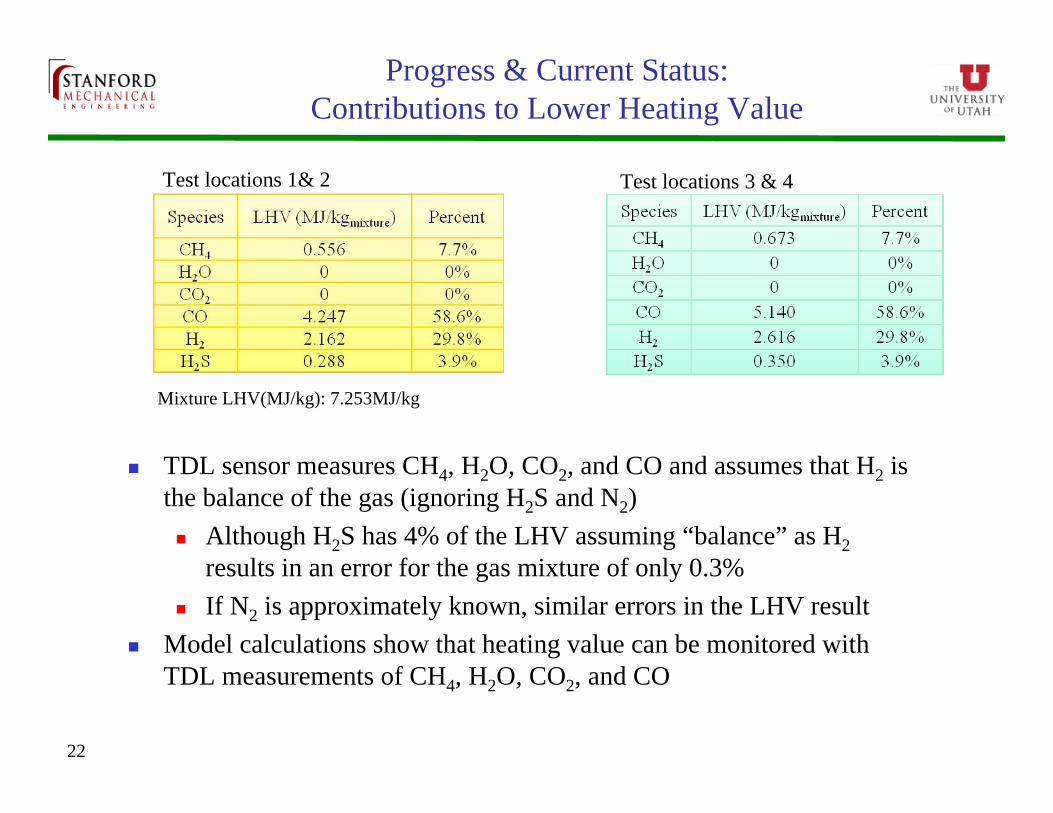
Progress & Current Status: Contributions to Lower Heating Value
TDL sensor measures CH4, H2O, CO2, and CO and assumes that H2 is the balance of the gas (ignoring H2S and N2) Although H2S has 4% of the LHV assuming “balance” as H2
results in an error for the gas mixture of only 0.3% If N2 is approximately known, similar errors in the LHV result
Model calculations show that heating value can be monitored withTDL measurements of CH4, H2O, CO2, and CO
Test locations 1& 2
Mixture LHV(MJ/kg): 7.253MJ/kg
Test locations 3 & 4
23
Progress & Current Status: Sensor Design
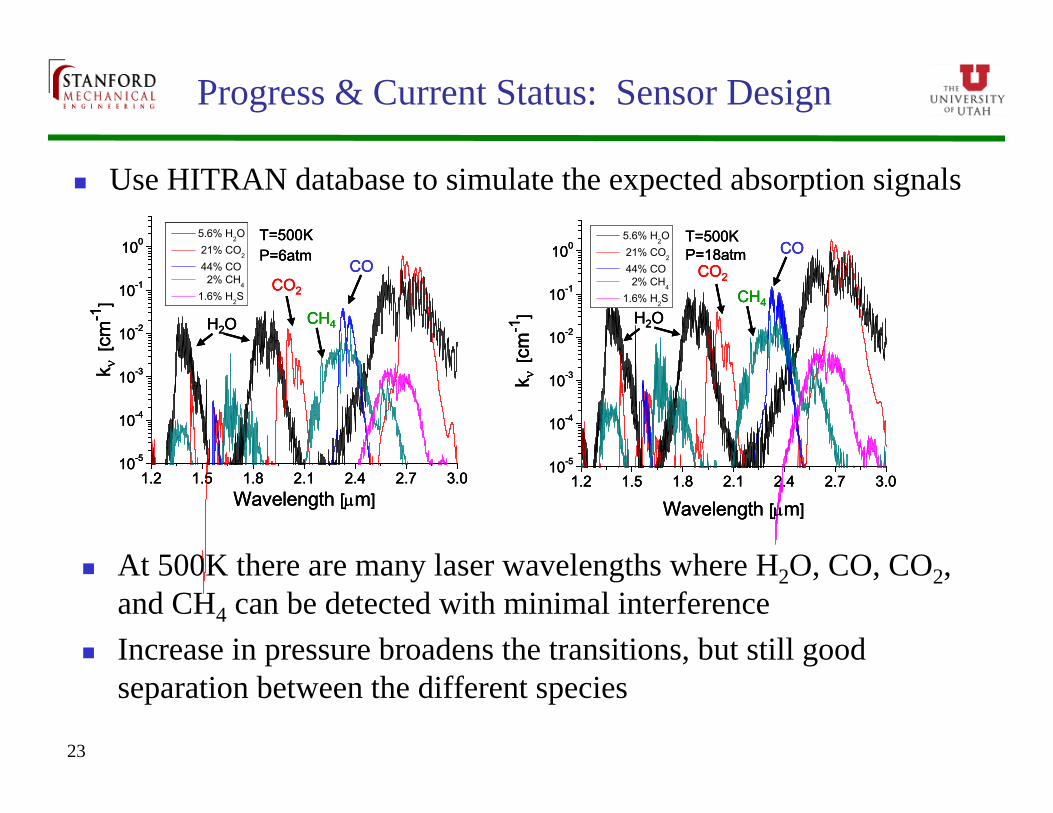
Use HITRAN database to simulate the expected absorption signals
At 500K there are many laser wavelengths where H2O, CO, CO2, and CH4 can be detected with minimal interference
Increase in pressure broadens the transitions, but still good separation between the different species
1.2 1.5 1.8 2.1 2.4 2.7 3.010-5
10-4
10-3
10-2
10-1
100 T=500KP=6atm
5.6% H2O 21% CO2
44% CO 2% CH4
1.6% H2S
k [
cm-1
]
Wavelength [m]
H2O
COCO2
CH4
1.2 1.5 1.8 2.1 2.4 2.7 3.010-5
10-4
10-3
10-2
10-1
100 5.6% H2O 21% CO2
44% CO 2% CH4
1.6% H2S
T=500KP=18atm
k [
cm-1
]Wavelength [m]
H2O
COCO2
CH4
1.2 1.5 1.8 2.1 2.4 2.7 3.010-5
10-4
10-3
10-2
10-1
100 T=500KP=6atm
5.6% H2O 21% CO2
44% CO 2% CH4
1.6% H2S
k [
cm-1
]
Wavelength [m]
H2O
COCO2
CH4
1.2 1.5 1.8 2.1 2.4 2.7 3.010-5
10-4
10-3
10-2
10-1
100 T=500KP=6atm
5.6% H2O 21% CO2
44% CO 2% CH4
1.6% H2S
k [
cm-1
]
Wavelength [m]
H2O
COCO2
CH4
1.2 1.5 1.8 2.1 2.4 2.7 3.010-5
10-4
10-3
10-2
10-1
100 5.6% H2O 21% CO2
44% CO 2% CH4
1.6% H2S
T=500KP=18atm
k [
cm-1
]Wavelength [m]
H2O
COCO2
CH4
1.2 1.5 1.8 2.1 2.4 2.7 3.010-5
10-4
10-3
10-2
10-1
100 5.6% H2O 21% CO2
44% CO 2% CH4
1.6% H2S
T=500KP=18atm
k [
cm-1
]Wavelength [m]
H2O
COCO2
CH4

24
Progress & Current Status: Sensor Design
Use HITRAN database to simulate the expected absorption signals
At 1500K, H2O and CO can be detected with minimal interference H2O in the bands near 1.4 m and the bands near 1.8 m CO in the first overtone band near 2.3 m
Selection of laser wavelength for CO2 and CH4 must carefully avoid interferences
1.2 1.5 1.8 2.1 2.410-5
10-4
10-3
10-2
10-1
100
26% H2O 17% CO2
34% CO 1.6% CH4
1.3% H2S
T=1500KP=7atm
k [
cm-1
]
Wavelength [m]
H2O CO
1.2 1.5 1.8 2.1 2.410-5
10-4
10-3
10-2
10-1
100
26% H2O 17% CO2
34% CO 1.6% CH4
1.3% H2S
T=1500KP=7atm
k [
cm-1
]
Wavelength [m]
H2O CO
1.2 1.5 1.8 2.1 2.410-5
10-4
10-3
10-2
10-1
100 26% H2O 17% CO2
34% CO 1.6% CH4
1.3% H2S
T=1500KP=18atm
k [
cm-1
]
Wavelength [m]
H2O CO
1.2 1.5 1.8 2.1 2.410-5
10-4
10-3
10-2
10-1
100 26% H2O 17% CO2
34% CO 1.6% CH4
1.3% H2S
T=1500KP=18atm
k [
cm-1
]
Wavelength [m]
H2O CO

25
Progress & Current Status: Sensor Design
Use HITRAN database to simulate the expected absorption signals
Simulations show, H2O is the major interference species There are gaps or “windows” in the H2O where CO2 and CH4
detection should be possible Careful validation of the spectroscopic database is required
(especially for H2O in the region for CO2 and CH4 detection)
2.00 2.02 2.04 2.06 2.0810-5
10-4
10-3
10-2
10-1
26% H2O 17% CO2
34% CO 1.6% CH4
1.3% H2S
T=1500KP=18atm
k [c
m-1]
Wavelength [m]
CO2
2.22 2.24 2.26 2.28 2.3010-5
10-4
10-3
10-2
10-1
26% H2O 17% CO2
34% CO 1.6% CH4
1.3% H2S
T=1500KP=18atm
k [c
m-1]
Wavelength [m]
CH4

26
Progress & Current Status: Spectroscopic Database
Laboratory measurements to validate spectral database Three-zone furnace with quartz cell for measurements to 1500K Measurements versus pressure (at low values) to determine spectral data
Current status: Lasers for H2O and CO purchased and on-hand Initial line selection for CH4 and CO2 complete
Pressure shift
Pressure broadening
0.08
0.06
0.04
0.02
0.00
Abs
orba
nce
7203.27203.07202.87202.6Frequency [cm
-1]
P=1atm, x=.02, L=10cm P=15Torr, x=1, L=1cm
vac. 0
Area Linestrength
Heated three-zone cell
vacuum vacuumtest gas
Detector

Progress & Current Status: Optical Access
Sensor locations 3 and 4 (post-quench in piping) Assessing optimum optical pathlength Either “tee” (across pipe) or along length of pipe Nitrogen purged sapphire window
Purge provides air curtain to avoid fouling Developed technology – minimum fabrication time
Sensor location 2 (pre-quench below reactor) Use existing quench spray ports (two opposing) Axially split spray lance to allow optical access in
upper half and quench spray in bottom half Optical pathlength (14” or 35.5cm) Requires fabrication and testing
Sensor location 1 (gasification reactor) Modeling work planned to assess options to keep
slag layer from blocking windows (fiber technology can minimize needed aperture)
Plan reactor modifications for opposing ports on the completion of the window design
Required for Year 3 experiments
28
Critical Milestones: TDL Measurements in Gasifier
Field measurements using Stanford sensor technology in Utah gasifier facilities
2010: Field measurements for H2O and CO concentrations 2011: Initial field measurements for gas composition (H2O, CO, CH4, CO2) 2012: Final field measurements of gas composition (heating value) & T


![FLEX FUEL GASIFIER SIMULATION MODEL [FFGSM]mypages.iit.edu/~abbasian/documents/ffgsm_user_manual.pdf · 6) Gasifier Tab: This tab opens the Gasifier Panel where the gasifier input](https://img.dokumen.tips/doc/110x75/5eb664fad746ec31aa42c957/flex-fuel-gasifier-simulation-model-ffgsm-abbasiandocumentsffgsmusermanualpdf.jpg)