Embed Size (px)
Citation preview


November 2004 2134070A-PR014Car
Tugun Bypass Environmental Impact Statement
Technical Paper Number 3 Traffic and Transport
Tugun Bypass Alliance
Parsons Brinckerhoff 348 Edward Street Brisbane Qld 4000 GPO Box 2907 Brisbane Qld 4001 Australia
Telephone: + 61 7 3218 2222 Facsimile: + 61 7 3831 4223 E-mail: [email protected]
ABN 84 797 323 433 NCSI Certified Quality System to ISO9001
Parsons Brinckerhoff Australia Pty Limited ACN 078 004 798 and Parsons Brinckerhoff International (Australia) Pty Limited ACN 006 475 056 trading as Parsons Brinckerhoff ABN 84 797 323 433
Queensland Department of 36-38 Cotton Street Main Roads – South Coast Nerang Qld 4211
Hinterland District PO Box 442
Nerang Qld 4211 Australia
Telephone: + 61 7 5583 8111 Facsimile: + 61 7 5583 8100
E-mail: [email protected]

Tugun Bypass Environmental Impact Statement Technical Paper Number 3
Traffic and Transport
Queensland Department of Main Roads i
Contents
Page Number
Glossary I
Part A: Overview and Background 1-1
1. Introduction 1-1
1.1 Summary of the Technical Paper 1-11.1.1 Background 1-11.1.2 The Need for the Tugun Bypass 1-11.1.3 The Need for the Rail Extension from Robina to Gold Coast Airport 1-31.1.4 Impacts 1-31.1.5 Conclusion 1-4
1.2 Reporting of Study Findings in the EIS 1-4
2. Background 2-1
2.1 Approach to Traffic Forecasting 2-12.1.1 Background 2-12.1.2 Model Validation 2-22.1.3 Re-validation of the Southern Gold Coast/Tweed Heads Area 2-32.1.4 Validation to Travel Times 2-32.1.5 Appropriateness of the Model for the Tugun Bypass Assessment 2-42.1.6 Model Limitations 2-42.1.7 Induced Travel Demand 2-4
2.2 Transport System Characteristics 2-82.2.1 Population and Employment 2-82.2.2 Travel Patterns 2-112.2.3 Road and Public Transport System 2-14
2.3 Regional Planning 2-142.3.1 South East Queensland Regional Framework for Growth Management 2-142.3.2 Integrated Regional Transport Plan for South East Queensland 2-162.3.3 Transport 2007 – An Action Plan for South East Queensland 2-162.3.4 Gold Coast City Transport Plan 2-172.3.5 Action for Transport 2010 2-172.3.6 Lower Tweed River Transportation Study 2-172.3.7 South-East Queensland Freight Study 2-19
2.4 Corridor Planning 2-192.4.1 Southern Gold Coast Tweed Corridor Study 2-192.4.2 Rail Stations at Tugun and Gold Coast Airport Sites Review 2-232.4.3 Pacific Highway at Tugun Route Selection Report 2-23
2.5 Local Transport Planning 2-232.5.1 Local Travel Patterns 2-232.5.2 Cobaki Lakes Development 2-232.5.3 Gold Coast Airport Master Plan 2-252.5.4 Coolangatta Enterprise Area 2-25
2.6 Cycling Policy and Planning 2-252.6.1 Relevant Cycling Policy and Plans 2-252.6.2 Queensland State Cycling Policies, Plans and Legislation 2-272.6.3 NSW State Cycling Policies and Plans 2-272.6.4 Local Government Policy and Planning 2-282.6.5 Bicycle Access on the Pacific Motorway 2-28
Part B: Need Assessment – Tugun Bypass 2-1
3. Scope and Approach 3-1

Tugun Bypass Environmental Impact Statement Technical Paper Number 3 Traffic and Transport
Contents (continued) Page Number
ii
3.1 General 3-13.2 Project Description and Assessment Assumptions 3-1
4. Need Assessment 4-1
4.1 Strategic Need 4-14.1.1 South East Queensland Regional Framework for Growth Management 4-14.1.2 Achieving the Objectives of the Integrated Regional Transport Plan for South East Queensland 4-24.1.3 Gold Coast City Transport Plan 4-7
4.2 Resolving Traffic Issues 4-114.2.1 Resolving Functional Issues 4-114.2.2 Traffic Volumes 4-134.2.3 Traffic Congestion: Road Links 4-134.2.4 Traffic Congestion at Intersections 4-184.2.5 Improved Travel Times and Reduced Travel Distances 4-204.2.6 Reducing Crash Impacts 4-214.2.7 Improving the Reliability of Access to Gold Coast Airport 4-23
4.3 Public Transport Improvements 4-234.3.1 Better Access to Public Transport 4-234.3.2 Public Transport Opportunities Created 4-23
4.4 Improving Conditions for Cyclists and Pedestrians 4-244.4.1 Cycling Network 4-244.4.2 Cyclist Mode Share 4-244.4.3 Cyclist Volumes 4-264.4.4 Crashes Involving Cyclists 4-264.4.5 Improving Cycling Conditions 4-27
4.5 Improving Walking Conditions 4-274.5.1 Walking Network 4-274.5.2 Walking Mode Share 4-274.5.3 Observed Walking Activity 4-284.5.4 Improving Walking Conditions 4-28
4.6 Improving Road Freight Movement and Reducing Heavy Vehicle Impacts 4-294.6.1 Road Freight Efficiency Benefits 4-294.6.2 Reduced Heavy Vehicle Impacts 4-29
4.7 Implications of Failing to Construct the Tugun Bypass 4-294.8 Summary of Need for the Tugun Bypass 4-29
Part C: Need Assessment – Rail Extension from Robina to Gold Coast Airport 4-1
5. Robina to Gold Coast Airport Rail Extension 5-1
5.1 Overview 5-15.2 Robina to Tugun Rail Impact Assessment Study 5-1
Part D: Traffic Design and Impact Assessment 5-1
6. Scope and Approach 6-1
6.1 Traffic Design 6-16.2 Operational Period Transport Impacts 6-16.3 Traffic Impacts During Construction 6-2
7. Traffic Design 7-1
7.1 Assessment Process 7-17.2 Traffic Volumes 7-27.3 Stewart Road Interchange 7-2

Tugun Bypass Environmental Impact Statement Technical Paper Number 3
Traffic and Transport
Queensland Department of Main Roads iii
7.4 Tweed Heads Bypass Interchange 7-37.5 Kennedy Drive Interchange 7-57.6 Level of Service Analysis 7-6
7.6.1 Methodology 7-67.6.2 Tugun Bypass Analysis 7-77.6.3 Ramp Analysis 7-77.6.4 Results 7-7
7.7 High Occupancy Vehicle Lanes 7-8
8. Operational Period Transport Impacts 8-1
8.1 Road Network Impacts 8-18.1.1 Year 2007 8-38.1.2 Year 2017 8-48.1.3 Property Access 8-6
8.2 Road Freight 8-68.3 Emergency Vehicles 8-78.4 Public Transport 8-78.5 Cyclists and Pedestrians 8-10
8.5.1 Proposed Bicycle and Pedestrian Facilities 8-108.5.2 Future Opportunities 8-118.5.3 Assessment of Potential Impacts 8-12
8.6 Pedestrians 8-128.7 Summary of Traffic Impacts and Mitigation Measures 8-12
9. Traffic Impacts During Construction 9-1
9.1 Construction Traffic Volumes 9-19.2 Construction Vehicle Impacts 9-1
9.2.1 Haul Routes 9-19.2.2 Construction Personnel Access 9-2
9.3 Traffic Management 9-29.3.1 General 9-29.3.2 Stewart Road 9-39.3.3 Tweed Heads Bypass 9-3
10. Conclusions 10-1
10.1 Need 10-110.2 Design Considerations 10-210.3 Impact Assessment 10-2
References
Tugun Bypass Environmental Impact Statement Technical Paper Number 3 Traffic and Transport
Contents (continued) Page Number
iv
List of TablesTable 2.1: Gold Coast EMME/2 Model Assignment Results, Year 2000, Terranora Creek 2-3Table 2.2: Updated Gold Coast EMME/2 Model Assignment Results, Year 2000, Terranora
Creek 2-3Table 2.3: Current Daily Trip Origins to Destination Volumes 2-12Table 2.4: Actual AADT Recorded on the Gold Coast Highway South of Kitchener Street 2-12Table 4.1: Strategic Transport Opportunities Relevant to the Proposed Tugun Bypass 4-5Table 4.2: SIDRA Outputs – No Tugun Bypass, Gold Coast Highway Route 4-19Table 4.3: Forecast Changes in Road Network Performance, 2007 4-20Table 4.4: Forecast Changes in Road Network Performance, 2017 4-20Table 7.1: Stewart Road Interchange 2017 AM Peak Hour Analysis 7-2Table 7.2: Stewart Road Interchange 2017 PM Peak Hour Analysis 7-2Table 7.3: Stewart Road Interchange 2027 AM Peak Hour Analysis 7-3Table 7.4: Stewart Road Interchange 2027 PM Peak Hour Analysis 7-3Table 7.5: Tweed Heads Bypass Interchange 2017 AM Peak Hour Analysis 7-4Table 7.6: Tweed Heads Bypass Interchange 2017 PM Peak Hour Analysis 7-4Table 7.7: Tweed Heads Bypass Interchange 2027 AM Peak Hour Analysis 7-4Table 7.8: Tweed Heads Bypass Interchange 2027 PM Peak Hour Analysis 7-4Table 7.9: Kennedy Drive Interchange 2017 AM Peak Hour Analysis 7-5Table 7.10: Kennedy Drive Interchange 2017 PM Peak Hour Analysis 7-5Table 7.11: Kennedy Drive Interchange 2027 AM Peak Hour Analysis 7-6Table 7.12: Kennedy Drive Interchange 2027 PM Peak Hour Analysis 7-6Table 8.1: 2007 AM Peak – Comparison of Traffic Conditions With and Without the Tugun
Bypass 8-3Table 8.2: 2007 PM Peak – Comparison of Traffic Conditions With and Without the Tugun
Bypass 8-4Table 8.3: 2017 AM Peak – Comparison of Traffic Conditions With and Without the Tugun
Bypass 8-5Table 8.4: 2017 PM Peak – Comparison of Traffic Conditions With and Without the Tugun
Bypass 8-5Table 8.5: Travel Times between Stewart Road and Kennedy Drive (via the Gold Coast
Highway) 8-7

Tugun Bypass Environmental Impact Statement Technical Paper Number 3
Traffic and Transport
Queensland Department of Main Roads v
List of Figures Figure 1.1: Proposed Tugun Bypass 1-2Figure 2.1: Population Density 2000 Forecast 2-9Figure 2.2: Population Density 2011 Forecast 2-9Figure 2.3: Employment Density 2000 Forecast 2-10Figure 2.4: Employment Density 2011 Forecast 2-10Figure 2.5: Year 2002 and 2017 Daily Traffic Volumes 2-13Figure 2.6: Year 2002 Road and Public Transport System 2-15Figure 2.7: Proposed New Roads in Tweed Shire 2-18Figure 2.8: Southern Gold Coast Tweed Corridor Study – Tugun Road Alignment Options 2-21Figure 2.9: Southern Gold Coast Tweed Corridor Study – Tugun Rail Alignment Options 2-22Figure 2.10: Local Area Travel Patterns 2002 2-24Figure 2.11: Location of Cobaki Lakes Development and Other Potential Developments 2-26Figure 4.1: Integrated Regional Transport Plan Gold Coast Strategic Transport
Opportunities 4-6Figure 4.2: Gold Coast City Transport Plan Strategic Projects 4-10Figure 4.3: Functional Conflicts on the Gold Coast Highway 4-12Figure 4.4: Year 2007 Daily Traffic Volumes 4-14Figure 4.5: Year 2017 Daily Traffic Volumes 4-15Figure 4.6: Year 2007 Maximum Peak Hour Volume/Capacity Ratios 4-16Figure 4.7: Year 2017 Maximum Peak Hour Volume/Capacity Ratios 4-17Figure 4.8: Cycle Routes in the Tugun/Coolangatta Area 4-25Figure 4.9: Two-Way Cyclist 15 Minute Volumes at the Tweed Heads Bypass,
Coolangatta 4-26Figure 8.1: Locality Map 8-2Figure 8.2: Existing Emergency Services 8-8Figure 8.3: Potential Bus Route Alterations 8-9Figure 8.4: Bridge Cross-Section 8-11
List of Appendices Appendix A Traffic Volumes Appendix B SIDRA Output – Stewart Road Interchange Appendix C SIDRA Output – Tweed Heads Bypass Interchange Appendix D SIDRA Output – Kennedy Drive Interchange Appendix E Level of Service Analysis

Tugun Bypass Environmental Impact Statement Technical Paper Number 3
Traffic and Transport
Queensland Department of Main Roads I
Glossary
Term Meaning
Annual average daily traffic (AADT)
Annual average daily traffic volume representing the total traffic in both directions at each location, calculated from mechanically obtained axle counts.
Average daily traffic Average daily weekday traffic based on survey counts and not adjusted as for AADT.
LOS Level of Service. A qualitative measure describing operational conditions within a traffic stream and their perceptions by motorists and/or passengers.
Local road A road or street used primarily for access to abutting properties.
Mode share The proportion of use of each main travel mode.
Public transport mode A mode of transport for carrying large numbers of the public, such as bus or train.
SIDRA Signalised and Unsignalised Intersection Design and Research Aid (ARRB Transport Research Ltd 1996).
Travel demand The number of potential trips generated by the population in a specific area for all purposes. This can be further divided into the type of trip (for example, work, recreation, commercial) and mode (for example, private car, public transport).
V/C Volume/capacity ratio – The ratio of the volume of traffic travelling on a mid block section of road in a specific period to the capacity of that mid block section during that period.

Tugun Bypass Environmental Impact Statement Technical Paper Number 3
Traffic and Transport
Queensland Department of Main Roads 1-1
Part A: Overview and Background

Tugun Bypass Environmental Impact Statement Technical Paper Number 3
Traffic and Transport
Queensland Department of Main Roads 1-1
1. Introduction
1.1 Summary of the Technical Paper
1.1.1 Background
Transport planning in the study area for the proposed Tugun transport corridor is guided by a number of local, regional and state planning and policy documents.
The South East Queensland Regional Framework for Growth Management (SEQ 2001 Project 2000) is a regional planning strategy aimed at improving the functioning of existing and future transport networks and facilities in Queensland’s most populated and fastest growing region. The Integrated Regional Transport Plan for South East Queensland (Queensland Transport 1997a), Transport 2007 (Queensland Transport 2001c) and the Gold Coast City Transport Plan (Gold Coast City Council 1998) set out strategies to plan for transport improvements within the city. These include a bypass of the Tugun area and an extension of the rail line from Robina to Gold Coast Airport.
The Integrated Regional Transport Plan for South East Queensland aims to integrate planning for public transport, freight and general vehicular traffic in order to balance future needs. A key issue for the region is resolving the need for new or upgraded major roads to connect major urban development corridors. In the past, new roads have been required to relieve congestion, however, it is evident that investigation into new road opportunities must be undertaken within a broader context.
1.1.2 The Need for the Tugun Bypass
It is important to provide local connections to avoid local traffic using the inter-urban road network. Widening existing roads that pass through commercial areas can bring local traffic, through traffic and pedestrians into conflict and in these cases, new roads may provide a better solution.
The Gold Coast Highway, between the Pacific Motorway and Tweed Heads Bypass, is a four-lane, median divided road. In addition to through-traffic movements between the Pacific Motorway and Tweed Heads Bypass, this section of road caters for local cross movements from residences to local activities along the coastline as well as for local trips to Coolangatta.
The growth of the southern Gold Coast area and increasing interstate through traffic volumes has exacerbated traffic conflicts on the Gold Coast Highway, which is essentially only an urban arterial road. Widening the road would only make local traffic access more difficult and increase the volume of conflict between local and through traffic.
The proposed Tugun Bypass would extend from Stewart Road, Currumbin to Kennedy Drive, Tweed Heads. The bypass would provide the 'missing link' in a motorway standard inter-state highway between Queensland and NSW. It would enable the separation of through and local movement functions, which would improve both the safety and efficiency of traffic movements within the corridor. The proposed Tugun Bypass alignment is shown in Figure 1.1.
The proposed Tugun Bypass would reduce traffic volumes on the Gold Coast Highway. Approximately 55 percent of traffic through the corridor is estimated to

Figure 1.1������������� �������
���
��
Proposed Tugun BypassGold Coast Airport BoundaryQueensland/NSW BorderProposed Access BridgesTunnel
�
���������������������������
������������������������������������������
������������������������������
������������
������������������������������������������������
��� ��� ��� ��� ���� ���� �
��� ��� ��� ��� �������� �������� �����
���� ����� ����� �
������������
������������
������������
���
���
����
�
���
���
����
�
���
���
����
�
���������
�������
�
���������
�������
�
���������
�������
�
���
�������
���
���
�������
���
���
�������
���
����� ����������� ����������� ������
������������������
�� �
��� �
�� �
��� �
�� �
��� �
������������
������������
������������
������ �
������ �
������ �
���!�������
���!�������
���!�������
!����
����
�!�
��� ��
���
!����
����
�
����� ����������� ����������� ������
��"�#�"������!����"�#�"������!����"�#�"������!��
!�� !�� !�� ������������
"� � �"� � �"� � �
������������
!�� ��������!�� ��������!�� ��������
�������������$!��
�������������$!��
�������������$!��
!�������
�
!�������
�
!�������
�
����� ��
���
����� ��
���
����� ��
���
��#� �������#� �������#� �����
� ������
� ������
� ������ ����������
����������
����������
!�����������
!�����������
!�����������
!�����!�����!����� ������������
���������������������������������
������
������
������
������
������
������
��$
��$
��$
%��%��%��
��������!�
�����
���������!�
�����
���������!�
�����
�
!� ����
����
!� ����
����
!� ����
����
!����
���
���
!����
���
���
!����
���
���
&� ����
�&�
����
�&�
����
�
����� ���������� ���������� �����
%��%��%��
'��������(���'��������(���'��������(���
������������ ������������
!��������������
!��������������
!��������������
)� �)� �)� ��� �� ��
���������������
������������
���������������
������������
���������

Tugun Bypass Environmental Impact Statement Technical Paper Number 3
Traffic and Transport
Queensland Department of Main Roads 1-3
divert to the proposed Tugun Bypass in 2007. The same proportion of traffic in the corridor is estimated to use the bypass in 2017.
A reduction in traffic along the Gold Coast Highway would in turn, facilitate improved accessibility for residents and businesses adjacent to the highway. This would also improve the quality and reliability of access to the Gold Coast Airport.
A consequent reduction in traffic on the Gold Coast Highway due to the proposed Tugun Bypass would also allow for the corridor space on the Gold Coast Highway to be used for dedicated public transport facilities such as bus lanes or light rail. If the Gold Coast Highway had to be widened to six lanes in the absence of the proposed Tugun Bypass, opportunities for the preservation of a dedicated public transport corridor would be reduced.
Without the proposed Tugun Bypass, peak hour travel times through the Tugun—Bilinga corridor are expected to increase significantly by 2017 with the corridor being heavily congested for many hours of the day. The increased travel times would also have a significant effect on the reliability and efficiency of freight movement through the corridor.
The safety of the corridor is likely to diminish if the number and severity of crashes continued to rise. The safety and accessibility of pedestrians and cyclists along and across the Gold Coast Highway would also continue to decline.
1.1.3 The Need for the Rail Extension from Robina to Gold Coast Airport
The proposed heavy (passenger) rail extension from Robina to the Gold Coast Airport would be located adjacent to the Pacific Motorway for the majority of the route. Stations are proposed at Reedy Creek, Andrews, Elanora, Tugun and Gold Coast Airport. Part A of the Impact Assessment Study for the rail extension from Robina Station to north of Stewart Road has been released for public comment. Part B may be released in the future.
The preservation of a corridor for heavy (passenger) rail from Robina to the terminus of the Gold Coast Airport would assist in improving public transport on the Gold Coast and assist in achieving the identified public transport mode share targets set out in the Integrated Regional Transport Plan for South East Queensland and Gold Coast City Transport Plan.
The preservation of a corridor would enable future development adjacent to the corridor to continue, while not preventing the future planning and construction of the rail extension through this area.
1.1.4 Impacts
Construction of the proposed Tugun Bypass is likely to disrupt local traffic movements during works at Stewart Road, Tweed Heads Bypass and Kennedy Drive. Traffic volumes would also increase on these roads designated as haulage routes for construction vehicles.
Once constructed, the proposed Tugun Bypass would result in changes in traffic patterns and traffic volumes on roads in and connecting to the study area.

Tugun Bypass Environmental Impact Statement Technical Paper Number 3 Traffic and Transport
1-4
1.1.5 Conclusion
The proposed Tugun Bypass would improve the travel time and safety for vehicles travelling through the corridor. It would also result in the removal of the majority of freight movements from the existing Gold Coast Highway. This would enable the Gold Coast Highway to successfully perform its local access and distribution functions with improved conditions for all road users, including pedestrians and cyclists. It would also improve the overall amenity of the coastal area along the Gold Coast Highway by the shift in through traffic to the proposed bypass.
The preservation of a corridor for heavy (passenger) rail from Robina to the Gold Coast Airport would assist in improving public transport on the Gold Coast.
The proposed Tugun transport corridor would create an overall improvement in traffic conditions in the southern Gold Coast/Tweed Heads area. This would assist in achieving the primary aim of the Integrated Regional Transport Plan for South East Queensland, which is to balance the future needs of this corridor through integrated planning.
1.2 Reporting of Study Findings in the EIS
The studies for the Tugun Bypass environmental impact assessment commenced in 2000. In the subsequent four years the results of the various studies have been used to refine the concept design of the proposal. Further studies were also commissioned to ensure that all aspects of the various environmental issues were fully understood.
The long time period of the assessment has meant that the content of some of the earlier reports has been superseded by newer work. Changes to the design of the bypass have also been introduced to take account of these studies.
In the event that there is a contradiction between the technical papers and the text of the EIS, the EIS takes precedence as it reports the current understanding of issues, impacts and the concept design.

Tugun Bypass Environmental Impact Statement Technical Paper Number 3
Traffic and Transport
Queensland Department of Main Roads 2-1
2. Background
2.1 Approach to Traffic Forecasting
2.1.1 Background
Traffic forecasting has been based on Gold Coast City Council's strategic EMME/2 traffic model (Gold Coast City Council 1997). The study area for the model also included the northern Tweed Heads area. Its use for the Tugun Bypass Environment Impact Statement (EIS) provides consistency with medium- and longer-term traffic forecasting for this part of south-east Queensland and northern NSW.
A further update of the Gold Coast EMME/2 model was undertaken during 2001/2002 (Gold Coast City Council 2002). The review and update of the EMME/2 model included the following key elements:
the model zoning system was extended north of Beenleigh to include Brisbane City, Logan City and Redland Shire;
the number of trip purposes in the previous model was considered too great and these were reduced to improve the regression of the trip generation coefficients;
the current and future year demographics for the EMME/2 model were also updated from the original Gold Coast EMME/2 model demographics, South East Queensland Small Area Demographics Study (SEQSADS), Gold Coast City Council Infrastructure Charges Plan (ICP) demographics, Tweed Shire Council demographics, Brisbane Strategic Transport Model demographics, Population Trends and Prospects for Queensland, 2001 Edition (Planning and Information Forecasting Unit, Department of Local Government and Planning);
the trip generation equations were revised in accordance with the revised trip purposes used in the model;
the trip assignment procedure was revised from a ‘travel time’ to a ‘generalised cost’ assignment;
validation of the 2000 base year model on 24 hour screenline volumes; and
production of future year models for 2011 and 2021.
Full details of the model development are included in the following reports: Gold Coast EMME/2 Model – Technical Report (Gold Coast City Council 1997) and Gold Coast EMME/2 Model Update – Technical Report (Gold Coast City Council 2002).
The updated Gold Coast EMME/2 model was used as the basis for the traffic forecasting for the Tugun Bypass. As identified above, the latest model included the latest demographic forecasts, expected future road network enhancements and allowance for likely future public transport mode share. The model included a base year of 2000 and forecast years of 2011 and 2021.
The base model was updated by PPK (now Parsons Brinckerhoff) in August 2002. The model update included the future layout and connections associated with the proposed Tugun Bypass, recalibration of key coastal routes to allow for scenic benefit for route choice and inclusion of the influence of the proposed future Cobaki Lakes development.
Tugun Bypass Environmental Impact Statement Technical Paper Number 3 Traffic and Transport
2-2
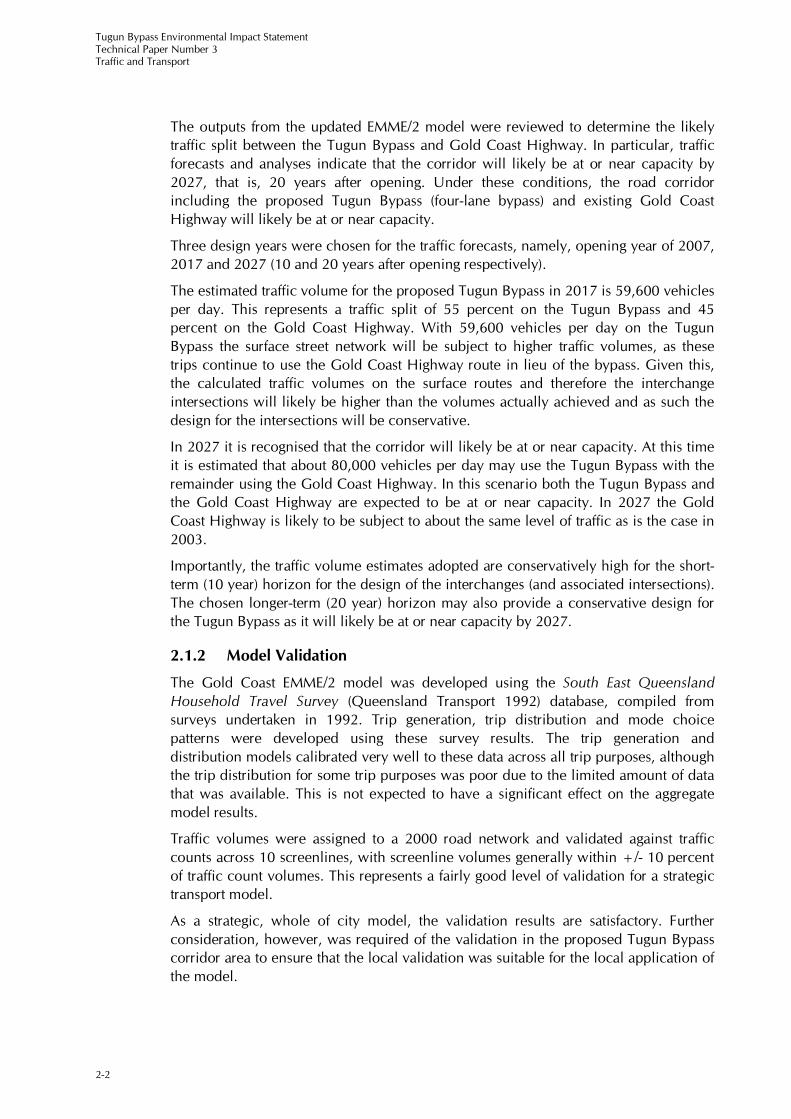
The outputs from the updated EMME/2 model were reviewed to determine the likely traffic split between the Tugun Bypass and Gold Coast Highway. In particular, traffic forecasts and analyses indicate that the corridor will likely be at or near capacity by 2027, that is, 20 years after opening. Under these conditions, the road corridor including the proposed Tugun Bypass (four-lane bypass) and existing Gold Coast Highway will likely be at or near capacity.
Three design years were chosen for the traffic forecasts, namely, opening year of 2007, 2017 and 2027 (10 and 20 years after opening respectively).
The estimated traffic volume for the proposed Tugun Bypass in 2017 is 59,600 vehicles per day. This represents a traffic split of 55 percent on the Tugun Bypass and 45 percent on the Gold Coast Highway. With 59,600 vehicles per day on the Tugun Bypass the surface street network will be subject to higher traffic volumes, as these trips continue to use the Gold Coast Highway route in lieu of the bypass. Given this, the calculated traffic volumes on the surface routes and therefore the interchange intersections will likely be higher than the volumes actually achieved and as such the design for the intersections will be conservative.
In 2027 it is recognised that the corridor will likely be at or near capacity. At this time it is estimated that about 80,000 vehicles per day may use the Tugun Bypass with the remainder using the Gold Coast Highway. In this scenario both the Tugun Bypass and the Gold Coast Highway are expected to be at or near capacity. In 2027 the Gold Coast Highway is likely to be subject to about the same level of traffic as is the case in 2003.
Importantly, the traffic volume estimates adopted are conservatively high for the short-term (10 year) horizon for the design of the interchanges (and associated intersections). The chosen longer-term (20 year) horizon may also provide a conservative design for the Tugun Bypass as it will likely be at or near capacity by 2027.
2.1.2 Model Validation
The Gold Coast EMME/2 model was developed using the South East QueenslandHousehold Travel Survey (Queensland Transport 1992) database, compiled from surveys undertaken in 1992. Trip generation, trip distribution and mode choice patterns were developed using these survey results. The trip generation and distribution models calibrated very well to these data across all trip purposes, although the trip distribution for some trip purposes was poor due to the limited amount of data that was available. This is not expected to have a significant effect on the aggregate model results.
Traffic volumes were assigned to a 2000 road network and validated against traffic counts across 10 screenlines, with screenline volumes generally within +/- 10 percent of traffic count volumes. This represents a fairly good level of validation for a strategic transport model.
As a strategic, whole of city model, the validation results are satisfactory. Further consideration, however, was required of the validation in the proposed Tugun Bypass corridor area to ensure that the local validation was suitable for the local application of the model.

Tugun Bypass Environmental Impact Statement Technical Paper Number 3
Traffic and Transport
Queensland Department of Main Roads 2-3
2.1.3 Re-validation of the Southern Gold Coast/Tweed Heads Area
Of importance to this project is the validation of the EMME/2 model within the study area. Table 2.1 below shows the 24-hour count volumes and the assigned Gold Coast EMME/2 model volumes at Terranora Creek. As can be seen from Table 2.1, there was a fairly poor match at this location.
Table 2.1: Gold Coast EMME/2 Model Assignment Results, Year 2000, Terranora Creek
Location 2000
24 hour Count
200024 hour Assigned Volume
Difference
Pacific Highway at Terranora Creek 35,200 22,697 - 12,503
Tweed Heads Bypass at Terranora Creek 29,000 44,366 + 15,366
This poor allocation of route choice between the Pacific Highway and Tweed Heads Bypass was most likely due to the model link type allocation not accounting for the scenic or other benefits associated with using the coastal route. This adjustment to the assignment was considered appropriate given the tourism focus for the Gold Coast region. The model assigns traffic based simply on the relative travel times on each route option and does not explicitly include attributes such as scenic value, habitual route choice, ride quality etc. In this case, as is often done, route specific adjustments are required to better match the modelled traffic volumes to the actual traffic counts, when using a strategic model for a local application.
Once the traffic assignment adjustments were undertaken, the results showed a better match to the traffic counts in terms of the split between the two alternative routes. Table 2.2 shows that the assignment change has resulted in a better levelling of the differences between the ‘observed’ (actual) and ‘estimated’ (modelled) flows compared to the original Gold Coast EMME/2 model as shown previously in Table 2.1.
Table 2.2: Updated Gold Coast EMME/2 Model Assignment Results, Year 2000, Terranora Creek
Location 2000
24 hour Count
200024 hour Assigned Volume
Difference
Pacific Highway at Terranora Creek 35,200 38,793 + 3,593
Tweed Heads Bypass at Terranora Creek 29,000 31,126 + 2,126
2.1.4 Validation to Travel Times
Travel time surveys were used as an additional method to check that the base model was operating to current conditions. Although the model was shown to be representative of traffic volumes along the Gold Coast Highway at Tugun, it was thought that a comparison of modelled and actual travel times would ensure that delays were being appropriately included.
PPK (now Parsons Brinckerhoff) undertook travel time surveys in November 2001 to confirm the validity of the travel times on the Pacific Motorway and Gold Coast Highway between Stewart Road and Kennedy Drive as estimated by the EMME/2 traffic

Tugun Bypass Environmental Impact Statement Technical Paper Number 3 Traffic and Transport
2-4
model. The travel time surveys confirmed the actual, average peak period, peak direction travel time on the Pacific Motorway and Gold Coast Highway between Stewart Road and Kennedy Drive.
2.1.5 Appropriateness of the Model for the Tugun Bypass Assessment
A strategic model is the most appropriate tool for modelling the Tugun Bypass to determine future lane requirements, changes on the Gold Coast Highway and changes on connecting roads. This is because the majority of trips using the Tugun Bypass are longer distance trips for which the approximately 7 km of travel through the study area represents only a portion of the overall trip distance. A model confined to the study area around the Tugun Bypass may over-estimate the travel time benefits of the bypass (in the context of the entire trip) and hence over-estimate traffic volumes using the bypass.
The EMME/2 package is one of the most widely recognised strategic transport modelling packages providing a range of options for the input, processing and output of data. It is a transparent model with trip generation, distribution, mode split and traffic assignment algorithms of a widely accepted form and accessible for viewing. It is however a model which operates best under stable traffic flow conditions and care should be taken in interpreting results in networks which are close to capacity and where there are a number of route alternatives.
For the Tugun Bypass project, there are only two real, closely spaced, route alternatives. With the bypass in place and the traffic assignment process used effectively, EMME/2 models the relative congestion and route choice implications between these two routes.
2.1.6 Model Limitations
The model is appropriate for assessment of link traffic volumes. It is not sensitive enough for testing route changes associated with minor traffic management measures in local streets, nor is it sensitive to changes in traffic control devices at particular nodes.
The model also does not have a mode choice component and can therefore not evaluate shifts to public transport as traffic congestion increases. For the Gold Coast EMME/2 model, mode split factors for future years have been allocated based on the Integrated Regional Transport Plan for South East Queensland public transport targets.
2.1.7 Induced Travel Demand
The concept of induced traffic resulting from the introduction of new or upgraded transport infrastructure is complex and difficult to quantify using existing travel demand models. In addition, confusion arises due to the inconsistent manner in which induced demand is defined. The most comprehensive attempt to formalise the concept and provide an appropriate framework for assessment of the potential of traffic to be induced by the implementation of new road projects in urban areas was undertaken by the United Kingdom Standing Advisory Committee on Trunk Road Assessment (1994). The following definition is derived from the committee’s conclusions, reflecting the fact that traffic modelling is traditionally undertaken using fixed-trip matrices of person demand, typically for an average weekday.

Tugun Bypass Environmental Impact Statement Technical Paper Number 3
Traffic and Transport
Queensland Department of Main Roads 2-5
Several behavioural responses to the opening of new road infrastructure can occur without new trips being induced. These include:
some drivers choosing to divert from other existing roads to the new facility – change of route;
more people choosing to travel in the peak period – change in timing of travel;
some people choosing to travel by car rather than bus or train – switch of mode;
some travellers choosing an alternative destination for their activity – change of activity location; and
some existing car passengers deciding instead to use their own cars for the journey – change in vehicle occupancy.
These responses represent changes in travel choices by persons already committed to undertaking those trips.
What is not included in these behavioural responses are totally new trips generated by the provision of new or upgraded transport infrastructure. These are defined as induced traffic demand and include:
land use changes induced as a response to improved accessibility with consequential additional traffic generated by these changes; and
a discretionary trip that would otherwise not have been made and which was made only because the trip mode was made more convenient.
Current (fixed matrix) travel modelling techniques do not enable the changes in travel patterns of existing users to be assessed. A review of case studies in Europe (Kroes et al.1996 and ARRB Transport Research 1998) indicates that the level of induced demand is a function of many factors and is complex. In particular, for a specific project, any induced traffic depends on the pre-development level of congestion and hence the extent of suppressed or latent demand.
A United Kingdom-wide investigation suggests that a 10 percent increase in motorway capacity would lead to a one percent increase in traffic (Standing Advisory Committee on Trunk Roads Assessment 1994). In the long-term, with travel and land use adjustments, this could increase to 20 percent. A California area-wide study suggests that this effect would be 32 percent initially but up to 50 percent with long-term land use adjustments (United Kingdom Standing Advisory Committee on Trunk Road Assessment 1994). These results apply over a wide area and represent aggregate effects of the induced traffic production mechanisms arising from changes to a road network as a whole. This research stresses that these conclusions cannot necessarily be applied to an individual project.
The following sections examine the potential of the Tugun Bypass to:
generate completely new trips;
stimulate land use changes resulting in increased car travel;
cause a redistribution of trips; and
encourage a shift from public transport usage to car travel.

Tugun Bypass Environmental Impact Statement Technical Paper Number 3 Traffic and Transport
2-6
Completely New Trips
It is not possible to quantify trips that arise as a result of someone undertaking an activity that involves travel rather than one that does not. Typically, such activity options relate to leisure pursuits such as recreation or shopping. Trips such as these are not traditionally taken into account in a transport study as their numbers are not usually high in comparison to other trips.
The probability of an individual choosing between a range of activity options, some of which would involve travel and some of which would not, would be dependent on a number of factors. The likelihood of the decision changing from a non-travel to a travel option as a result of a transport infrastructure improvement would depend on the cost and time saving that would result from the improvement.
Potential point-to-point travel time savings using the Tugun Bypass could be up to 1 hour by 2017 if the existing Gold Coast Highway is not upgraded. Due to modelling limitations, the amount of new discretionary travel generated as a result of this travel time saving cannot be quantified.
Effects of Land Use Changes
In general, the introduction of a major new item of road infrastructure in the existing network would result in the redistribution of trips to take advantage of improved journey times. The overall effect of this within an area where there are significant constraints to further urban development is to introduce a shift in the relative accessibility of a range of destinations to a series of origins within the network. Thus new or upgraded roads can mean that the relative accessibility of some areas improve compared to others.
This would be expected to lead to land use change, depending on the scale and significance of the redistribution of accessibility. In practice, this process would be influenced by the scale of the new infrastructure relative to the complexity of the network and its level of congestion and by the relative lack of flexibility in the management of land use change. The Standing Advisory Committee on Trunk Road Assessment (1999) found that there was evidence of a strong theoretical link between transport improvements and economic activity but that the empirical evidence of the scale and significance of such linkages was weak and disputed. The committee concluded that generalisations about the effect of transport on the economy are subject to strong dependence on local circumstances and conditions.
Planning and land use changes associated with the Tugun Bypass proposal could occur at two levels:
changes in the location, type and rate of ‘take-up’ of development to take advantage of perceived improvements in environmental amenity or accessibility; and
changes to planning and land use controls to enable greater or require lesser intensities of development to take place.
The former assumes that all things being equal, a developer might choose to develop land in a location made more accessible by the proposal rather than at another location within a similar area. Alternatively, a landowner might choose to alter the type of uses within an existing building in response to changes encouraging greater pedestrian activity following amenity improvements. In the absence of changes to local planning controls made by the relevant planning authority there may be no change at all, or the change may be limited to an increase or decrease in the intensity of use on the site.

Tugun Bypass Environmental Impact Statement Technical Paper Number 3
Traffic and Transport
Queensland Department of Main Roads 2-7
The potential for local land use change resulting from accessibility improvements brought about by the proposed Tugun Bypass is limited. The proposal would predominantly accommodate through-traffic which would exert little influence on local accessibility and future development in the local area would be limited by the presence of major ecological constraints. Land use changes such as proposed developments at Gold Coast Airport have been included in the traffic model. At the regional level, the proposal represents a small addition to the network and its redistribution effects would not be expected to result in any land use changes on its own but in combination with other improvements may influence some development patterns in northern NSW.
Locally, the anticipated removal of at least 55 percent of the traffic on the existing Gold Coast Highway followed by the consequential improvements in amenity could lead to some intensification of commercial and recreational uses in Tugun and Bilinga, but this would be restricted to a small area and its scale is expected to be small.
The EMME/2 model indicates that without the implementation of the Tugun Bypass the existing infrastructure could be inadequate to cope with the forecast growth (see Chapter 4). Consequently without the bypass in place there is a possibility that forecast population and employment growth could be suppressed.
Traffic Distribution Effects
The implementation of the proposal would result in changes to the distribution of movements on the local network as a high proportion of through-traffic diverts to the bypass. As the time benefits would be considerable and there are no direct costs to traffic (no toll is proposed), the diversion would be expected to remove about 55 percent of traffic from the Gold Coast Highway and at least 65 percent of traffic from the Tweed Heads Bypass, between the Gold Coast Highway and the Tugun Bypass. This would occur soon after opening followed by a longer period of adjustment as local movements take advantage of the removal of through traffic within Tugun and Bilinga.
Modal Shift
Construction of the bypass provides the potential for some shift in travel mode between car and public transport. This is expected to be small in the absence of the extension of the rail line to Tugun and Gold Coast Airport. Increases in bus ridership would be greater with the rail than without it. This is due to the opportunities that rail stations provide to introduce new services, especially to areas such as Coolangatta.
The removal of traffic from the Gold Coast Highway would free space within the principal public transport corridor in the southern Gold Coast for the provision of dedicated public transport facilities such as bus lanes or light rail. This would present a major opportunity for the improvement of public transport facilities in the area.
Conclusion
The development of new transport infrastructure to address an existing congestion problem is likely to lead to the stimulation of new trips. It is reasonable to assume that some are currently suppressed by the knowledge that delays will occur which are in excess of the value placed on the trip by the potential traveller. The removal of the previous constraint is no longer a deterrent to travel. Current techniques do not enable estimates of new trips, stimulated solely by the introduction of new transport

Tugun Bypass Environmental Impact Statement Technical Paper Number 3 Traffic and Transport
2-8
infrastructure, to be made. However investigations elsewhere suggest that these would be small in number (Standing Advisory Committee on Trunk Road Assessment 1994).
2.2 Transport System Characteristics
2.2.1 Population and Employment
Demographic information is derived from the Census of Population and Housing 2001(Australian Bureau of Statistics 2001), Our Community, A Social Profile of the City of Gold Coast (Gold Coast City Council 1999), the Gold Coast City Council and the Tweed Shire Council.
The population of the Gold Coast is forecast to grow at about 2.2 percent per annum, from 418,491 in 2001 to approximately 520,000 in 2011. The population of Tweed Shire is expected to increase from 74,380 in 2001 to approximately 93,200 in 2011. This is a growth rate of about 2.3 percent per annum. The population of the southern Gold Coast area (Bilinga, Coolangatta, Currumbin, Currumbin Waters and Tugun) is forecast to grow at about 1.5 percent per annum from 22,501 to approximately 25,300 for the same period.
The Gold Coast is an important employment centre in south-east Queensland. In 1996, 59.9 percent of residents in Gold Coast City were working, while in the southern Gold Coast area, 54.4 percent of residents were working. In Tweed Shire Part A, 44.6 percent of residents were working in 1996 (Australian Bureau of Statistics 1996).
Population and employment density provide a basis for evaluating the future demands on the transport system. Figures 2.1 and 2.2 show the population density in 2000 and 2011 in the southern Gold Coast and the northern Tweed. These figures highlight:
the population densities in 2000 were higher along the coastline than further to the west;
pockets of population growth are expected to occur throughout the southern Gold Coast, with limited growth in the vicinity of the proposed Tugun Bypass. This demonstrates the role of the proposed bypass in carrying longer distance movements rather than local movements; and
significant population growth between 2000 and 2011 in Elanora and in Coolangatta.
It should be highlighted that the population forecasts assumed a reduction in residential accommodation along the coastline due to an increase in tourist accommodation. This offset is yet to be realised to the proportions expected in the forecasts.
The growth in airport population is simply a reflection of the growth in air passengers through the airport, rather than representing growth in the residential population adjacent to the airport site.
Similarly, Figures 2.3 and 2.4 show employment density in the Gold Coast and northern Tweed. These figures highlight:
generally higher employment densities along the coastline and lower further to the west;

���������������
�����������
���� �
������������������������������
������������������
������������
���������������
������ ������������ ������������ ������
�%������&�����%������&�����%������&����
�%�����%�����%����
���&�������&�������&����
���������������������������
������������
��&������&������&����
�%%&������%%&������%%&�����
��� ��� ��� ��� ���� ���� �
������������������������������������������
���������������
���� �
������������������������������
������������������
������������
���������������
��&���������&���������&�������
�&��%���&��%���&��%��
�� ������ ������ ����
���������������
���� �
������������������������������
������������������
������������
���������������
����������������������������� ���� ���� ��
���������������
���� �
������������������������������
������������������
������������
���������������
�%������&�����%������&�����%������&����
������ ������������ ������������ �������%�����%�����%����
�� ������ ������ ����
���&�������&�������&����
��&���������&���������&�������
�&��%���&��%���&��%��
�%%&������%%&������%%&�����
��&������&������&����
���������������������������
�����'(� �����'(� �����'(� ������������������
���������������
�����������
���� �
������������������������������
������������������
������������
���������������
����������������������������� ���� ���� ��
������������
��� ��� ��� ��� ���� ���� �
������������������������������������������
���������������
���� �
������������������������������
������������������
������������
���������������
>4,000 persons/square kilometre
2,000 to 4,000 persons/square kilometre
1,000 to 2,000 persons/square kilometre
500 to 1,000 persons/square kilometre
0 to 500 persons/square kilometre
��������"���
Figure 2.1 ��������� � � �����)***�+���"���
Sour
ce: G
old
Coa
st C
ity C
ounc
il an
d Tw
eed
Shire
Cou
ncil
Proposed Tugun Bypass
Figure 2.2 ��������� � � �����)*,,�+���"���

������ ������������ ������������ ������
�%������&�����%������&�����%������&����
�%�����%�����%����
���&�������&�������&����
��&���������&���������&�������
���������������������������
������������
��&������&������&����
�%%&������%%&������%%&�����
��� ��� ��� ��� ���� ���� �
������������������������������������������
�&��%���&��%���&��%��
�� ������ ������ ����
���������������
�����������
���� �
������������������������������
������������������
������������
���������������
����������������������������� ���� ���� ��
)***
)*,,
Figure 2.4 �'����'� �� � �����)*,,�+���"���
Sour
ce: G
old
Coa
st C
ity C
ounc
il an
d Tw
eed
Shire
Cou
ncil
>4,000 persons/square kilometre
2,000 to 4,000 persons/square kilometre
1,000 to 2,000 persons/square kilometre
500 to 1,000 persons/square kilometre
0 to 500 persons/square kilometre
Proposed Tugun Bypass
��������"���
Figure 2.3 �'����'� �� � �����)***�+���"���
������ ������������ ������������ ������
�%������&�����%������&�����%������&����
�%�����%�����%����
���&�������&�������&����
��&���������&���������&�������
���������������������������
��� ��� ���
��&������&������&����
�%%&������%%&������%%&�����
��� ��� ��� ��� ���� ���� �
������������������������������������������
�&��%���&��%���&��%��
�� ������ ������ ����
���������������
�����������
���� �
������������������������������
������������������
������������
���������������
����������������������������� ���� ���� ��

Tugun Bypass Environmental Impact Statement Technical Paper Number 3
Traffic and Transport
Queensland Department of Main Roads 2-11
very little growth in employment is expected in the southern Gold Coast between 2000 and 2011;
the major employment node in the southern Gold Coast is Coolangatta; and
the majority of employment growth is in Coolangatta and around Elanora.
2.2.2 Travel Patterns
Travel patterns in the southern Gold Coast/northern Tweed area are generally associated with trips between the residential areas in the west and the activity centres in the east. There is also a significant demand for north-south travel as Tweed Shire residents travel to and from the Gold Coast for access to employment, shopping, education and recreation locations. Trips to local centres for shopping, education, recreational and tourism trip purposes dominate trip making within the southern Gold Coast/northern Tweed area.
When estimating travel patterns from the EMME/2 model it is important to recognise the source and level of accuracy of the traffic count data. This is illustrated when comparing traffic volumes across screenlines or traffic count locations in the vicinity of the Tugun Bypass.
The year 2000 traffic volumes across a screenline at Robina indicate a daily two-way traffic volume of around 147,600 (Gold Coast Highway, Southport – Burleigh Road, University Drive and Pacific Motorway) compared to traffic counts of around 141,600. However, the model has overestimated the traffic volumes on the Pacific Motorway by around 17 percent (64,000 versus 54,700) while the model underestimated the traffic volumes on Southport – Burleigh Road by around 15 percent (27,800 versus 32,600).
The year 2000 traffic volumes across a screenline at Currumbin Creek indicate a daily two-way traffic volume of around 83,800 (Gold Coast Highway, Thrower Drive, Pacific Motorway and Galleon Way) compared to traffic counts of around 87,100. However, the model has overestimated the traffic volumes on the Pacific Motorway by around 6 percent (62,000 versus 58,300) while the model underestimated the traffic volumes on the Gold Coast Highway by around 8 percent (32,400 versus 35,300).
At the northern end of the study area, a screenline at the Gold Coast Highway south of Wyberta Street indicates a modelled volume of about 70,154 vehicles per day compares favourably to traffic counts of 67,000 vehicles per day.
As a final comparison, a screenline at Terranora Creek indicates a modelled volume of 67,063 vehicles per day compared to traffic counts of 64,200 vehicles per day. However, the model has overestimated the traffic volumes on the Tweed Heads Bypass by around 53 percent (44,400 versus 29,000) while the model underestimated the traffic volumes on the Pacific Highway (Boyds Bay Bridge) by around 36 percent (22,700 versus 35,200). The updated model accounted for these effects through the use of a scenic benefit adjustment to make it more attractive to use the coastal rather than the inland bypass route.
Overall the 2002 calibrated traffic model has provided good estimates of traffic in some locations, minor overestimates of traffic in other locations and minor underestimates in others. Although the model is recognised as being the most appropriate tool for traffic forecasting in the region, the identified limitations must be taken into account when considering future (i.e. 2007, 2017 and 2027) estimates of traffic demand on the Tugun Bypass.

Tugun Bypass Environmental Impact Statement Technical Paper Number 3 Traffic and Transport
2-12
The patterns of travel for the Gold Coast Highway corridor at Tugun are presented in Table 2.3.
Table 2.3: Current Daily Trip Origins to Destination Volumes
Origin/Destination Local Area
South of Tweed Heads
Bypass/Gold Coast Highway
Interchange
Gold Coast Highway North of the Pacific
Motorway
Pacific Motorway
North of the Gold Coast Highway
Local Area 200 4,000 3,300 2,500
South of Tweed Heads Bypass/Gold Coast Highway Interchange.
4,000 14,600 20,200
Gold Coast Highway north of the Pacific Motorway.
3,300 14,600
Pacific Motorway north of the Gold Coast Highway.
2,500 20,200
Source: Extracted from Gold Coast EMME/2 Model.
Figure 2.5 presents the 2002 and estimated 2017 daily traffic volumes.
As discussed above these traffic volumes should be read with an understanding of the sensitivities within the EMME/2 traffic model.
The 2002 daily traffic volume on the Gold Coast Highway near Kitchener Street is estimated as 71,600 vehicles per day from the EMME/2 model. This includes about 12,400 local trips using the adjacent service roads (Golden Four Drive and Coolangatta Road). Therefore the estimated volume on the Gold Coast Highway is 59,200 vehicles per day and this volume correlates to the permanent traffic count of 55,100 vehicles per day.
Actual average daily traffic volumes recorded on the Gold Coast Highway south of Kitchener Street between 1996 and 2002 are provided in Table 2.4. These volumes indicate that daily traffic on the Gold Coast Highway over this period has grown at a rate of about 2 percent per annum.
Table 2.4: Actual AADT Recorded on the Gold Coast Highway South of Kitchener Street
Year Actual Count
1996 47,600
1997 47,500
1998 47,600
1999 50,900
2000 51,700
2001 51,800
2002 55,100
Source: Queensland Department of Main Roads – South Coast Hinterland District (2003).

���
��
Gold Coast Airport BoundaryQueensland/NSW BorderYear 2002 Daily Weekday Traffic VolumesYear 2017 Daily Weekday Traffic VolumesKey Local and Regional Roads
�
Figure 2.5 -����)**)�� �)*,.� �������##�"�/���'��
!"#$��
%&#$��
Sour
ce: G
old
Coa
st E
MM
E/2
mod
el m
odifie
d by
Par
sons
Brin
cker
hoff
���������������������������
������������������������������������������
������������������������������
������������
������������������������������������������������
��� ��� ��� ��� ���� ���� �
��� ��� ��� ��� �������� �������� �����
���� ����� ����� �
������������
������������
������������
���
���
����
�
���
���
����
�
���
���
����
�
���������
�������
�
���������
�������
�
���������
�������
�
���
�������
���
���
�������
���
���
�������
���
����� ����������� ����������� ������
"�������"�������"�������
�� �
��� �
�� �
��� �
�� �
��� �
������������
������������
������������
������ �
������ �
������ �
�������%��
�������%��
�������%��
!����
����
�!�
��� ��
���
!����
����
�
����� ����������� ����������� ������
��������!���������������!���������������!�������
!�� !�� !�� ������������
"� � �"� � �"� � �
������������
!�� ��������!�� ��������!�� ��������
����
�������
�����
���
���������
�����
���
���������
�����
�
!�������
�
!�������
�
!�������
�
����� ��
���
����� ��
���
����� ��
���
��#� �������#� �������#� �����
� ������
� ������
� ������������
����������
����������
����
!�����������
!�����������
!�����������
!�����!�����!����� ������������
���������������������������������
������
������
������
������
������
������
��$
��$
��$
%��%��%��
��������!�
�����
���������!�
�����
���������!�
�����
�
!� ����
����
!� ����
����
!� ����
����
!����
���
���
!����
���
���
!����
���
���
&� ����
�&�
����
�&�
����
�
����� ���������� ���������� �����
%��%��%��
'��������(���'��������(���'��������(���
������������ ������������
��
����
�"�*��
�
��
����
�"�*��
�
��
����
�"�*��
�
)� �)� �)� ��� �� ��
���������������
������������
���������������
������������
�!#'��
�!#'��
''#���%'#���
((#!��)&#&��
'!#(��
%�#)��
!�#"��
)�#%��
)�#&��
$"#%��
%�#$���(�#���
%�#(����%#$��
Tugun Bypass Environmental Impact Statement Technical Paper Number 3 Traffic and Transport
2-14
2.2.3 Road and Public Transport System
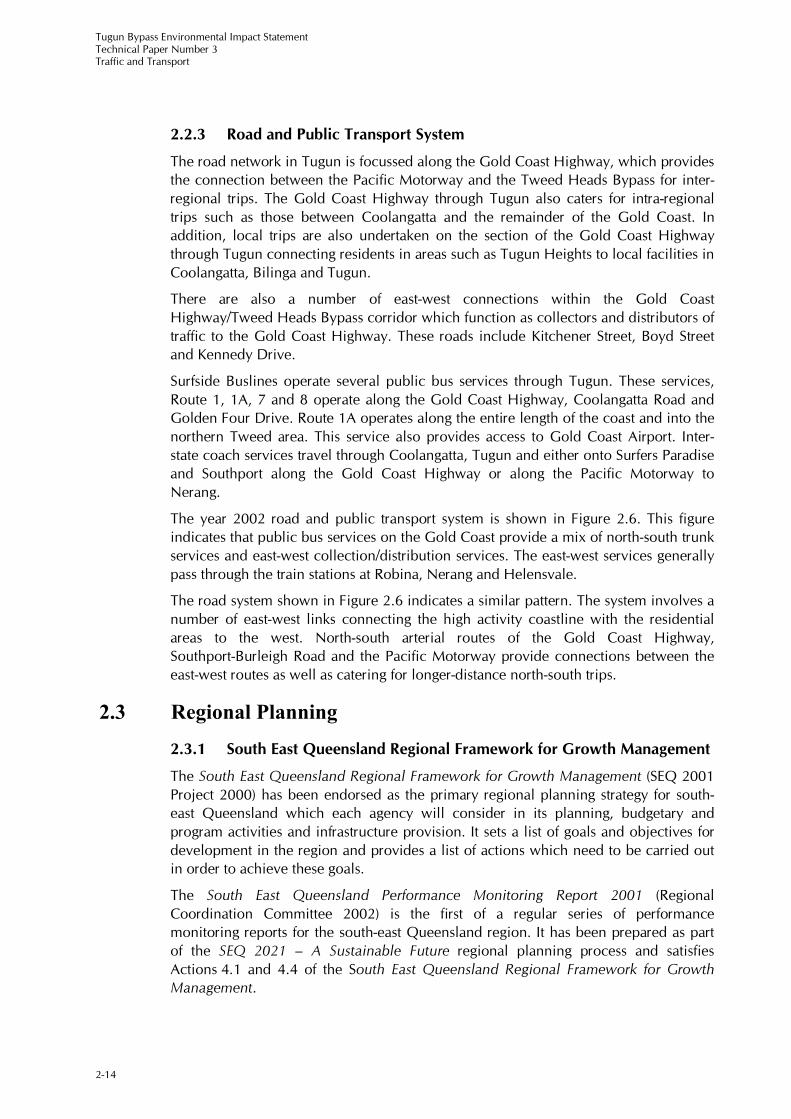
The road network in Tugun is focussed along the Gold Coast Highway, which provides the connection between the Pacific Motorway and the Tweed Heads Bypass for inter-regional trips. The Gold Coast Highway through Tugun also caters for intra-regional trips such as those between Coolangatta and the remainder of the Gold Coast. In addition, local trips are also undertaken on the section of the Gold Coast Highway through Tugun connecting residents in areas such as Tugun Heights to local facilities in Coolangatta, Bilinga and Tugun.
There are also a number of east-west connections within the Gold Coast Highway/Tweed Heads Bypass corridor which function as collectors and distributors of traffic to the Gold Coast Highway. These roads include Kitchener Street, Boyd Street and Kennedy Drive.
Surfside Buslines operate several public bus services through Tugun. These services, Route 1, 1A, 7 and 8 operate along the Gold Coast Highway, Coolangatta Road and Golden Four Drive. Route 1A operates along the entire length of the coast and into the northern Tweed area. This service also provides access to Gold Coast Airport. Inter-state coach services travel through Coolangatta, Tugun and either onto Surfers Paradise and Southport along the Gold Coast Highway or along the Pacific Motorway to Nerang.
The year 2002 road and public transport system is shown in Figure 2.6. This figure indicates that public bus services on the Gold Coast provide a mix of north-south trunk services and east-west collection/distribution services. The east-west services generally pass through the train stations at Robina, Nerang and Helensvale.
The road system shown in Figure 2.6 indicates a similar pattern. The system involves a number of east-west links connecting the high activity coastline with the residential areas to the west. North-south arterial routes of the Gold Coast Highway, Southport-Burleigh Road and the Pacific Motorway provide connections between the east-west routes as well as catering for longer-distance north-south trips.
2.3 Regional Planning
2.3.1 South East Queensland Regional Framework for Growth Management
The South East Queensland Regional Framework for Growth Management (SEQ 2001 Project 2000) has been endorsed as the primary regional planning strategy for south-east Queensland which each agency will consider in its planning, budgetary and program activities and infrastructure provision. It sets a list of goals and objectives for development in the region and provides a list of actions which need to be carried out in order to achieve these goals.
The South East Queensland Performance Monitoring Report 2001 (Regional Coordination Committee 2002) is the first of a regular series of performance monitoring reports for the south-east Queensland region. It has been prepared as part of the SEQ 2021 – A Sustainable Future regional planning process and satisfies Actions 4.1 and 4.4 of the South East Queensland Regional Framework for Growth Management.

���
��
�
0& 0& 0&
���������
Figure 2.6 -����)**)������ ���(��"��� �����������'
Existing Road NetworkExisting Rail LineProposed Rail Extension - Robina toGold Coast AirportExisting Bus RoutesGold Coast HighwayPacific Motorway/HighwayProposed Tugun BypassProposed Railway Stations
����������� ���������
������ ������������ ������������ ������
�%������&�����%������&�����%������&����
��(� ���(� ���(� �
���&�������&�������&����
��&���������&���������&�������
���������������������������
������������
��&������&������&����
�%%&������%%&������%%&�����
������������������������������������������
�&��%���&��%���&��%��
�� ������ ������ ����
��(� ���(� ���(� �
�����������
���� �
���������1���������1���������1
� ��!�� ��!�� ��!�
��� ������ ������ ���
��� ��� ���
����������������������������� ���� ���� ��

Tugun Bypass Environmental Impact Statement Technical Paper Number 3 Traffic and Transport
2-16
The report measures the region’s performance using a series of indicators under five major categories, one of these being Transport and Infrastructure. The evaluation has identified a number of key issues that require further consideration. The key transport issue of the report is that the trends in key available indicators such as private vehicle occupancies and transport mode shares suggest that the achievement of the Regional Framework for Growth Management 2000 targets will be extremely difficult. The report recognises that the increasing trend of single occupant car usage and the decreasing share of walking, cycling and public transport modes is a major concern and should be addressed by seeking transport solutions not just within but beyond the transport system.
2.3.2 Integrated Regional Transport Plan for South East Queensland
The Integrated Regional Transport Plan for South East Queensland (Queensland Transport 1997a) provides the framework for transport and land use planning within south-east Queensland. This 25 year plan provides strategies and actions to develop and manage the transport system in a way that supports the agreed plans for accommodating the region's expected population and employment growth.
The Integrated Regional Transport Plan aims to balance the future needs for public transport, freight and general vehicular traffic using an integrated approach, which considers the transport system alongside broader urban development and lifestyle choices, with a greater integration of land use and transport as a key goal. It has also adopted an integrated approach that recognises that public transport and private vehicles have complementary, not competing roles.
The Integrated Regional Transport Plan recognises that the emphasis in transport planning has changed from moving vehicles to moving people and goods and supporting better designed communities which reduce the need to travel. It also recognises that a balance is required that limits new road capacity expansion and favours public transport and high efficiency passenger and freight vehicles. A key aim of the plan is to moderate, rather than to strive to satisfy unrestrained traffic growth.
The Tugun Bypass and the rail extension from Robina to Gold Coast Airport were identified as strategic transport opportunities within this document.
2.3.3 Transport 2007 – An Action Plan for South East Queensland
Transport 2007 – An Action Plan for South East Queensland (Queensland Transport 2001c) is a companion document to the Integrated Regional Transport Plan for South East Queensland, providing a more detailed action plan for transport in the region until 2007 and includes specific strategies for each of the subregions. Proposals for the Gold Coast subregion include:
planning and preservation of the rail corridor from Robina to Coolangatta for implementation after 2007;
planning and preservation of bus lanes from Burleigh Heads to Coolangatta along the Gold Coast Highway;
construction of the Tugun Bypass; and
progressive improvement of the Paradise Point to Coolangatta cycle link and provision of cycle facilities within a 5 km radius of Robina and Coolangatta.

Tugun Bypass Environmental Impact Statement Technical Paper Number 3
Traffic and Transport
Queensland Department of Main Roads 2-17
The Transport 2007 Implementation Report 2001 (Queensland Government 2002) tracks the progress of Transport 2007 and the Integrated Regional Transport Plan and has been developed to formally capture the State Government’s achievements and ongoing priorities. The Transport 2007 Implementation Report 2001 replaces the former Three Year Rolling Program (3YRP) and forms part of the annual review process. The Implementation Report reflects the State Government’s focus on outcomes and allows them to check that they are on track to meet the medium and long-term transport objectives for south-east Queensland.
2.3.4 Gold Coast City Transport Plan
The Gold Coast City Transport Plan (Gold Coast City Council 1998) was prepared within the framework established by the Integrated Regional Transport Plan. As a 30 year transport master plan it documents strategies and actions to address the travel demand challenges facing the city.
This document acknowledges that one way to achieve a sustainable transport network is by providing a high quality public transport system, including a major investment in a new line haul public transport system.
The Tugun Bypass and the rail extension from Robina to Gold Coast Airport were identified as key transport opportunities within this document as was the downgrading in function of the Gold Coast Highway and the provision of a line-haul public transport corridor along the Gold Coast Highway.
2.3.5 Action for Transport 2010
Action for Transport 2010 – An Integrated Transport Plan for New South Wales (NSW Roads and Traffic Authority 1998) sets out a long-term vision for the expansion of the public transport network and the development of major roads and other transport infrastructure in NSW.
The plan follows a twelve-point action plan, a number of which are relevant to the proposal:
meeting the needs of our growing and changing population;
improving air quality;
reducing car dependency;
getting more people onto public transport;
making freight more competitive;
getting the best out of our system;
giving the community value for money;
making space for cyclists and walkers; and
preventing accidents and saving lives.
2.3.6 Lower Tweed River Transportation Study
The Lower Tweed River Transportation Study (Tweed Shire Council 1997) considers new road connections in the vicinity of the proposed Tugun Bypass. As shown in Figure 2.7, these include:
the Tugun Bypass;

���
��
Proposed Tugun BypassGold Coast Airport BoundaryQueensland/NSW BorderProposed Access BridgesTunnelProposed Road
�
Figure 2.7������������!������� �!����$���
���������������������������
������������������������������������������
������������������������������
������������
������������������������������������������������
��� ��� ��� ��� ���� ���� �
��� ��� ��� ��� �������� �������� �����
��������� � � �
���������
�������
�
���������
�������
�
���������
�������
�
���
�������
���
���
�������
���
���
�������
���
����� ����������� ����������� ������
"�������"�������"�������
�� �
��� �
�� �
��� �
�� �
��� �
������������
������������
������������
������ �
������ �
������ �
�������%��
�������%��
�������%��
!����
����
�!�
��� ��
���
!����
����
�
����� ����������� ����������� ������
��������!���������������!���������������!�������
!�� !�� !�� ������������
"� � �"� � �"� � �
������������
!�� ��������!�� ��������!�� ��������
����
�������
�����
���
���������
�����
���
���������
�����
�
!�������
�
!�������
�
!�������
�
����� ��
���
����� ��
���
����� ��
��
� ������
� ������
� ������ ����������
����������
����������
!�����������
!�����������
!�����������
!�����!�����!����� ������������
���������������������������������
������
������
������
������
������
������
��$
��$
��$
%��%��%��
��������!�
�����
���������!�
�����
���������!�
�����
�
!� ����
����
!� ����
����
!� ����
����
!����
���
���
!����
���
���
!����
���
���
&� ����
�&�
����
�&�
����
�
����� ���������� ���������� �����
%��%��%��
'��������(���'��������(���'��������(���
������������ ������������
��
����
�"�*��
�
��
����
�"�*��
�
��
����
�"�*��
�
)� �)� �)� ��� �� ��
���������������
������������
���������������
������������
���������� ��
���������������������
���� ������

Tugun Bypass Environmental Impact Statement Technical Paper Number 3
Traffic and Transport
Queensland Department of Main Roads 2-19
the Cobaki Parkway as the extension of Boyd Street;
the Scenic Drive Diversion as an extension of the Cobaki Parkway; and
the Diversion of Pigabeen Road and a new interchange with the Tweed Heads Bypass at Kirkwood Road.
2.3.7 South-East Queensland Freight Study
The South East Queensland Freight Study (Queensland Transport 1996) provides a strategic plan for freight transport that is consistent with the policy principles of the Integrated Regional Transport Plan. It has five objectives:
contribute to local, regional, state and national economic activity and performance;
minimise external effects of freight activities especially noise, emissions, dangerous goods movement and intrusion into residential, commercial or other sensitive areas;
improve the efficiency and productivity of the freight sector;
improve the safety of freight transport including interaction with other vehicles and infrastructure; and
facilitate freight systems that support preferred patterns of development and distribution of economic activity and which support an efficient land use and transport relationship
The South East Queensland Freight Study identified freight traffic at Tugun as having significant movements across the border with NSW and general interaction with the Gold Coast, particularly Burleigh Heads and some movement to Acacia Ridge and Wacol in Brisbane.
A priority set by the South East Queensland Freight Study was to continue to support projects that provide incremental freight transport benefits and satisfy other transport outcomes. One of the actions set out as being able to achieve this priority was a Gold Coast Airport bypass.
2.4 Corridor Planning
There have been two major studies relating to transport planning in the Tugun corridor. These are the Southern Gold Coast Tweed Corridor Study (Queensland Transport 1998) and the Pacific Highway at Tugun – Route Selection Report (Main Roads 1999). Route options defined in these studies are discussed in Chapter 5 of the Tugun Bypass EIS, while major outcomes are detailed below.
2.4.1 Southern Gold Coast Tweed Corridor Study
The Southern Gold Coast Tweed Corridor Study (Queensland Transport 1998) commenced in December 1996 and was completed in June 1998. The study commenced with an identification of the opportunities and constraints of providing a new rail corridor and improving the existing road corridor between Robina and Tweed Heads. A preliminary assessment of the demand for travel by both rail and road was undertaken to provide an indication of capacity required in the future. A number of alignment options were identified and assessed, primarily from the perspectives of engineering feasibility and construction cost. A preferred rail alignment between

Tugun Bypass Environmental Impact Statement Technical Paper Number 3 Traffic and Transport
2-20
Robina and Gold Coast Airport was identified as was a refined series of options for the proposed Tugun Bypass alignment.
In terms of the identification of need for the road and rail corridors, the Southern Gold Coast Tweed Corridor Study - Needs Paper (Queensland Transport 1997b) stated: ‘Demand analysis for a public transport corridor between Robina and Coolangatta…identify significant shortfalls in the ability of the existing road, rail and public transport systems to cater for projected population and employment growth.’
Road Alignment Options
The road alignment involved three generic categories of options, termed A, B and C. Option A was based on upgrading the existing Pacific Motorway to Gold Coast Highway alignment and included two sub-options called A1 and A2. Option B involved a partial bypass running along the western side of the ridge behind the John Flynn Hospital and Medical Centre to near Boyd Street where the alignment ran eastwards to join the Gold Coast Highway. Three sub-options called B1, B2 and B3 were proposed. Option C involved a full bypass of the Gold Coast Highway, with three sub options proposed (C1, C2 and C3). Option C1 was located to the west of the Gold Coast Airport site, whereas Option C2 was largely within the airport’s western boundary, crossing the proposed airport runway extension at its southern end. Option C3 crossed the existing runway approximately mid-way along its current alignment.
The road alignment options considered in the Southern Gold Coast Tweed Corridor Study are shown in Figure 2.8.
Rail Alignment Options
Rail alignments for the Tugun Heights to Gold Coast Airport section were split into Options 1A, 1B, 1C and 1D near the ridge behind the John Flynn Hospital and Medical Centre and Eastern (E) and Western (W) options adjacent to Gold Coast Airport. Option 1A was located through the eastern side of the ridge behind the John Flynn Hospital and Medical Centre in tunnel, while Options 1B and 1D ran through the centre of the ridge behind the John Flynn Hospital and Medical Centre. Option 1C was located along the western side of the ridge parallel to the Stewart Road alignment. One eastern alignment was located adjacent to Gold Coast Airport running between the airport boundary and the existing service road. Three western alignments were proposed: W1, W2 and W3. Option W1 was located to the west of the airport boundary. Option W2 was within and adjacent to the western boundary of the airport. Option W3, passed through the middle of the airport site, directly under the existing runway. All three western alignments terminated at the south eastern end of the airport site.
Two sets of alignment combinations were proposed to connect Options 1A, 1B, 1C, 1D and 2 with Option E, W1, W2 and W3. These combinations are listed as follows:
1A, 1B, 1C, 1D and 2 to E; and
1C and 1D to W1, W2 and W3.
The rail alignment options considered in the Southern Gold Coast Tweed Corridor Study are shown in Figure 2.9.
The Minister announced that the preferred corridor was to the west of Gold Coast Airport on 16 March 1998.

���
��
Gold Coast Airport BoundaryQueensland/NSW BorderTugun Road Alignment Options
�
Figure 2.8 ����$�� �����������!������������������� ��������� '� ��%���� �
Sour
ce: S
outh
ern
Gol
d C
oast
-Tw
eed
Cor
ridor
Stu
dy 1
997
���������������������������
������������������������������������������
������������������������������
������������
������������������������������������������������
��� ��� ��� ��� ���� ���� �
��� ��� ��� ��� �������� �������� �����
���� ����� ����� �
������������
������������
������������
���
���
����
�
���
���
����
�
���
���
����
�
���������
�������
�
���������
�������
�
���������
�������
�
���
�������
���
���
�������
���
���
�������
���
����� ����������� ����������� ������
������������
�� �
��� �
�� �
��� �
�� �
��� �
������������
������������
������������
������ �
������ �
������ �
�������%��
�������%��
�������%��
!����
����
�!�
��� ��
���
!����
����
�
����� ����������� ����������� ������
��������!���������������!���������������!�������
!�� !�� !�� ������������
"� � �"� � �"� � �
������������
!�� ��������!�� ��������!�� ��������
���������
�����
���
���������
�����
���
���������
�����
���
!�������
�
!�������
�
!�������
�
����� ��
���
����� ��
���
����� ��
���
��#� �������#� �������#� �����
� ������
� ������
� ������ ����������
����������
����������
!�����������
!�����������
!�����������
!�����!�����!����� ������������
���������������������������������
������
������
������
������
������
������
��$
��$
��$
%��%��%��
��������!�
�����
���������!�
�����
���������!�
�����
�
!� ����
����
!� ����
����
!� ����
����
!����
���
���
!����
���
���
!����
���
���
&� ����
�&�
����
�&�
����
�
����� ���������� ���������� �����
%��%��%��
'��������(���'��������(���'��������(���
������������ ������������
�����
��"�*
���
�����
��"�*
���
�����
��"�*
���
)� �)� �)� ��� �� ��
���������������
������������
���������������
������������
"��"��"��
��
����
����
��
�� ��

���
��
Gold Coast Airport BoundaryQueensland/NSW BorderHeavy Rail OptionsRail in TunnelProposed Rail Terminus
�
Figure 2.9 ����$�� �����������!������������������ ���������� '� ��%���� �
Sour
ce: S
outh
ern
Gol
d C
oast
-Tw
eed
Cor
ridor
Stu
dy 1
997
���������������������������
������������������������������������������
������������������������������
������������
������������������������������������������������
��� ��� ��� ��� ���� ���� �
��� ��� ��� ��� �������� �������� �����
���� ����� ����� �
������������
������������
������������
���
���
����
�
���
���
����
�
���
���
����
�
���������
�������
�
���������
�������
�
���������
�������
�
���
�������
���
���
�������
���
���
�������
���
����� ����������� ����������� ������
������������
�� �
��� �
�� �
��� �
�� �
��� �
������������
������������
������������
������ �
������ �
������ �
�������%��
�������%��
�������%��
!����
����
�!�
��� ��
���
!����
����
�
����� ����������� ����������� ������
��������!���������������!���������������!�������
!�� !�� !�� ������������
"� � �"� � �"� � �
������������
!�� ��������!�� ��������!�� ��������
����
�������
�����
���
���������
�����
���
���������
�����
�
!�������
�
!�������
�
!�������
�
����� ��
���
����� ��
���
����� ��
���
��#� �������#� �������#� �����
� ������
� ������
� ������ ����������
����������
����������
!�����������
!�����������
!�����������
!�����!�����!����� ������������
���������������������������������
������
������
������
������
������
������
��$
��$
��$
%��%��%��
��������!�
�����
���������!�
�����
���������!�
�����
�
!� ����
����
!� ����
����
!� ����
����
!����
���
���
!����
���
���
!����
���
���
&� ����
�&�
����
�&�
����
�
����� ���������� ���������� �����
%��%��%��
'��������(���'��������(���'��������(���
������������ ������������
��
����
�"�*��
�
��
����
�"�*��
�
��
����
�"�*��
�
)� �)� �)� ��� �� ��
���������������
������������
���������������
������������
"��"��"��
� �
�
�
��
����
��
�

Tugun Bypass Environmental Impact Statement Technical Paper Number 3
Traffic and Transport
Queensland Department of Main Roads 2-23
2.4.2 Rail Stations at Tugun and Gold Coast Airport Sites Review
Consultants were commissioned in 1999 to conduct a review of the proposed rail stations at Tugun and Gold Coast Airport to consider their respective roles, given their proximity. This study recommended that the rail station at Tugun could be best developed to provide for park and ride requirements, while the rail station at Gold Coast Airport should be developed to suit the requirements of the airport as well as providing beach access and integration with the primary public transport route along the Gold Coast Highway.
2.4.3 Pacific Highway at Tugun Route Selection Report
The Southern Gold Coast Tweed Corridor Study Final Report (Queensland Transport 1998) recommended that Options C1 and C2 were investigated further. Following this, Main Roads commissioned the Pacific Highway at Tugun – Route Selection Report (Main Roads 1999). Workshops were conducted involving the NSW Roads and Traffic Authority, Main Roads, Tweed Shire Council, Gold Coast City Council and the operators of Gold Coast Airport as part of this study. A new option, C4, was identified as a result of the workshop sessions as the preferred option.
2.5 Local Transport Planning
2.5.1 Local Travel Patterns
Figure 2.10 shows the areas in the vicinity of the proposed Tugun Bypass and the major travel movements through, to/from and within those areas. The majority of trips with one end in Tugun-Bilinga are associated with trips either to the north or south of this area with a significant proportion of these generated by Gold Coast Airport and the Tugun Heights residential area.
2.5.2 Cobaki Lakes Development
The Cobaki Lakes development is located entirely in NSW adjacent to the Queensland-NSW border. The current Master Plan produced in July 1999 by Leda Manorstead Pty. Ltd. proposes a total gross developable area of 284.5 ha. The development has been divided into a number of parcels each containing a mixture of proposed developments at different densities. These include:
Residential A Lots (1,162 in total);
Greenstreet Lots (531 in total);
Duplex Lots (202 in total); and
Units (2,260 in total).
The total yield from the Development Control Plan (DCP) is 4,741 tenements (Tweed Shire Council 1995a). The Master Plan proposes a total of 4,357 tenements, including lots and units. In recognition of the capacity constraints of the existing road network the development is however currently capped at 3,500 units until a further connection to the proposed Tugun Bypass is provided. A further condition on this development prior to construction requires the developer to upgrade the Boyd Street/Gold Coast Highway intersection to four lanes with new traffic signals and upgrade Boyd Street to four lanes from the Gold Coast Highway intersection.

���
��
Proposed Tugun BypassGold Coast Airport BoundaryQueensland/NSW BorderProposed Access BridgesTunnel
Number of Trips Per Day(Daily Weekday Traffic Total Two-way)
Zones
�
Figure 2.10��&�"����������2��������� ��)**)
�!"#
Sour
ce: G
old
Coa
st E
MM
E/2
mod
el m
odifie
d by
Par
sons
Brin
cker
hoff
���������������
������������
���������������������������
������������������������������������������
������������������������������
������������
������������������������������������������������
��� ��� ��� ��� ���� ���� �
��� ��� ��� ��� �������� �������� �����
���� ����� ����� �
������������
������������
������������
���
���
����
�
���
���
����
�
���
���
����
�
���������
�������
�
���������
�������
�
���������
�������
�
���
�������
���
���
�������
���
���
�������
���
����� ����������� ����������� ������
"�������"�������"�������
�� �
��� �
�� �
��� �
�� �
��� �
������������
������������
������������
������ �
������ �
������ �
�������%��
�������%��
�������%��
!����
����
�!�
��� ��
���
!����
����
�
����� ����������� ����������� ������
��������!���������������!���������������!�������
!�� !�� !�� ������������
"� � �"� � �"� � �
������������
!�� ��������!�� ��������!�� ��������
����
�������
�����
���
���������
�����
���
���������
�����
�
!�������
�
!�������
�
!�������
�
����� ��
���
����� ��
���
����� ��
���
��#� �������#� �������#� �����
� ������
� ������
� ������ ����������
����������
����������
!�����������
!�����������
!�����������
!�����!�����!����� ������������
���������������������������������
������
������
������
������
������
������
��$
��$
��$
%��%��%��
��������!�
�����
���������!�
�����
���������!�
�����
�
!� ����
����
!� ����
����
!� ����
����
!����
���
���
!����
���
���
!����
���
���
&� ����
�&�
����
�&�
����
�
����� ���������� ���������� �����
%��%��%��
'��������(���'��������(���'��������(���
������������ ������������
��
����
�"�*��
�
��
����
�"�*��
�
��
����
�"�*��
�
)� �)� �)� ��� �� ��
���������������
������������
�##
�$###
�#$�##
�$%##
�$�##
�$&##
�$'##
�$%##
�"$(##

Tugun Bypass Environmental Impact Statement Technical Paper Number 3
Traffic and Transport
Queensland Department of Main Roads 2-25
No provision for an interchange or overpass has been included as part of this proposal. If it is decided that access to the development is required from Boyd Street in Queensland separate approvals would be needed.
The location of the Cobaki Lakes development relative to the proposed Tugun Bypass and Boyd Street is shown in Figure 2.11.
2.5.3 Gold Coast Airport Master Plan
The operators of Gold Coast Airport, Gold Coast Airport Limited have completed the Final Master Plan (Gold Coast Airport Limited 2001). The Federal Minister for Transport and Regional Services approved the Master Plan in August 2001.
The Master Plan is a guide to the development of airport facilities, infrastructure and land use over the next 20 years. Key features of the Master Plan include:
provision of a road/rail corridor through the western and southern sectors of the airport;
future provision for a possible rail terminus adjacent to the main domestic terminal that could be incorporated into a Multi Modal Transit Centre; and
development of improved access from the Gold Coast Highway/Tweed Heads Bypass interchange through upgraded, grade separated entry and exits.
2.5.4 Coolangatta Enterprise Area
The Coolangatta Enterprise Area comprises land immediately to the south of Gold Coast Airport between the Tweed Heads Bypass and Cobaki Broadwater. The Tweed Economic Development Committee is continuing investigations into the feasibility and nature of development on the site. Road access has initially been proposed onto the new service road to be located on the eastern side of the Tweed Heads Bypass between the proposed Tweed Heads Bypass interchange and the Kennedy Drive interchange.
2.6 Cycling Policy and Planning
2.6.1 Relevant Cycling Policy and Plans
Cycling in the study area is influenced by both state and local government policy and planning instruments. Relevant state government planning documents include the Integrated Regional Transport Plan for South East Queensland (Queensland Transport 1997a), the Draft Integrated Regional Cycle Network Plan (Queensland Transport 2001a) Transport 2007 (Queensland Transport 2001c), Cycle South East - Integrated Cycle Strategy for South East Queensland (Queensland Transport 1999) and the Action for Bikes: Bike Plan 2010 (NSW Roads and Traffic Authority 1999).
Local government bicycle plans include the Gold Coast Bicycle Network Strategy (Gold Coast City Council 1996), the Gold Coast Bicycle Network Operational Plan(Gold Coast City Council 2001a), the Tweed Bicycle Plan (Tweed Shire Council 1995b) and the Tweed Shire Section 94 Contributions Plan Number 22 – Cycleways (Tweed Shire Council 1999).

���
��
Proposed Tugun BypassGold Coast Airport BoundaryQueensland/NSW BorderProposed Access BridgesTunnelResidential DevelopmentIndustrial DevelopmentConservation AreaFuture Urban Zoned Land
�
Figure 2.11 &�"���� ��#���(�1��&�1��� �2����'� ��� ���$������ ����� �2����'� ��
���������������������������
������������������������������������������
������������������������������
������������
������������������������������������������������
��� ��� ��� ��� ���� ���� �
��� ��� ��� ��� �������� �������� �����
��������� � � �
���������
�������
�
���������
�������
�
���������
�������
�
���
�������
���
���
�������
���
���
�������
���
����� ����������� ����������� ������
"�������"�������"�������
�� �
��� �
�� �
��� �
�� �
��� �
������������
������������
������������
������ �
������ �
������ �
�������%��
�������%��
�������%��
!����
����
�!�
��� ��
���
!����
����
�
����� ����������� ����������� ������
��������!���������������!���������������!�������
!�� !�� !�� ������������
"� � �"� � �"� � �
������������
!�� ��������!�� ��������!�� ��������
����
�������
�����
���
���������
�����
���
���������
�����
�
!�������
�
!�������
�
!�������
�
����� ��
���
����� ��
���
����� ��
��� ������
� ������
� ������ ����������
����������
����������
!�����������
!�����������
!�����������
!�����!�����!����� ������������
���������������������������������
������
������
������
������
������
������
��$
��$
��$
%��%��%��
��������!�
�����
���������!�
�����
���������!�
�����
�
!� ����
����
!� ����
����
!� ����
����
!����
���
���
!����
���
���
!����
���
���
&� ����
�&�
����
�&�
����
�
����� ���������� ���������� �����
%��%��%��
'��������(���'��������(���'��������(���
������������ ������������
��
����
�"�*��
�
��
����
�"�*��
�
��
����
�"�*��
�
)� �)� �)� ��� �� ��
���������������
������������
���������������
������������
��)�*�)���)+������
������,����������-.���

Tugun Bypass Environmental Impact Statement Technical Paper Number 3
Traffic and Transport
Queensland Department of Main Roads 2-27
2.6.2 Queensland State Cycling Policies, Plans and Legislation
The key state-wide strategy relating to cycling in Queensland is the Draft Queensland Cycle Strategy (Queensland Transport 2003). The strategy aims to increase the proportion of all person trips made by bicycle by an additional 50 percent by 2011 and by 100 percent by 2021. The Draft Strategy identifies objectives and actions for integrating planning and policy; facilitating, managing and maintaining bicycle routes; improving cycling safety and security; integrating cycling and public transport; proving end of trip facilities; and cycling encouragement and promotion.
The Integrated Regional Transport Plan, Transport 2007 and Cycle South East are the three most significant planning documents for cycling in south-east Queensland.
The Integrated Regional Transport Plan recognises the significant role that increased cycling participation plays in reducing reliance on private vehicle use. It set a major goal to increase cycling in south-east Queensland from 2 percent in 1992 to 8 percent of all trips by the year 2011.
Transport 2007 sets a 'midpoint' target for cycling of 6 percent of the modal share by 2007. It proposes a number of specific cycleway projects, including the inclusion of a cycleway in road upgrades from Paradise Point to Coolangatta.
Cycle South East was released in 1999 by the Queensland Government as the key cycling strategy for south-east Queensland. It adopts the mode share target of 8 percent identified in the Integrated Regional Transport Plan and identifies key objectives and actions to improve cycling participation. The strategy objectives include integrating cycling into planning processes, creating safe cycling networks and education and promotion of cycling. The strategy does not identify specific existing or planned cycleway routes.
The Draft Integrated Regional Cycle Plan for South East Queensland is a companion document to the Integrated Regional Transport Plan and Cycle South East. The Draft Integrated Regional Cycle Plan has been produced to establish a framework and coordinated planning approach between agencies responsible for the provision of cycling infrastructure.
Main Roads funds bicycle infrastructure through the Transport Infrastructure Development Scheme (TIDS) within the Roads Implementation Program (RIP). This scheme provides funding to local governments generally on a matching basis. In addition, Main Roads incorporates cycling facilities into state controlled road projects.
2.6.3 NSW State Cycling Policies and Plans
Action for Bikes: Bike Plan 2010 is the NSW Government's cycling strategy, released in 1999. Its '4 Point Action Plan for Bikes' includes the following four key objectives – improving the bike network; making it safer to cycle; improving personal and environmental health; and raising community awareness. The plan identifies future cycleway links in a 10-year costed bicycle master plan for regional NSW and proposes a $251 million program to create an average 200 km of cycleways across regional NSW per year. The plan also proposes simultaneous improvements for the bicycle network with all major road maintenance works. To make it safer to cycle, the plan proposes to reduce the annual number of serious cyclist injuries through bicycle safety education such as school road safety programs, providing bicycle safety training in schools and the 'sharing the road' public education campaign.

Tugun Bypass Environmental Impact Statement Technical Paper Number 3 Traffic and Transport
2-28
In 1999, the NSW Government made a commitment to, as far as is practicable, provide cycling facilities as part of all major road construction, with preference for off-road cycleways wherever possible. The NSW bicycle strategy Action for Bikes: Bike Plan 2010 states that as the Pacific Highway is upgraded it would provide for cyclists. This would generally take the form of a shared use 2.5 m wide shoulder, although it would be located off-road where space and topography permitted. The strategy also announced that when maintenance works on Roads and Traffic Authority roads occur, improvements for safe cycling would be simultaneously implemented, including linemarking, provision of signs, shoulder sealing and gully grate upgrading.
2.6.4 Local Government Policy and Planning
The Gold Coast Bicycle Network Strategy was adopted by the Gold Coast City Council in 1996. The plan recommended a city-wide network of on-road and off-road bikeways and provided a set of policy and program recommendations directed at all levels of government, the community and in some cases, the private sector. It also addressed issues including bikeway maintenance (Council's duty of care), end-of-trip facilities, public liability and education. This strategy was reviewed in the Gold Coast Bicycle Network Operational Plan in September 2001, which provided a strategy to guide Council's forward planning of the bikeway network over a 10 to 20 year period and an operational plan for the construction and maintenance of the city's bikeway network for the next five years.
The Tweed Bicycle Plan was adopted by Tweed Shire Council in May 1995. The plan recommended a strategic bicycle network for the shire and a detailed local area network for Tweed Heads. The plan also focussed on the provision of signed on-road routes to encourage longer distance bicycle touring through the Tweed Valley and between coastal communities. The Tweed Bicycle Plan is complimented by the Section 94 Contributions Plan Number 22 – Cycleways, which sets out existing and future cycleways for the next 20 years and details the infrastructure contributions.
2.6.5 Bicycle Access on the Pacific Motorway
Relevant Queensland and NSW state policies relating to bicycle use in the study area include controls on cyclist access to motorways.
Access to Queensland motorways by certain types of traffic is regulated by the Director-General of Main Roads under the Queensland Transport Infrastructure Act 1994 and enforced using 'Prohibited on Freeway' signage. Cyclists are officially prohibited from using the Pacific Motorway between Brisbane and the Gold Coast Highway. Cyclists are directed to use the local network as alternative north-south routes instead of the Pacific Motorway. Access on the Gold Coast Highway is allowed.
In NSW, bicycles are permitted to use the Pacific Highway, including sections of the highway that do not have the standard 2.5 m wide shoulder for on-road bicycle paths. Traffic management policy in NSW requires that all new freeway standard roads (Roads and Traffic Authority controlled) provide wide sealed shoulders for safe cycling. The NSW policy requires that on-road bicycle paths are located on 2.5 m wide sealed shoulders on each side of the freeway.

Tugun Bypass Environmental Impact Statement Technical Paper Number 3
Traffic and Transport
Queensland Department of Main Roads 2-1
Part B: Need Assessment – Tugun Bypass

Tugun Bypass Environmental Impact Statement Technical Paper Number 3
Traffic and Transport
Queensland Department of Main Roads 3-1
3. Scope and Approach
3.1 General
Part B of the technical paper documents current and future deficiencies in the existing transport network and need for the proposed Tugun Bypass in terms of transport improvements. The quantitative assessment provided in Part B makes use of the most recent, relevant transport data and models available for this proposal.
The need assessment for the proposed Tugun Bypass considers the following:
achieving the objectives of the Integrated Regional Transport Plan for South-East Queensland and those of the Gold Coast City Transport Plan;
resolving functional conflicts on the Gold Coast Highway at Tugun;
overcoming existing and forecast traffic congestion and improving travel times for all road users;
overcoming existing safety concerns and improving the safety of traffic, pedestrians and cyclists;
overcoming existing deficiencies and providing better access to public transport;
providing opportunities for improved public transport services on the Gold Coast Highway;
increasing the ease of movement along and across the Gold Coast Highway for pedestrians and cyclists; and
increasing the efficiency of road freight movements and reducing the impacts of road freight on other road users.
Where possible, the benefits resulting from the construction of the proposed Tugun Bypass have been quantified. Where this has not been possible, a qualitative assessment has been undertaken making reference to generally accepted transport planning objectives.
The need assessment quantifies the impacts of not constructing the proposed Tugun Bypass and demonstrates the degree of reduction of impact that the proposal introduces.
The assessment makes use of the most current Gold Coast City EMME/2 (traffic only) model available at the time and traffic count and crash data supplied by Main Roads.
The need assessment considers 2007 and 2017 traffic demand scenarios, based on a year of opening of the proposed bypass of 2007 and a 10-year assessment horizon beyond that.
3.2 Project Description and Assessment Assumptions
Figure 1.1 shows the proposed Tugun Bypass alignment, interchange locations and configuration upon which the assessment of transport impacts is based. The original C4 option has been refined to:
minimise impacts on areas of environmental significance;
minimise impacts on environmentally significant species and their habitat;
minimise impacts to the existing Tugun Landfill (behind Gold Coast Airport); and

Tugun Bypass Environmental Impact Statement Technical Paper Number 3 Traffic and Transport
3-2
minimise the amount of cutting and filling needed through the ridge behind the John Flynn Hospital and Medical Centre.
The transport assessment of the proposed bypass is based on the alignment shown in Figure 1.1 and the following project features:
the proposed Tugun Bypass constructed as two lanes in each direction in 2007 with interchanges at Stewart Road and the Tweed Heads Bypass; and
the removal of the north facing ramps at the Kennedy Drive interchange, replaced by a two-lane two-way service road on both the eastern and western side of the highway to link the Kennedy Drive interchange with the proposed Tweed Heads Bypass interchange.

Tugun Bypass Environmental Impact Statement Technical Paper Number 3
Traffic and Transport
Queensland Department of Main Roads 4-1
4. Need Assessment
4.1 Strategic Need
4.1.1 South East Queensland Regional Framework for Growth Management
The South East Queensland Regional Framework for Growth Management (SEQ 2001 Project 2000) sets the framework for development within south-east Queensland. The Regional Framework for Growth Management establishes distinctive, separate urban areas and proposes a hierarchy of major centres in the region, supporting the pattern of development to the year 2011. A major centre is an important urban centre which includes retail, commercial, recreational, community, cultural and transport services.
Two key regional centres are proposed in the Gold Coast urban area, as preferred locations for major office, retail, community services, leisure and cultural facilities and government services, facilities and infrastructure. These centres should be serviced by fixed rail or high capacity, high frequency buses operating on priority systems. Public transport services and interchanges for the key centres should be provided or upgraded, to improve access to employment and minimise air pollution from vehicle travel and congestion. Medium density housing should be concentrated around the key centres to provide opportunities for people to live within walking distance of a range of commercial and community facilities.
The Regional Framework for Growth Management stated that a centre development strategy should be prepared and implemented for each of the key centres in order to guide their long-term development. This should include:
an economic development plan which identifies employment targets for the centre and for different uses;
a mobility plan that provides for high levels of transport accessibility to the centres, particularly for pedestrians, cyclists and feeder transport services and ensures that the structure of the centre is focused on the public transport interchange;
a land use/urban design plan that provides for a high quality urban environment, including an appropriate level and quality of open space and addresses the environmental opportunities and constraints for the selected site;
a community and cultural facilities plan; and
physical and human services infrastructure programs.
The Regional Framework for Growth Management highlights that accelerated development of the key centres can be encouraged by giving them priority in programs for government services, facilities and infrastructure provision. Policies, administrative arrangements, infrastructure guidelines and implementation strategies can be adopted which commit all government agencies to the major centre’s principles and outcomes.
As noted in the Regional Framework for Growth Management, priority in transport resource allocation should go to measures which improve the accessibility and attractiveness of the key centres and which encourage greater levels of self-containment, by improving the relationship between the distribution of employment, services and population.

Tugun Bypass Environmental Impact Statement Technical Paper Number 3 Traffic and Transport
4-2
The Regional Framework for Growth Management also states that provision should be made at an early date for protection of the routes of high capacity transport corridors for inter-urban travel. The development of this system should be staged to ensure that it complements and does not forestall the emergence of the key centres or the improved public transport system. The noise pollution and air quality effects of transportation systems should be reduced to national standards.
4.1.2 Achieving the Objectives of the Integrated Regional Transport Plan for South East Queensland
Road Strategy
Despite the major shift towards more efficient transport modes and actions to restrain the growth of single occupant vehicles in peak periods, the capacity and coverage of the road network would have to increase significantly to accommodate increased travel demands. It is estimated that over 80 percent of the region's population growth between now and 2011 would be located in new communities which require new road connections.
Achieving the targets specified in the Integrated Regional Transport Plan for South East Queensland for increased use of more sustainable transport practices would reduce projected private vehicle travel demand by about 19 percent. To maintain the ability to move around the region, the Integrated Regional Transport Plan predicts the need for several thousand additional lane kilometres of arterial and distributor level roads over the 25 year life of the plan, both to serve new urban development areas and to accommodate demands on the existing road system. This would include the widening of existing roads.
The regional road network strategy outlined in the Integrated Regional Transport Plan presents a balance between:
moderating traffic growth and giving priority to public transport and high occupancy vehicles;
widening and upgrading existing roads; and
constructing new road links, especially bypasses and ring road connections.
The task of managing and developing the road system involves much more than satisfying demands for private vehicle use. Roads carry many forms of transport should be viewed as multi-modal transport infrastructure. Accordingly, agencies involved in road planning, management and development would need to adopt a multi-modal focus.
Road Hierarchy
South-east Queensland roads cater for a range of traffic including:
long distance interstate and inter-regional travel;
medium distance travel between parts of the region, including travel between major cities; and
local movements under about 20 km, often within one urban area.
A road hierarchy provides a clear set of rules for road planning and management. A range of road hierarchy classifications is used across south-east Queensland. The Integrated Regional Transport Plan supports the adoption of a single hierarchy which is based on existing classifications. Each level of the hierarchy should reflect the function

Tugun Bypass Environmental Impact Statement Technical Paper Number 3
Traffic and Transport
Queensland Department of Main Roads 4-3
of the road in meeting transport movements of all modes and supporting desired land use objectives. Construction and management of individual roads must build on and support the road hierarchy and recognise the relationship of each road to higher and lower order roads in the network.
Roads defined in the Integrated Regional Transport Plan are as follows:
national interstate or inter-regional highways linking south-east Queensland to other state capitals and the major regions of Queensland;
inter-urban arterial roads linking the region's urban areas to each other, including key regional centres, major employment, industry and business centres and population centres;
local arterial roads linking local activities and housing to each other and cater for movements within urban areas. In some cases these roads will carry very high traffic volumes, especially in peak commuting periods;
local distributor and collector roads providing for movement of cyclists, public transport and general motor traffic through neighbourhoods; and
local streets sharing spaces for local traffic, cyclists and pedestrians.
The Integrated Regional Transport Plan deals primarily with the network of strategic roads which are important for movement across and beyond the region. Lower order roads would be addressed through integrated local transport plans and local planning schemes. However, as the road network is an interconnected system, both strategic and local roads need to be considered within the same management framework.
The adopted road hierarchy will take into account specific provision for:
a public transport priority system of busways, bus only lanes and transit lanes;
priority lanes for congested roads for high occupancy vehicles;
accommodating pedestrians and cyclists;
designated routes for extra large freight vehicles and carriage of dangerous goods; and
management of traffic to make better use of the existing road system.
Priority Use of Road Space
Since road-based vehicles will continue to meet the majority of public passenger demands, management of the road system will play a crucial role in meeting the targets for increased market share for public transport. In urban areas where congestion is experienced, the progress of public transport vehicles will be assisted through measures such as:
exclusive rights-of-way or separate roadways;
separate lanes for exclusive public transport use;
bus priority through traffic signals and queue jump lanes; and
high occupancy vehicle or transit lanes which are shared by buses and multi-occupant private vehicles.
Travel Demand Management
Travel demand management measures endeavour to satisfy a particular need without increasing the capacity of the transport system. The primary focus of travel demand

Tugun Bypass Environmental Impact Statement Technical Paper Number 3 Traffic and Transport
4-4
management is on influencing travel demand to generate more efficient use of the existing transport capacity. Measures include:
community education and promotion of alternative modes, especially public transport, ride sharing, walking and cycling;
priority to higher efficiency passenger vehicles;
using technology and more flexible operating hours for education, shopping and employment to share the load better and make best use of the available transport system capacity;
support for ride-sharing schemes;
rationalised parking policy so parking is not easier and cheaper than using public transport; and
considering transport pricing measures, so that the cost of each trip becomes apparent.
Better Planning of Road Needs
A key issue for the region is resolving the need for new or upgraded major roads to connect major urban development corridors. In the past, the need for new roads has centred on congestion, but investigation into new road opportunities must be undertaken within a broader context which:
investigates underlying reasons for the network deficiencies and develops and tests a range of solutions aimed at alleviating the problems;
ensures a maximum number of predicted trips are carried on public transport and where appropriate, by walking and cycling in accordance with the Integrated Regional Transport Plan mode share targets;
supports agreed regional development outcomes including the development of new employment and industry areas and freight transport;
considers the options for maximising service delivery of existing roads alongside proposals to provide new facilities. This includes increasing the proportion of higher occupancy vehicles using the roads;
assesses the potential alternative uses of the funding to provide high quality alternative urban transport solutions;
explicitly assesses and considers in total cost estimates the need for further investment in roads to alleviate congestion created in other parts of the system by construction of the new road (especially where adding capacity merely transfers the problem to a location where construction is difficult or expensive); and
gives the fullest possible consideration to the cost of impacts on communities and the environment before deciding whether to proceed with a road proposal.
Local Arterial Roads and Local By-Passes
Poorly planned new urban communities along the periphery of major national highways and inter-regional roads can cause traffic impacts on these roads. This can be avoided by providing an adequate network of local arterial roads. The number and spacing of highway interchanges should also be rationalised.
A key need is to ensure that the local arterial road systems provide alternatives to avoid choke points in the inter-urban road system, especially at river crossings. Widening existing roads which pass through commercial areas can bring local traffic, through

Tugun Bypass Environmental Impact Statement Technical Paper Number 3
Traffic and Transport
Queensland Department of Main Roads 4-5
traffic and pedestrians into conflict and in these cases, new roads may provide a better solution.
Objectives
The objectives of the Integrated Regional Transport Plan (Queensland Transport 1997a) which are of relevance to the need for the proposed Tugun Bypass are listed as follows:
providing efficient and sufficient road capacity – by planning to meet moderated traffic demands and accommodate the growth of the urban areas of the region;
ensuring the efficient movement of freight – by high quality rail, road, air and sea links and intermodal facilities; and
providing improved facilities for pedestrians and cyclists.
The proposed Tugun Bypass meets these objectives by:
providing sufficient road capacity to cater for traffic growth in the Gold Coast–Tweed corridor and providing a more efficient route for longer distance trips in the region;
providing a more efficient route for road freight vehicles through Tugun and for road freight vehicles accessing Gold Coast Airport; and
reducing traffic volumes on the Gold Coast Highway and its service roads so as to improve facilities for pedestrian and cyclist movement in these areas.
Figure 4.1 shows the Gold Coast Strategic Transport Opportunities as included in the Integrated Regional Transport Plan. Relevant corridor opportunities are described in Table 4.1.
Table 4.1: Strategic Transport Opportunities Relevant to the Proposed Tugun Bypass
Code Corridor Concept
GC1 Runaway Bay to Coolangatta public transport priority
Improve flow conditions for buses and visibility of bus system. Allow for incorporation of light rail or other new transport modes as demand dictates.
GC8 Pacific Motorway Upgrade to cope with growth and serve as a regional connection. Supporting measures are included to ensure that the highway can continue to serve its regional role.
GC9 Tugun Bypass Further improve standard of Highway 1 and allow old highway to cater for local movements.
Source: Integrated Regional Transport Plan for South East Queensland (Queensland Transport 1997a).
Traffic diverted from the Gold Coast Highway onto the proposed Tugun Bypass would provide the opportunity for consideration of dedicated corridor space for public transport, such as a bus lane or light rail.
The upgrading of the Gold Coast Highway to six lanes would be required without the proposed Tugun Bypass. The proposed bypass would enable any future upgrading of the Gold Coast Highway to be used for public transport, rather than as general traffic lanes.
To achieve the above objectives, the Integrated Regional Transport Plan has developed the following Key Actions (KA) relevant to the Tugun area:
implement measures to sustain the road hierarchy (KA 8.2);

�
�
�
�
�
�
�
��
�
�
�
�
�
�
�
�
�
�
�
�
����&��������&��������&����
�%�����%�����%����
������������������
-��&�-��&�-��&�
%�����%�����%�����
�%%�����%%�����%%����
%3��+%� %3��+%� %3��+%�
��&���/�&���&���/�&���&���/�&�
������-������-������-��-��-��-
�%���%��%���%��%���%�
���+�������� ������+�������� ������+�������� ���
��%� �������%� �������%� �����
���������������
���&�������&�������&����
�%%&������%%&������%%&�����
������������������������������������������������
�
�(!)'$%&"��
��������������������� ����*���� ��� �����+ ��������������,�������������-����������������������������.������/�������0������������������*��� ���, ��1�������,�����+ ���2�*����������������� ����*���� ���*���������� ������-�������0*�3�*�/��,���� ����������� ��+ ����3���,��*����*��������4��
�Figure 4.1 � ������������� ����� ��������� 4������������������"��� ������%������ �����
��������"���
Sour
ce: I
nteg
rate
d Re
gion
al Tr
ansp
ort P
lan fo
r Sou
th E
ast Q
ueen
sland
Strategic Transport Opportunities
Enhanced Existing Corridors
Transport Network Opportunities
Long Term Opportunities
Proposed Tugun Bypass
Existing Major Roads
Existing Rail Line
Queensland/NSW Border
Primary Activity Centres
Activity Centres
New Transport Interchange
Major Urban Growth
Gold Coast Airport

Tugun Bypass Environmental Impact Statement Technical Paper Number 3
Traffic and Transport
Queensland Department of Main Roads 4-7
investigate strategic road opportunities as per Integrated Regional Transport Plan maps (KA 8.11b);
ensure Pacific Motorway can cope well into the future (KA 8.15); and
designate freight roads and develop a strategic regional freight network (KA 9.6).
4.1.3 Gold Coast City Transport Plan
Balancing the Needs
On current trends, travel demand in the Gold Coast City will double in less than 20 years. The current transport system will not cope and major traffic congestion and consequential environmental impacts are likely to occur. Creating an integrated, safe and efficient transport system would be a cumulative process over the next 30 years. It would have a major influence on several areas, including the City’s competitiveness as a tourist destination.
A balanced and integrated transport and land use strategy is required which:
provides high quality alternatives to car travel;
reduces the need to travel;
restrains the growth of excessive vehicle travel; and
provides targeted enhancement of road network capacity and safety.
Alternative energy and fuel sources must also receive increasing emphasis as the number of vehicles on the road system continues to increase.
Principles for the Creation of an Integrated, Sustainable Transport System
In an era of scarce public resources it is essential that investments in transport yield the greatest possible benefits. A set of eight guiding principles has been adopted to assist in the preparation of actions and strategies under the Gold Coast City Transport Plan(Gold Coast City Council 1998):
a multi-modal approach;
integration of road transport, public transport, walking and cycling;
integration of transport decisions with land use strategies;
maximum use of beneficial technology;
minimising emissions to the environment;
ensuring efficient use of roads;
attention to lower cost solutions; and
achievement of a better balance between land use and transport.
Targeting the Future
Success in implementing the Gold Coast City Transport Plan will rely on the sustained commitment of government agencies and the public to carry out identified actions. An important part of this is ensuring that day to day actions are consistent with the long-term objectives of the plan.
About 3.5 percent of all trips were taken by public transport in Gold Coast City in 1995. The Integrated Regional Transport Plan sets Gold Coast City a target of seven percent of all trips by 2011, or just over double the current proportion of trips taken by public transport. A further 100 percent increase on the 2011 target is sought by 2030.

Tugun Bypass Environmental Impact Statement Technical Paper Number 3 Traffic and Transport
4-8
A New Way to Plan Road Capacity
Roads will continue to accommodate over 90 percent of all travel in the foreseeable future, through a variety of different modes. The Gold Coast City Transport Plan has undertaken a major review of future road requirements covering short-, medium- and long-term planning horizons. The strategy adopted by the Gold Coast City Transport Plan embodies the following elements:
integrated planning to balance the need to cater for growth of travel demand alongside the need to increase public transport and non-motorised travel and reduce the impact of motor traffic;
recognition of the need to restrain the growth of motorised travel demand so it is more in line with population growth;
strategic investment to make the best use of existing infrastructure;
harnessing technology to enhance efficiency; and
targeted new construction to meet the needs for new growth areas of the City.
Road Network Planning
The Gold Coast City Transport Plan proposes a functional road hierarchy that takes into account the land use issues associated with the use of each road, with road function primarily determined by:
the size of the population catchment it serves;
the status and importance of the activity centres it serves; and
the type of traffic having business on the road.
Under this system, more emphasis is placed on the type of traffic using the road and where it is going, rather than on the volume of traffic accommodated. A proposed functional road hierarchy separates the roads into two broad categories:
streets for local access, pedestrians and cyclists and collection of local traffic, termed access streets and collector streets; and
roads for through traffic, termed highways, arterial roads and distributor roads.
A suitable level of service must be maintained relative to the economic value of each road and its rank in the functional hierarchy. Interchange and intersection spacing is critical in maintaining efficient traffic flow and safety on roads. The use of signalised intersections is preferred over roundabouts, as they have a greater capacity, consume less land and are less problematic for pedestrians and cyclists.
Strategies for Individual Roads
The Gold Coast Highway is already carrying volumes of traffic incompatible with its location in a key tourist corridor of the City. Widening of this road would only encourage further traffic growth and hence, major improvements to public transport are needed in the corridor to reduce vehicle growth. An upgraded line haul system of bus priority measures, moving to light rail or dedicated busway in the future would provide a better balance and make a real contribution to the character of the beachside precinct. The road system would also be configured to take through-traffic away from the Gold Coast Highway and promote the use of more westerly arterial routes for cross city journeys. The supply of long-stay parking in the beachside area also needs to be restrained in order to avoid pressures to improve road access.

Tugun Bypass Environmental Impact Statement Technical Paper Number 3
Traffic and Transport
Queensland Department of Main Roads 4-9
Capital Improvements to the Road Network
Targeted new construction will need to meet the requirements of the new growth areas of the City and improve the safety and efficiency of the existing road network. The needs for the future also have to be balanced against the ability to implement road improvements in the face of increasing community resistance to transport projects and the ability to obtain funding under likely investment scenarios. The realistic planning period for major capital works spans from 2000/1 to 2029/30. The Gold Coast City Transport Plan states that the importance of road network capital investment needs should be divided into three levels as follows:
short-term (five year) capital works priorities, planning horizon 2006;
medium-term (10 year) capital works priorities, planning horizon 2011; and
longer-term capital works opportunities, planning horizon 2030.
Safety on the Road System
The Gold Coast City Council and local offices of Queensland Transport and Department of Main Roads will play a strong role in reducing levels of accidents on the roads and public transport system to below the national average. Road safety audits assess the road environment with the aim of ensuring that the traffic system, including designs, signage, line marking and control devices help road users to drive safely. Gold Coast City Council conducts safety audits for all proposed road projects and has an ongoing program of progressively auditing existing roads. These can be used to determine funding priorities.
There are four main actions recommended to improve road safety:
improve safety on rural and semi-rural roads;
continue urban speed management program including posting of 50 km/h speed limits in those residential streets where the management priority is for access to local housing or businesses;
make road safety an explicit priority in planning for new land use and development; and
provide appropriate delineation between local roads and major highways for heavy vehicles.
The key strategy proposals from the Gold Coast City Transport Plan are shown in Figure 4.2.
The following key strategy proposals of relevance to the Tugun area are:
Tugun Bypass: extension of the Pacific Motorway west of Gold Coast Airport to link with Tweed Heads Bypass in NSW; and
Gold Coast Highway: downgraded to coastal distributor to reduce the impact of traffic growth in key tourist precincts.
The Gold Coast City Transport Plan recognises the need to upgrade and maintain the Pacific Motorway as the single major road access between Brisbane and the Gold Coast.
The proposed Tugun Bypass is consistent with Gold Coast City Council’s road network objective in that it would increase the efficiency and safety of the road system while accommodating the needs of all road users.
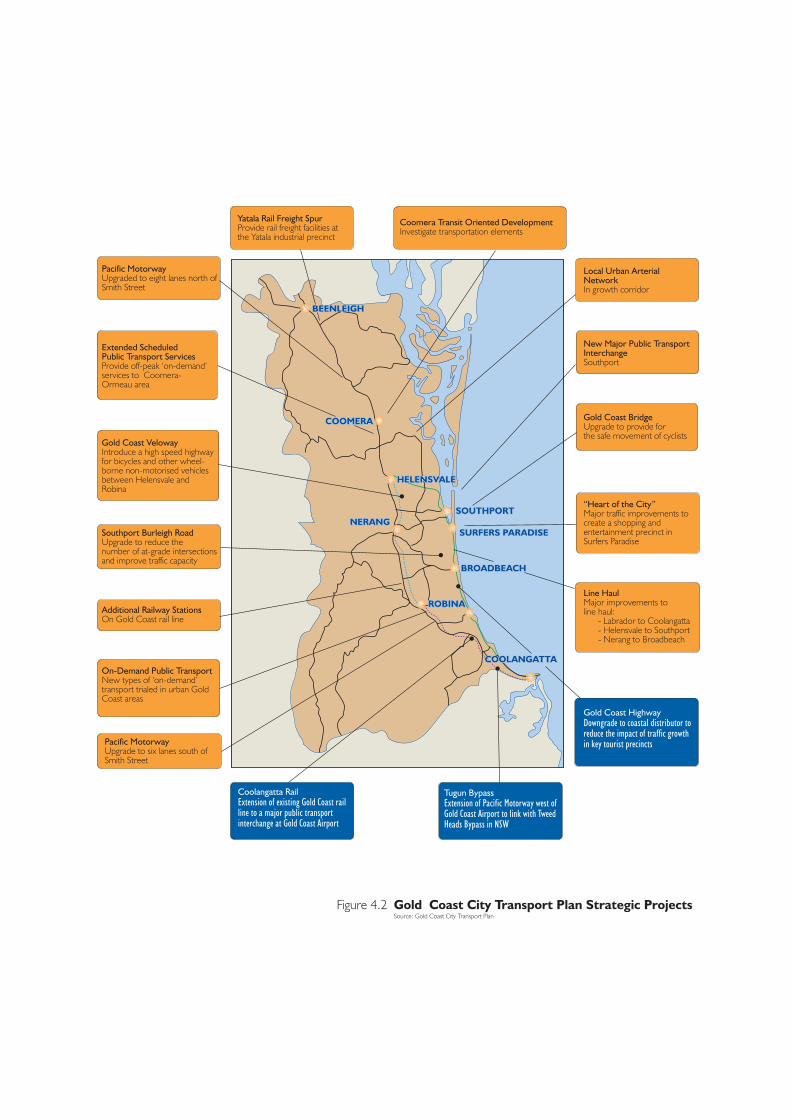
����&��������&��������&����
�%%�����%%�����%%����
��&���/�&���&���/�&���&���/�&�
���+�������� ������+�������� ������+�������� ���
�%���%��%���%��%���%�������������������
��%� �������%� �������%� �����
�%�����%�����%����
�%%&������%%&������%%&�����
Figure 4.2 ������������������ ��������� ���������"����5�"��
4�������5���,�� �Provide rail freight facilities atthe Yatala industrial precinct
������������6�������7�8��� ����Investigate transportation elements
0*�3�*�9�����Upgraded to eight lanes north ofSmith Street
�-������� *,������0����*���� ��� �8�*��Provide off-peak ‘on-demand’services to Coomera-Ormeau area
����������:�����Introduce a high speed highwayfor bicycles and other wheel-borne non-motorised vehiclesbetween Helensvale andRobina
���, ���������,����Upgrade to reduce thenumber of at-grade intersectionsand improve traffic capacity
���������������� ������On Gold Coast rail line
6�17�����0����*���� ��New types of ‘on-demand’transport trialed in urban GoldCoast areas
0*�3�*�9�����Upgrade to six lanes south ofSmith Street
������������+#� ��� ����#���� ������������������ ��������,���*� ������� �*���� ����� ������������������*���
�������� ��+#� ��� ������������!���������������������������*��������� $������������"�*����� �'�(
����������/��,����� �������������������� ����������������*���������������������� �$����������*��� ���
2����/��Major improvements toline haul:
- Labrador to Coolangatta- Helensvale to Southport- Nerang to Broadbeach
;/����3��,������<Major traffic improvements tocreate a shopping andentertainment precinct inSurfers Paradise
���������������Upgrade to provide forthe safe movement of cyclists
=���9>��0����*���� ��?���*,���Southport
2�*��+��������=�����In growth corridor
Source: Gold Coast City Transport Plan

Tugun Bypass Environmental Impact Statement Technical Paper Number 3
Traffic and Transport
Queensland Department of Main Roads 4-11
4.2 Resolving Traffic Issues
4.2.1 Resolving Functional Issues
The Pacific Motorway (including the Tweed Heads Bypass) is the primary road connection between south-east Queensland and northern NSW. As such, its function, for the majority of its length, is the efficient movement of people and goods between these areas, catering predominantly for longer-distance trips. The Pacific Motorway, to the north of Stewart Road, is currently of a relatively high standard with grade separated interchanges and access restrictions. The Tweed Heads Bypass, to the south of Gold Coast Airport, also provides a high speed, high quality road with grade separated interchanges and full access control. The Pacific Motorway, to the north of Stewart Road and the Pacific Highway from the Tweed Heads Bypass south, is classified as a Intra-State Highway within Gold Coast City Council's Coolangatta functional road hierarchy (Gold Coast City Council 1998).
The Gold Coast Highway, between the Pacific Motorway and the Tweed Heads Bypass, is a four-lane, median divided road, classified as a sub-arterial in the Gold Coast functional road hierarchy. There are a number of at-grade intersections along this section, some of which are signalised and some priority controlled. Service roads either side of the Gold Coast Highway collect and distribute local trips to intersections with the Gold Coast Highway.
There is currently a range of traffic functions that this section of the Gold Coast Highway is required to accommodate. In addition to through-traffic movement between the Pacific Motorway and Tweed Heads Bypass, this section of road caters for local cross movements from residences to local activities along the coastline. This section of the Gold Coast Highway also caters for trips between northern areas and Coolangatta as well as drop-in trips to commercial properties located along the coastline. It also plays an important role in access to/from Gold Coast Airport.
Figure 4.3 shows a number of these functional conflicts.
There is also a range of road users who travel this section of road, each with different expectations with regard to the travelling environment. Tourists, pedestrians, cyclists, heavy vehicles, local buses, regional buses, local traffic and through-traffic are all competing for the road space along this section.
This mixing of functions and road user expectations results in a range of safety and traffic movement efficiency concerns. Different speed expectations of local and through-traffic, coupled with the need for frequent access between the service roads and the Gold Coast Highway has resulted in regular interruptions of the traffic stream and associated safety concerns.
The proposed Tugun Bypass addresses these functional conflicts by:
providing the missing link of inter-state highway in the road hierarchy;
separating through and local movement functions to improve both the safety and efficiency of these movements; and
localising the role/hierarchy classification of the Gold Coast Highway, with an improved ability to cater for pedestrians, cyclists, local bus and local traffic movements.

���
��
Proposed Tugun BypassGold Coast Airport BoundaryQueensland/NSW BorderProposed Access BridgesTunnel
Conflicts between local and throughtrafficGood separation between local andthrough traffic
�
Figure 4.3 +� "��� ����� #��"���� ��$���������������$!��
���������������������������������������������������������������������
������������������������������
������������
������������������������������������������������
��� ��� ��� ��� ���� ���� �
��� ��� ��� ��� �������� �������� �����
���� ����� ����� �
������������
������������
������������
���
���
����
�
���
���
����
�
���
���
����
�
���������
�������
�
���������
�������
�
���������
�������
�
���
�������
���
���
�������
���
���
�������
���
����� ����������� ����������� ������
"�������"�������"�������
�� �
��� �
�� �
��� �
�� �
��� �
������������
������������
������������
������ �
������ �
������ �
�������%��
�������%��
�������%��
!����
����
�!�
��� ��
���
!����
����
�
����� ����������� ����������� ������
��������!���������������!���������������!�������
!�� !�� !�� ������������
"� � �"� � �"� � �
������������
!�� ��������!�� ��������!�� ��������
����
�������
�����
���
���������
�����
���
���������
�����
�
!�������
�
!�������
�
!�������
�
����� ��
���
����� ��
���
����� ��
���
��#� �������#� �������#� �����
� ������
� ������
� ������ ����������
����������
����������
!�����������
!�����������
!�����������
!�����!�����!����� ������������
���������������������������������
������
������
������
������
������
������
��$
��$
��$
%��%��%��
��������!�
�����
���������!�
�����
���������!�
�����
�
!� ����
����
!� ����
����
!� ����
����
!����
���
���
!����
���
���
!����
���
���
&� ����
�&�
����
�&�
����
�
����� ���������� ���������� �����
%��%��%��
'��������(���'��������(���'��������(���
������������ ������������
��
����
�"�*��
�
��
����
�"�*��
�
��
����
�"�*��
�
)� �)� �)� ��� �� ��
���������������
������������
���������������
������������
������-��������*�+��/�+���**�).���.���� ��+��)�����**�)��.����$+������+�)���$)�)��������-/���)�/���
0�����-��������*��)������+��/�+���**�).���.���
0������-�����������)+��������������-��������*��)������+��/�+.���.����*���**�)
1��+-���������)���������.����

Tugun Bypass Environmental Impact Statement Technical Paper Number 3
Traffic and Transport
Queensland Department of Main Roads 4-13
4.2.2 Traffic Volumes
Traffic volumes have been determined using the Gold Coast EMME/2 transport model.
The following traffic volume scenarios have been prepared:
year 2007, no Tugun Bypass: no changes to the road network between 2002 and 2007;
year 2007, with Tugun Bypass: proposed Tugun Bypass implemented as a four lane highway;
year 2017, no Tugun Bypass: Pacific Motorway and Gold Coast Highway are not widened to six lanes to cater for growth in traffic and demand would exceed its capacity at this time; and
year 2017, with four lane Tugun Bypass: Tugun Bypass, Pacific Motorway and Gold Coast Highway at four lanes;
Figure 4.4 presents the 2007 traffic volume scenarios with and without the Tugun Bypass and Figure 4.5 shows the 2017 traffic volume scenarios.
Figure 4.4 shows some 55 percent of the traffic on the Gold Coast Highway diverting to the proposed Tugun Bypass in 2007. Figure 4.5 shows that in 2017, approximately 55 percent of traffic through the Tugun-Bilinga corridor would also use the proposed four-lane Tugun Bypass.
Figure 4.5 shows that the daily volume on the Tugun Bypass in 2017 is estimated to be 59,600 vehicles per day. A level of service analysis was undertaken to determine the ability of the road to accommodate the predicted traffic volumes during the maximum one-hour traffic volume period (peak hour). The analysis and results, shown in Section 7.6, indicate that the bypass would operate at Level of Service (LOS) C/D in 2017, which is at the upper limit of an acceptable level of service for a four-lane Tugun Bypass.
Figure 4.4 and 4.5 both indicate a shift from the Gold Coast Highway to the Pacific Motorway, north of Tugun. This shift is a result of motorists using the proposed Tugun Bypass selecting the Pacific Motorway in preference to the Gold Coast Highway as their route choice north of Tugun.
4.2.3 Traffic Congestion: Road Links
Peak hour/capacity ratios (percent of capacity used) have been estimated for each scenario listed in Section 4.2.2. Figure 4.6 presents the year 2007 volume/capacity ratios and Figure 4.7 shows the year 2017 volume/capacity ratios.
The level of service analysis for the Tugun Bypass has adopted the AUSTROADS standard for the calculation of lane capacity. This results in a lane capacity of 1,935 vehicles per hour. Full level of service analysis is included in Section 7.6.
Figure 4.6 shows that the Gold Coast Highway, south of the Pacific Motorway, operates in over-capacity conditions during the maximum peak hour in the absence of the proposed Tugun Bypass in 2007. The opening of the proposed bypass in 2007 improves the Gold Coast Highway in this location so that it would operate at approximately 50 percent of its capacity during the maximum peak hour. In the same way, the proposed Tugun Bypass improves operating conditions on the Tweed Heads Bypass between the Gold Coast Highway and its interchange with the proposed Tugun Bypass.

���
��
Gold Coast Airport BoundaryQueensland/NSW BorderKey Local and Regional RoadsProposed Tugun BypassNo Tugun BypassWith 4 Lane Tugun Bypass
�
Figure 4.4 Year 2007 Daily Traffic Volumes
!$#'��
!$#'��
Sour
ce: G
old
Coa
st E
MM
E/2
mod
el m
odifie
d by
Par
sons
Brin
cker
hoff
�$#'��
'!#(��
)!#)��&"#(��
'!#(��)&#���
%$#$��$!#���
��#"��(&#���
�'#!���)#(��
!�#$��$�#%��
)$#���1
!&#"��&)#%��
�)#'��1
()#���!!#&��
���������������������������
������������������������������������������
������������������������������
������������
������������������������������������������������
��� ��� ��� ��� ���� ���� �
��� ��� ��� ��� �������� �������� �����
���� ����� ����� �
������������
������������
������������
���
���
����
�
���
���
����
�
���
���
����
�
���������
�������
�
���������
�������
�
���������
�������
�
���
�������
���
���
�������
���
���
�������
���
����� ����������� ����������� ������
������������
�� �
��� �
�� �
��� �
�� �
��� �
������������
������������
������������
������ �
������ �
������ �
�������%��
�������%��
�������%��
!����
����
�!�
��� ��
���
!����
����
�
����� ����������� ����������� ������
��������!���������������!���������������!�������
!�� !�� !�� ������������
"� � �"� � �"� � �
������������
!�� ��������!�� ��������!�� ��������
����
�������
�����
���
���������
�����
���
���������
�����
�
!�������
�
!�������
�
!�������
�
����� ��
���
����� ��
���
����� ��
���
��#� �������#� �������#� �����
� ������
� ������
� ������ ����������
����������
����������
!�����������
!�����������
!�����������
!�����!�����!����� ������������
���������������������������������
������
������
������
������
������
������
��$
��$
��$
%��%��%��
��������!�
�����
���������!�
�����
���������!�
�����
�
!� ����
����
!� ����
����
!� ����
����
!����
���
���
!����
���
���
!����
���
���
&� ����
�&�
����
�&�
����
�
����� ���������� ���������� �����
%��%��%��
'��������(���'��������(���'��������(���
������������ ������������
�����
��"�*
���
�����
��"�*
���
�����
��"�*
���
)� �)� �)� ��� �� ��
���������������
������������
���������������
������������
"��"��"��
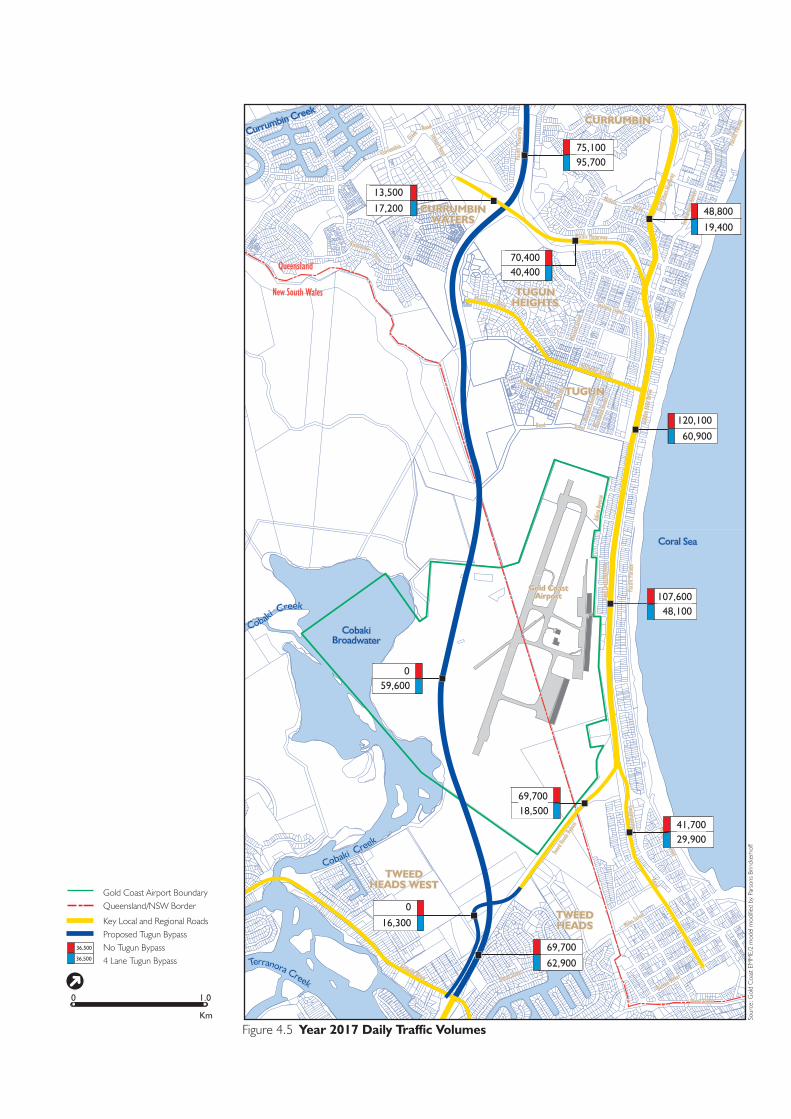
���
��
Gold Coast Airport BoundaryQueensland/NSW Border
Key Local and Regional RoadsProposed Tugun BypassNo Tugun Bypass4 Lane Tugun Bypass
�
Figure 4.5 -����)*,.� �������##�"�/���'��
!$#'��
!$#'��
Sour
ce: G
old
Coa
st E
MM
E/2
mod
el m
odifie
d by
Par
sons
Brin
cker
hoff
���������������������������
������������������������������������������
������������������������������
������������
������������������������������������������������
��� ��� ��� ��� ���� ���� �
��� ��� ��� ��� �������� �������� �����
���� ����� ����� �
������������
������������
������������
���
���
����
�
���
���
����
�
���
���
����
�
���������
�������
�
���������
�������
�
���������
�������
�
���
�������
���
���
�������
���
���
�������
���
����� ����������� ����������� ������
������������
�� �
��� �
�� �
��� �
�� �
��� �
������������
������������
������������
������ �
������ �
������ �
�������%��
�������%��
�������%��
!����
����
�!�
��� ��
���
!����
����
�
����� ����������� ����������� ������
��������!���������������!���������������!�������
!�� !�� !�� ������������
"� � �"� � �"� � �
������������
!�� ��������!�� ��������!�� ��������
����
�������
�����
���
���������
�����
���
���������
�����
�
!�������
�
!�������
�
!�������
�
����� ��
���
����� ��
���
����� ��
���
��#� �������#� �������#� �����
� ������
� ������
� ������ ����������
����������
����������
!�����������
!�����������
!�����������
!�����!�����!����� ������������
���������������������������������
������
������
������
������
������
������
��$
��$
��$
%��%��%��
��������!�
�����
���������!�
�����
���������!�
�����
�
!� ����
����
!� ����
����
!� ����
����
!����
���
���
!����
���
���
!����
���
���
&� ����
�&�
����
�&�
����
�
����� ���������� ���������� �����
%��%��%��
'��������(���'��������(���'��������(���
������������ ������������
��
����
�"�*��
�
��
����
�"�*��
�
��
����
�"�*��
�
)� �)� �)� ��� �� ��
���������������
������������
���������������
������������
"��"��"��
)&#&��
�"#)��
%'#���"'#%��
��%#$��)&#���
�!#'��
�%#(��
%�#)��)�#)��
�'"#$��
�
�$#!��
$"#%��
$(#"��
�(�#���
$�#"��
)�#%��("#"��
$"#%���&#'��

���
��
Gold Coast Airport BoundaryQueensland/NSW BorderNo Tugun BypassWith 4 Lane Tugun BypassKey Local and Regional RoadsProposed Tugun Bypass
�
Figure 4.6 -����)**.���6�'�'����1������/���'�7����"����������
Sour
ce: G
old
Coa
st E
MM
E/2
mod
el m
odifie
d by
Par
sons
Brin
cker
hoff
@@
���������������������������
������������������������������������������
������������
������������������������������������������������
��� ��� ��� ��� ���� ���� �
��� ��� ��� ��� �������� �������� �����
���� ����� ����� �
������������
������������
������������
���
���
����
�
���
���
����
�
���
���
����
����������
�������
���
�������
�������
���
�������
�������
�
���
�������
���
���
�������
���
���
�������
���
����� ����������� ����������� ������
������������
�� �
��� �
�� �
��� �
�� �
��� �
������������
������������
������������
������ �
������ �
������ �
�������%��
�������%��
�������%��
!����
����
�!�
��� ��
���
!����
����
�
����� ����������� ����������� ������
��������!���������������!���������������!�������
!�� !�� !�� ������������
"� � �"� � �"� � �
������������
!�� ��������!�� ��������!�� ��������
�������������$!��
�������������$!��
�������������$!��
!�������
�
!�������
�
!�������
�
����� ��
���
����� ��
���
����� ��
���
��#� �������#� �������#� �����
� ������
� ������
� ������ ����������
����������
����������
!�����������
!�����������
!�����������
!�����!�����!����� ������������
���������������������������������
������
������
������
������
������
������
��$
��$
��$
%��%��%��
��������!�
�����
���������!�
�����
���������!�
�����
�
!� ����
����
!� ����
����
!� ����
����
!����
���
���
!����
���
���
!����
���
���
&� ����
�&�
����
�&�
����
�
����� ���������� ���������� �����
%��%��%��
'��������(���'��������(���'��������(���
������������ ������������
��
����
�"�*��
�
��
����
�"�*��
�
��
����
�"�*��
�
)� �)� �)� ��� �� ��
���������������
������������
���������������
������������
"��"��"��
%(@A���@
''@A���@
($@$(@
"(@&$@
$"@$�@
'(@1
&'@1
%�@'%@
()@%)@
������������������������������

���
��
�
0& 0& 0&
���������
Figure 4.7��-����)*,.���6�'�'����1������/���'�7����"����������
Sour
ce: G
old
Coa
st C
ounc
il EM
ME/
2 M
odel
(Mod
ified
by P
PK)-
Now
Par
sons
Brin
cker
hoff
Gold Coast Airport BoundaryQueensland/NSW BorderNo Tugun BypassWith 4 Lane Tugun BypassKey Local and Regional RoadsProposed Tugun Bypass
@@
���������������������������
������������������������������������������
������������������������������
������������
������������������������������������������������
��� ��� ��� ��� ���� ���� �
��� ��� ��� ��� �������� �������� �����
���� ����� ����� �
������������
������������
������������
���
���
����
�
���
���
����
�
���
���
����
�
���������
�������
�
���������
�������
�
���������
�������
�
���
�������
���
���
�������
���
���
�������
���
����� ����������� ����������� ������
������������
�� �
��� �
�� �
��� �
�� �
��� �
������������
������������
������������
������ �
������ �
������ �
�������%��
�������%��
�������%��
!����
����
�!�
��� ��
���
!����
����
�
����� ����������� ����������� ������
��������!���������������!���������������!�������
!�� !�� !�� ������������
"� � �"� � �"� � �
������������
!�� ��������!�� ��������!�� ��������
�������������$!��
�������������$!��
�������������$!��
!�������
�
!�������
�
!�������
�
����� ��
���
����� ��
���
����� ��
���
��#� �������#� �������#� �����
� ������
� ������
� ������ ����������
����������
����������
!�����������
!�����������
!�����������
!�����!�����!����� ������������
���������������������������������
������
������
������
������
������
������
��$
��$
��$
%��%��%��
��������!�
�����
���������!�
�����
���������!�
�����
�
!� ����
����
!� ����
����
!� ����
����
!����
���
���
!����
���
���
!����
���
���
&� ����
�&�
����
�&�
����
�
����� ���������� ���������� �����
%��%��%��
'��������(���'��������(���'��������(���
������������ ������������
��
����
�"�*��
�
��
����
�"�*��
�
��
����
�"�*��
�
)� �)� �)� ��� �� ��
���������������
������������
���������������
������������
"��"��"��
A���@
'$@
&(@A���@
A���@"&@
$�@
%"@
1$$@
1
"'@
&'@
("@
&'@
%!@
A���@
&%@

Tugun Bypass Environmental Impact Statement Technical Paper Number 3 Traffic and Transport
4-18
Figure 4.7 shows that the Tugun Bypass, Gold Coast Highway and all other major roads in the Tugun-Bilinga area would operate below capacity in 2017 during the maximum peak hour.
Capacity constraints at present on the Gold Coast Highway have a direct effect on the operating conditions on the Tweed Heads Bypass. When the proposed Tugun Bypass removes these constraints, local traffic for the Coolangatta area would be free to use the Gold Coast Highway in preference to the Tweed Heads Bypass and Kennedy Drive. This results in lower traffic volumes and better operating conditions on the Tweed Heads Bypass in this location.
4.2.4 Traffic Congestion at Intersections
Traffic assessments have also been undertaken for the main intersections on the Gold Coast Highway that would be affected by the Tugun Bypass.
Assessments were undertaken using the aaSIDRA software for determining the operational performance of intersections.
Table 4.2 shows the predicted operational performance of key intersections on the Gold Coast Highway assuming the Tugun Bypass is not implemented. Clearly by 2002 and 2007 (without the Tugun Bypass) a number of the key intersections on the Gold Coast Highway are forecast to be operating at a very poor level of service with extremely high average delays forecast at many locations in both the morning and evening peak periods.
This situation will be exacerbated by 2017 in line with forecast traffic growth.

Tug
un B
ypas
s En
viro
nmen
tal I
mpa
ct S
tate
men
t Te
chni
cal P
aper
Num
ber
3 Tr
affic
and
Tra
nspo
rt
Qu
een
slan
d D
epar
tmen
t o
f M
ain
Ro
ads
4-19
Tabl
e 4.
2:
SID
RA
Out
puts
– N
o Tu
gun
Byp
ass,
Gol
d C
oast
Hig
hway
Rou
te
Yea
r 20
02
Yea
r 20
07
Yea
r 20
17
Inte
rsec
tion
Ti
me
Ave
rage
D
elay
(s
ec)
Leve
l of
Serv
ice
Deg
ree
of
Satu
rati
on
Ave
rage
D
elay
(s
ec)
Leve
l of
Serv
ice
Deg
ree
of
Satu
rati
on
Ave
rage
D
elay
(s
ec)
Leve
l of
Serv
ice
Deg
ree
of
Satu
rati
on
am
156
F >
1.00
19
5 F
1.58
25
4 F
1.46
St
ewar
t Roa
d pm
15
6 F
>1.
00
185
F 1.
60
>30
0 F
1.43
am
20
D
0.62
21
E
0.69
20
E
0.76
G
old
Coa
st H
ighw
ay1
pm
21
E 0.
68
22
E 0.
74
23
E 0.
87
am
73
F >
1.00
91
F
1.14
>
300
F 1.
51
Tool
ona
Stre
et
pm
166
F >
1.00
25
5 F
1.44
>
300
F 1.
89
am
- -
- 11
5 F
1.17
>
300
F 1.
48
Boy
d St
reet
2
pm
- -
- 20
8 F
1.35
>
300
F 1.
86
am
204
F >
1.00
>
300
F 1.
46
>30
0 F
1.73
K
irri
bin
Stre
et
pm
281
F >
1.00
>
300
F 1.
59
>30
0 F
1.98
am
25
F 0.
91
86
F 1.
13
276
F 1.
39
Term
inal
Dri
ve
pm
36
F 0.
95
140
F 1.
15
>30
0 F
1.53
Not
e 1:
It
shou
ld b
e no
ted
that
the
Pac
ific
Mot
orw
ay/G
old
Coa
st H
ighw
ay i
nter
sect
ion
is c
apac
ity c
onst
rain
ed b
y th
e ad
jace
nt d
owns
trea
m i
nter
sect
ion
at T
oolo
na S
tree
t. Th
is i
nter
actio
n ca
uses
que
ues
to b
lock
bac
k to
the
Gol
d C
oast
Hig
hway
inte
rsec
tion,
ther
eby
adve
rsel
y af
fect
ing
its p
erfo
rman
ce.
2:
Th
e B
oyd
Stre
et/G
old
Coa
st H
ighw
ay in
ters
ectio
n is
not
pro
pose
d to
be
cons
truc
ted
until
the
com
men
cem
ent o
f the
Cob
aki L
akes
dev
elop
men
t, w
ith th
e ul
timat
e la
yout
(as
asse
ssed
in
yea
r 20
07 a
nd 2
017)
req
uire
d w
hen
the
cond
ition
s of
the
Twee
d Sh
ire
Cou
ncil
Dev
elop
men
t Con
trol
Pla
n N
umbe
r 17
– C
obak
i Lak
es (T
wee
d Sh
ire
Cou
ncil
1995
) are
rea
ched
.
3:
Fo
r de
tails
on
Leve
l of S
ervi
ce r
efer
to C
hapt
er 7
.

Tugun Bypass Environmental Impact Statement Technical Paper Number 3 Traffic and Transport
4-20
4.2.5 Improved Travel Times and Reduced Travel Distances
The inclusion of the proposed Tugun Bypass results in a saving in daily vehicle-hours travelled and vehicle-kilometres travelled for year 2007 scenarios, as shown in Table 4.3.
Table 4.3: Forecast Changes in Road Network Performance, 2007
Scenario Vehicle-Hours Travelled (per day)
Vehicle-Kilometres Travelled (per day)
Year 2007, no Tugun Bypass (Gold Coast Highway not upgraded)
1,064,000 48,408,000
Year 2007, with four-lane Tugun Bypass (Gold Coast Highway not upgraded)
1,032,000 48,372,000
Change due to bypass -32,000 -36,000
Note: 1 Based on the entire Gold Coast EMME/2 model network. 2 Rounded to the nearest thousand. Source: Gold Coast EMME/2 Model (Modified by Parsons Brinckerhoff).
Table 4.4 shows the year 2017 vehicle-hours travelled and vehicle-kilometres travelled associated with the implementation of the proposed Tugun Bypass.
Table 4.4: Forecast Changes in Road Network Performance, 2017
Scenario Vehicle-Hours
Travelled (per day) Vehicle-Kilometres Travelled (per day)
Year 2017, no Tugun Bypass (Gold Coast Highway not upgraded)
1,289,000 57,136,000
Year 2017, with four-lane Tugun Bypass (Gold Coast Highway not upgraded)
1,216,000 57,163,000
Change due to Bypass -73,000 27,000 Note 1: Based on the entire Gold Coast EMME/2 model network. 2: Rounded to the nearest thousand. Source: Gold Coast EMME/2 Model (Modified by Parsons Brinckerhoff).
Table 4.5 shows the change in travel times associated with the introduction of the proposed Tugun Bypass.
Table 4.5: Travel Times for Key Trips through Tugun
Travel Time Stewart Road to Kennedy Drive (Minutes)
Via Gold Coast Highway1
Via Tugun Bypass Scenario
am pm am pm
2002 - current configuration 9-11 12 - -
2007 - no bypass >30 >30 - -
- four lane bypass 8 8 5 5
2017 - no bypass >30 >30 - -
- four lane bypass 9 9 5 5
Note 1: Current configurations Source: Gold Coast EMME/2 model (modified by Parsons Brinckerhoff).

Tugun Bypass Environmental Impact Statement Technical Paper Number 3
Traffic and Transport
Queensland Department of Main Roads 4-21
The travel times in Table 4.5 indicate that conditions on the Gold Coast Highway are expected to deteriorate rapidly over the next four years as its capacity is approached during peak periods. The roadway is expected to experience traffic growth of some 12 percent over this four-year period. The travel times predicted are consistent with the volume-capacity ratios forecast for the highway. As the volume of traffic on the highway approaches its capacity and eventually exceeds it, travel times over each section of the route would increase considerably.
Daily volumes along the Gold Coast Highway in its existing configuration in 2007 are expected to reach 89,000 vehicles in the absence of the bypass. This would significantly exceed its capacity of 60,000 vehicles per day heading to increasing travel times through the corridor.
The introduction of the Tugun Bypass would add considerable additional capacity within the corridor providing free-flowing conditions on both routes between Stewart Road and Kennedy Drive. Differences in travel times on the bypass and the highway are a reflection of the differing conditions along these routes.
The excessive travel times expected in 2007 if the Tugun Bypass is not built indicate a situation which would result in changes in traveller behaviour and intense pressure for measures to alleviate the situation. As there are no alternative routes through the local area, travel changes would include diversion of long distance traffic onto other inland routes and local travel shifting to times outside the peak. Both of these would have implications for economic development and the possibility of their occurrence is further justification for the proposal and a clear indication that action is needed to avoid the consequences of the do-nothing alternative.
4.2.6 Reducing Crash Impacts
Crash data available for the section of the Pacific Motorway between Stewart Road and the Gold Coast Highway, the section of the Gold Coast Highway between the Pacific Motorway and the Tweed Heads Bypass and the section of the Tweed Heads Bypass between the Gold Coast Highway and the Queensland-NSW border, have been reviewed. These data were available between the years of 1992 and 2000. Table 4.6 below identifies the number of crashes by their severity for each year.

Tugun Bypass Environmental Impact Statement Technical Paper Number 3 Traffic and Transport
4-22
Table 4.6: Crash Numbers by Severity by Year
Year Fatal Hospitalised Medical
Attention Minor Injury
Property Damage
Total
1992 5 11 3 10 29
1993 4 10 5 11 30
1994 1 2 14 4 19 40
1995 1 10 11 4 7 33
1996 9 10 4 13 36
1997 5 9 5 8 27
19981,2 11 12 4 8 35
19991,2,3 8 4 1 9 22
20003 9 10 5 10 34
Total 2 63 91 35 95 286
Average per year
0.2 7.0 10.1 3.9 10.6 31.8
Note 1: Improvements to the Gold Coast Highway. 2: Upgrade Loongana Avenue. 3: Pedestrian signals south of Kitchener Street. Source: Queensland Transport Road Crash Database (Queensland Transport 2001b).
Based on the above accident data, Table 4.7 presents the crash rate for the existing route. Table 4.7 also presents crash rates for a standard four lane divided road and the appropriate, expected rates for the proposed Tugun Bypass.
Table 4.7: Crash Rates per Million Vehicle Kilometres Travelled
Crash Rates (per Million Vehicle Kilometres Travelled)
Total
Existing Route1 0.227
Expected for the Tugun Bypass2 0.113
Note 1: Using crash rates calculated for the existing route.
2: Source: NSW Roads and Traffic Authority – Road Safety Bureau (1993). Rural Crash Rates – Road Stereotypes, Summary Report.
The existing route has a slightly higher injury rate than a standard four lane divided road (between 0.183 and 0.167). This is likely to be a consequence of the high traffic volumes using these roads, the large number of uncontrolled access points onto the Gold Coast Highway from side streets and the difference in speed expectations between through and local traffic.
These traffic movements generally occur in areas of high pedestrian and cycle movements. While the majority of the north-south pedestrian and cycle movements occur along the service roads parallel to the Gold Coast Highway, there is a demand for cross movements. These movements are generally associated with trips between the Tugun area to the west of the Gold Coast Highway and the shopping and beach activities on the eastern side of the highway.
Tugun Bypass Environmental Impact Statement Technical Paper Number 3
Traffic and Transport
Queensland Department of Main Roads 4-23
There were six crashes between 1992 and 2000 involving cyclists, which occurred on the Gold Coast Highway, between the Pacific Motorway and Boyd Street, with all incidents requiring medical attention.
The proposed Tugun Bypass would likely have a significantly lower crash rate than the existing route. This would predominately be due to the improved quality of the alignment compared to the Gold Coast Highway with fewer locations where interactions with local traffic can occur.
4.2.7 Improving the Reliability of Access to Gold Coast Airport
Currently the only access into Gold Coast Airport is via the Gold Coast Highway. The volume of traffic on the highway in the vicinity of the airport is such that it is approaching capacity. Under these conditions, there are risks associated with delays incurred and crashes occurring which affect the perceived and actual accessibility of Gold Coast Airport.
The proposed Tugun Bypass would improve these conditions by:
reducing the volume of traffic on the Gold Coast Highway and hence reducing the likelihood of delay; and
providing an alternative access to the airport via the proposed Tugun Bypass to reduce the risk of using a single route.
4.3 Public Transport Improvements
4.3.1 Better Access to Public Transport
The proposed Tugun Rail Station would be located north of Boyd Street on the eastern side of the proposed Tugun Bypass. This station would function as the primary park and ride facility for the proposed rail extension in the study area, accessed via the Gold Coast Highway and Boyd Street. The proposed station at Gold Coast Airport would primarily be accessed by bus or air interchange.
4.3.2 Public Transport Opportunities Created
The reduction in traffic on the Gold Coast Highway due to the availability of the proposed Tugun Bypass would allow for the corridor space on the Gold Coast Highway to be used for dedicated public transport facilities such as bus lanes or light rail. The reduction in traffic on the Gold Coast Highway would also offer greater potential to provide safe public bus set down/pick up areas along the Gold Coast Highway at Tugun.
If the Gold Coast Highway had to be widened to six lanes in the absence of the proposed Tugun Bypass there would be very little opportunity for the preservation of a dedicated public transport corridor.

Tugun Bypass Environmental Impact Statement Technical Paper Number 3 Traffic and Transport
4-24
4.4 Improving Conditions for Cyclists and Pedestrians
4.4.1 Cycling Network
Figure 4.8 shows both the existing and future cycle network in the study area. This includes existing off-street and on-street cycleways in Gold Coast City and Tweed Shire, as well as proposals for future bicycle links adjacent to the proposal as indicated in the Gold Coast City Transport Plan.
An off-road shared path is provided on the northern side of the Pacific Motorway in Tugun between Mitchell and Hillcrest Avenues. An underpass provides access to the southern side of the Pacific Motorway at Hillcrest Avenue. An on-road cycleway link provides access on the Gold Coast Highway between Toolona Street and Kirribin Street, with an off-road shared cycleway link continuing along the southern side of the Gold Coast Highway, crossing the Tweed Heads Bypass to Appel Street in Coolangatta. An additional coastal off-road shared path along Pacific Parade, Musgrave Street and Marine Parade links Bilinga and Coolangatta.
A northern coastal off-road shared path is also proposed parallel to the Gold Coast Highway in the north of the study area linking existing discontinuous paths on Duringan Street, Pacific Parade and O’Connor Street.
The Gold Coast City Transport Plan also proposed a high-speed bicycle veloway parallel to the Gold Coast Railway from Helensvale to Robina. This proposal is unlikely in the near future due to the high cost involved.
The Tweed Shire cycle network as indicated in the Section 94 Contributions Plan Number 22 – Cycleways (Tweed Shire Council 1999) includes on-road cycleways along Kennedy Drive west of the Tweed Heads Bypass and along Ducat and Miles Streets joining to the Gold Coast Highway cycleway in Queensland (refer to Figure 4.8). There are no existing designated on-road cycleways on the Pacific Highway in NSW at least as far south as the Cudgen/Chinderah Bay Drive interchange, as shoulder widths are only 1.5 m on the outside of each carriageway and 0.5 m at bridge crossings. However, cyclists are not banned from using the Pacific Highway in NSW as discussed in Section 2.6.5 and some cyclists continue to use the shoulders on this section of the Pacific Highway.
4.4.2 Cyclist Mode Share
The Gold Coast City Transport Plan indicates that approximately 3 percent of all trips in Gold Coast City are currently taken by bike (Gold Coast City Council 1998). The City Transport Plan aims to increase the proportion of all trips taken by cycling from the present 3 percent to 6 percent in 2011 and 8 percent in 2030.

���
��
Proposed Tugun BypassGold Coast Airport BoundaryQueensland/NSW BorderProposed Access BridgesTunnelExisting off-street cyclewayProposed off-street cyclewayExisting on-street cyclewayAdditional on-street opportunitiesPotential future cyclewaysProposed Tugun Bypass cyclewaysconnectionAdditional off-street cyclewaysopportunities
�
Sour
ce: G
old
Coa
st C
ity T
rans
port
Plan
Figure 4.8 ��"����������� ��$����� 7����� ����������
���������������������������
������������������������������������������
������������������������������
������������
������������������������������������������������
��� ��� ��� ��� ���� ���� �
��� ��� ��� ��� �������� �������� �����
���� ����� ����� �
������������
������������
������������
���
���
����
�
���
���
����
�
���
���
����
�
���������
�������
�
���������
�������
�
���������
�������
�
���
�������
���
���
�������
���
���
�������
���
����� ����������� ����������� ������
"�������"�������"�������
�� �
��� �
�� �
��� �
�� �
��� �
������������
������������
������������
������ �
������ �
������ �
�������%��
�������%��
�������%��
!����
����
�!�
��� ��
���
!����
����
�
����� ����������� ����������� ������
��������!���������������!���������������!�������
!�� !�� !�� ������������
"� � �"� � �"� � �
������������
!�� ��������!�� ��������!�� ��������
����
�������
�����
���
���������
�����
���
���������
�����
�
!�������
�
!�������
�
!�������
�
����� ��
���
����� ��
���
����� ��
���
��#� �������#� �������#� �����
� ������
� ������
� ������ ����������
����������
����������
!�����������
!�����������
!�����������
!�����!�����!����� ������������
���������������������������������
������
������
������
������
������
������
��$
��$
��$
%��%��%��
��������!�
�����
���������!�
�����
���������!�
�����
�
!� ����
����
!� ����
����
!� ����
����
!����
���
���
!����
���
���
!����
���
���
&� ����
�&�
����
�&�
����
�
����� ���������� ���������� �����
%��%��%��
'��������(���'��������(���'��������(���
������������ ������������
��
����
�"�*��
�
��
����
�"�*��
�
��
����
�"�*��
�
)� �)� �)� ��� �� ��
���������������
������������
���������������
������������

Tugun Bypass Environmental Impact Statement Technical Paper Number 3 Traffic and Transport
4-26
Census data for 2001 indicates that 1.2 percent of the Gold Coast City workforce travel to work by bike (excluding trips using bicycle and another mode), compared to 1.3 percent in Brisbane City. At the statistical local area level, Bilinga has a cycling mode share of 3.4 percent for the journey to work, one of the highest cycling mode shares on the Gold Coast.
4.4.3 Cyclist Volumes
A 24 hour traffic count was conducted on the Tweed Heads Bypass in Coolangatta, south of Gold Coast Airport from 12 noon, Wednesday 13 December to 12 noon, Thursday 14 December 2000 (Abacus Surveys 2000). Figure 4.9 shows the two-way volumes of cyclists counted at this location.
Number of Cyclists on Tweed Heads Bypass, Coolangatta
Wednesday 13 December 2000 - Thursday 14 December 2000
0
2
4
6
8
10
12
12:1
5 P
M
1:4
5 P
M
3:1
5 P
M
4:4
5 P
M
6:1
5 P
M
7:4
5 P
M
9:1
5 P
M
10:4
5 P
M
12:1
5 A
M
1:4
5 A
M
3:1
5 A
M
4:4
5 A
M
6:1
5 A
M
7:4
5 A
M
9:1
5 A
M
10:4
5 A
M
Time
Vo
lum
e
Source: Abacus Surveys (2000)
Figure 4.9: Two-Way Cyclist 15 Minute Volumes at the Tweed Heads Bypass, Coolangatta
The total two-way cyclist volume for the 24-hour period was 221. The AM peak hour was 5:00 to 6:00 am, where 16 cyclists were counted using the Tweed Heads Bypass in the one-hour interval. The PM peak hour occurred from 4:00 to 5:00 pm when 25 cyclists were counted.
4.4.4 Crashes Involving Cyclists
The Pacific Motorway and the Gold Coast Highway have been identified in the Gold Coast Bicycle Network Operational Plan as the two worst blackspots for crashes involving bicycles on the Gold Coast. Queensland Transport’s Road Crash Database (Queensland Transport 2001b) for the period 1 January 1995 to 31 December 1999 indicated that 126 bicycle crashes occurred on the Gold Coast Highway, with the Surfers Paradise section registering the highest concentration of crashes. Intersections on the Gold Coast Highway were also identified as having a high level of multiple crashes. On the Pacific Motorway 19 bicycle crashes were also recorded, which were concentrated at on/off ramps and bridge crossings.

Tugun Bypass Environmental Impact Statement Technical Paper Number 3
Traffic and Transport
Queensland Department of Main Roads 4-27
4.4.5 Improving Cycling Conditions
Gold Coast City Council has prepared a strategic cycling network and local cycle route plans as part of the Gold Coast City Transport Plan. Figure 4.8 shows the cycling routes proposed in the plan for the Tugun/Coolangatta area. The Gold Coast Bicycle Network Operational Plan was developed by Gold Coast City Council in 2001. The Tweed Shire Council has not developed a strategic cycling network.
No arterial cycling connection is proposed along the Tugun Bypass primarily because of narrow shoulders on the bypass along the tunnel and ramps. There has also been little interest in the veloway concept proposed along the rail extension, with a number of safety, design and cost issues affecting its feasibility. An alternative strategic cycling route has been proposed adjacent to the Pacific Motorway between Stewart Road and the Gold Coast Highway, connecting into the on-road cycleway route through Tugun.
The proposed Tugun Bypass would improve cycling conditions by:
reducing traffic volumes on the Gold Coast Highway and its service roads, hence reducing the level of interaction between cars and bicycles;
increasing local accessibility for cyclists through an increase in green time allocated to traffic signal phases on side streets;
downgrading the function of the Gold Coast Highway and hence facilitating the reduction in the speed differential between cars and bicycles;
removing the majority of heavy vehicles from the Gold Coast Highway; and
providing crossing facilities on Tugun Bypass interchanges.
4.5 Improving Walking Conditions
4.5.1 Walking Network
The walking network in the study area consists of footpaths and off-road shared paths (shared with bicycles), used for both recreational and commuter purposes. The Gold Coast Cycling Guide (Gold Coast City Council 2001b) indicates where off-road shared paths are located, shown in Figure 4.8.
4.5.2 Walking Mode Share
The Gold Coast City Transport Plan indicates that approximately 13 percent of all trips in Gold Coast City are currently walked (Gold Coast City Council 1998). The City Transport Plan aims to increase the proportion of all trips taken by walking to 14 percent in 2011 and 15 percent in 2030.
Census data only includes travel information related to the journey to work, therefore it does not provide a realistic representation of mode shares, particularly for walking. Census data for 2001 however indicates that 3.3 percent of the Gold Coast City workforce travel to work by walking (excluding trips using other modes combined with walking), compared to 3.7 percent in Brisbane City. At the statistical local area level, Coolangatta has a walking mode share of 8.0 percent for the journey to work, demonstrating the importance of walking for journey to work commuting in the study area.

Tugun Bypass Environmental Impact Statement Technical Paper Number 3 Traffic and Transport
4-28
4.5.3 Observed Walking Activity
There is currently an observed high demand for pedestrian movements between the Tugun Heights area and the strip of commercial development and also the beach on the eastern side of the Gold Coast Highway at Tugun. Pedestrians crossing the highway to make this trip are required to do so at the signalised pedestrian crossing at the Toolona Street intersection with the Gold Coast Highway. Crossings at other locations are unsafe due to the large crossing width, the relatively high speed of traffic on the Gold Coast Highway and the proportion of heavy vehicles in the traffic stream.
There are significant delays to pedestrians attempting to cross the Gold Coast Highway at the Toolona Street intersection due to the high proportion of green time for the intersection allocated to through-traffic on the Gold Coast Highway. There are also delays incurred by through-traffic on the Gold Coast Highway when pedestrians trigger the signals at Toolona Street due to pedestrians required to cross four lanes of traffic and the clearance times required for this width.
4.5.4 Improving Walking Conditions
Without the proposed Tugun Bypass, pressure to widen the Gold Coast Highway at Tugun to accommodate future increased traffic volumes would likely result. Widening the Gold Coast Highway at Tugun would result in increased difficulties for pedestrians crossing the highway and additional increases in the clearance time impacts on through-traffic.
Alternatives to improve walking conditions in a ‘no bypass’ event include pedestrian underpasses or overpasses. Overpasses would introduce visual impacts in a landscape that is relatively flat, while underpasses would be susceptible to the effects of a relatively high water table. There are also personal security and disability access issues associated with these facilities.
The construction of the proposed Tugun Bypass would provide the following opportunities to improve walking conditions:
to reduce the traffic signal green time allocated to through-traffic movements and hence reduce delays at signalised pedestrian crossings on the Gold Coast Highway. This may also reduce the incentive for pedestrians to cross the Gold Coast Highway mid-block, resulting in a safer pedestrian environment;
the proposed Tugun Bypass removes the need to upgrade the Gold Coast Highway to six lanes in the medium-term, ensuring that pedestrians only have four lanes of traffic to cross (excluding turning lanes);
reduction in congestion on the Gold Coast Highway and the resulting reduction in traffic using the service roads to avoid delays on the highway may improve pedestrian safety in these areas, particularly where pedestrian-orientated land uses are present; and
provision of pedestrian footpaths on the bypass interchange bridges.

Tugun Bypass Environmental Impact Statement Technical Paper Number 3
Traffic and Transport
Queensland Department of Main Roads 4-29
4.6 Improving Road Freight Movement and Reducing Heavy
Vehicle Impacts
4.6.1 Road Freight Efficiency Benefits
Delays incurred on the Gold Coast Highway through Tugun-Bilinga currently have an effect on the efficiency of freight movements in terms of both average travel time and the variability in travel times due to congestion and crashes.
The proposed Tugun Bypass would attract longer-distance, higher-volume movements while there would still be some use of the Gold Coast Highway for local, smaller volume movements. Travel time and travel reliability benefits would accrue to both types of movements as a result.
4.6.2 Reduced Heavy Vehicle Impacts
Heavy vehicles along the Gold Coast Highway introduce a range of associated impacts such as air and noise pollution, visual intrusion and impacts on local traffic movements. The relocation of these trips to the proposed Tugun Bypass, away from sensitive land uses, would reduce these impacts along the Gold Coast Highway.
4.7 Implications of Failing to Construct the Tugun Bypass
Without the proposed Tugun Bypass, the following would occur:
many of the transport, land use and environmental objectives of the South East Queensland Regional Framework for Growth Management, Integrated Regional Transport Plan for South East Queensland and the Gold Coast City Transport Planwould not be achieved;
many of the functional issues currently experienced along the Gold Coast Highway would worsen;
delays through Tugun-Bilinga would continue to rise;
local accessibility adjacent to the Gold Coast Highway would continue to decline;
the safety of the corridor would decline as the number and severity of crashes continue to rise;
the quality and reliability of access to Gold Coast Airport would continue to decline;
access to the proposed rail stations at Tugun and Gold Coast Airport would be through congested traffic;
there would be less opportunity for the introduction of priority road space for public transport along the Gold Coast Highway;
safety and accessibility for pedestrians and cyclists along and across the Gold Coast Highway would continue to decline; and
reliability and efficiency of road freight movements through Tugun would continue to decline.
4.8 Summary of Need for the Tugun Bypass
With the proposed Tugun Bypass, many of these issues would be resolved as traffic currently travelling on the Gold Coast Highway though the Tugun-Bilinga corridor

Tugun Bypass Environmental Impact Statement Technical Paper Number 3 Traffic and Transport
4-30
would used the proposed Tugun Bypass. This would improve the accessibility to the Gold Coast Airport, proposed rail stations at Tugun, and Gold Coast Airport and to local businesses and residents along the highway.
There is a demonstrated need to:
alleviate traffic congestion currently and forecast to be experienced along the Gold Coast Highway;
improve regional and interstate travel and transport;
improve safety of motorists using the Gold Coast Highway; and
achieve the transport, land use and environmental objectives of the South East Queensland Regional Framework for Growth Management, the IntegratedRegional Transport Plan for South East Queensland and the Gold Coast City Transport Plan.
It has been established in this technical paper that the Tugun Bypass would assist in achieving these needs. In addition, likely flow on effects to be realised as a result of improvements to traffic congestion on the Gold Coast Highway include:
improvements to the quality and reliability of access to Gold Coast Airport;
lessening in traffic delays through Tugun-Bilinga;
improvements in local accessibility adjacent to the Gold Coast Highway;
improvement in safety as a result of a reduction in the number and severity of crashes; and
improvements in safety and accessibility for pedestrians and cyclists along and across the Gold Coast Highway.

Tugun Bypass Environmental Impact Statement Technical Paper Number 3
Traffic and Transport
Queensland Department of Main Roads
Part C: Need Assessment – Rail Extension from
Robina to Gold Coast Airport

Tugun Bypass Environmental Impact Statement Technical Paper Number 3
Traffic and Transport
Queensland Department of Main Roads 5-1
5. Robina to Gold Coast Airport Rail
Extension
5.1 Overview
The Tugun Bypass EIS considers the proposed road bypass from Stewart Road to the interchange with the Tweed Heads Bypass. The Tugun Bypass shares part of the same transport corridor with the proposed Robina to Gold Coast Airport rail extension, which is addressed in the Robina to Tugun Rail Impact Assessment Study (IAS) (Parsons Brinckerhoff 2003). For this reason, the Tugun Bypass EIS also considers rail corridor requirements for corridor protection purposes.
5.2 Robina to Tugun Rail Impact Assessment Study
The Robina to Tugun Rail IAS is a two-part study which considers the extension of the Gold Coast passenger rail line south from the existing Robina Station. Part A is for the Robina Station to Stewart Road section, with Part B for the Stewart Road to Boyd Street section of the rail extension.
The assessment of need for the rail extension from Robina to the Gold Coast Airport, as outlined in the IAS, considered the following:
service Robina – as suggested for Key Regional Centres under the 2001 Regional Framework for Growth Management (updated 1998); meet Integrated Regional Transport Plan objectives of providing quality public transport, shaping urban communities, encouraging the employment concentration and increasing the proportion of trips made by public transport; be a fundamental component of the southern Gold Coast's public transport system structure; reduce the number of car trips and through encouraging the consolidation of land use, reduce the length of car trips; maintain a corridor for the rail extension from Robina to Coolangatta so that it is not precluded or adversely affected by future development; to encourage public transport usage for access to the Gold Coast Airport; and maintaining a future option for extension of passenger rail into NSW.
The justification for the rail extension was not based on the typical criteria of exceeding a Benefit-Cost Ratio (BCR) of 1.0. Rather, the justification has been based on the criteria that the percentage of operational cost recovery for the rail extension is comparable to the average operational cost recovery for the remainder of the CityTrain network. On this basis, the rail extension is justified to be constructed to Reedy Creek in 2008 and progressively constructed to Elanora station by 2011.
The alignment and station locations for the proposed rail extension were selected following the Southern Gold Coast Tweed Corridor Study, the Pacific Highway at Tugun - Route Selection Report and supplementary studies. The options considered in the IAS were evaluated using a multi-criteria assessment considering the environmental, engineering, community, transport and land use impacts. Stations are proposed for Reedy Creek, Andrews (when demand warrants it), Elanora, Tugun and the Gold Coast Airport. The rail alignment is proposed to be constructed as single track on a dual track formation.
Part A of the IAS was released as a draft for public consultation in April 2003.

Tugun Bypass Environmental Impact Statement Technical Paper Number 3
Traffic and Transport
Queensland Department of Main Roads 6-1
6. Scope and Approach
6.1 Traffic Design
The traffic analysis and design has primarily been based on the two-hour peak traffic volumes from the EMME/2 model. Turning volumes for the interchange design were extracted from the model for the following scenarios:
year 2007 morning and evening peak hours; and
year 2017 morning and evening peak hours.
The volumes extracted from the EMME/2 model were then adjusted to better reflect the future travel patterns through the corridor. The adjustment for the traffic flow was based on the re-diversion of bypass traffic to better balance the demands between the proposed Tugun Bypass and Gold Coast Highway. A 2027 scenario was also developed at this point to estimate the likely traffic along the proposed Tugun Bypass and Gold Coast Highway given that at 2027 the corridor is expected to be operating at or near capacity.
The adjusted traffic volumes were then used as the basis for aaSIDRA intersection analysis of the intersections on either side of:
the proposed Stewart Road interchange;
the proposed Tweed Heads Bypass interchange; and
the Kennedy Drive interchange.
The adjusted volumes extracted from the EMME/2 model have also been used in the assessment of the level of service for the proposed Tugun Bypass and its on and off ramps.
6.2 Operational Period Transport Impacts
The assessment of impacts associated with the proposed Tugun Bypass considers the following:
changes in traffic volumes, congestion and delays on roads in the vicinity of the proposed Tugun Bypass;
impacts on local traffic access;
impacts on pedestrian and cyclist movements;
impacts on bus routes, services and patronage;
impacts on road freight movement; and
impacts on emergency vehicle access.
Impacts due to traffic volume changes as a consequence of the proposed bypass have been quantified using outputs from the EMME/2 transport model as modified for this project. These assessments have been based on an opening year of 2007, a 10 year horizon (2017) and a 20 year horizon (2027). In this case, the travel time differences, traffic volume changes and changes in volume/capacity ratios have been used as the basis for consideration of impact.

Tugun Bypass Environmental Impact Statement Technical Paper Number 3 Traffic and Transport
6-2
Qualitative assessments have been presented for impacts on local traffic access, bus services, road freight movements, emergency vehicle access and pedestrian and cyclist access.
6.3 Traffic Impacts During Construction
The construction impact assessment considers:
the number of construction vehicle trips to and from the site and their distribution throughout the day and year;
the number of construction site employee vehicle trips to and from the site and their distribution throughout the day and year; and
the routes which construction vehicles and construction employees use to access the construction site and the impacts associated with these trips.
Measures to minimise the impacts of construction vehicles and construction employee vehicles are proposed in addition to measures to minimise the effect of lane closures and traffic diversions on travel times on existing roads.

Tugun Bypass Environmental Impact Statement Technical Paper Number 3
Traffic and Transport
Queensland Department of Main Roads 7-1
7. Traffic Design
7.1 Assessment Process
The assessment is based on the following time periods:
year 2007 as the year of opening of the facility;
year 2017 as the 10 year horizon after opening, as is typically used for assessing transport infrastructure impacts in Queensland; and
year 2027 representing 20 years after opening, a requirement for impact assessment for the NSW Roads and Traffic Authority. The year 2027 assessment period is for intersection design only and not for the overall need assessment of the proposal.
The approach used in undertaking the analysis was based on calculating traffic volumes using the updated Gold Coast Strategic EMME/2 model. Traffic forecasts were made on the basis of agreed land use projections determined by the Queensland Department of Local Government and Planning and signed off by both state and local government.
The EMME/2 model was refined as part of this study. For the purposes of obtaining traffic forecasts, demand forecasts were either interpolated, in the case of Year 2002 2007 and 2017 traffic volumes, or extrapolated in the case of Year 2027 traffic volumes.
The process used to assess the configuration of the proposed Tugun Bypass and its intersections is as follows:
the proposed Tugun Bypass was coded into the model with the interchange configurations shown for Option C4 in the Pacific Highway at Tugun - Route Selection Report (Main Roads 1999);
demand flows (traffic volumes) were derived from the EMME/2 model for the morning and evening peaks and a turning movement diagram produced for the proposed bypass and interchanges. These volumes were then adjusted in accordance with the process as previously identified in Section 2.1.1;
intersection concepts provided by the design team for each interchange were analysed using aaSIDRA for year 2027 and amendments to the layouts suggested accordingly;
staging of the intersection construction for years 2007 and 2017 was considered by undertaking aaSIDRA analysis of staging options at each location; and
level of service analysis of the proposed bypass and on/off ramps was also undertaken.
In assessing the Stewart Road interchange and Tweed Heads Bypass interchange, similar signal phases have been used for eastern and western intersections of Stewart Road interchange and the western intersection of Tweed Heads Bypass interchange. A three-phase cycle achieves the most efficient operation for these intersections. The eastern intersection of the Tweed Heads Bypass has a four-phase cycle due to the eastern service road.

Tugun Bypass Environmental Impact Statement Technical Paper Number 3 Traffic and Transport
7-2
The coordination of phase times between the eastern and western intersections, by having identical phase times, has not been assessed. While this has not been assessed, coordinating phase times would only have a minor affect on the operations of the interchange intersections. The operations for each intersection may be further assessed during later design stages.
7.2 Traffic Volumes
The morning and evening peak hour volumes for the interchange design analysis are included in Appendix A. The year 2007 and year 2017 turning volumes that have been used were developed in accordance with the post modelling procedure described in Section 2.1.1. The year 2027 volumes are extrapolations of the year 2007 and 2017 volumes.
A linear extrapolation through 2017 to 2027 is reasonable (and likely conservative), considering that the growth rate in Gold Coast City will likely taper off over the next 20 years as the area becomes fully developed south of the Coomera River.
7.3 Stewart Road Interchange
The proposed configuration of the Stewart Road interchange includes a six-lane bridge over the proposed Tugun Bypass with signalised intersections on both sides of the bridge. The aaSIDRA analysis output and schematic diagram of the layouts for each intersection are provided in Appendix B while a summary of the results is listed in Table 7.1 and Table 7.2.
Table 7.1: Stewart Road Interchange 2017 AM Peak Hour Analysis
Analysis Parameter Eastern Intersection
Western Intersection
Intersection Level of Service D E
Intersection Degree of Saturation 79% 96%
Average Intersection Delay (seconds) 17 45
Maximum Approach Delay (seconds) 19 49
Longest 95th Percentile Queue (m) 168 304
Table 7.2: Stewart Road Interchange 2017 PM Peak Hour Analysis
Analysis Parameter Eastern Intersection
Western Intersection
Intersection Level of Service D E
Intersection Degree of Saturation 85% 99%
Average Intersection Delay (seconds) 21 45
Maximum Approach Delay (seconds) 21 52
Longest 95th Percentile Queue (m) 209 390
The eastern and western intersections are both expected to operate within their respective capacities during the morning peak period. The queue lengths can be managed through relatively short cycle times at both intersections.
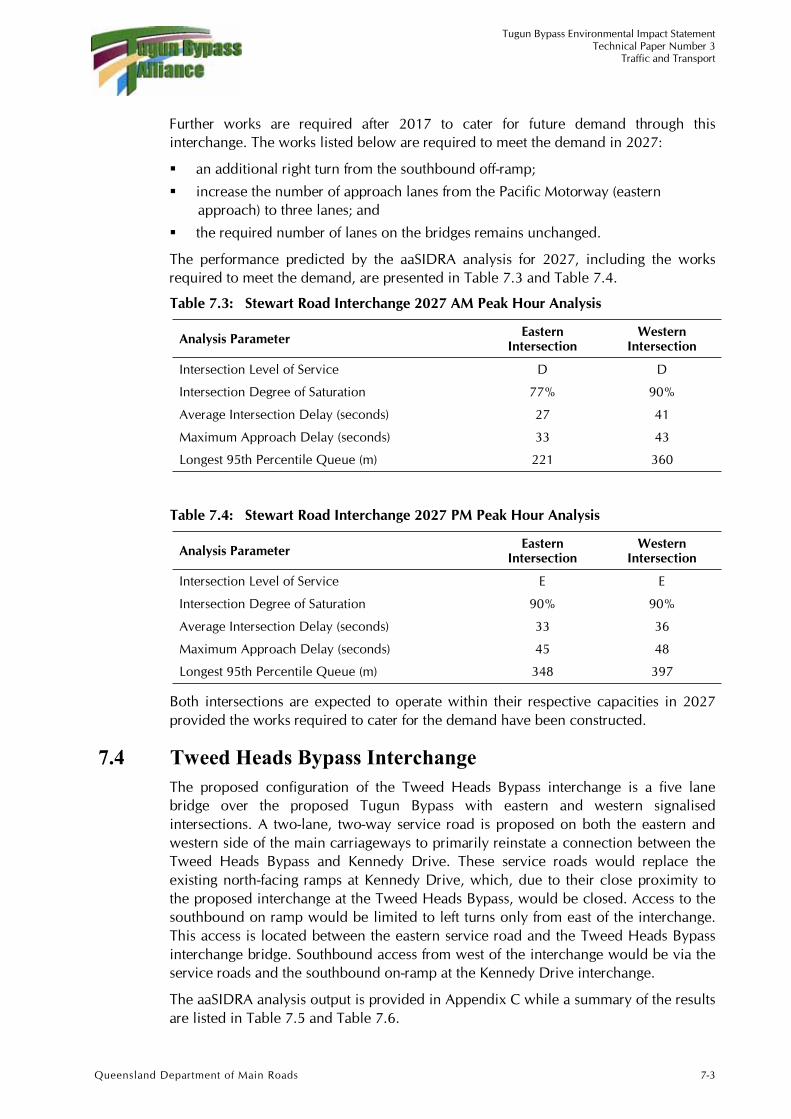
Tugun Bypass Environmental Impact Statement Technical Paper Number 3
Traffic and Transport
Queensland Department of Main Roads 7-3
Further works are required after 2017 to cater for future demand through this interchange. The works listed below are required to meet the demand in 2027:
an additional right turn from the southbound off-ramp;
increase the number of approach lanes from the Pacific Motorway (eastern approach) to three lanes; and
the required number of lanes on the bridges remains unchanged.
The performance predicted by the aaSIDRA analysis for 2027, including the works required to meet the demand, are presented in Table 7.3 and Table 7.4.
Table 7.3: Stewart Road Interchange 2027 AM Peak Hour Analysis
Analysis Parameter Eastern Intersection
Western Intersection
Intersection Level of Service D D
Intersection Degree of Saturation 77% 90%
Average Intersection Delay (seconds) 27 41
Maximum Approach Delay (seconds) 33 43
Longest 95th Percentile Queue (m) 221 360
Table 7.4: Stewart Road Interchange 2027 PM Peak Hour Analysis
Analysis Parameter Eastern Intersection
Western Intersection
Intersection Level of Service E E
Intersection Degree of Saturation 90% 90%
Average Intersection Delay (seconds) 33 36
Maximum Approach Delay (seconds) 45 48
Longest 95th Percentile Queue (m) 348 397
Both intersections are expected to operate within their respective capacities in 2027 provided the works required to cater for the demand have been constructed.
7.4 Tweed Heads Bypass Interchange
The proposed configuration of the Tweed Heads Bypass interchange is a five lane bridge over the proposed Tugun Bypass with eastern and western signalised intersections. A two-lane, two-way service road is proposed on both the eastern and western side of the main carriageways to primarily reinstate a connection between the Tweed Heads Bypass and Kennedy Drive. These service roads would replace the existing north-facing ramps at Kennedy Drive, which, due to their close proximity to the proposed interchange at the Tweed Heads Bypass, would be closed. Access to the southbound on ramp would be limited to left turns only from east of the interchange. This access is located between the eastern service road and the Tweed Heads Bypass interchange bridge. Southbound access from west of the interchange would be via the service roads and the southbound on-ramp at the Kennedy Drive interchange.
The aaSIDRA analysis output is provided in Appendix C while a summary of the results are listed in Table 7.5 and Table 7.6.

Tugun Bypass Environmental Impact Statement Technical Paper Number 3 Traffic and Transport
7-4
Table 7.5: Tweed Heads Bypass Interchange 2017 AM Peak Hour Analysis
Analysis Parameter Eastern
Intersection Western
Intersection
Intersection Level of Service C C
Intersection Degree of Saturation 76% 29%
Average Intersection Delay (seconds) 30 22
Maximum Approach Delay (seconds) 49 48
Longest 95th Percentile Queue (m) 133 53
Table 7.6: Tweed Heads Bypass Interchange 2017 PM Peak Hour Analysis
Analysis Parameter Eastern
Intersection Western
Intersection
Intersection Level of Service C C
Intersection Degree of Saturation 77% 30
Average Intersection Delay (seconds) 32 26
Maximum Approach Delay (seconds) 60 46
Longest 95th Percentile Queue (m) 152 73
The eastern and western intersections are expected to operate within their respective capacities. Co-ordination of the traffic signals between the two intersections would be expected to maximise the efficiency of the interchange by effectively managing the queues.
The performance predicted by the aaSIDRA analysis for 2027 are presented in Table 7.7 and Table .7.8.
Table 7.7: Tweed Heads Bypass Interchange 2027 AM Peak Hour Analysis
Analysis Parameter Eastern
Intersection Western
Intersection
Intersection Level of Service C C
Intersection Degree of Saturation 73% 42
Average Intersection Delay (seconds). 32 20
Maximum Approach Delay (seconds) 49 47
Longest 95th Percentile Queue (m) 116 54
Table 7.8: Tweed Heads Bypass Interchange 2027 PM Peak Hour Analysis
Analysis Parameter Eastern
Intersection Western
Intersection
Intersection Level of Service D B
Intersection Degree of Saturation 91% 45%
Average Intersection Delay (seconds) 37 20
Maximum Approach Delay (seconds) 59 32
Longest 95th Percentile Queue (m) 141 67

Tugun Bypass Environmental Impact Statement Technical Paper Number 3
Traffic and Transport
Queensland Department of Main Roads 7-5
Both intersections are expected to operate within their respective capacities in 2027.
7.5 Kennedy Drive Interchange
The proposal for the Kennedy Drive interchange is to modify the existing dual lane combined roundabout (‘dog-bone’ configuration) and also removal of the existing northern on and off ramps due to their close proximity to the proposed Tweed Heads Bypass interchange.
A two-lane, two-way service road would be constructed on both the eastern and western side of the highway between the Kennedy Drive interchange and the proposed Tweed Heads Bypass interchange. The roundabouts on the eastern and western side of the highway at Kennedy Drive would require modification to allow for the right turn movements from the proposed eastern and western service roads into Kennedy Drive that replaces the southbound off-ramp.
The aaSIDRA analysis output is provided in Appendix D while a summary is presented in Table 7.9 and Table 7.10.
Table 7.9: Kennedy Drive Interchange 2017 AM Peak Hour Analysis
Analysis Parameter Eastern
Roundabout Western
Roundabout
Intersection Level of Service A A
Intersection Degree of Saturation 47% 48%
Average Intersection Delay (seconds) 10 8
Maximum Approach Delay (seconds) 14 17
Longest 95th Percentile Queue (m) 23 25
Table 7.10: Kennedy Drive Interchange 2017 PM Peak Hour Analysis
Analysis Parameter Eastern
Roundabout Western
Roundabout
Intersection Level of Service B B
Intersection Degree of Saturation 70% 63%
Average Intersection Delay (seconds) 11 12
Maximum Approach Delay (seconds) 18 27
Longest 95th Percentile Queue (m) 61 41
The results indicate that the roundabouts, in isolation, are expected to operate within their practical capacity. However as is currently the case, significant queuing from intersections away from the interchange affect the performance of the roundabouts. These effects are considered to be external to this study.
As roundabouts, this interchange is not expected to cater for the demand beyond 2017. Further analysis in aaSIDRA indicates that when this interchange is upgraded and the roundabouts replaced by traffic signals, the intersections will likely have enough capacity to cater for the demand in 2027.

Tugun Bypass Environmental Impact Statement Technical Paper Number 3 Traffic and Transport
7-6
Co-ordination between the traffic signals and those away from the interchange would improve the efficiency of the intersection and surrounding network and also help to minimise the queuing on the roundabouts. The performance predicted by the aaSIDRA analysis for 2027, including the works required to meet the demand, are presented in Table 7.11 and Table 7.12.
Table 7.11: Kennedy Drive Interchange 2027 AM Peak Hour Analysis
Analysis Parameter Eastern
Intersection Western
Intersection
Intersection Level of Service C C
Intersection Degree of Saturation 74% 70%
Average Intersection Delay (seconds) 26 23
Maximum Approach Delay (seconds) 51 52
Longest 95th Percentile Queue (m) 130 141
Table 7.12: Kennedy Drive Interchange 2027 PM Peak Hour Analysis
Analysis Parameter Eastern
Intersection Western
Intersection
Intersection Level of Service D D
Intersection Degree of Saturation 87% 88%
Average Intersection Delay (seconds) 37 40
Maximum Approach Delay (seconds) 62 60
Longest 95th Percentile Queue (m) 201 291
Both intersections are expected to operate within their respective capacities in 2027 provided the works required to cater for the demand have been constructed.
7.6 Level of Service Analysis
7.6.1 Methodology
Level of Service Definition
Standard 'Level of Service' (LOS) describe operating conditions in a traffic stream. The conditions include speed and travel time, freedom to manoeuvre, traffic interruptions, comfort and convenience and safety. The level of service provided varies depending on the type of road for the same traffic volumes. There are six levels of service, A to F, with A representing the best operating conditions (free flow) and F the worst (forced or break-down flow). LOS D represents reasonable flow, approaching unstable flow, while LOS E represents traffic volumes at or close to the capacity of the road system with unstable flow (variable speeds) on occasions.
Traffic Volumes
The morning and evening peak hour volumes for the level of service analysis of the proposed Tugun Bypass and associated ramps are included in Appendix A. Year 2007 and year 2017 link volumes have been extracted from the appropriate EMME/2 models

Tugun Bypass Environmental Impact Statement Technical Paper Number 3
Traffic and Transport
Queensland Department of Main Roads 7-7
prepared for this study. The year 2027 volumes are extrapolations of the year 2007 and 2017 volumes as explained in Section 7.1.
Tugun Bypass
Level of service calculations for the proposed Tugun Bypass are based on Section 5.2 of Guide to Traffic Engineering Practice, Part 2 – Roadway Capacity (AUSTROADS 1991).
Ramps
The level of service calculations for the ramps associated with the proposed Tugun Bypass are based on Chapter 5 of the Highway Capacity Manual (Transport Research Board 1985). The ramp terminals have been analysed in accordance with the Highway Capacity Manual (Transport Research Board,2000).
7.6.2 Tugun Bypass Analysis
The level of service was calculated for seven segments along the bypass, for both the northbound and southbound directions. Full results of the level of service analysis undertaken for years 2007, 2017 and 2027 are included in Appendix E. This includes the full methodology for the analysis. The following are the key results.
The analysis of the traffic volumes along the proposed Tugun Bypass indicates that as four lanes it would become congested in the peak periods by 2027 and predicted to operate at a maximum LOS E during the morning and evening peak periods. The analysis of the traffic volumes on the Pacific Motorway, north of the proposed Stewart Road interchange, indicates that as four lanes it would operate over capacity in the peak directions by 2017 at LOS F during the morning and evening periods. A six-lane motorway would operate effectively in 2017 at a maximum LOS D in the morning and evening peak periods. In 2027, a six-lane Pacific Motorway, north of Stewart Road, would operate over capacity during the morning and evening peak periods at LOS F.
7.6.3 Ramp Analysis
Level of service analysis has been conducted on the ramps at the proposed Stewart Road and Tweed Heads Bypass interchanges. Although the northern ramps at the Kennedy Drive interchange have been removed and replaced with a western service road, the southern ramps remain unaffected and as such, level of service analysis is not required.
Level of service calculations have been conducted for year 2007, 2017 and 2027 for both interchanges. These results are included in Appendix E.
The analysis indicates that the ramps and ramp terminals should operate within their capacity in 2017. All ramps and ramp terminals, apart from the northbound on-ramp at Stewart Road, are expected to operate within their respective capacities. At Stewart Road the volume on the northbound on-ramp dictates that it should be two lanes and include a two-lane merge with the northbound carriageway of the highway.
7.6.4 Results
While it is considered desirable to maintain LOS D conditions in urbanised areas with high traffic volumes such as the Gold Coast, it is acceptable to achieve LOS E in peak traffic conditions particularly when considering the uncertainties associated with a 20 year design horizon.

Tugun Bypass Environmental Impact Statement Technical Paper Number 3 Traffic and Transport
7-8
In 2027, the proposed four-lane Tugun Bypass is expected to operate at LOS E between the Stewart Road and Tweed Heads Bypass interchanges during the evening peak. This indicates that the traffic volumes on the bypass are approaching the road capacity. At this level of service the bypass should still operate during peak traffic conditions, but with some unstable flow and variable speeds on occasions.
The Pacific Motorway, north of Stewart Road, as four lanes, is likely to operate over capacity in the peak directions by 2017 at LOS F during the morning and evening peak periods. As a six-lane motorway, it should operate effectively in 2017 at a maximum LOS D in the morning and evening peak periods.
Ramps at the proposed Stewart Road and Tweed Heads Bypass interchanges are expected to operate effectively in 2027 with a maximum LOS D apart from the northbound on-ramp at Stewart Road.
The results indicate that:
a four-lane bypass should be approaching its capacity by 2027; and
the bypass ramps should have adequate capacity at 2027 (a two-lane ramp for Stewart Road northbound on-ramp is required).
7.7 High Occupancy Vehicle Lanes
The need for high occupancy vehicle lanes to be designed as part of the proposed Tugun Bypass has been assessed considering:
the Integrated Regional Transport Plan for South East Queensland;
the Gold Coast City Transport Plan;
the Pacific Motorway planning and design; and
the six-lane planning for the Pacific Highway between Papas Way and Stewart Road.
High occupancy vehicle lanes allow vehicles with a minimum of two or three passengers depending on designation, to use the lane. This also generally includes buses, taxis and emergency service vehicles. They are typically used within corridors where there is a travel time advantage to be gained over general traffic, hence encouraging a shift to higher occupancy with fewer vehicles within the corridor. This is generally more appropriate in high-density urban corridors, over long distances, radial to a business district where advantages may be realised in peak hour travel.
This is not expected to be the case for the proposed Tugun Bypass as the proportion of trips using the proposed bypass as part of a central business district-focussed peak hour trip is expected to be small.
The Integrated Regional Transport Plan targeted an increase in average vehicle occupancy from 1.3 to 1.4 through a variety of measures, including the provision of high occupancy vehicle lanes. These lanes have been investigated in a number of Brisbane’s radial corridors as well as along the Pacific Motorway. The Gold Coast City Transport Plan does not specifically identify any high occupancy vehicle facility projects, instead, focussing on the need for bus lanes in the city. The Gold Coast City Transport Plan goes further to state: ‘Transit lanes for higher occupant private vehicles are of lesser priority and as they are a new concept in Gold Coast City, need to be trialed and evaluated to demonstrate the advantages of ridesharing.’

Tugun Bypass Environmental Impact Statement Technical Paper Number 3
Traffic and Transport
Queensland Department of Main Roads 7-9
The Pacific Motorway, north of Pappas Way, includes sufficient pavement width to allow for future median high occupancy vehicle lanes to be implemented. The six-lane planning, between Pappas Way and Stewart Road, includes sufficient pavement width to allow for future median high occupancy vehicle lanes to be implemented as part of the widening to six lanes. To maintain consistency in the planning along the corridor, the Tugun Bypass should be designed such that median high occupancy vehicle lanes are not precluded in the future upgrade to six lanes. However, no additional pavement widths are proposed on this section due to the degree of constraints within the corridor.

Tugun Bypass Environmental Impact Statement Technical Paper Number 3
Traffic and Transport
Queensland Department of Main Roads 8-1
8. Operational Period Transport Impacts
8.1 Road Network Impacts
Assessment of the road network impacts associated with the proposed Tugun Bypass has been based on the volumes developed as part of the post modelling process undertaken using the EMME/2 model flows as a base (refer Section 2.1.1). The scenarios used in the assessment are as follows:
year 2007, 2017 and 2027 no Tugun Bypass; and
year 2007, 2017 and 2027 with four-lane Tugun Bypass.
Year 2007 has been selected as the nominated year of opening of the proposed bypass. 2017 relates to the 10-year period beyond opening which is typically used for impact assessment purposes. This assessment does not include any 2027 scenarios because the modelling indicates that in 2027 approximately 130,000 vehicles per day would be using the corridor. This far exceeds the current capacity of the corridor which is currently about 60,000 vehicles per day. These figures suggest that the Tugun Bypass is a necessary link in the Gold Coast road network and without it there may be excessive delays throughout the network.
Identification of the traffic related impacts of the proposed Tugun Bypass have been based on comparison of volume/capacity ratios and travel speeds for the morning and evening peak periods for the model scenarios outlined above.
This assessment has considered:
that a volume capacity ratio greater than 1.0 indicates that the demand for vehicular travel on the roadway is greater than the theoretical vehicular capacity of the roadway. A volume capacity ratio greater than 0.9 indicates that congestion is likely to be experienced; and
the volume/capacity ratios and travel speeds used in this analysis are based on forecast mid-block traffic flows and the associated mid-block traffic capacities. The capacity of urban routes is typically governed by intersection capacities rather than those at mid-block, with delays experienced at intersections in addition to any mid-block congestion. It is therefore likely that the impacts identified in this assessment would be increased if intersection effects were also included.
A plan of the existing road network with the proposed bypass superimposed is shown in Figure 8.1.

Figure 8.1��&�"���������
���
��
Proposed Tugun BypassGold Coast Airport BoundaryQueensland/NSW BorderProposed Access BridgesTunnel
�
���������������������������
������������������������������������������
������������������������������
������������
������������������������������������������������
��� ��� ��� ��� ���� ���� �
��� ��� ��� ��� �������� �������� �����
���� ����� ����� �
������������
������������
������������
���
���
����
�
���
���
����
�
���
���
����
�
���������
�������
�
���������
�������
�
���������
�������
�
���
�������
���
���
�������
���
���
�������
���
����� ����������� ����������� ������
������������
�� �
��� �
�� �
��� �
�� �
��� �
������������
������������
������������
������ �
������ �
������ �
�������%��
�������%��
�������%��
!����
����
�!�
��� ��
���
!����
����
�
����� ����������� ����������� ������
��������!���������������!���������������!�������
!�� !�� !�� ������������
"� � �"� � �"� � �
������������
!�� ��������!�� ��������!�� ��������
�������������$!��
�������������$!��
�������������$!��
!�������
�
!�������
�
!�������
�
����� ��
���
����� ��
���
����� ��
���
��#� �������#� �������#� �����
� ������
� ������
� ������ ����������
����������
����������
!�����������
!�����������
!�����������
!�����!�����!����� ������������
���������������������������������
������
������
������
������
������
������
��$
��$
��$
%��%��%��
��������!�
�����
���������!�
�����
���������!�
�����
�
!� ����
����
!� ����
����
!� ����
����
!����
���
���
!����
���
���
!����
���
���
&� ����
�&�
����
�&�
����
�
����� ���������� ���������� �����
%��%��%��
'��������(���'��������(���'��������(���
������������ ������������
��
����
�"�*��
�
��
����
�"�*��
�
��
����
�"�*��
�
)� �)� �)� ��� �� ��
���������������
������������
���������������
������������
"��"��"��
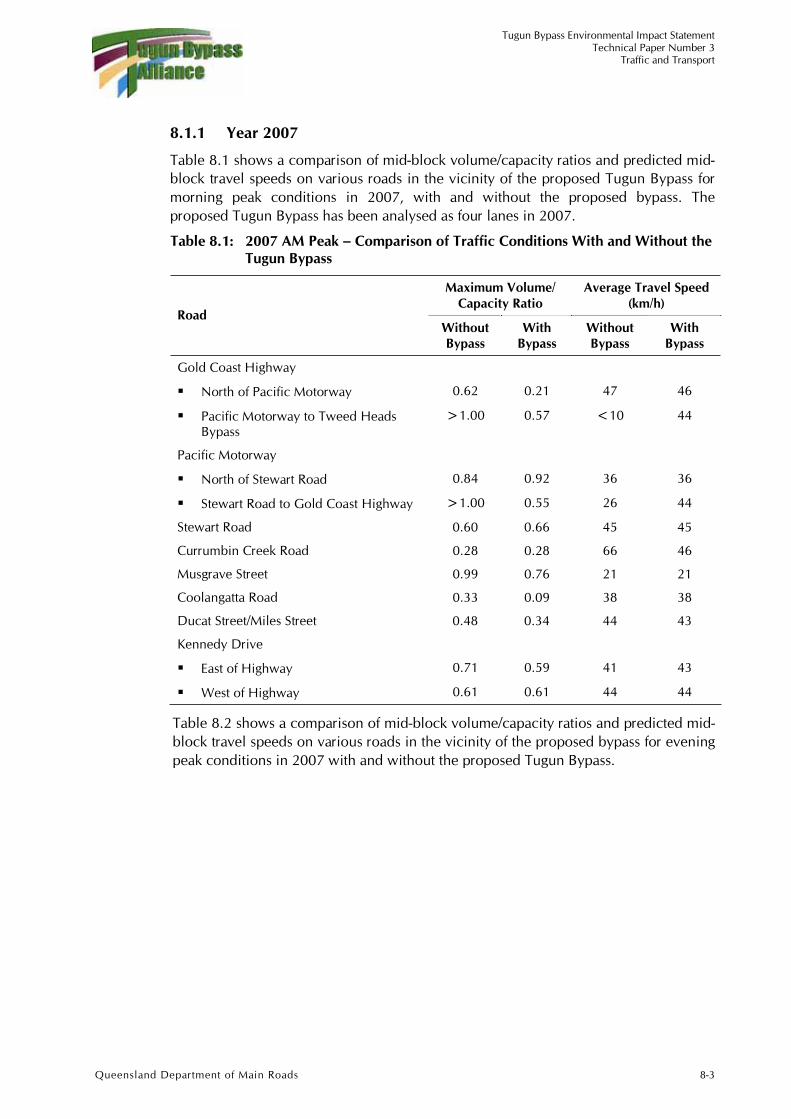
Tugun Bypass Environmental Impact Statement Technical Paper Number 3
Traffic and Transport
Queensland Department of Main Roads 8-3
8.1.1 Year 2007
Table 8.1 shows a comparison of mid-block volume/capacity ratios and predicted mid-block travel speeds on various roads in the vicinity of the proposed Tugun Bypass for morning peak conditions in 2007, with and without the proposed bypass. The proposed Tugun Bypass has been analysed as four lanes in 2007.
Table 8.1: 2007 AM Peak – Comparison of Traffic Conditions With and Without the Tugun Bypass
Maximum Volume/ Capacity Ratio
Average Travel Speed (km/h)
RoadWithout Bypass
WithBypass
Without Bypass
WithBypass
Gold Coast Highway
North of Pacific Motorway 0.62 0.21 47 46
Pacific Motorway to Tweed Heads Bypass
>1.00 0.57 <10 44
Pacific Motorway
North of Stewart Road 0.84 0.92 36 36
Stewart Road to Gold Coast Highway >1.00 0.55 26 44
Stewart Road 0.60 0.66 45 45
Currumbin Creek Road 0.28 0.28 66 46
Musgrave Street 0.99 0.76 21 21
Coolangatta Road 0.33 0.09 38 38
Ducat Street/Miles Street 0.48 0.34 44 43
Kennedy Drive
East of Highway 0.71 0.59 41 43
West of Highway 0.61 0.61 44 44
Table 8.2 shows a comparison of mid-block volume/capacity ratios and predicted mid-block travel speeds on various roads in the vicinity of the proposed bypass for evening peak conditions in 2007 with and without the proposed Tugun Bypass.

Tugun Bypass Environmental Impact Statement Technical Paper Number 3 Traffic and Transport
8-4
Table 8.2: 2007 PM Peak – Comparison of Traffic Conditions With and Without the Tugun Bypass
Maximum Volume/ Capacity Ratio
Average Travel Speed (km/h)
RoadWithout Bypass
WithBypass
Without Bypass
WithBypass
Gold Coast Highway
North of Pacific Motorway 0.62 0.26 45 46
Pacific Motorway to Tweed Heads Bypass
>1.00 0.72 <10 44
Pacific Motorway
North of Stewart Road 0.86 0.87 35 34
Stewart Road to Gold Coast Highway >1.00 0.66 43 45
Stewart Road 0.57 0.69 46 46
Currumbin Creek Road 0.61 0.62 46 46
Musgrave Street >1.00 >1.00 21 21
Coolangatta Road 0.6 0.23 37 33
Ducat Street/Miles Street 0.7 0.63 44 43
Kennedy Drive
East of Highway 0.98 0.97 38 41
West of Highway 0.63 0.62 44 44
Assessment of Tables 8.1 and 8.2 for the year 2007 indicates the following:
traffic conditions on the Gold Coast Highway would improve as a result of the proposed Tugun Bypass. Without the proposed bypass there would be significant congestion and delays. Traffic on the Gold Coast Highway would be free flowing with the proposed bypass, operating below 50 percent of capacity during peak periods; and
for the remainder of the surrounding road network, the proposed Tugun Bypass would either improve traffic conditions or have a negligible impact. Indeed, the only road that is expected to experience an increase in traffic flow as a result of the proposed bypass in 2007 would be the Pacific Motorway, north of Stewart Road. The increase in traffic on the Pacific Motorway, north of Stewart Road, is due to motorists using the proposed Tugun Bypass selecting the Pacific Motorway in preference to the Gold Coast Highway, as their route choice, north of Stewart Road. An associated reduction of traffic is evident on the Gold Coast Highway, north of Tugun.
8.1.2 Year 2017
Table 8.3 shows a comparison of mid-block volume/capacity ratios and predicted mid-block travel speeds on various roads in the vicinity of the proposed Tugun Bypass for morning peak conditions in 2017 with and without the proposed bypass. The proposed Tugun Bypass has been analysed as four lanes in 2017.

Tugun Bypass Environmental Impact Statement Technical Paper Number 3
Traffic and Transport
Queensland Department of Main Roads 8-5
Table 8.3: 2017 AM Peak – Comparison of Traffic Conditions With and Without the Tugun Bypass
Maximum Volume/ Capacity Ratio
Average Travel Speed (km/h)
RoadWithout Bypass
WithBypass
Without Bypass
WithBypass
Gold Coast Highway
North of Pacific Motorway >1.00 0.53 12 45
Pacific Motorway to Tweed Heads Bypass
>1.00 0.98 <10 45
Pacific Motorway
North of Stewart Road 0.82 >1.00 36 34
Stewart Road – Gold Coast Highway >1.00 0.70 <10 44
Stewart Road 0.57 0.63 46 45
Currumbin Creek Road 0.42 0.51 46 66
Musgrave Street >1.00 0.87 21 21
Coolangatta Road 0.65 0.26 36 37
Ducat Street/Miles Street 0.59 0.70 40 40
Kennedy Drive
East of Highway 0.66 0.62 42 42
West of Highway 0.77 0.68 42 44
Table 8.4 shows a comparison of mid-block volume/capacity ratios and predicted mid-block travel speeds on various roads in the vicinity of the proposed bypass for evening peak conditions in 2017 with and without the proposed Tugun Bypass.
Table 8.4: 2017 PM Peak – Comparison of Traffic Conditions With and Without the Tugun Bypass
Maximum Volume/ Capacity Ratio
Average Travel Speed (km/h)
RoadWithout Bypass
WithBypass
Without Bypass
WithBypass
Gold Coast Highway
North of Pacific Motorway >1.00 0.56 38 46
Pacific Motorway to Tweed Heads Bypass
>1.00 0.71 <10 44.5
Pacific Motorway
North of Stewart Road 0.82 >1.00 36 33
Stewart Road to Gold Coast Highway >1.00 0.87 21 45
Stewart Road 0.6 0.79 46 46
Currumbin Creek Road 0.74 0.70 46 46
Musgrave Street >1.00 >1.00 21 21

Tugun Bypass Environmental Impact Statement Technical Paper Number 3 Traffic and Transport
8-6
Maximum Volume/ Capacity Ratio
Average Travel Speed (km/h)
RoadWithout Bypass
WithBypass
Without Bypass
WithBypass
Coolangatta Road >1.00 0.77 37 37
Ducat Street/Miles Street >1.00 >1.00 <10 14
Kennedy Drive
East of Highway 1.00 >1.00 40 37
West of Highway 0.81 0.65 44 44
Assessment of Tables 8.3 and 8.4 for the year 2017 indicates the following:
traffic conditions on the Gold Coast Highway would improve as a result of the proposed Tugun Bypass. There would be significant congestion and delays on the Gold Coast Highway without the proposed bypass, but with the proposed bypass, traffic would be free flowing and operating at about 75 percent of its capacity during peak periods; and
for the remainder of the surrounding road network, the proposed bypass would either improve traffic conditions or have a negligible impact. Indeed, the only roads that that would experience significant increases in traffic flows as a result of the proposed bypass in 2017 would be the Pacific Motorway, north of Stewart Road. The increase in traffic flows on Pacific Motorway could be accommodated based on the Pacific Motorway having six lanes.
8.1.3 Property Access
Access to properties on the western side adjacent to the John Flynn Hospital and Medical Centre is severed by the proposed bypass. Access to these properties is currently gained via a sealed track about 3 m wide located to the north-west of John Flynn Hospital and Medical Centre. The track is located within a park reserve that has access consent rights for the property. It is proposed to reinstate the property access in its existing location via a bridge across the proposed bypass.
8.2 Road Freight
Assessment of the impacts on road freight have been based on comparison of forecast travel time savings along the Pacific Motorway/Highway route forecast for the morning and evening peaks in the years 2007 and 2017 with and without the proposed bypass.
Table 8.5 outlines the predicted differences in mid-block travel time for a single trip during the morning and evening peaks for the years 2007 and 2017 with and without the proposed bypass for travel between the Stewart Road/Pacific Motorway intersection and the existing Kennedy Drive interchange via the Tweed Heads Bypass and the Gold Coast Highway. The forecast vehicle speeds, on which the comparison of travel times has been based, provides only mid–block travel speeds, ignoring intersection delays. Intersection delays experienced in travel along the Gold Coast Highway without the proposed bypass have not been taken into account in this analysis. The actual differences in travel time would therefore be expected to be greater than indicated in this assessment.

Tugun Bypass Environmental Impact Statement Technical Paper Number 3
Traffic and Transport
Queensland Department of Main Roads 8-7
Table 8.5: Travel Times between Stewart Road and Kennedy Drive (via the Gold Coast Highway)
Travel Time (minutes) Scenario
am pm
Year 2007, no Tugun Bypass >30 >30
Year 2007, with four lane Tugun Bypass 8 8
Year 2017, no Tugun Bypass >30 >30
Year 2017, with four lane Tugun Bypass 9 9
The above benefits represent an improvement in freight travel times as a result of the proposed bypass. Considering that approximately 9 percent of vehicles travelling through the corridor are commercial vehicles, there are savings in terms of freight movement travel times, freight movement reliability and reduced environmental impacts associated with the proposed Tugun Bypass.
A further freight related advantage of the proposed bypass would be the removal of the majority of freight movements from the existing Gold Coast Highway. This would enable that section of road to perform its local traffic and distribution functions with improved conditions for all road users including pedestrians and cyclists.
8.3 Emergency Vehicles
Fire and ambulance stations are located on Coolangatta Road as indicated in Figure 8.2. The locations of the John Flynn Hospital and Medical Centre and the Tweed Heads District Hospital and Health Service are also shown. The travel time savings outlined in Section 8.2 are evidence that the proposed bypass would improve accessibility and response times for those emergency services.
8.4 Public Transport
Extension of the railway to provide new stations at Tugun and the Gold Coast Airport would affect existing bus services, both in terms of bus patronage and bus routes.
The analyses suggest that a greater increase in bus ridership would occur with the rail than without the rail line. This is due to the opportunity that rail stations provide to introduce new services, essentially into areas of commercial activity such as Elanora and Coolangatta.
In order to provide satisfactory integration of bus services with the proposed rail stations at Tugun and the Gold Coast Airport, modification of existing bus routes would be required. Figure 8.3 indicates modifications to existing bus routes as well as the additional bus routes that are likely to be required.
The proposed Tugun Station would include a Park and Ride facility with 500 car parking spaces. Parking would be available at the proposed station at Gold Coast Airport in the airport car park. However, Park and Ride trips at this station are likely to be minimal due to the high car park charge rates expected to be applied at the airport.

Proposed Tugun BypassQueensland/NSW BorderTunnelHospitalAmbulance StationFire DepartmentAir Sea Rescue
=6���6� ��2�
0& 0& 0&
���������
Figure 8.2���6���� ���'���� "�����2�"��
+
��� ��� ��� ��� ���� ���� ����������
������������������������������
��&���������&���������&�������
�%%&������%%&������%%&�����
��&������&������&����
���������������������������
�����������
����������������������������� ���� ���� ��
������������
��� ��� ��� ��� ���� ���� �
������������������������������������������
���� �
+
���'����"$������'(� ���2������������
8�$ �+�� ���������� ����"����� ���
���� ���+���� �����'� �� ��'(��� "��������
!������� �����"����������+ !������������$
+���� �����'� �
�����������"��

���
��
Proposed Tugun BypassGold Coast Airport BoundaryQueensland/NSW BorderProposed Access BridgesTunnelCurrent Bus ServicesAdditional Bus ServicesModified Bus Services
�
Figure 8.3 ���� ������������������������ �
���������������������������
������������������������������������������
������������������������������
������������
������������������������������������������������
��� ��� ��� ��� ���� ���� �
��� ��� ��� ��� �������� �������� �����
���� ����� ����� �
������������
������������
������������
���
���
����
�
���
���
����
�
���
���
����
�
���������
�������
�
���������
�������
�
���������
�������
�
���
�������
���
���
�������
���
���
�������
���
����� ����������� ����������� ������
"�������"�������"�������
�� �
��� �
�� �
��� �
�� �
��� �
������������
������������
������������
������ �
������ �
������ �
�������%��
�������%��
�������%��
!����
����
�!�
��� ��
���
!����
����
�
����� ����������� ����������� ������
��������!���������������!���������������!�������
!�� !�� !�� ������������
"� � �"� � �"� � �
������������
!�� ��������!�� ��������!�� ��������
����
�������
�����
���
���������
�����
���
���������
�����
�
!�������
�
!�������
�
!�������
�
����� ��
���
����� ��
���
����� ��
���
��#� �������#� �������#� �����
� ������
� ������
� ������ ����������
����������
����������
!�����������
!�����������
!�����������
!�����!�����!����� ������������
���������������������������������
������
������
������
������
������
������
��$
��$
��$
%��%��%��
��������!�
�����
���������!�
�����
���������!�
�����
�
!� ����
����
!� ����
����
!� ����
����
!����
���
���
!����
���
���
!����
���
���
&� ����
�&�
����
�&�
����
�
����� ���������� ���������� �����
%��%��%��
'��������(���'��������(���'��������(���
������������ ������������
��
����
�"�*��
�
��
����
�"�*��
�
��
����
�"�*��
�
)� �)� �)� ��� �� ��
���������������
������������
���������������
������������

Tugun Bypass Environmental Impact Statement Technical Paper Number 3 Traffic and Transport
8-10
Reductions in Gold Coast Highway traffic flows, as well as a reduction in its through-traffic function, would enable opportunities for a proportion of Gold Coast Highway road space to be used for public transport purposes if required.
8.5 Cyclists and Pedestrians
8.5.1 Proposed Bicycle and Pedestrian Facilities
Cycleways and footpaths are not included along the Tugun Bypass. Cycle and walking access on the bypass would be constrained by the proposed tunnel and approach ramps (approximately 1 km long). The shoulder widths in this location would prohibit safe cycling and walking on the southern section of the bypass. Cyclists and pedestrians would not be permitted on the Tugun Bypass due to the confined conditions adjacent to a high-speed traffic environment and associated traffic pollution in the tunnel.
Cyclists would be encouraged to use the alternative Gold Coast Highway and Pacific Parade coastal cycleway links as opposed to the Tugun Bypass. The proposed Tugun Bypass alignment adjacent to the ridge behind the John Flynn Hospital and Medical Centre has long climbs compared to very flat conditions on the Gold Coast Highway cycleway, which makes the Gold Coast Highway more convenient for most cyclists.
All interchanges on the proposed bypass would be designed to accommodate bicycle and pedestrian access across the alignment. The Stewart Road and Tweed Heads Bypass crossings of the proposed bypass would be designed to accommodate cyclists and pedestrians. The design would comprise a 1.5 m wide bicycle lane on each side of the roadway and a 2.5 m wide shared pedestrian and bicycle footpath outside the barrier on the northern side of the Stewart Road and Tweed Heads Bypass bridges. This arrangement is shown in Figure 8.4. As the Stewart Road and Tweed Heads Bypass interchange service roads would likely have traffic speed limits of 70 km/h or less, the proposed 1.5 m bicycle lane has an acceptable width in accordance with AUSTROADS guidelines.
The cycling and pedestrian facilities included in the proposed Stewart Road interchange in the north would provide a link to the existing shared path adjacent to the Pacific Motorway at Currumbin. In the south, the proposed footpath and cycleway on the Tweed Heads Bypass interchange would provide access between the Gold Coast Highway cycleway and Tweed Heads West via the proposed eastern and western service roads. A 2 m wide shoulder would be provided on either side of the western service road, suitable to accommodate cyclists and a footpath would be provided on the western side if the western service road. The existing 2 m wide shoulder on the eastern side of the eastern service road is suitable to accommodate southbound cyclists. There is no provision for pedestrians along the eastern service road.

Tugun Bypass Environmental Impact Statement Technical Paper Number 3
Traffic and Transport
Queensland Department of Main Roads 8-11
Figure 8.4: Bridge Cross-Section
8.5.2 Future Opportunities
Figure 4.8 indicates the opportunities for bicycle and pedestrian facilities within the southern Gold Coast and Tweed Heads areas in the vicinity of the proposed Tugun Bypass.
The proposed provision for cyclist and walking access across the Tugun Bypass described in Section 8.5.1 would link into the existing and future pedestrian and cycleway networks.
There are currently no designated bicycle facilities on the Tweed Heads Bypass and the Pacific Highway to the south, however, the provision for cyclists across the proposed interchanges would improve conditions for cyclists who currently use the shoulders on these roads and would compliment any future cycleway network additions.
Opportunities for future bicycle and pedestrian links in combination with the proposed Tugun Bypass walking and cycling facilities include:
link between the existing off-street shared path on the Gold Coast Highway in the north to Currumbin Creek Road, via the proposed facilities at the Stewart Road interchange;
link between the Gold Coast Highway on-street cycleway and footpaths and the future Cobaki Lakes residential development, via a possible future access bridge across the bypass at Boyd Street;
link between Kennedy Drive and the Gold Coast Highway via the proposed facilities on the eastern and western service roads and the Tweed Heads Bypass interchange; and
further on-street cycling and walking opportunities on the Gold Coast Highway, including marked cycle lanes, contrasting pavement, advanced stop lines, wider footpaths, etc.

Tugun Bypass Environmental Impact Statement Technical Paper Number 3 Traffic and Transport
8-12
8.5.3 Assessment of Potential Impacts
The proposed Tugun Bypass would have a positive effect on existing cycleways in the study area. Reductions in Gold Coast Highway traffic flows, reduction of its through traffic function and removal of a proportion of heavy vehicles would improve safety for cyclists both along and across the Gold Coast Highway. The Gold Coast Highway is listed as the worst blackspot for crashes involving bicycles on the Gold Coast. The likely effect of reduced traffic on the highway would be to reduce crashes along this corridor.
In addition, although bicycle access is not provided along the bypass itself, proposed access provision on the bypass cross-roads (Stewart Road and Tweed Heads Bypass) would increase cyclist amenity in the area, especially if cycleways are linked to these connections in the future. Reductions in Gold Coast Highway traffic flows, reduction of its through-traffic function and removal of a proportion of heavy vehicles as a result of the Tugun Bypass will also provide opportunities for improved pedestrian facilities, as well as improve general conditions on the Gold Coast Highway.
8.6 Pedestrians
Reductions in Gold Coast Highway traffic flows, reduction of its through-traffic function and removal of a proportion of heavy vehicles would improve opportunities for the incorporation of pedestrian facilities across the Gold Coast Highway and would also improve conditions generally for pedestrians along and across the route.
8.7 Summary of Traffic Impacts and Mitigation Measures
The primary traffic impacts of the proposed Tugun Bypass are summarised as follows:
there would be a major reduction in travel times for inter-regional and inter-state traffic and reduced traffic flows on the Gold Coast Highway;
the reduction in Gold Coast Highway traffic flows, combined with the removal of the majority of freight traffic and the reduction in the through traffic function of the road, would improve the environment for pedestrians and cyclists along and across the route and enable the Gold Coast Highway to perform its local traffic and distribution functions and safety would also likely improve;
the long-term reduction of Gold Coast Highway traffic flows would create opportunities for a greater proportion of the road space to be allocated to non-private car-based road users;
the proposed bypass would improve the accessibility and response times of emergency services in the area; and
extension of the rail line from Robina to the Gold Coast Airport with provision of stations at Tugun and the Gold Coast Airport would require modification of existing bus routes and creation of additional bus routes. It is possible that bus patronage in the area would increase with the provision of the rail line to a level over and above that which would have been expected without the rail line extension.

Tugun Bypass Environmental Impact Statement Technical Paper Number 3
Traffic and Transport
Queensland Department of Main Roads 9-1
9. Traffic Impacts During Construction
9.1 Construction Traffic Volumes
While the construction is generally away from existing roads, haulage of material to the site would add to the traffic on the existing highway and some local roads used as access to the project’s alignment. Access to the construction site is proposed via Stewart Road, Boyd Street and Parkes Drive.
The main traffic generated by the construction site is likely to be vehicles importing fill, gravel and aggregates and vehicles used for access by site workers. Estimates of the likely level of generated traffic have been undertaken for the project.
The importation of fill may require a maximum of 50 trucks per day over a six-month period, assuming a six-day construction working week. If a batching plant is located on site for pavement construction, a maximum of 150 trucks per day may be required to use Boyd Street to deliver gravel and aggregates. This period is expected to exceed 12 months towards the end of the overall construction period.
It is estimated that the site would employ about 150 persons, generating about 600 car trips external to the site per day (total in and out). It is assumed that 75 percent of car trips would likely enter and exit the site at the northern end, with the remainder to the south.
It is estimated that general construction traffic from workforce, visitors and other deliveries may result in less that a 1 percent increase in traffic on the Gold Coast Highway.
The distribution of site-generated traffic flows to the proposed points of access would be dependant on whether there is a satisfactory internal roadway linking them. If there were such a link, all vehicles gaining access to the site to/from the north would use the Stewart Road access and most vehicles to/from the south would use the Boyd Street access (except vehicles having an origin or destination in the vicinity of the proposed Stewart Road interchange which would use Stewart Road for access to/from the south).
In the absence of such a vehicular link, the distribution of site-generated traffic flows to the proposed access points would depend only on the location of that part of the site being used. Whether there is a satisfactory internal vehicular link would most likely depend on the relative timing of the construction of the Hidden Valley bridge and the cutting through the adjacent hill.
Traffic management plans are required to ensure safe passage of vehicle movements around the site. A strategic traffic management plan would be developed during detail design. In particular the contractor would be required to provide a detailed traffic management plan to ensure safe passage of vehicle movements around the site.
9.2 Construction Vehicle Impacts
9.2.1 Haul Routes
In the absence of a satisfactory link along the proposed alignment between Stewart Road and Boyd Street, virtually all haulage to/from the site would occur via Boyd Street.
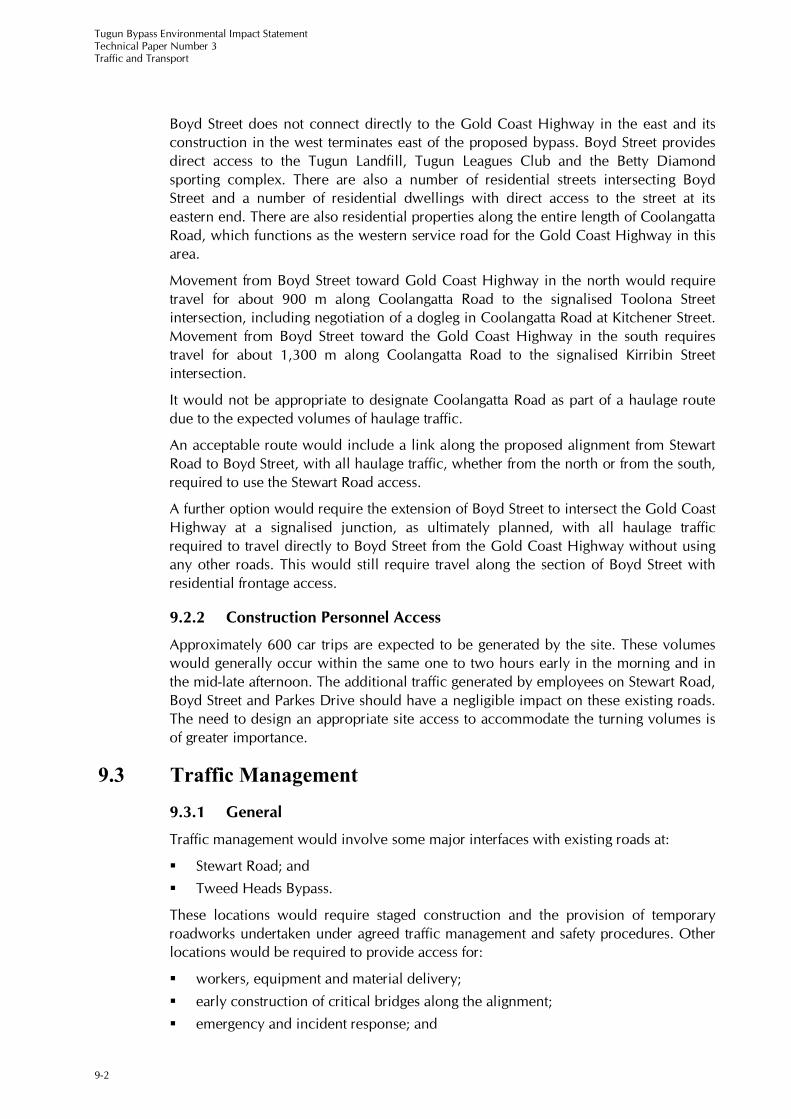
Tugun Bypass Environmental Impact Statement Technical Paper Number 3 Traffic and Transport
9-2
Boyd Street does not connect directly to the Gold Coast Highway in the east and its construction in the west terminates east of the proposed bypass. Boyd Street provides direct access to the Tugun Landfill, Tugun Leagues Club and the Betty Diamond sporting complex. There are also a number of residential streets intersecting Boyd Street and a number of residential dwellings with direct access to the street at its eastern end. There are also residential properties along the entire length of Coolangatta Road, which functions as the western service road for the Gold Coast Highway in this area.
Movement from Boyd Street toward Gold Coast Highway in the north would require travel for about 900 m along Coolangatta Road to the signalised Toolona Street intersection, including negotiation of a dogleg in Coolangatta Road at Kitchener Street. Movement from Boyd Street toward the Gold Coast Highway in the south requires travel for about 1,300 m along Coolangatta Road to the signalised Kirribin Street intersection.
It would not be appropriate to designate Coolangatta Road as part of a haulage route due to the expected volumes of haulage traffic.
An acceptable route would include a link along the proposed alignment from Stewart Road to Boyd Street, with all haulage traffic, whether from the north or from the south, required to use the Stewart Road access.
A further option would require the extension of Boyd Street to intersect the Gold Coast Highway at a signalised junction, as ultimately planned, with all haulage traffic required to travel directly to Boyd Street from the Gold Coast Highway without using any other roads. This would still require travel along the section of Boyd Street with residential frontage access.
9.2.2 Construction Personnel Access
Approximately 600 car trips are expected to be generated by the site. These volumes would generally occur within the same one to two hours early in the morning and in the mid-late afternoon. The additional traffic generated by employees on Stewart Road, Boyd Street and Parkes Drive should have a negligible impact on these existing roads. The need to design an appropriate site access to accommodate the turning volumes is of greater importance.
9.3 Traffic Management
9.3.1 General
Traffic management would involve some major interfaces with existing roads at:
Stewart Road; and
Tweed Heads Bypass.
These locations would require staged construction and the provision of temporary roadworks undertaken under agreed traffic management and safety procedures. Other locations would be required to provide access for:
workers, equipment and material delivery;
early construction of critical bridges along the alignment;
emergency and incident response; and

Tugun Bypass Environmental Impact Statement Technical Paper Number 3
Traffic and Transport
Queensland Department of Main Roads 9-3
maintenance of environmental elements along the alignment.
Construction activities would take place well clear of existing roads, requiring only minor traffic management measures at the minor access points. The contractor would be required to submit detailed traffic management plans for each section.
Critical areas requiring safe integration of the new work with the existing road network are discussed in the following section together with staging methods proposed. Technical Paper Number 2 provides further details of these traffic management proposals.
9.3.2 Stewart Road
The proposed Stewart Road interchange could be subdivided in two elements to maintain the existing traffic movement throughout the area:
Stage 1 – new Stewart Road alignment and bridge construction (early works); and
Stage 2 – motorway connection.
The Contractor would be required to provide detailed traffic management plans to enable safe traffic management during construction.
9.3.3 Tweed Heads Bypass
Tweed Heads Bypass is situated close to the proposed bypass carriageway, which allows construction off the overpass and approach roads away from existing traffic. As the final connection onto the proposed bypass requires regrading the existing pavement, a two-stage construction of this area would be involved.
During Stage 1, the northbound carriageway of the Tweed Heads Bypass could be connected to the northbound carriageway of the proposed Tugun Bypass. This would allow the construction of the southbound carriageway of the proposed Tugun Bypass over the existing northbound carriageway of the Tweed Heads Bypass. Southbound traffic on the Tweed Heads Bypass could remain unaffected.
During Stage 2, the southbound carriageway of the proposed Tugun Bypass could be connected to the southbound carriageway of the Tweed Heads Bypass. Minor works could then be undertaken on the northbound and southbound carriageways.
The Contractor would be required to provide detailed traffic management plans for these connections to ensure few and minimal impact on traffic movements.

Tugun Bypass Environmental Impact Statement Technical Paper Number 3
Traffic and Transport
Queensland Department of Main Roads 10-1
10. Conclusions The proposed Tugun Bypass and the extension of passenger rail to Gold Coast Airport would provide benefits to the southern Gold Coast. While a number of transport impacts would be generated as a consequence, these impacts can be managed through a range of mitigation measures.
10.1 Need
Without the proposed Tugun Bypass, the following would occur:
many of the transport, land use and environmental objectives of the South East Queensland Regional Framework for Growth Management, Integrated Regional Transport Plan for South East Queensland and the Gold Coast City Transport Planmay not be achieved;
many of the functional issues currently experienced along the Gold Coast Highway would worsen;
delays through Tugun-Bilinga would continue to rise;
local accessibility adjacent to the Gold Coast Highway would continue to decline;
the safety of the corridor would decline as the number and severity of crashes continue to rise;
the quality and reliability of access to the Gold Coast Airport would continue to decline;
access to the proposed rail stations at Tugun and the Gold Coast Airport would worsen due to increasing traffic congestion;
there would be less opportunity for the introduction of priority road space for public transport along the Gold Coast Highway;
safety and accessibility for pedestrians and cyclists along and across the Gold Coast Highway would continue to decline; and
reliability and efficiency of road freight movements through Tugun would continue to decline.
Without the preservation of a corridor for heavy (passenger) rail through Tugun/Coolangatta, the following would occur:
the public transport mode share targets identified in the Integrated Regional Transport Plan for South East Queensland and the Gold Coast City Transport Plancould be more difficult to achieve;
future development may preclude a future line haul public transport corridor;
integrated planning and environmental sustainability objectives of state and local governments would be more difficult to achieve;
public transport access to the Gold Coast Airport would be more difficult to improve; and
it would be more difficult to attract private vehicle trips onto public transport in the southern Gold Coast.

Tugun Bypass Environmental Impact Statement Technical Paper Number 3 Traffic and Transport
10-2
10.2 Design Considerations
Traffic analysis of each intersection has been undertaken using aaSIDRA. The proposed bypass and its ramps have been assessed for their future level of service using the Highway Capacity Manual (Transport Research Board 2000 methods). A design year of 2027 has been nominated for determining the intersection configuration and staging opportunities have been considered at years 2007, 2017 and 2027.
The results of these analyses are summarised as follows:
a four-lane Tugun Bypass should have adequate capacity to 2027. The ramps and interchanges would have adequate capacity at 2027;
the proposed Stewart Road interchange would require a six-lane bridge over the proposed Tugun Bypass, with signalised intersections on both sides. Dual right-turn lanes would be needed at these intersections for east to north and west to south right turns. There are no identified opportunities for staging the configuration of these intersections; and
the proposed Tweed Heads Bypass interchange would involve a five-lane bridge. Signalised intersections on each side of the interchange have been recommended and these would need to be coordinated to manage vehicle queue lengths on the bridge.
10.3 Impact Assessment
The operational period traffic and transport impacts associated with the proposed Tugun Bypass and rail corridor are summarised as follows:
there would be improved travel times for inter-regional and inter-state traffic and reduced traffic flows on the Gold Coast Highway;
the reduction in Gold Coast Highway traffic flows, combined with the removal of the majority of freight traffic and the reduction in the through-traffic function of the road, would improve the environment for pedestrians and cyclists along and across the route and enable the Gold Coast Highway to perform its local traffic and distribution functions;
the long-term relief of Gold Coast Highway traffic flows would create opportunities for a greater proportion of the road space to be allocated to non-private car based road users;
the proposed bypass would improve the accessibility and response times of emergency services in the area; and
extension of the rail line from Robina to the Gold Coast Airport, with the provision of stations at Tugun and the airport, would require modification of existing bus routes and the creation of additional ones. It is likely that bus patronage in the area would increase with the provision of the rail line to a level above that which would have been expected without the rail line extension.
The construction period impacts associated with the proposed Tugun Bypass and the rail corridor are listed as follows:
the haulage of imported fill, gravel and aggregates to the site would introduce a maximum of approximately 150 truck trips per day into the area;
Tugun Bypass Environmental Impact Statement Technical Paper Number 3
Traffic and Transport
Queensland Department of Main Roads 10-3
construction employees accessing the site would do so at either Stewart Road, Boyd Street or Parkes Drive. The traffic volumes generated by these movements would have a minimal impact on these roads; and
partial road closures and diversions would only be required near the proposed Stewart Road interchange and the proposed Tweed Heads Bypass interchange. The impacts of these changes would be manageable through the use of diversion tracks, the new eastern and western service roads near Kennedy Drive and the use of night works where required.

Tugun Bypass Environmental Impact Statement Technical Paper Number 3
Traffic and Transport
Queensland Department of Main Roads
References Abacus Surveys 2000, Tweed Heads Traffic Survey, Conducted on 13 –14 December 2000.
Australian Bureau of Statistics 2001, Census of Population and Housing 2001,Commonwealth Government, Canberra.
Australian Bureau of Statistics 1996, Census of Population and Housing 1996,Commonwealth Government, Canberra.
ARRB Transport Research 1998, Integrated Transport Strategies’ Role in Local Government, Proceeding of the 18th AITPM Conference, Major Events – Traffic and Transport Planning, Hotel Sofitel, Melbourne, 5-6 June 1997, ARRB Transport Research, Perth.
AUSTROADS 1991, Guide to Traffic Engineering Practice, Part 2 – Roadway Capacity,AUSTROADS, Sydney.
Gold Coast Airport Limited 2001, Coolangatta Airport Final Master Plan, Gold Coast Airport Limited.
Gold Coast City Council 2001a, Gold Coast Bicycle Network Operational Plan, prepared by Gutteridge Haskins and Davey.
Gold Coast City Council 2001b, Gold Coast Cycling Guide.
Gold Coast City Council 1997, Gold Coast EMME/2 Model – Technical Report, prepared by Sinclair Knight Merz.
Gold Coast City Council 2002, Gold Coast EMME/2 Model Update – Technical Report, prepared by ARUP.
Gold Coast City Council 1999, Our Community – A Social Profile of the City of Gold Coast, Gold Coast City Council.
Gold Coast City Council 1998, Gold Coast City Transport Plan, - Transport Master Plan 1999 to 2030, Transportation Planning Branch, Gold Coast City Council.
Gold Coast City Council 1996, Gold Coast Bicycle Network Strategy, Gold Coast City Council.
Kroes E., Daly A., Gunn H. and van der Hoom T. 1996, The Opening of the Amsterdam Ring Road, Transportation, 23: 71-82.
Leda Manorstead Pty Ltd 1999, Cobaki Lakes Master Plan,. prepared by Cardno Davies.
NSW Roads and Traffic Authority 2001, Traffic Data, NSW Government.
NSW Roads and Traffic Authority 1999, Action for Bikes: Bike Plan 2010, NSW Government, Sydney.
NSW Roads and Traffic Authority 1998, Action for Transport 2010 – An Integrated Transport Plan for NSW, NSW Government, Sydney.
NSW Roads and Traffic Authority, Road Safety Bureau 1993, Rural Crash Rates – Road Sterotypes, Summary Report, NSW Government, Sydney.

Tugun Bypass Environmental Impact Statement Technical Paper Number 3 Traffic and Transport
Parsons Brinckerhoff 2003, Robina to Tugun Impact Assessment Study, Queensland Transport.
Queensland Department of Main Roads 2002, Traffic Data, Queensland Government.
Queensland Department of Main Roads 2001, Traffic Data, Queensland Government.
Queensland Department of Main Roads 2000, Traffic Data, Queensland Government.
Queensland Department of Main Roads 1999, Pacific Highway at Tugun - Route Selection Report, prepared by Connell Wagner.
Queensland Government 2002, Transport 2007 Implementation Report 2001.
Queensland Transport 2001a, Draft Integrated Regional Cycle Plan for South East Queensland, Queensland Government, Brisbane.
Queensland Transport 2001b, Road Crash Database, Queensland Government, Brisbane.
Queensland Transport 2001c, Transport 2007 - An Action Plan for South East Queensland, Queensland Government, Brisbane.
Queensland Transport 1999, Cycle South East – Integrated Cycle Strategy for South East Queensland, Queensland Government, Brisbane.
Queensland Transport 1998, Southern Gold Coast – Tweed Corridor Study, Final Report, report prepared by Connell Wagner.
Queensland Transport 1997a, Integrated Regional Transport Plan for South East Queensland, Queensland Government, Brisbane.
Queensland Transport 1997b, Southern Gold Coast – Tweed Corridor Study, Needs Paper, report prepared by Connell Wagner.
Queensland Transport 1996, South East Queensland Freight Study, Queensland Government, Brisbane.
Queensland Transport 1992, South East Queensland Household Travel Survey.
Queensland Transport 2003, Draft Queensland Cycle Strategy.
Regional Coordinating Committee 2002, South East Queensland Performance Monitoring Report 2001.
Standing Advisory Committee on Trunk Road Assessment 1999, Transport and the Economy, UK Department of the Environment, Transport and the Regions, London, England.
Standing Advisory Committee on Trunk Road Assessment 1994, Trunk Roads and the Generation of Traffic, UK Department of Traffic, London, England.
SEQ 2001 Project 2000, South East Queensland Regional Framework for Growth Management,, Queensland Government Department of Communication and Information, Local Government, Planning and Sport, Brisbane.
Transport Research Board 1985, Highway Capacity Manual, Special Report 209,Transport Research Board, Washington.
Tweed Shire Council 1999, Section 94 Contributions Plan Number 22 – Cycleways, Version 1, Tweed Shire Council.

Tugun Bypass Environmental Impact Statement Technical Paper Number 3
Traffic and Transport
Queensland Department of Main Roads
Tweed Shire Council 1997, Lower Tweed River Transportation Study, Tweed Shire Council.
Tweed Shire Council 1995a, Development Control Plan Number 17 – Cobaki Lakes,Tweed Shire Council.
Tweed Shire Council 1995b, Tweed Bicycle Plan, Tweed Shire Council, May.
LegislationQueensland
Transport Infrastructure Act 1994.

Tugun Bypass Environmental Impact Statement Technical Paper Number 3
Traffic and Transport
Queensland Department of Main Roads
Appendix A
Traffic Volumes

AM 2007 Turn Volumes (1hr)
Stewart Road InterchangeMerge Nthbnd Sthbnd Diverge
1467 1943 1765 987
Right Thru Left Right Thru Left
223 764
Left 365 1102 Right Left Right
Thru 319 364 Thru Thru 258 1244 Thru
Right Left Right 61 10 Left
72 10
Left Thru Right Left Thru Right
82 1943 1765 71
Diverge Nthbnd Sthbnd Merge
Tweed Heads Bypass Interchange
Merge Nthbnd Sthbnd Diverge
119 1895 1743 93
Right Thru Left Right Thru Left
36 47 10
Left 103 16 Right Left Right
Thru 295 135 Thru Thru 464 276 Thru
Right Left Right 10 118 Left
10 169 16 354
Left Thru Right Left Thru Right
179 1895 1743 177
Diverge Nthbnd Sthbnd Merge
Kennedy Drive
Nthbnd Sthbnd
2064 1920
Right Thru Left Right Thru Left
135 10 58 10 107
Left 362 36 Right Left 127 243 Right
Thru 788 241 Thru Thru 606 219 Thru
Right Left Right 180 46 Left
83 125
Left Thru Right Left Thru Right
208 2064 1920 226
Diverge Nthbnd Sthbnd Merge
Ke
nn
ed
y
Drive
We
st
We
ste
rn
Se
rvic
e
Ro
ad
Ste
wa
rt
Ro
ad
Pa
cific
Hig
hw
ay/
Go
ld C
oa
st
Hig
hw
ay
Tw
ee
d
He
ad
s
Byp
ass
Ke
nn
ed
y
Driv
e E
ast
Northbound On-Ramp
Northbound Off-Ramp
Northbound Off-Ramp
Eastern Service Road
Southbound On-Ramp
Western Service Road
Northbound Off-Ramp
Northbound On-Ramp Southbound Off-Ramp
Southbound On-Ramp
Southbound Off-Ramp
Eastern Service Road
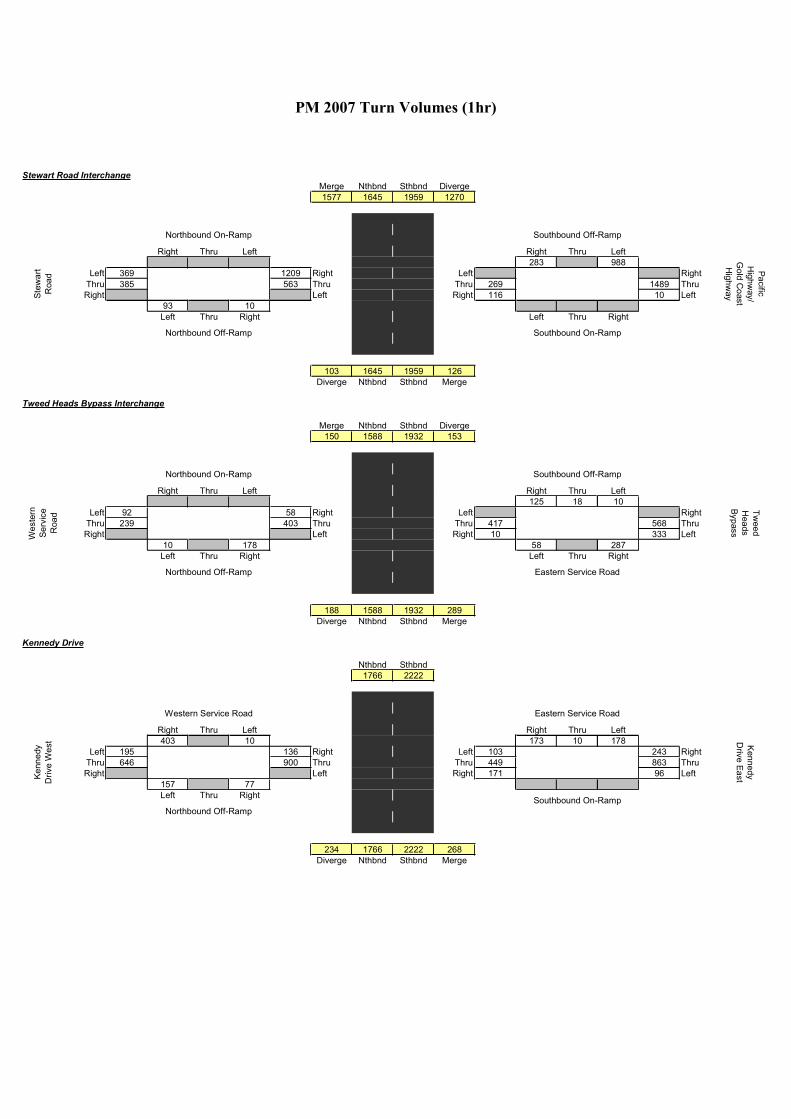
PM 2007 Turn Volumes (1hr)
Stewart Road InterchangeMerge Nthbnd Sthbnd Diverge
1577 1645 1959 1270
Right Thru Left Right Thru Left
283 988
Left 369 1209 Right Left Right
Thru 385 563 Thru Thru 269 1489 Thru
Right Left Right 116 10 Left
93 10
Left Thru Right Left Thru Right
103 1645 1959 126
Diverge Nthbnd Sthbnd Merge
Tweed Heads Bypass Interchange
Merge Nthbnd Sthbnd Diverge
150 1588 1932 153
Right Thru Left Right Thru Left
125 18 10
Left 92 58 Right Left Right
Thru 239 403 Thru Thru 417 568 Thru
Right Left Right 10 333 Left
10 178 58 287
Left Thru Right Left Thru Right
188 1588 1932 289
Diverge Nthbnd Sthbnd Merge
Kennedy Drive
Nthbnd Sthbnd
1766 2222
Right Thru Left Right Thru Left
403 10 173 10 178
Left 195 136 Right Left 103 243 Right
Thru 646 900 Thru Thru 449 863 Thru
Right Left Right 171 96 Left
157 77
Left Thru Right
234 1766 2222 268
Diverge Nthbnd Sthbnd Merge
Southbound On-Ramp
Western Service Road
Northbound Off-Ramp
Northbound On-Ramp Southbound Off-Ramp
Southbound On-Ramp
Southbound Off-Ramp
Eastern Service Road
Ke
nn
edy
Dri
ve W
est
We
ste
rn
Se
rvic
e
Roa
d
Ste
wa
rt
Roa
d
Pa
cific
Hig
hw
ay/
Go
ld C
oast
Hig
hw
ay
Tw
ee
d
Hea
ds
Byp
ass
Ken
ne
dy
Driv
e E
ast
Northbound On-Ramp
Northbound Off-Ramp
Northbound Off-Ramp
Eastern Service Road

AM 2017 Turn Volumes (1hr)
Stewart Road InterchangeMerge Nthbnd Sthbnd Diverge
1597 2270 2256 1136
Right Thru Left Right Thru Left
172 964
Left 214 1383 Right Left Right
Thru 478 374 Thru Thru 362 1584 Thru
Right Left Right 117 10 Left
103 10
Left Thru Right Left Thru Right
113 2270 2256 127
Diverge Nthbnd Sthbnd Merge
Tweed Heads Bypass Interchange
Merge Nthbnd Sthbnd Diverge
190 2184 2232 151
Right Thru Left Right Thru Left
36 105 10
Left 155 35 Right Left Right
Thru 301 165 Thru Thru 659 466 Thru
Right Left Right 10 155 Left
10 358 435 425 35 361
Left Thru Right Left Thru Right
368 2184 2232 337
Diverge Nthbnd Sthbnd Merge
Kennedy Drive
Nthbnd Sthbnd
2542 2569
Right Thru Left Right Thru Left
165 10 71 10 189
Left 373 83 Right Left 129 267 Right
Thru 911 310 Thru Thru 616 322 Thru
Right Left Right 260 40 Left
111 94
Left Thru Right
204 2542 2569 300
Diverge Nthbnd Sthbnd Merge
Southbound On-Ramp
Western Service Road
Northbound Off-Ramp
Northbound On-Ramp Southbound Off-Ramp
Southbound On-Ramp
Southbound Off-Ramp
Eastern Service Road
Ke
nn
edy
Dri
ve W
est
We
ste
rn
Se
rvic
e
Roa
d
Ste
wa
rt
Roa
d
Pa
cific
Hig
hw
ay/
Go
ld C
oast
Hig
hw
ay
Tw
ee
d
Hea
ds
Byp
ass
Ken
ne
dy
Driv
e E
ast
Northbound On-Ramp
Northbound Off-Ramp
Northbound Off-Ramp
Eastern Service Road

PM 2017 Turn Volumes (1hr)
Stewart Road InterchangeMerge Nthbnd Sthbnd Diverge
1890 2132 2394 1358
Right Thru Left Right Thru Left
214 1144
Left 328 1562 Right Left Right
Thru 542 610 Thru Thru 382 1958 Thru
Right Left Right 160 10 Left
141 10
Left Thru Right Left Thru Right
151 2132 2394 170
Diverge Nthbnd Sthbnd Merge
Tweed Heads Bypass Interchange
Merge Nthbnd Sthbnd Diverge
228 2045 2369 195
Right Thru Left Right Thru Left
897 908 150 34 10
Left 153 75 Right Left Right
Thru 253 412 Thru Thru 594 747 Thru
Right Left Right 10 314 Left
10 341 771 761 75 303
Left Thru Right Left Thru Right
351 2045 2369 485
Diverge Nthbnd Sthbnd Merge
Kennedy Drive
Nthbnd Sthbnd
2386 2854
Right Thru Left Right Thru Left
412 10 176 10 172
Left 230 176 Right Left 108 270 Right
Thru 806 919 Thru Thru 519 919 Thru
Right Left Right 268 90 Left
136 89
Left Thru Right
225 2386 2854 358
Diverge Nthbnd Sthbnd Merge
Ke
nn
edy
Dri
ve W
est
We
ste
rn
Se
rvic
e
Roa
d
Ste
wa
rt
Roa
d
Pa
cific
Hig
hw
ay/
Go
ld C
oast
Hig
hw
ay
Tw
ee
d
Hea
ds
Byp
ass
Ken
ne
dy
Driv
e E
ast
Northbound On-Ramp
Northbound Off-Ramp
Northbound Off-Ramp
Eastern Service Road
Southbound On-Ramp
Western Service Road
Northbound Off-Ramp
Northbound On-Ramp Southbound Off-Ramp
Southbound On-Ramp
Southbound Off-Ramp
Eastern Service Road

AM 2027 Turn Volumes (1hr)
Stewart Road InterchangeMerge Nthbnd Sthbnd Diverge
1629 3055 2866 1243
Right Thru Left Right Thru Left
209 1034
Left 259 1370 Right Left Right
Thru 579 406 Thru Thru 328 1566 Thru
Right Left Right 251 12 Left
172 12
Left Thru Right Left Thru Right
172 3055 2866 251
Diverge Nthbnd Sthbnd Merge
Tweed Heads Bypass Interchange
Merge Nthbnd Sthbnd Diverge
535 2691 2812 304
Right Thru Left Right Thru Left
104 200 10
Left 459 75 Right Left Right
Thru 226 200 Thru Thru 613 395 Thru
Right Left Right 10 114 Left
10 387 75 271
Left Thru Right Left Thru Right
387 2691 2812 299
Diverge Nthbnd Sthbnd Merge
Kennedy Drive
Nthbnd Sthbnd
3077 3111
Right Thru Left Right Thru Left
200 10 86 10 229
Left 510 175 Right Left 97 249 Right
Thru 1044 376 Thru Thru 745 465 Thru
Right Left Right 315 48 Left
134 10 113
Left Thru Right
248 3077 3111 363
Diverge Nthbnd Sthbnd Merge
Ke
nn
edy
Dri
ve W
est
We
ste
rn
Se
rvic
e
Roa
d
Ste
wa
rt
Roa
d
Pa
cific
Hig
hw
ay/
Go
ld C
oast
Hig
hw
ay
Tw
ee
d
Hea
ds
Byp
ass
Ken
ne
dy
Driv
e E
ast
Northbound On-Ramp
Northbound Off-Ramp
Northbound Off-Ramp
Eastern Service Road
Southbound On-Ramp
Western Service Road
Northbound Off-Ramp
Northbound On-Ramp Southbound Off-Ramp
Southbound On-Ramp
Southbound Off-Ramp
Eastern Service Road

PM 2027 Turn Volumes (1hr)
Stewart Road InterchangeMerge Nthbnd Sthbnd Diverge
2016 2855 3115 1428
Right Thru Left Right Thru Left
259 1169
Left 397 1619 Right Left Right
Thru 657 650 Thru Thru 349 2010 Thru
Right Left Right 308 12 Left
258 12
Left Thru Right Left Thru Right
258 2855 3115 308
Diverge Nthbnd Sthbnd Merge
Tweed Heads Bypass Interchange
Merge Nthbnd Sthbnd Diverge
549 2565 2983 441
Right Thru Left Right Thru Left
280 160 10
Left 428 120 Right Left Right
Thru 182 498 Thru Thru 507 692 Thru
Right Left Right 10 262 Left
10 325 120 219
Left Thru Right Left Thru Right
325 2565 2983 474
Diverge Nthbnd Sthbnd Merge
Kennedy Drive
Nthbnd Sthbnd
2890 3456
Right Thru Left Right Thru Left
498 10 214 10 209
Left 331 280 Right Left 78 260 Right
Thru 923 1113 Thru Thru 629 1179 Thru
Right Left Right 324 108 Left
164 10 108
Left Thru Right
272 2890 3456 434
Diverge Nthbnd Sthbnd Merge
Southbound On-Ramp
Western Service Road
Northbound Off-Ramp
Northbound On-Ramp Southbound Off-Ramp
Southbound On-Ramp
Southbound Off-Ramp
Eastern Service Road
Ke
nn
edy
Dri
ve W
est
We
ste
rn
Se
rvic
e
Roa
d
Ste
wa
rt
Roa
d
Pa
cific
Hig
hw
ay/
Go
ld C
oast
Hig
hw
ay
Tw
ee
d
Hea
ds
Byp
ass
Ken
ne
dy
Driv
e E
ast
Northbound On-Ramp
Northbound Off-Ramp
Northbound Off-Ramp
Eastern Service Road

Tugun Bypass Environmental Impact Statement Technical Paper Number 3
Traffic and Transport
Queensland Department of Main Roads
Appendix B
SIDRA Output – Stewart Road Interchange
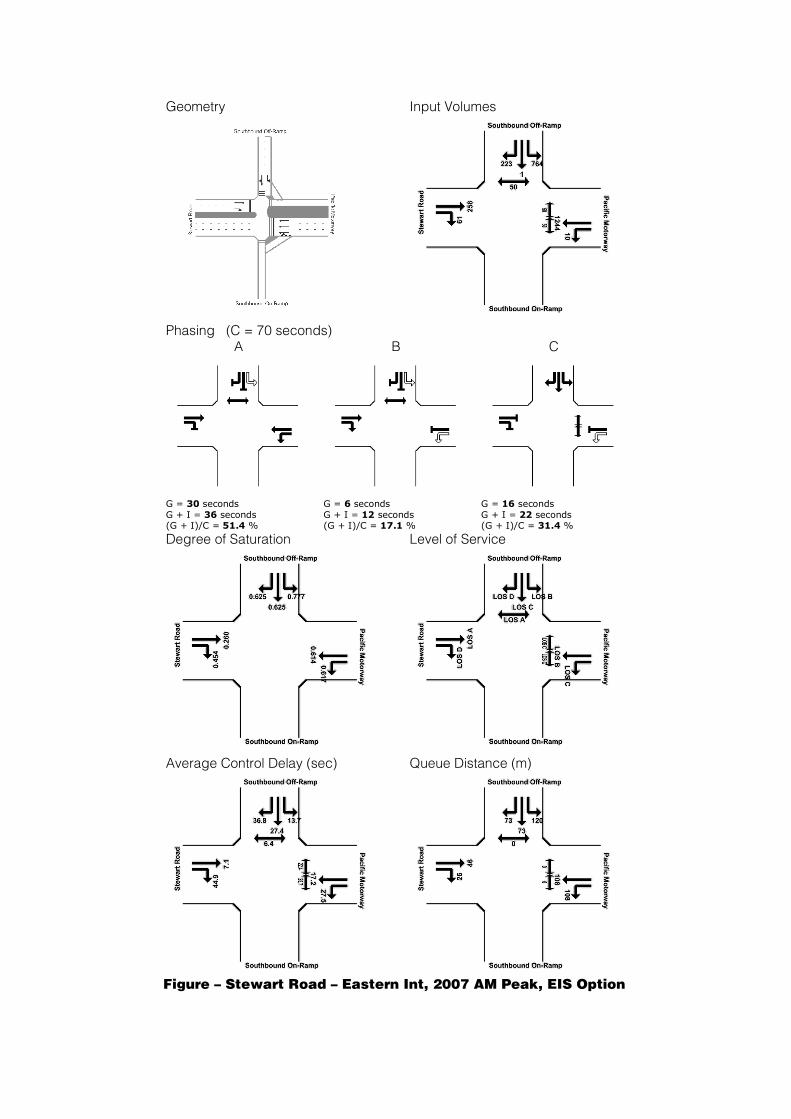
Geometry Input Volumes
Phasing (C = 70 seconds) A B C
G = 30 seconds G + I = 36 seconds (G + I)/C = 51.4 %
G = 6 seconds G + I = 12 seconds (G + I)/C = 17.1 %
G = 16 seconds G + I = 22 seconds (G + I)/C = 31.4 %
Degree of Saturation Level of Service
Average Control Delay (sec) Queue Distance (m)
Figure – Stewart Road – Eastern Int, 2007 AM Peak, EIS Option

Geometry Input Volumes
Phasing (C = 70 seconds) A B C
G = 28 seconds G + I = 34 seconds (G + I)/C = 48.6 %
G = 7 seconds G + I = 13 seconds (G + I)/C = 18.6 %
G = 17 seconds G + I = 23 seconds (G + I)/C = 32.9 %
Degree of Saturation Level of Service
Average Control Delay (sec) Queue Distance (m)
Figure – Stewart Road – Eastern Int, 2007 PM Peak, EIS Option

Geometry Input Volumes
Phasing (C = 70 seconds) A B C
G = 34 seconds G + I = 40 seconds (G + I)/C = 57.1 %
G = 6 seconds G + I = 12 seconds (G + I)/C = 17.1 %
G = 12 seconds G + I = 18 seconds (G + I)/C = 25.7 %
Degree of Saturation Level of Service
Average Control Delay (sec) Queue Distance (m)
Figure – Stewart Road – Eastern Int, 2017 AM Peak, EIS Option

Geometry Input Volumes
Phasing (C = 80 seconds) A B C
G = 43 seconds G + I = 49 seconds (G + I)/C = 61.3 %
G = 6 seconds G + I = 12 seconds (G + I)/C = 15.0 %
G = 13 seconds G + I = 19 seconds (G + I)/C = 23.8 %
Degree of Saturation Level of Service
Average Control Delay (sec) Queue Distance (m)
Figure – Stewart Road – Eastern Int, 2017 PM Peak, EIS Option

Geometry Input Volumes
Phasing (C = 120 seconds) A B C
G = 49 seconds G + I = 55 seconds (G + I)/C = 45.8 %
G = 26 seconds G + I = 32 seconds (G + I)/C = 26.7 %
G = 27 seconds G + I = 33 seconds (G + I)/C = 27.5 %
Degree of Saturation Level of Service
Average Control Delay (sec) Queue Distance (m)
Figure – Stewart Road – Eastern Int, 2027 AM Peak, EIS Option

Geometry Input Volumes
Phasing (C = 120 seconds) A B C
G = 54 seconds G + I = 60 seconds (G + I)/C = 50.0 %
G = 24 seconds G + I = 30 seconds (G + I)/C = 25.0 %
G = 24 seconds G + I = 30 seconds (G + I)/C = 25.0 %
Degree of Saturation Level of Service
Average Control Delay (sec) Queue Distance (m)
Figure – Stewart Road – Eastern Int, 2027 PM Peak, EIS Option

Geometry Input Volumes
Phasing (C = 70 seconds) A B C
G = 12 seconds G + I = 18 seconds (G + I)/C = 25.7 %
G = 27 seconds G + I = 33 seconds (G + I)/C = 47.1 %
G = 13 seconds G + I = 19 seconds (G + I)/C = 27.1 %
Degree of Saturation Level of Service
Average Control Delay (sec) Queue Distance (m)
Figure – Stewart Road – Western Int, 2007 AM Peak, EIS Option

Geometry Input Volumes
Phasing (C = 70 seconds) A B C
G = 14 seconds G + I = 20 seconds (G + I)/C = 28.6 %
G = 29 seconds G + I = 35 seconds (G + I)/C = 50.0 %
G = 9 seconds G + I = 15 seconds (G + I)/C = 21.4 %
Degree of Saturation Level of Service
Average Control Delay (sec) Queue Distance (m)
Figure – Stewart Road – Western Int, 2007 PM Peak, EIS Option

Geometry Input Volumes
Phasing (C = 70 seconds) A B C
G = 11 seconds G + I = 17 seconds (G + I)/C = 24.3 %
G = 32 seconds G + I = 38 seconds (G + I)/C = 54.3 %
G = 9 seconds G + I = 15 seconds (G + I)/C = 21.4 %
Degree of Saturation Level of Service
Average Control Delay (sec) Queue Distance (m)
Figure – Stewart Road – Western Int, 2017 AM Peak, EIS Option

Geometry Input Volumes
Phasing (C = 80 seconds) A B C
G = 16 seconds G + I = 22 seconds (G + I)/C = 24.4 %
G = 47 seconds G + I = 53 seconds (G + I)/C = 58.9 %
G = 9 seconds G + I = 15 seconds (G + I)/C = 16.7 %
Degree of Saturation Level of Service
Average Control Delay (sec) Queue Distance (m)
Figure – Stewart Road – Western Int, 2017 PM Peak, EIS Option

Geometry Input Volumes
Phasing (C = 120 seconds) A B C
G = 22 seconds G + I = 28 seconds (G + I)/C = 23.3 %
G = 58 seconds G + I = 64 seconds (G + I)/C = 53.3 %
G = 22 seconds G + I = 28 seconds (G + I)/C = 23.3 %
Degree of Saturation Level of Service
Average Control Delay (sec) Queue Distance (m)
Figure – Stewart Road – Western Int, 2027 AM Peak, EIS Option

Geometry Input Volumes
Phasing (C = 120 seconds) A B C
G = 21 seconds G + I = 27 seconds (G + I)/C = 22.5 %
G = 69 seconds G + I = 75 seconds (G + I)/C = 62.5 %
G = 12 seconds G + I = 18 seconds (G + I)/C = 15.0 %
Degree of Saturation Level of Service
Average Control Delay (sec) Queue Distance (m)
Figure – Stewart Road – Western Int, 2027 PM Peak, EIS Option

Tugun Bypass Environmental Impact Statement Technical Paper Number 3
Traffic and Transport
Queensland Department of Main Roads
Appendix C
SIDRA Output –Tweed Heads Bypass Interchange

Geometry Input Volumes
Phasing (C = 80 seconds) A B C D
G = 11 seconds G + I = 17 seconds (G + I)/C = 21.3 %
G = 6 seconds G + I = 12 seconds (G + I)/C = 15.0 %
G = 9 seconds G + I = 15 seconds (G + I)/C = 18.8 %
G = 30 seconds G + I = 36 seconds (G + I)/C = 45.0 %
Degree of Saturation Level of Service
Average Control Delay (sec) Queue Distance (m)
Figure – Tweed Heads – Eastern Int, 2007 AM Peak, EIS Option

Geometry Input Volumes
Phasing (C=80 seconds) A B C D
G = 18 seconds G + I = 24 seconds (G + I)/C = 30.0 %
G = 6 seconds G + I = 12 seconds (G + I)/C = 15.0 %
G = 9 seconds G + I = 15 seconds (G + I)/C = 18.8 %
G = 23 seconds G + I = 29 seconds (G + I)/C = 36.3 %
Degree of Saturation Level of Service
Average Control Delay (sec) Queue Distance (m)
Figure – Tweed Heads – Eastern Int, 2007 PM Peak, EIS Option

Geometry Input Volumes
Phasing (C = 80 seconds) A B C D
G = 15 seconds G + I = 21 seconds (G + I)/C = 26.3 %
G = 6 seconds G + I = 12 seconds (G + I)/C = 15.0 %
G = 9 seconds G + I = 15 seconds (G + I)/C = 18.8 %
G = 26 seconds G + I = 32 seconds (G + I)/C = 40.0 %
Degree of Saturation Level of Service
Average Control Delay (sec) Queue Distance (m)
Figure – Tweed Heads – Eastern Int, 2017 AM Peak, EIS Option

Geometry Input Volumes
Phasing (C = 100 seconds) A B C D
G = 30 seconds G + I = 36 seconds (G + I)/C = 36.0 %
G = 6 seconds G + I = 12 seconds (G + I)/C = 12.0 %
G = 9 seconds G + I = 15 seconds (G + I)/C = 15.0 %
G = 31 seconds G + I = 37 seconds (G + I)/C = 37.0 %
Degree of Saturation Level of Service
Average Control Delay (sec) Queue Distance (m)
Figure – Tweed Heads – Eastern Int, 2017 PM Peak, EIS Option

Geometry Input Volumes
Phasing (C = 80 seconds) A B C D
G = 13 seconds G + I = 19 seconds (G + I)/C = 23.8 %
G = 6 seconds G + I = 12 seconds (G + I)/C = 15.0 %
G = 13 seconds G + I = 19 seconds (G + I)/C = 23.8 %
G = 24 seconds G + I = 30 seconds (G + I)/C = 37.5 %
Degree of Saturation Level of Service
Average Control Delay (sec) Queue Distance (m)
Figure – Tweed Heads – Eastern Int, 2027 AM Peak, EIS Option

Geometry Input Volumes
Phasing (C = 80 seconds) A B C D
G = 19 seconds G + I = 25 seconds (G + I)/C = 31.3 %
G = 6 seconds G + I = 12 seconds (G + I)/C = 15.0 %
G = 12 seconds G + I = 18 seconds (G + I)/C = 22.5 %
G = 19 seconds G + I = 25 seconds (G + I)/C = 31.3 %
Degree of Saturation Level of Service
Average Control Delay (sec) Queue Distance (m)
Figure – Tweed Heads – Eastern Int, 2027 PM Peak, EIS Option

Geometry Input Volumes
Phasing (C = 80 seconds) A B C
G = 35 seconds G + I = 41 seconds (G + I)/C = 51.3 %
G = 6 seconds G + I = 12 seconds (G + I)/C = 15.0 %
G = 21 seconds G + I = 27 seconds (G + I)/C = 33.8 %
Degree of Saturation Level of Service
Average Control Delay (sec) Queue Distance (m)
Figure – Tweed Heads – Western Int, 2007 AM Peak, EIS Option
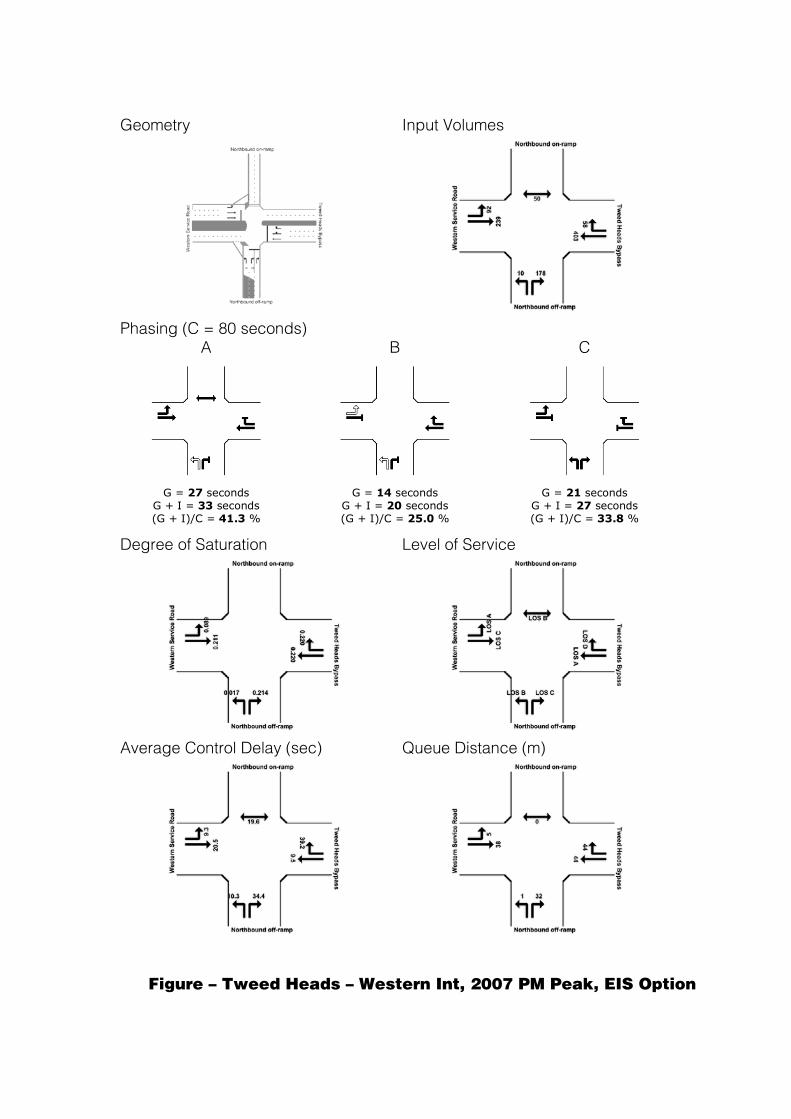
Geometry Input Volumes
Phasing (C = 80 seconds) A B C
G = 27 seconds G + I = 33 seconds (G + I)/C = 41.3 %
G = 14 seconds G + I = 20 seconds (G + I)/C = 25.0 %
G = 21 seconds G + I = 27 seconds (G + I)/C = 33.8 %
Degree of Saturation Level of Service
Average Control Delay (sec) Queue Distance (m)
Figure – Tweed Heads – Western Int, 2007 PM Peak, EIS Option

Geometry Input Volumes
Phasing (C= 80 seconds) A B C
G = 25 seconds G + I = 31 seconds (G + I)/C = 38.8 %
G = 6 seconds G + I = 12 seconds (G + I)/C = 15.0 %
G = 31 seconds G + I = 37 seconds (G + I)/C = 46.3 %
Degree of Saturation Level of Service
Average Control Delay (sec) Queue Distance (m)
Figure – Tweed Heads – Western Int, 2017 AM Peak, EIS Option

Geometry Input Volumes
Phasing (C = 100 seconds) A B C
G = 27 seconds G + I = 33 seconds (G + I)/C = 33.0 %
G = 17 seconds G + I = 23 seconds (G + I)/C = 23.0 %
G = 38 seconds G + I = 44 seconds (G + I)/C = 44.0 %
Degree of Saturation Level of Service
Average Control Delay (sec) Queue Distance (m)
Figure – Tweed Heads – Western Int, 2017 PM Peak, EIS Option

Geometry Input Volumes
Phasing (C = 80 seconds) A B C
G = 19 seconds G + I = 25 seconds (G + I)/C = 31.3 %
G = 8 seconds G + I = 14 seconds (G + I)/C = 17.5 %
G = 35 seconds G + I = 41 seconds (G + I)/C = 51.3 %
Degree of Saturation Level of Service
Average Control Delay (sec) Queue Distance (m)
Figure – Tweed Heads – Western Int, 2027 AM Peak, EIS Option

Geometry Input Volumes
Phasing (C = 80 seconds) A B C
G = 14 seconds G + I = 20 seconds (G + I)/C = 25.0 %
G = 23 seconds G + I = 29 seconds (G + I)/C = 36.3 %
G = 25 seconds G + I = 31 seconds (G + I)/C = 38.8 %
Degree of Saturation Level of Service
Average Control Delay (sec) Queue Distance (m)
Figure – Tweed Heads – Western Int, 2027 PM Peak, EIS Option

Tugun Bypass Environmental Impact Statement Technical Paper Number 3
Traffic and Transport
Queensland Department of Main Roads
Appendix D
SIDRA Output – Kennedy Drive Interchange

Geometry Input Volumes
Degree of Saturation Level of Service
Average Control Delay (sec) Queue Distance (m)
Figure – Kennedy Drive – Eastern Int, 2007 AM Peak, EIS Option
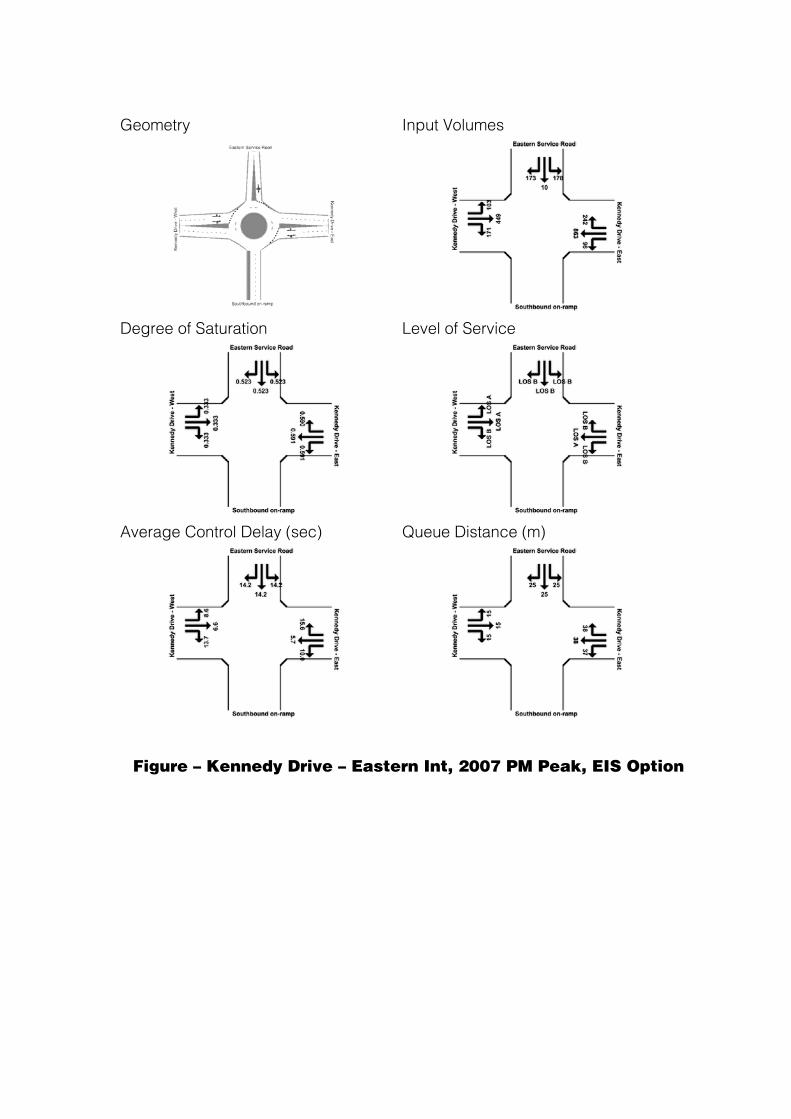
Geometry Input Volumes
Degree of Saturation Level of Service
Average Control Delay (sec) Queue Distance (m)
Figure – Kennedy Drive – Eastern Int, 2007 PM Peak, EIS Option

Geometry Input Volumes
Degree of Saturation Level of Service
Average Control Delay (sec) Queue Distance (m)
Figure – Kennedy Drive – Eastern Int, 2017 AM Peak, EIS Option

Geometry Input Volumes
Degree of Saturation Level of Service
Average Control Delay (sec) Queue Distance (m)
Figure – Kennedy Drive – Eastern Int, 2017 PM Peak, EIS Option

Geometry Input Volumes
Phasing (C = 80 seconds) A B C
G = 25 seconds G + I = 31 seconds (G + I)/C = 38.8 %
G = 30 seconds G + I = 36 seconds (G + I)/C = 45.0 %
G = 7 seconds G + I = 13 seconds (G + I)/C = 16.3 %
Degree of Saturation Level of Service
Average Control Delay (sec) Queue Distance (m)
Figure – Kennedy Drive – Eastern Int, 2027 AM Peak, EIS Option

Geometry Input Volumes
Phasing (C = 100 seconds) A B C
G = 24 seconds G + I = 30 seconds (G + I)/C = 30.0 %
G = 42 seconds G + I = 48 seconds (G + I)/C = 48.0 %
G = 16 seconds G + I = 22 seconds (G + I)/C = 22.0 %
Degree of Saturation Level of Service
Average Control Delay (sec) Queue Distance (m)
Figure – Kennedy Drive – Eastern Int, 2027 PM Peak, EIS Option

Geometry Input Volumes
Degree of Saturation Level of Service
Average Control Delay (sec) Queue Distance (m)
Figure – Kennedy Drive – Western Int, 2007 AM Peak, EIS Option
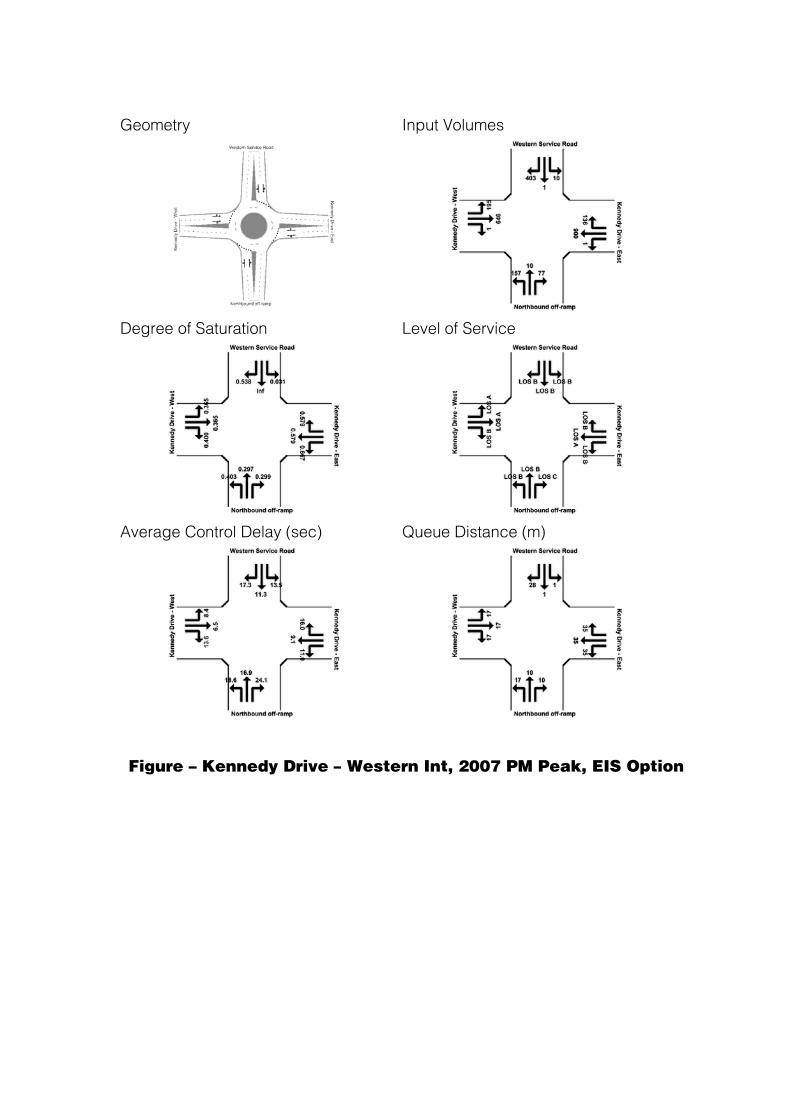
Geometry Input Volumes
Degree of Saturation Level of Service
Average Control Delay (sec) Queue Distance (m)
Figure – Kennedy Drive – Western Int, 2007 PM Peak, EIS Option

Geometry Input Volumes
Degree of Saturation Level of Service
Average Control Delay (sec) Queue Distance (m)
Figure – Kennedy Drive – Western Int, 2017 AM Peak, EIS Option

Geometry Input Volumes
Degree of Saturation Level of Service
Average Control Delay (sec) Queue Distance (m)
Figure – Kennedy Drive – Western Int, 2017 PM Peak, EIS Option

Geometry Input Volumes
Phasing (C = 80 seconds) A B C D
G = 33 seconds G + I = 39 seconds (G + I)/C = 48.8 %
G = 6 seconds G + I = 12 seconds (G + I)/C = 15.0 %
G = 10 seconds G + I = 16 seconds (G + I)/C = 20.0 %
G = 7 seconds G + I = 13 seconds (G + I)/C = 16.3 %
Degree of Saturation Level of Service
Average Control Delay (sec) Queue Distance (m)
Figure – Kennedy Drive – Western Int, 2027 AM Peak, EIS Option

Geometry Input Volumes
Phasing (C = 100 seconds) A B C D
G = 29 seconds G + I = 35 seconds (G + I)/C = 35.0 %
G = 19 seconds G + I = 25 seconds (G + I)/C = 25.0 %
G = 10 seconds G + I = 16 seconds (G + I)/C = 16.0 %
G = 18 seconds G + I = 24 seconds (G + I)/C = 24.0 %
Degree of Saturation Level of Service
Average Control Delay (sec) Queue Distance (m)
Figure – Kennedy Drive – Western Int, 2027 PM Peak, EIS Option

Tugun Bypass Environmental Impact Statement Technical Paper Number 3
Traffic and Transport
Queensland Department of Main Roads
Appendix E
Level of Service Analysis

Tugun Bypass Environmental Impact Statement Technical Paper Number 3
Traffic and Transport
Queensland Department of Main Roads E-1
Appendix E Level of Service Analysis E1 Methodology
Level of Service Definition
Standard 'Level of Service' (LOS) describe operating conditions in a traffic stream. The conditions include speed and travel time, freedom to manoeuvre, traffic interruptions, comfort and convenience and safety. The level of service provided varies depending on the type of road for the same traffic volumes. There are six levels of service, A to F, with A representing the best operating conditions (free flow) and F the worst operating conditions (forced or break-down flow). LOS D represents reasonable flow, approaching unstable flow, while LOS E represents traffic volumes approaching the road capacity with unstable flow (variable speeds) on occasions.
Traffic Volumes
The morning and evening peak hour volumes for the level of service analysis of the proposed Tugun Bypass and associated ramps are included in this appendix. Year 2007 and year 2017 link volumes have been extracted from the appropriate EMME/2 models prepared for this study. The year 2027 volumes are extrapolations of the year 2007 and 2017 volumes as explained in Section 7.1.
Tugun Bypass
Level of service calculations for the proposed Tugun Bypass are based on Section 5.2 of Guide to Traffic Engineering Practice, Part 2 – Roadway Capacity (AUSTROADS 1991). The Service Flow Rate (SF) is the maximum capacity in one direction for the prevailing roadway and traffic conditions. This is calculated by using the following equation: SFi = Cj*(v/c)i*N*fW*hHV*fP. Each of these factors are explained in this appendix. From this equation, the service flow rate = 1,946 vehicles per lane/per hour. The volume/capacity ratio is calculated using the service flow rate. The level of service for a road segment is calculated using the volume/capacity ratio for that segment of road.
The level of service was calculated for five segments along the proposed bypass, for both the northbound and southbound directions.
Ramps
The level of service calculations for the ramps associated with the proposed Tugun Bypass are based on Chapter 5 of the Highway Capacity Manual (Transport Research Board 1985). The basic approach to the modelling of merge and diverge areas focuses on an area of influence which includes the acceleration or deceleration lane and lanes 1 and 2 of the freeway.
The approach has three steps:
The flow entering lanes 1 and 2 immediately upstream of the merge influence area or the beginning of the deceleration lane at an off ramp is determined. This flow is designated V12.
Critical capacity values are determined and demand flows are compared with these values. Capacity is evaluated at two points: (a) the maximum total flow

Tugun Bypass Environmental Impact Statement Technical Paper Number 3 Traffic and Transport
E-2
departing the merge or diverge area (VFO for on ramps; VFO + VR for off ramps); and (b) the maximum total flow that can reasonably enter the merge/diverge influence area (VR12 for on ramps; V12 for off ramps). If demand exceeds either of these two capacity values, breakdown in the traffic flow is likely.
The density within the merge/diverge influence area (DR) is calculated and the level of service is based on this value.
All aspects of the calculations and level of service criteria are expressed in equivalent maximum flow rates in passenger cars per hour (pcph). The peak hour factor (PHF) used was 1.0. The percentage of commercial vehicles is nine percent in the morning peak period and eight percent in the evening peak period.
The level of service of the on and off ramps, for the southbound and northbound carriageways, for all three interchanges were calculated for year 2017 and 2027. These calculations were based on Figure 5.5 of the Highway Capacity Manual, which is a worksheet for the analysis of freeway ramp terminals (i.e. freeway on ramps and off ramps).
E2 Tugun Bypass Analysis The level of service was calculated for five segments along the bypass, for both the northbound and southbound directions. These five segments being:
north of the proposed Stewart Road interchange northbound on ramp/southbound off ramp;
between the proposed Stewart Road interchange northbound on ramp/southbound off ramp and northbound off ramp/southbound on ramp;
between the proposed Stewart Road interchange northbound off ramp/southbound on ramp and the proposed Tweed Heads Bypass interchange northbound on ramp/ southbound off ramp;
between the proposed Tweed Heads Bypass interchange northbound on ramp/southbound off ramp and northbound off ramp/southbound on ramp; and
south of the proposed Tweed Heads Bypass northbound off ramp/southbound on ramp.
Ramp LOS

Tugun Bypass Environmental Impact Statement Technical Paper Number 3
Traffic and Transport
Queensland Department of Main Roads E-3
Levels of Service – Tugun Bypass