Embed Size (px)
Citation preview

Tuberculosis Inventory Study in Indonesia 2016-2017
TB Inventory Study Team
Glion, 1 May 2018

Background

Introduction (1)
• Indonesia among top 5 countries with the highest TB burden
• TB incidence estimated 1,020,000 cases per year (Global TB Report 2017)
• Number of TB case notified: 360,565 (National TB database, 2016)
• Low contribution of private sectors in case notification of TB (NSP 2016-2020)
• 56% of people found on TB treatment were not reported to SITT (National Prevalence Survey, 2013-2014)
• Protocol development workshop for TB inventory studies (September 2014): China, Indonesia, Pakistan, Philippines, Viet Nam

Introduction (2)
• TB surveillance system (manual and electronic) in tiers: health center, district, province and national
• Web and case based TB information system (SITT) started in 2014, mainly covers all public health centers and some government hospitals
• Web and case based DR TB information system (eTB Manager) started in 2009 in 93 PMDT sites Nationally
• Health Minister decree No. 67/2016: mandatory for all health facilities to notify TB cases (excluding laboratories)

Objectives

Objectives
• Main objective• To estimate the level of under-reported TB cases in the National Surveillance
System (SITT and eTB Manager)
• Specific objectives• To quantify the level of under-reporting of TB cases put on treatment to the
national surveillance systems, PHC and Non PHC, public and private
• To understand the relative contribution of types of health facilities to TB treatment and TB under-reporting
• To assess the difference in under-reporting by age, sex, geographical area and type of health facilities

Methods

Overview of Study Design and Analysis
• Sampling design: Stratified cluster sampling design
• Stratification: (1) Sumatera, (2) Java-Bali, and (3) Other
• Sample size of district = 23 (6 in Sumatra, 12 in Java-Bali, and 5 in other provinces)
• Probability proportional to population sampling of districts (clusters) followed by prospective collection of data for cases diagnosed by ALL health-care providers within selected districts for 3 months (1 Jan-31 Mar 2017)
• Record-linkage between the Inventory Study and NTP case based databases to estimate under-reporting

Sampled districts
Sumatera
Java & Bali Others
Selected districts is 23 out of 514 districtsCovered about 10% of total population (260 millions)

Key study timelines
Protocol development(Sep 14 – Oct 15)Funding secured
(Oct 15)
Established Steering committee(June 16)
Study plan dissemination (central and district level) and
Field team recruitment(June – Oct 16)
Pilot study:Sukabumi and East Jakarta
(August 16)
Field team training(Nov 16)
Mapping of health facility at sampled districts(Nov 16 – Jan 17)
Data collection(Jan – April 17)Data validation
(July 17 – Jan 18)
Data processing and data analysis
(Jan – Mar 18)
National dissemination of study results
(April 18)

Data processing

Data processing steps
Data entry
Data cleaning
Data standardization
Deduplication
Matching
Data analysis
• The process was done using Stata, except incidence estimation was done using R statistics
• Deduplication and matching were done using probabilistic record linkage and manual review

Deduplication of IVS data
IVS
Private:6,701
Laboratory: 1,035
Public:15,191
Private:6,557
Laboratory: 1,010
Public:14,562
Original
Unique

Deduplication of NTP data
NTP
E-TB:
1,253
Q1:
10,996
Q1 (neighbour):
30,266
SITT:
50,970
Q2:
9,708
Q1*:
605
Q2*:
648
Q1:
10,844
Q1 (neighbour):
29,733
Q2:
9,536
Q1*: 595
Q1: 78
Q2*: 635
Q2: 86
* Total Indonesia
Original
Unique
Mapping of health facilities
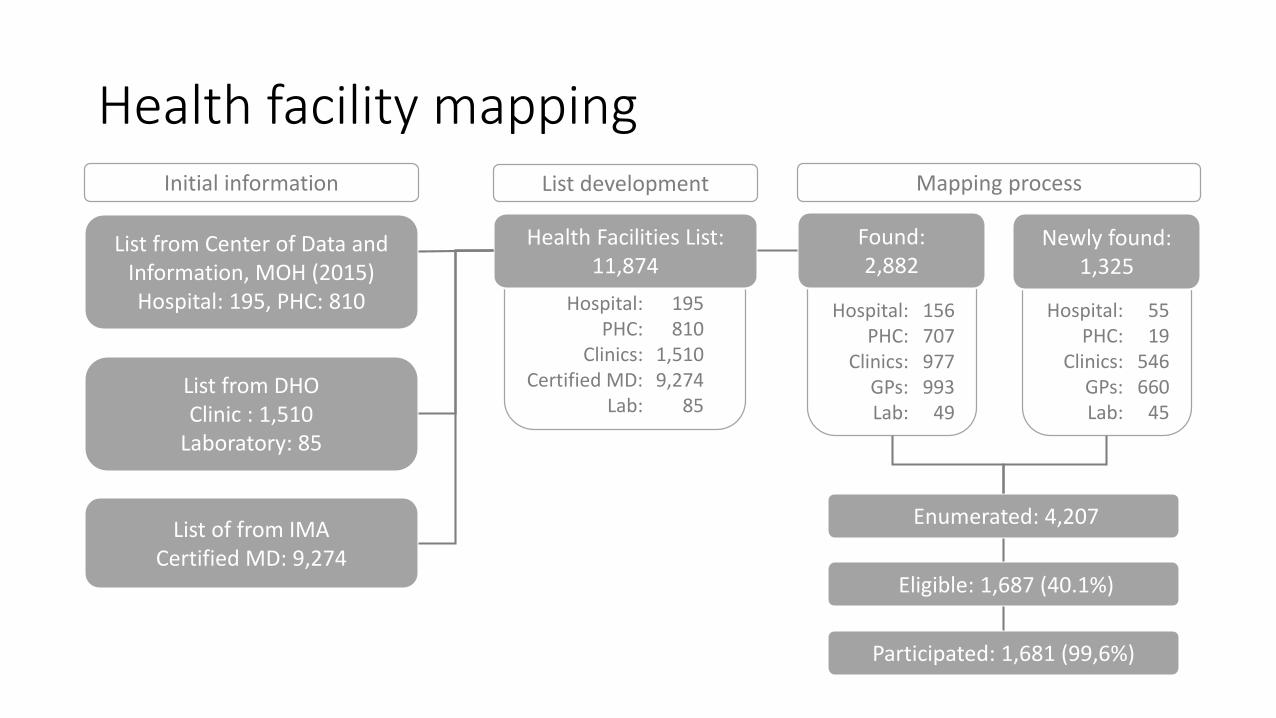
Hospital: 156PHC: 707
Clinics: 977GPs: 993Lab: 49
Hospital: 55PHC: 19
Clinics: 546GPs: 660Lab: 45
Hospital: 195PHC: 810
Clinics: 1,510Certified MD: 9,274
Lab: 85
Health facility mapping
List from Center of Data and Information, MOH (2015)Hospital: 195, PHC: 810
List from DHO Clinic : 1,510
Laboratory: 85
Health Facilities List:11,874
Found:2,882
Participated: 1,681 (99,6%)
List of from IMACertified MD: 9,274
Newly found:1,325
Enumerated: 4,207
Eligible: 1,687 (40.1%)
Initial information Mapping processList development

Enumerated, eligible1, and participated2 health facilities by type
1 At least one TB patient diagnosed or treated during the last three months2 Informed consent provided

Results of analyses from IVS casesTargeted study period Q1 2017

Distribution of IVS cases by health facility
Source n
Total unique IVS cases 21,320
Non-Lab Public1 14,562
Non-Lab Private2 6,557
Laboratory3 1,010
1 Puskesmas (PHC), hospitals, clinics2 Hospitals, clinics, GPs3 Public and private

Distribution of IVS cases by age group
Total

Distribution of IVS cases by gender
Total

Distribution of IVS cases by region
Total

Distribution of cases by case type in each age group

Distribution of cases by case type in each region

Adherence to national guidelines of TB treatment by region and total

Adherence to national guidelines of TB treatment by DOTS/ Non DOTS

IVS and NTP databases matching results

Selected districts and their neighbouring* for matching buffer
*Excluding neighbouring district with no geographical access to study districts (e.g. mountain separating 2 district)

Matching results of 4 data sources
Source n
NTP (Unique) 13,211
IVS (Unique) 21,320
IVS: Non-Lab Public1 14,562
IVS: Non-Lab Private2 6,557
IVS: Laboratory3 1,010
NTP-IVS (Unique) 22,6811 Puskesmas (PHC), hospitals, clinics2 Hospitals, clinics, GPs3 Public and private
NTP
IVS-Non LabPublic
IVS-Non LabPrivate
4,345
4,202
1,361
467
9,5751,564
IVS-Lab
714
2
16
27
116
3
177
Not shown in the Venn Diagram:NTP & Lab (not in Public and Private) = 129NTP & Private & Lab (not in Public) = 3

Under-reporting(Weighted, stratified, clustered accounted for)

Total and by facility type
Best estimate (95% CI)
Total 41% (36% - 46%)
Facility type
Puskesmas 15% (11% - 20%)
Non-puskesmas 71% (61% - 79%)
Hospital 62% (52% - 72%)
Other (Clinics, GPs, Lab) 96% (92% - 98%)

By case type and by site of disease
Best estimate (95% CI)
Case type
Bacteriologically confirmed 21% (16% - 26%)
Clinically diagnosed 55% (49% - 61%)
Site of disease
Pulmonary 38% (33% - 44%)
Extra-pulmonary 58% (49% - 66%)

By age group and by sex
Best estimate (95% CI)
Age group
<15 54% (44% - 64%)
>=15 39% (34% - 44%)
Sex
Male 41% (36% - 47%)
Female 41% (36% - 46%)

By geographical area
Best estimate (95% CI)
Geographical area
Sumatera 40% (24% - 59%)
Bali/Java 42% (18% - 47%)
Other 39% (28% - 51%)

Risk factors for TB under-reporting(Logistic regression, weighted, stratified & clustered accounted for)
Risk factors Crude OR (95% CI) Adjusted OR (95% CI)
Clinic. vs bact. (ref) 4.8 (3.4 - 6.8) 4.5 (3.1 - 6.5)
Extra pulm. vs Pulm. (ref) 2.2 (1.5 - 3.3) 1.4 (0.9 - 2.2)
Child vs adult (ref) 1.8 (1.3 - 2.6) 1.0 (0.7 - 1.5)
Male vs female (ref) 1.0 (0.9 - 1.1) 1.1 (1.0 - 1.2)

Capture-recapture*(To estimate undetected TB cases and extrapolate to total TB incidence)
*Additional analysis not originally part of protocol

Estimate of undetected cases
Source n
NTP (Unique) 13,211
IVS (Unique) 21,320
IVS: Public1 14,747
IVS: Private2 7,323
NTP-IVS (Unique) 22,6811 Puskesmas (PHC), hospitals, clinics, labs2 Hospitals, clinics, GPs, labs
NTP
4,902
4,371
1,361
555
9,626
197
1,669
Undetectedcases?

Capture-recapture using Poisson Model
Model Variables
Model 1ntp + public + private + ntp*public + ntp*private + public*private + ntp*public*private
Model 2 ntp + public + private + public*private
Model 3 ntp + public + private + ntp*public
Model 4 ntp + public + private + ntp*private
Model 5 ntp + public + private

Estimates and Akaike Information Criterion (AIC) for optimal model selection
Model b0* SE(b0) 95% CI AIC
Model 1 5,113.7 478.3 4,257.2 - 6,142.6 79.2
Model 2 1,087.7 33.1 1,024.7 - 1,154.4 3,670.6
Model 3 31,096.6 812.2 29,544.8 - 32,729.9 4,124.0
Model 4 3,340.8 71.0 3,204.6 - 3,482.8 12,732.3
Model 5 4,927.1 88.0 4,757.5 - 5,102.7 14,211.3
*Estimate of total undetected cases in 23 selected districts

Capture-recapture to estimate the number of undetected cases
NTP
4,902
4,371
1,361
555
9,626
197
1,669
5,114(18.4%)
Estimate the number of undetected cases
5,114 (95% CI: 4,257-6,143)
Proportion of undetected cases
= 5,114/(5,114+22,681)= 18.4%

National estimate of TB incidence
• 𝑛 is number of notified cases in 2017
• 𝑢 is proportion of under reporting, 𝑢 = 0.4128 (uncertainty, se = 0.0241)
• 𝑑 is proportion of undetected cases, 𝑑 = 0.1837, (uncertainty, se = 0.0279)
መ𝐼 =𝑛/(1 − 𝑢)
1 − 𝑑

Summary of key results
• 1.681 health facilities from 23 districts participated in the study
• 21.320 TB cases were found in Q1 2017 from the study• 68% of cases in public facilities ( 56% PHC, 42% hospitals, 2% clinics)• 28% of cases in private facilities ( 59% hospitals, 22% clinics, 19%GPs)• 4% labs (22% public, 78% private)
• Overall under-reporting 41% (15% PHC, 62% hospital, 96% lab/GPs/clinics)• Clinically diagnosed, extra pulmonary and children are more likely to be under-
reported
• Nationally more than 84% of TB cases are prescribed with treatment that adheres to national guidelines (regional differences exist)
• Half of incident TB cases are detected and reported to NTP and from the remaining “missing” cases 2/3 are detected but not reported and 1/3 not detected

Key lessons learned
• Exhaustive mapping of all health facilities that diagnose and treat TB must be kept up to date in every district• What is the best mechanism to ensure this?
• Participation of eligible health facilities was extremely high 99.6%• Successful model of engagement with different type of health facilities could
be rolled out to the rest of the country
• Record linkage exercises to be routinely implemented• Deduplication of NTP databases
• Matching with other sources of TB cases (SIRS, SIHA, BPJS, SRS)

Limitations
• Data collection could not be conducted in 6 health facilities from 2 districts due to difficult geographical access
• 1.361 TB cases that appear in SITT/eTB manager were not captured by IVS enumerators
• 3 labs from 3 districts refused to participate
• Probabilistic record linkage is not fail-proof (sensitivity analyses were conducted to investigate potential bias of results – not found to be the case)
• We did not include pharmacies in the sampling frame of the study

Acknowledgements
• NIHRD
• NTP
• TB Expert Committee
• District field teams
• Provincial and district health offices
• Medical associations (national and district)
• Hospital associations (national and district)
• Pusdatin
• WHO
• Technical partners
• Funding partners (Global Fund, TB Alliance)

Sensitivity analyses

Sensitivity analysis for NTP cases not found in IVS databases
NTP
IVS
11,850 + 1,361= 13,211
9,470 - 1,361= 8,109
Crude under-reporting
41.7%
9,4701,361 11,850
Assuming no unmatched NTP records, crude under-reporting
38.0%

Sensitivity analysis for laboratory data
Match Unique Total
Bact. (+) 165 53 218
Bact. (-) 131 661 792
Total 296 714 1,010
Assumption Est. SE 95% CI
Assuming 131+661 are false-negative (FN) 41% 2% 36% - 46%
Assuming 131 are FN and 661 are truly-negative (TN) 39% 3% 33% - 44%
Assuming 131+661 are TN 39% 3% 33% - 44%