Embed Size (px)
Citation preview

TUBA PLAST Survey Report
Conducted By: Green Line Company

Power Factor Readings:
Off Load: 66%
Load Percentage:
Predicting the Energy savingsBefore Installing Powerboss
Off Load: 5.055 / 15.938 (100) = 31.71
Formula: Ave kW / Ave Kvar (100) = Saving Factor
Power Readings:
INJECTION MOULDING (47kW Motor)INJECTION MOULDING (47kW Motor)
On Load: 34%
On Load: 33.597 / 22.361 (100) = 150.24
Full Load
Full §Load
Off Load
Off Load
Off Load

Formula: Saving Factor Vs. kW Saving % X Load Percentage = Saving %
Total Kw Saving % = 17.68%
Off Load: 31.71 --------- 26.8% X 66% = 17.68%
Formula: Saving Factor Vs. kvar Saving % X Load Percentage = Saving %
Formula: Saving Factor Vs. kva Saving % X Load Percentage = Saving %
On Load: 150.24 --------- 0% X 34% = 0%
Total Kvar Saving % = 30.34%
Total Kva Saving % = 34.96%
Off Load: 31.71 --------- 46% X 66% = 30.34%
On Load: 150.24 --------- 0% X 34% = 0%
Off Load: 31.71 --------- 53% X 66% = 34.96%
On Load: 150.24 --------- 0% X 34% = 0%
Power Savings

Consumption & Savings
1.028kWh per 5mins.12.336kWh per Hour296.064kWh per Day1776.384kWh per Week
Power Consumption kW: Power Saving kW: 17.68%15703.2kWh per Year
1.413Kvarh per 5mins.16.956Kvarh per Hour406.944Kvarh per Day2441.664Kvarh per Week
Power Consumption Kvar:88819.2kWh per Year
Note: Operation is 24 hours a day, 6 days a week and 50 weeks a year.
122083.2Kvarh per Year
Power Saving Kvar: 30.34 %37040Kvarh per Year

Power Factor Readings:
Off Load: 38%
Load Percentage:
Predicting the Energy savingsBefore Installing Powerboss
Off Load: 7.102 / 30.274 (100) = 23.45
Formula: Ave kW / Ave Kvar (100) = Saving Factor
Power Readings:
INJECTION MOULDING (100Hp Motor)INJECTION MOULDING (100Hp Motor)
Mid Load: 55.5%
Mid Load: 17.529 / 31.565 (100) = 55.53
Off Load
Full Load
Off Load
Full Load
Mid Load
Full Load: 28.234 / 31.381 (100) = 89.97
Full Load: 6.5%

Formula: Saving Factor Vs. kW Saving % X Load Percentage = Saving %
Total Kw Saving % = 16.94%
Power Savings
Off Load: 23.45 --------- 31.5% X 38% = 11.94%
Formula: Saving Factor Vs. kvar Saving % X Load Percentage = Saving %
Formula: Saving Factor Vs. kva Saving % X Load Percentage = Saving %
Mid Load: 55.53 --------- 9% X 55.5% = 4.99%
Total Kvar Saving % = 35.2%
Total Kva Saving % = 39.206%
On Load: 89.97 --------- 0% X 6.5% = 0%
Off Load: 23.45 --------- 51% X 38% = 19.33%
Mid Load: 55.53 --------- 28.6% X 55.5% = 15.87%
On Load: 89.97 --------- 0% X 6.5% = 0%
Off Load: 23.45 --------- 59.5% X 38% = 22.55%
Mid Load: 55.53 --------- 30% X 55.5% = 16.64%
On Load: 89.97 --------- 0% X 6.5% = 0%

Consumption & Savings
1.202kWh per 5mins.14.424kWh per Hour346.176kWh per Day2077.056kWh per Week
Power Consumption kW: Power Saving kW: 16.94%17592.66kWh per Year
2.503Kvarh per 5mins.30.996Kvarh per Hour743.904Kvarh per Day4463.424Kvarh per Week
Power Consumption Kvar:103852.8kWh per Year
Note: Operation is 24 hours a day, 6 days a week and 50 weeks a year.
223171.2Kvarh per Year
Power Saving kW: 35.2 %78556.26Kvarh per Year

Power Factor Readings:
Off Load: 39%Load Percentage:
Predicting the Energy savingsBefore Installing Powerboss
Off Load: 17.986 / 79.579 (100) = 23.79
Formula: Ave kW / Ave Kvar (100) = Saving Factor
Power Readings:
MIXER (185kW Motor)MIXER (185kW Motor)
On Load: 61%
On Load: 152.809 / 106.311 (100) = 13.737
Off LoadFull Load
Off Load
Full Load

Power Savings
Saving Factor Vs Saving graph (Laoding %) =Total SavingOFFLOAD 23.79761574 Is equal to 31 0.393194707 12.18903592LOW LOAD #DIV/0! Is equal to 0 0 0MID LOAD #DIV/0! Is equal to 0 0 0HIGH LOAD #DIV/0! Is equal to 0 0 0FULL LOAD 143.7377129 Is equal to 0 0.606805293 0
12.189
OFFLOAD 23.79761574 Is equal to 51 0.393194707 20.05293006LOW LOAD #DIV/0! Is equal to 0 0 0MID LOAD #DIV/0! Is equal to 0 0 0HIGH LOAD #DIV/0! Is equal to 0 0 0FULL LOAD 143.7377129 Is equal to 0 0.606805293 0
20.0529
OFFLOAD 23.79761574 Is equal to 59 0.393194707 23.19848771LOW LOAD #DIV/0! Is equal to 0 0 0MID LOAD #DIV/0! Is equal to 0 0 0HIGH LOAD #DIV/0! Is equal to 0 0 0FULL LOAD 143.7377129 Is equal to 0 0.606805293 0
23.1985
Kva Saving %
TOTAL Kva Savings
kW Saving %
TOTAL Kw Savings
TOTAL Kvar Savings
Kvar Saving %
Consumption & Savings
1.028kWh per 5mins.12.336kWh per Hour296.064kWh per Day1776.384kWh per Week
Power Consumption kW: Power Saving kW: 17.68%15703.2kWh per Year
1.413Kvarh per 5mins.16.956Kvarh per Hour406.944Kvarh per Day2441.664Kvarh per Week
Power Consumption Kvar:88819.2kWh per Year
Note: Operation is 24 hours a day, 6 days a week and 50 weeks a year.
122083.2Kvarh per Year
Power Saving Kvar: 30.34 %37040Kvarh per Year

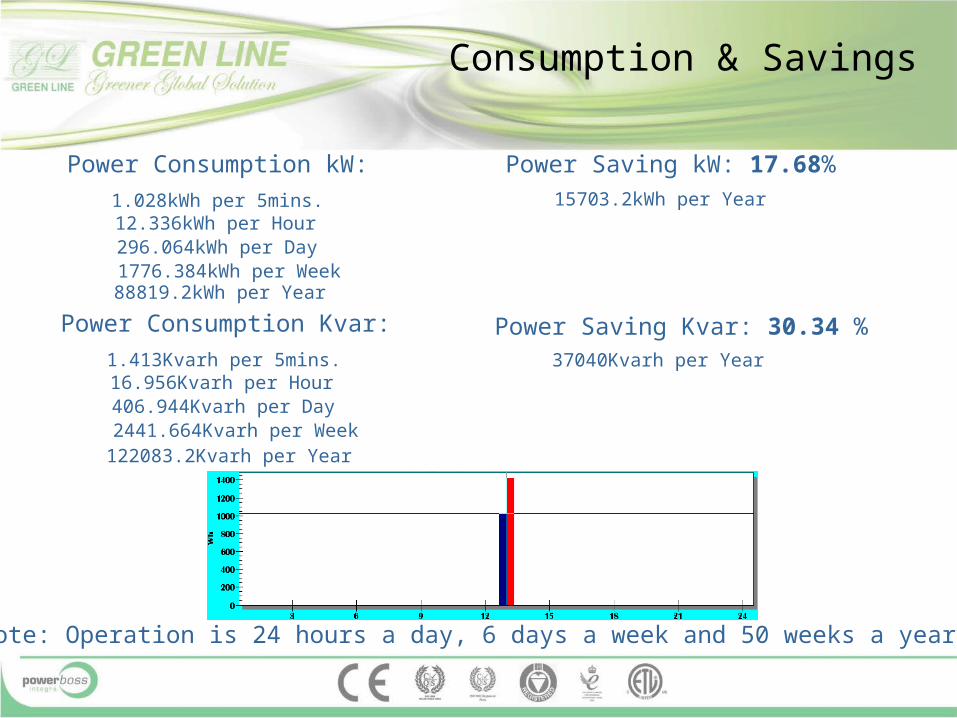
Power Factor Readings:
Load Percentage:
Predicting the Energy savingsBefore Installing Powerboss
Formula: Ave kW / Ave Kvar (100) = Saving Factor
Power Readings:
Grinder 1 (47kW Motor)Grinder 1 (47kW Motor)
On Load: 100%
On Load: 30.4025 / 19.2865 (100) = 157.63

Power Savings
Saving Factor Vs Saving graph (Laoding %) =Total SavingOFFLOAD #DIV/0! Is equal to 0 0 0LOW LOAD #DIV/0! Is equal to 0 0 0MID LOAD #DIV/0! Is equal to 0 0 0HIGH LOAD #DIV/0! Is equal to 0 0 0FULL LOAD 157.6361704 Is equal to 0 1 0
0
OFFLOAD #DIV/0! Is equal to 0 0 0LOW LOAD #DIV/0! Is equal to 0 0 0MID LOAD #DIV/0! Is equal to 0 0 0HIGH LOAD #DIV/0! Is equal to 0 0 0FULL LOAD 157.6361704 Is equal to 0 1 0
0
OFFLOAD #DIV/0! Is equal to 0 0 0LOW LOAD #DIV/0! Is equal to 0 0 0MID LOAD #DIV/0! Is equal to 0 0 0HIGH LOAD #DIV/0! Is equal to 0 0 0FULL LOAD 157.6361704 Is equal to 0 1 0
0
Kvar Saving %
Kva Saving %
TOTAL Kva Savings
kW Saving %
TOTAL Kw Savings
TOTAL Kvar Savings

2.566kWh per 5mins.30.792kWh per Hour739.008kWh per Day4434.048kWh per Week
Power Consumption kW: Power Saving kW: 0%0kWh per Year
1.614Kvarh per 5mins.19.368Kvarh per Hour464.832Kvarh per Day2788.992Kvarh per Week
Power Consumption Kvar:221702.4kWh per Year
Note: Operation is 24 hours a day, 6 days a week and 50 weeks a year.
139449.6Kvarh per Year
Power Saving Kvar: 0 %0Kvarh per Year
Consumption & Savings
Power Factor Readings:
Load Percentage:
Predicting the Energy savingsBefore Installing Powerboss
Formula: Ave kW / Ave Kvar (100) = Saving Factor
Power Readings:
Grinder 2 (50Hp Motor)Grinder 2 (50Hp Motor)
On Load: 100%
On Load: 10.378 / 21.5835 (100) = 48.06

Power Savings
Saving Factor Vs Saving graph (Laoding %) =Total SavingOFFLOAD #DIV/0! Is equal to 0 0 0LOW LOAD #DIV/0! Is equal to 0 0 0MID LOAD #DIV/0! Is equal to 0 0 0HIGH LOAD #DIV/0! Is equal to 0 0 0FULL LOAD 48.06075902 Is equal to 15 1 15
15
OFFLOAD #DIV/0! Is equal to 0 0 0LOW LOAD #DIV/0! Is equal to 0 0 0MID LOAD #DIV/0! Is equal to 0 0 0HIGH LOAD #DIV/0! Is equal to 0 0 0FULL LOAD 48.06075902 Is equal to 31 1 31
31
OFFLOAD #DIV/0! Is equal to 0 0 0LOW LOAD #DIV/0! Is equal to 0 0 0MID LOAD #DIV/0! Is equal to 0 0 0HIGH LOAD #DIV/0! Is equal to 0 0 0FULL LOAD 48.06075902 Is equal to 34 1 34
34
Kvar Saving %
Kva Saving %
TOTAL Kva Savings
kW Saving %
TOTAL Kw Savings
TOTAL Kvar Savings

Consumption & Savings
0.599kWh per 5mins.7.188kWh per Hour172.512kWh per Day1035.072kWh per Week
Power Consumption kW: Power Saving kW: 15%7763.04kWh per Year
1.425Kvarh per 5mins.17.1Kvarh per Hour410.4Kvarh per Day2462.4Kvarh per Week
Power Consumption Kvar:51753.6kWh per Year
Note: Operation is 24 hours a day, 6 days a week and 50 weeks a year.
123120Kvarh per Year
Power Saving Kvar: 31 %38167.2Kvarh per Year

Benefits fromPowerBoss
This machines can benefit greatly from Powerboss. The softstart function will reduce both starting current drawn by the motor and mechanical strain on bearings, gears, belts and etc. The reduction in starting current will also increase motor’s life.
The optimization function will reduce the power supplied to theMotor without changing its torque and rpm. Reducing the power supplied tothe motor will significantly reduce the heat, vibration and noise. Reducing wasted energy will also reduce the maintenance cost and production downtime.