Embed Size (px)
Citation preview

© 2015 Total System Services, Inc.® All rights reserved worldwide.
TSYS Analyst Day May 20, 2015

> FORWARD-LOOKING STATEMENTS
© 2015 Total System Services, Inc.® All rights reserved worldwide.
This presentation and comments made by management contain forward-looking statements including, among others, statements regarding the expected future operating results of TSYS. These statements are based on management’s current expectations and assumptions and are subject to risks, uncertainties and changes in circumstances. Forward-looking statements include all statements that are not historical facts and can be identified by the use of forward-looking terminology such as the words “believe,” “expect,” “anticipate,” “intend,” “plan,” “potential,” “estimate” or similar expressions. Actual results may differ materially from those set forth in the forward-looking statements due to a variety of factors. More information about these risks, uncertainties and factors may be found in TSYS’ filings with the Securities and Exchange Commission, including its 2014 Annual Report on Form 10-K. TSYS does not assume any obligation to update any forward-looking statements as a result of new information, future developments or otherwise.
2

> USE OF NON-GAAP FINANCIAL MEASURES
© 2015 Total System Services, Inc.® All rights reserved worldwide.
This slide presentation contains certain non-GAAP financial measures determined by methods other than in accordance with generally accepted accounting principles. Such non-GAAP financial measures include the following: revenues before reimbursable items; operating margin excluding reimbursable items; revenues measured on a constant currency basis; free cash flow; EBITDA, adjusted EBITDA, adjusted earnings per share, adjusted segment operating income and adjusted segment operating margin. The most comparable GAAP measures to these measures are revenues; operating margin; revenues; cash flows from operating activities; net income; net income; earnings per share, operating income and operating margin, respectively. Management uses these non-GAAP financial measures to assess the performance of TSYS’ core business. TSYS believes that these non-GAAP financial measures provide meaningful additional information about TSYS to assist investors in evaluating TSYS’ operating results. These non-GAAP financial measures should not be considered as a substitute for operating results determined in accordance with GAAP and may not be comparable to other similarly titled measures of other companies. The computations of the non-GAAP financial measures used in this slide presentation are set forth in the Appendix to this slide presentation.
3
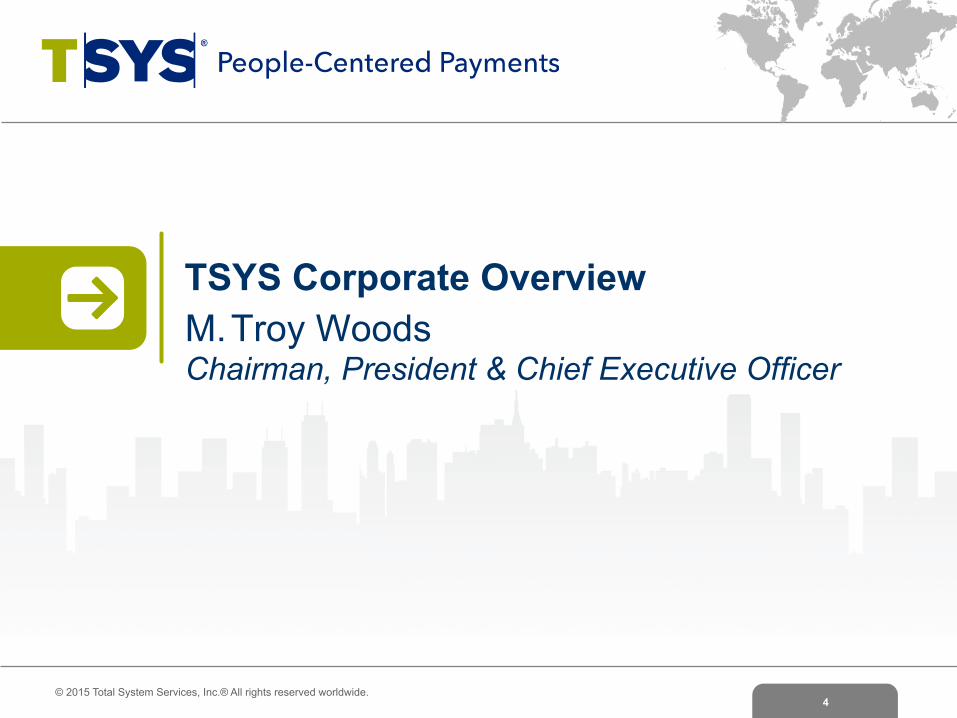
TSYS Corporate Overview M. Troy Woods Chairman, President & Chief Executive Officer
© 2015 Total System Services, Inc.® All rights reserved worldwide. 4

> AGENDA
© 2015 Total System Services, Inc.® All rights reserved worldwide. 5
! TSYS at a Glance
! Scale…. Reach…. Strength….
! Our Transformation Journey
! Strategic Priorities
! Dynamic Industry Themes
! Commitment to Win

> TSYS AT A GLANCE
© 2015 Total System Services, Inc.® All rights reserved worldwide.
$7.5 Billion Market Cap*
Financial Institutions
Governments Corporations Small Businesses
Retailers Consumers
$2.2 Billion Revenues Before Reimbursable Items
$324 Million Free Cash Flow
$712.3 Million Adjusted EBITDA
17.8 Billion Transactions Processed**
(*) as of 5/7/15 (**) Excludes NetSpend
10,000 Team Members
~
6

© 2015 Total System Services, Inc.® All rights reserved worldwide. 7
SCALE!! REACH!! STRENGTH!!
#1 North America Third-party Processor
#2 Europe Third-party Processor
#1 China Third-party Processor
#12 USA Acquirer
#2 USA Prepaid Card Program Manager
80 Countries
27 Locations
4 Million Consumers
2.3 Million Point-of-Sale Locations
375,000 Direct
Merchant Locations
>85,000 Distributing Locations and Employers
Investment Grade Credit Rating
S&P 500
FORTUNE 1000
Based on Revenue

> OUR TRANSFORMATION JOURNEY!!
© 2015 Total System Services, Inc.® All rights reserved worldwide. 8
REVENUE MIX 2014
!"#
$"#
%$#
$&#
2008
!"#
$%#!&#
2008 2014
North America
International
Merchant
NetSpend®

> STRATEGIC PRIORITIES
© 2015 Total System Services, Inc.® All rights reserved worldwide. 9
#1 Global Provider of Credit Card Issuer Solutions
Top-10 Global Merchant Solutions Provider
#1 Provider of Self Banking Services
PEOPLE-CENTERED PAYMENTS
Improving lives and businesses by putting people at the center of payments

! Digitization of Financial Services
! Growing Omni-channel
! Payments Landscape
! Increased Regulation
> DYNAMIC INDUSTRY THEMES
© 2015 Total System Services, Inc.® All rights reserved worldwide. 10

> COMMITMENT TO WIN
© 2015 Total System Services, Inc.® All rights reserved worldwide. 11
! Customers: Customer Experience Initiative
! Team Members: People Investment
! Shareholders: Capital Allocation

North America Services William A. Pruett Senior Executive Vice President & President, North America Services
© 2015 Total System Services, Inc.® All rights reserved worldwide. 12

> NORTH AMERICA SOLUTIONS FOR FINANCIAL INSTITUTIONS
© 2015 Total System Services, Inc.® All rights reserved worldwide.
#1 Provider of Processing & Related Solutions to North American Consumer
& Commercial Credit Card Issuers
>! Credit, debit and healthcare payment processing
SERVICES
KEY METRICS
>! Data analytics and business intelligence
>! Call center services >! Value-added offerings
>! Card and print services >! Loyalty solutions
TARGET CUSTOMERS
>! Largest Financial Institution Issuers
>! Regional Banks & Credit Unions
>! Healthcare Third-party Administrators
>! Emerging Payment Players
~120 Unique Customers
653.2 Million Accounts on File
3.3 Billion Transactions
13

> 1Q 2015 NORTH AMERICA SEGMENT HIGHLIGHTS
© 2015 Total System Services, Inc.® All rights reserved worldwide.
➔ Bank of America® conversion completed ➔ All-time quarterly highs - Revenue and operating income - Accounts on file up 31.8% to 653.2M - Transactions increased 42.2% to 3.3B
495.5 510.3 541.4 550.0
653.2
1Q14 2Q14 3Q14 4Q14 1Q15
Accounts on File* YOY Growth %
(in millions)
17.2% 17.1%
18.5% 19.1%
17.4% 18.1%
14.1% 16.6%
31.8% 49.4% *
$74.6 $84.6
$92.7 $99.6 $102.6
33.2% 36.3% 38.5% 39.0% 38.5%
1Q14 2Q14 3Q14 4Q14 1Q15
($ in millions)
(*) Revenues Before Reimbursable Items
$224.4
$233.2 $241.0
$255.5
$266.2
1Q14 2Q14 3Q14 4Q14 1Q15
Segment Revenue* YOY Growth %
($ in millions)
Adjusted Segment Operating Income Operating Margin*
9.1% 8.7% 10.9% 14.5% 18.7%
(*) Growth Excluding Prepaid, Government Services and Single-use Accounts
14

> NORTH AMERICA STRATEGY
© 2015 Total System Services, Inc.® All rights reserved worldwide.
EXECUTE ON THE FUNDAMENTALS
GROWTH OPPORTUNITIES
>! Growth with growing clients >! New client growth with small, medium and large issuers >! Cross-sell of additional products >! Growing healthcare, B2B payments and analytics opportunities
>! Exceptional conversion history >! Stable economic and regulatory environment >! Customer service standard >! Innovation and delivery of new solutions
Grow & Perfect Our Market-leading Position
Innovate, Diversify & Deliver New Products & Solutions
15

International Services Gaylon Jowers Jr. Senior Executive Vice President & President, International Services
© 2015 Total System Services, Inc.® All rights reserved worldwide. 16

> INTERNATIONAL SOLUTIONS FOR FINANCIAL INSTITUTIONS
© 2015 Total System Services, Inc.® All rights reserved worldwide.
Completing Multi-year Margin Improvement Plan
>! Credit and debit payment processing
SERVICES
KEY METRICS
>! Software licensing >! Call center services
TARGET CUSTOMERS
>! European & Brazilian Financial Institutions
>! Issuer/Acquirer Software Licensing
>! Alternative Credit Account Issuers
>! CUP Data Partnership
130+ Unique Customers
70.5 Million Accounts on File
572.0 Million Transactions
17
>! Value-added offerings

> 1Q 2015 INTERNATIONAL SEGMENT HIGHLIGHTS
© 2015 Total System Services, Inc.® All rights reserved worldwide.
➔ Virgin Money migration completed ➔ Revenue up across all lines of business ➔ Accounts on file increased 16.1% to 70.5M ➔ Transactions increased 10.5% to 572.0M ➔ Margin improvement plan on track
84%
60.7 62.3 64.1 66.6
70.5
1Q14 2Q14 3Q14 4Q14 1Q15
Accounts on File YOY Growth % (in millions)
8.9% 7.5% 8.1% 12.7% 16.1%
Adjusted Segment Operating Income Operating Margin*
$76.8 $84.7 $87.4
$92.9
$73.7
1Q14 2Q14 3Q14 4Q14 1Q15
Segment Revenue* YOY Growth %
$4.6
$11.7
$16.0
$22.8
$7.0
5.9% 13.9%
18.3% 24.6%
9.5%
1Q14 2Q14 3Q14 4Q14 1Q15
($ in millions)
Reported
Constant Currency
(*) Revenues Before Reimbursable Items
($ in millions)
0.5%
(4.6%)
10.6%
1.8%
12.2%
4.4%
2.5%
5.7%
(4.0%)
5.1%
18

> INTERNATIONAL STRATEGY
© 2015 Total System Services, Inc.® All rights reserved worldwide.
EXECUTE ON THE FUNDAMENTALS
GROWTH OPPORTUNITIES
>! Extend and perfect capabilities in adjacent payment markets >! Build and deliver new solutions to our global client base >! Continue to seek high quality acquisition targets >! Deliver Surround to streamline and simplify our operating environment
>! “Accelerate Growth” in targeted markets >! Extend product penetration with existing clients and prospects >! Ongoing secure, consistent, and high-touch differentiated service delivery
Grow & Perfect Our Market-leading Position
Innovate & Deliver New Products & Solutions
19

> TSYS GLOBAL PRODUCT GROUP AREAS OF STRATEGIC FOCUS
© 2015 Total System Services, Inc.® All rights reserved worldwide. 20
DATA ANALYTICS
Chip/EMV®
Enterprise Tokenization
Digital Engagement
Data Analytics DATA ANALYTICS
EMV is a registered trademark or trademark of EMVCo LLC in the United States and other countries.

Merchant Services Mark D. Pyke Senior Executive Vice President & President, Merchant Services
Tom Boyer President, TSYS Merchant Solutions
© 2015 Total System Services, Inc.® All rights reserved worldwide. 21

> MERCHANT SOLUTIONS FOR BUSINESSES
© 2015 Total System Services, Inc.® All rights reserved worldwide. 22
INDIRECT KEY METRICS
>! Tier 2 & 3 Large Merchants >! Small– & Mid-sized Businesses >! Micro-merchants
>! Top-250 Bank & Non-bank Acquirers
DIRECT KEY METRICS
DIRECT TARGET CUSTOMERS
INDIRECT TARGET CUSTOMERS
Direct Acquiring & Related Offerings for Merchants Indirect Third-party Processing for Acquirers
~200 Processing Clients
2% Share Based on Revenue
375K Merchant Outlets
$45B Annual Visa®/MasterCard® Volume
#12 in U.S. Based on Revenue
24 of Top-25 Acquirers are Clients
~40% Share Based on Revenue ~4B POS Transactions
Annual /MasterCard®
61% DIRECT 39% INDIRECT

> 1Q 2015 MERCHANT SEGMENT HIGHLIGHTS
© 2015 Total System Services, Inc.® All rights reserved worldwide. 23
$104.6 $108.3 $115.0
$107.7 $110.4
1Q14 2Q14 3Q14 4Q14 1Q15
Segment Revenue* YOY Growth %
(*) Revenues Before Reimbursable Items
($ in millions)
$30.2 $32.9 $40.4
$31.4 $34.1
28.8% 30.4% 35.1%
29.2% 30.9%
1Q14 2Q14 3Q14 4Q14 1Q15
Adjusted Segment Operating Income Operating Margin*
($ in millions)
(4.3%) (4.1%) 1.2% (2.4%) 5.5%
9.9% $45 $46 $50 $44 $43
$59 $62 $65 $64 $67
1Q14 2Q14 3Q14 4Q14 1Q15 Indirect Direct
Segment Revenue by LOB YOY Growth %
($ in millions)
4%
(14%)
1%
(10%)
4%
(2%) (9%)
3%
(4%)
13%
➔ Revenue up 5.5% and operating margin up 207 bps YOY
➔ Direct revenue mix at 61%; 39% Indirect ➔ SBS sales volume at $5.8B, up 9.9% YOY ➔ POS transactions increased 5.6%, excluding
deconverted accounts

> MERCHANT SEGMENT STRATEGY
© 2015 Total System Services, Inc.® All rights reserved worldwide.
EXECUTE ON THE FUNDAMENTALS
GROWTH OPPORTUNITIES
>!Partner with Independent Software Vendors (ISVs) >!Deploy mobile/tablet, cloud-based POS and software solutions >!Pursue M&A to add scale, expand distribution and product capabilities
>! Improve sales productivity and capacity >!Develop new distribution channels (e.g. ISV) >!Offer new and innovative products and solutions
Expand Distribution & Product Capabilities
Play More in Higher Growth Areas of the Acquiring Industry
24

NetSpend Charles J. Harris Senior Executive Vice President, TSYS, & President, NetSpend
© 2015 Total System Services, Inc.® All rights reserved worldwide. 25
®

> NETSPEND SOLUTIONS
© 2015 Total System Services, Inc.® All rights reserved worldwide. 26
Alternative-banking Services for the Self-banked Customer
SERVICES
KEY METRICS
>! Protected by Regulation E and FDIC-insured
TARGET CUSTOMERS & DISTRIBUTION PARTNERS
>! Unbanked & Underserved Consumers
4.2 Million Debit Active Cards; 2.4 Million Direct Deposit Active Cards
130,000+ Reload Locations
85,000+ Distributing Locations & Employers
>! Reloadable deposits may be made at non-bank locations
>! Distribution Through Retailers, Banks, Partners, Employers & Direct-to-consumer
>! Open-loop GPR and Paycard (Visa/ MasterCard branded)
>! Usable at ATMs and anywhere Visa/ MasterCard are accepted

© 2015 Total System Services, Inc.® All rights reserved worldwide.
➔ Completed launch of Brink’s Prepaid MasterCard ➔ All-time quarterly revenue high ➔ Gross Dollar Volume (GDV) of $7.7B, up 16.7% ➔ Total Active Cards of 4.2M, up 14.7% ➔ Direct Deposit Active Cards at 2.4M, up 16.1%
$6.6
$4.6 $4.4 $4.7
$7.7
1Q14 2Q14 3Q14 4Q14 1Q15
22.1% 17.2% 16.6% 18.2% 16.7%
($ in billions) Gross Dollar Volume
YOY Growth %
$132.6
$116.8 $114.0 $119.2
$155.1
13.1% 11.4% 10.0% 14.4% 16.9%
1Q14 2Q14 3Q14 4Q14 1Q15
Adjusted Segment Operating Income* Operating Margin*
Segment Revenue*
YOY Growth % ($ in millions) ($ in millions)
$28.7 $30.7 $36.1
$32.7 $35.5
21.7% 26.3% 31.7% 27.5% 22.9%
1Q14 2Q14 3Q14 4Q14 1Q15
> 1Q 2015 NETSPEND SEGMENT HIGHLIGHTS
27
®
(*) Revenues Before Reimbursable Items
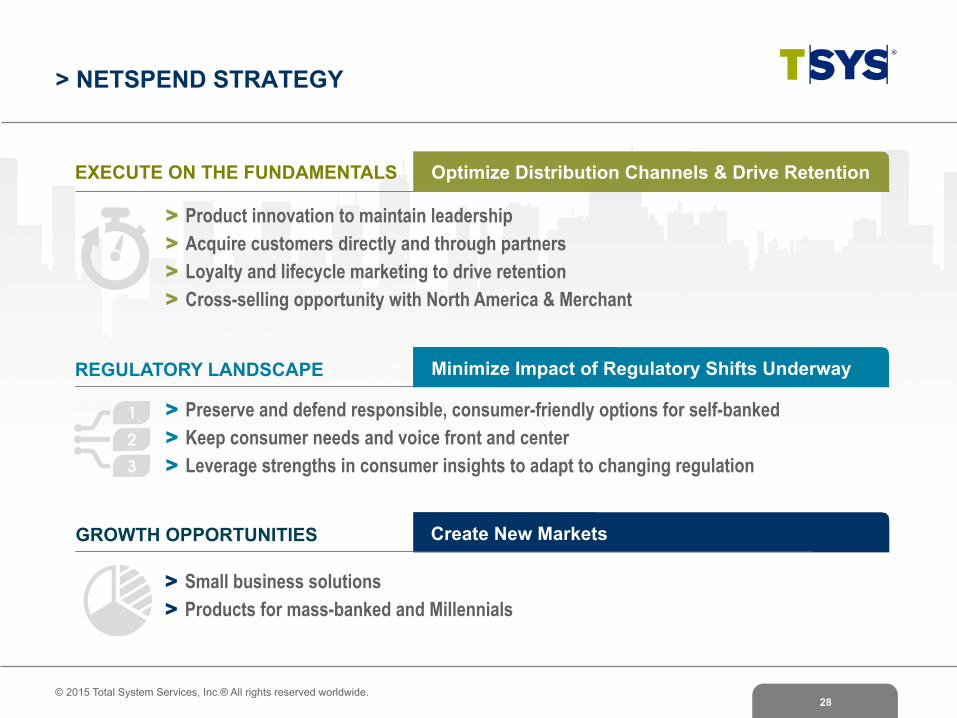
> NETSPEND STRATEGY
© 2015 Total System Services, Inc.® All rights reserved worldwide.
EXECUTE ON THE FUNDAMENTALS
REGULATORY LANDSCAPE
>! Preserve and defend responsible, consumer-friendly options for self-banked >! Keep consumer needs and voice front and center >! Leverage strengths in consumer insights to adapt to changing regulation
>! Product innovation to maintain leadership >! Acquire customers directly and through partners >! Loyalty and lifecycle marketing to drive retention >! Cross-selling opportunity with North America & Merchant
Optimize Distribution Channels & Drive Retention
Minimize Impact of Regulatory Shifts Underway
GROWTH OPPORTUNITIES Create New Markets
>! Small business solutions >! Products for mass-banked and Millennials
28

2015 Financial Summary Paul M. Todd Senior Executive Vice President & Chief Financial Officer
© 2015 Total System Services, Inc.® All rights reserved worldwide. 29
$113.9
$134.2
$159.8 $154.7 $154.5
21.4%
24.9% 28.9% 27.2% 25.9%
1Q14 2Q14 3Q14 4Q14 1Q15
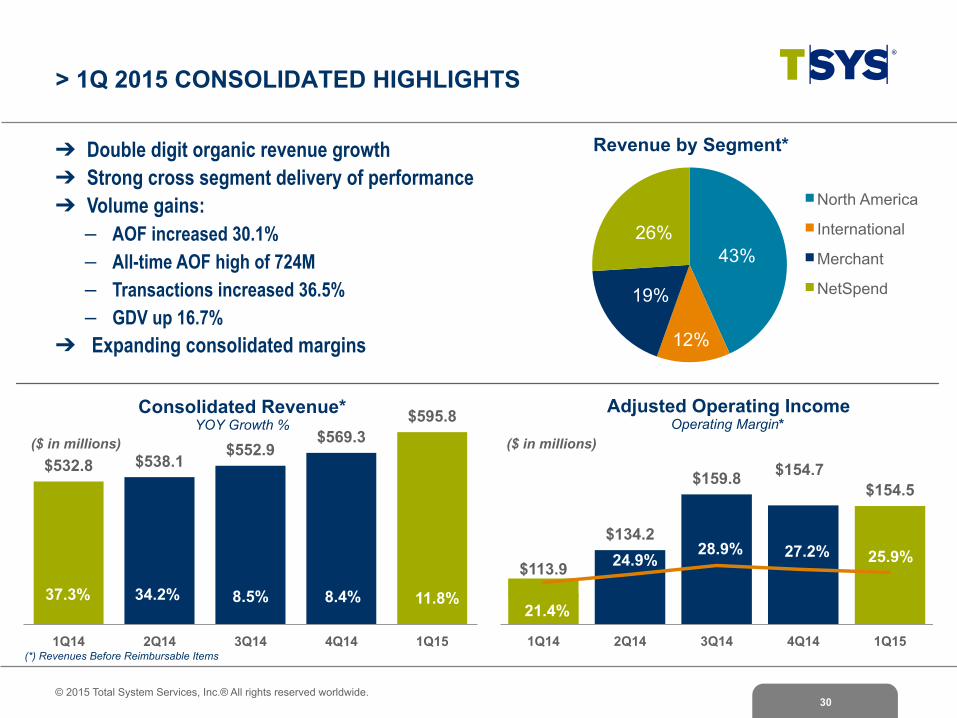
> 1Q 2015 CONSOLIDATED HIGHLIGHTS
© 2015 Total System Services, Inc.® All rights reserved worldwide.
➔ Double digit organic revenue growth ➔ Strong cross segment delivery of performance ➔ Volume gains: − AOF increased 30.1% − All-time AOF high of 724M − Transactions increased 36.5% − GDV up 16.7%
➔ Expanding consolidated margins
43%
12%
19%
26%
Revenue by Segment*
North America
International
Merchant
NetSpend
($ in millions)
(*) Revenues Before Reimbursable Items
$532.8 $538.1 $552.9
$569.3 $595.8
1Q14 2Q14 3Q14 4Q14 1Q15
Consolidated Revenue* YOY Growth %
($ in millions)
37.3%
Adjusted Operating Income Operating Margin*
34.2% 8.5% 8.4% 11.8%
30

> CONSOLIDATED SELECTED FINANCIAL HIGHLIGHTS
© 2015 Total System Services, Inc.® All rights reserved worldwide. 31
Total Revenues $662,156 $592,848 11.7 %
Revenues Before Reimbursable Items 595,784 532,750 11.8
Adjusted EBITDA* 193,454 149,596 29.3
Adjusted EBITDA Margin* 32.47% 28.08% 439
bps
Adjusted EPS* from Continuing Operations $0.54 $0.38 41.2 %
YTD 2015
YTD 2014
Percent Change
(*) Adjusted EBITDA , Adjusted EBITDA margin and Adjusted EPS definitions are contained in Appendix
(in thousands, except per share data)

> M&A PRIORITIES
© 2015 Total System Services, Inc.® All rights reserved worldwide. 32
MERCHANT SOLUTIONS
PRODUCT/DISTRIBUTION/SCALE IN OTHER BUSINESS AREAS
Our M&A Priorities are Focused on Two Major Areas
>!Large-scale, high-growth direct acquirers >!eCommerce, mCommerce & OmniCommerce
>! Integrated payments acquiring >!Smaller tuck-ins
>!NetSpend - new products, customer segments, distribution channels >!North America & International - new products, increased scale

> KEY TAKE-AWAYS
© 2015 Total System Services, Inc.® All rights reserved worldwide. 33
! Financial Results
! Financial Strengths
! Growth Opportunities
! Unique Payments Platform
! People-Centered Payments

Q&A
© 2015 Total System Services, Inc.® All rights reserved worldwide. 34

Appendix
© 2015 Total System Services, Inc.® All rights reserved worldwide. 35

> APPENDIX: Non-GAAP Items – Adjusted EBITDA and Adjusted EPS
© 2015 Total System Services, Inc.® All rights reserved worldwide.
➔ Adjusted EBITDA is net income excluding equity in income of equity investments, nonoperating income/(expense), taxes, depreciation, amortization and stock-based compensation expenses and NetSpend merger & acquisition expenses.
➔ Adjusted EPS is adjusted earnings divided by weighted average shares outstanding used for basic EPS calculations. Adjusted earnings is net income excluding the after-tax impact of stock-based compensation expenses, amortization of acquisition intangibles, and NetSpend merger & acquisition expenses.
➔ Adjusted segment operating income is operating income at the segment level adjusted for amortization of acquisition intangibles. ➔ Adjusted segment operating margin is adjusted segment operating income divided by segment revenues before reimbursable items. ➔ The Company believes that these non-GAAP financial measures it presents are useful to investors in evaluating the Company’s
operating performance for the following reasons: – adjusted EBITDA and adjusted EPS are widely used by investors to measure a company’s operating performance without regard to
items, such as interest expense, income tax expense, depreciation and amortization, merger and acquisition expenses and employee stock-based compensation expense that can vary substantially from company to company depending upon their respective financing structures and accounting policies, the book values of their assets, their capital structures and the methods by which their assets were acquired; and
– securities analysts use adjusted EBITDA and adjusted EPS as supplemental measures to evaluate the overall operating performance of companies.
➔ By comparing the Company’s adjusted EBITDA and adjusted EPS in different historical periods, investors can evaluate the Company’s operating results without the additional variations caused by employee stock-based compensation expense, which may not be comparable from period to period due to changes in the fair market value of the Company’s common stock (which is influenced by external factors like the volatility of public markets and the financial performance of the Company’s peers) and is not a key measure of the Company’s operations.
➔ The Company’s management uses the non-GAAP financial measures: – as measures of operating performance, because they exclude the impact of items not directly resulting from the Company’s core
operations; – for planning purposes, including the preparation of the Company’s annual operating budget; – to allocate resources to enhance the financial performance of the Company’s business; – to evaluate the effectiveness of the Company’s business strategies; and – in communications with the Company’s board of directors concerning the Company’s financial performance.
36

> APPENDIX: Accounts on File Portfolio Summary
© 2015 Total System Services, Inc.® All rights reserved worldwide.
Consumer Credit 364.5 234.8 55.3 364.5 270.0 35.0
Retail 28.3 27.5 2.6 28.3 28.4 (0.5 )
Total Consumer 392.8 262.3 49.8 392.8 298.4 31.6
Commercial 42.3 40.4 4.8 42.3 41.6 1.8
Other 22.7 19.7 15.2 22.7 22.4 1.3
Subtotal 457.8 322.4 42.0 457.8 362.4 26.3 Prepaid*/ Stored Value 126.6 120.0 5.5 126.6 127.3 (0.6 ) Government Services 74.5 63.0 18.3 74.5 67.4 10.6 Commercial Card Single Use 64.8 50.8 27.5 64.8 59.6 8.8
Total AOF 723.7 556.2 30.1 723.7 616.7 17.4
(in millions) Mar 2015
Mar 2014
% Change
Mar 2015
Dec 2014
% Change
(* - Prepaid does not include NetSpend accounts)
37

> APPENDIX: Non-GAAP Reconciliation – Revenues Before Reimbursable Items
© 2015 Total System Services, Inc.® All rights reserved worldwide.
Three Months Ended 3/31/15 3/31/14
Total Revenues $662,156 $592,848
Reimbursable Items 66,372 60,098
Revenues Before Reimbursable Items $595,784 $532,750
(in thousands)
38

39
Twelve Months Ended 12/31/14 12/31/13
Total Revenues $2,446,877 $2,064,305
Reimbursable Items 253,899 240,597
Revenues Before Reimbursable Items $2,192,978 $1,823,708
(in thousands)
© 2015 Total System Services, Inc.® All rights reserved worldwide.
> APPENDIX: Non-GAAP Reconciliation – Revenues Before Reimbursable Items

> APPENDIX: Non-GAAP Reconciliation – Adjusted Segment Operating Income and Operating Margin
© 2015 Total System Services, Inc.® All rights reserved worldwide.
Three Months Ended 3/31/15 3/31/14
Operating Income $122,496 $80,697 Add: Acquisition Intangible Amort 23,867 24,313 Add: Corporate Admin and Other 32,772 33,008 Total Segment Adjusted Operating Income $179,135 $138,018 By Segment: North America Services (a) $102,570 $74,578 International Services (b) $6,983 $4,555 Merchant Services (c) $34,115 $30,168 NetSpend (d) $35,467 $28,717 Total Revenues $662,156 $592,848 Reimbursable Items (66,372) (60,098) Total Segment Revenues Before Reimbursable Items $595,784 $532,750 Intersegment Revenues 9,637 5,656 By Segment: North America Services (e) $266,219 $224,368 International Services (f) $73,730 $76,773 Merchant Services (g) $110,398 $104,625 NetSpend (h) $155,074 $132,640 Adjusted Segment Operating Margin: North America Services (a) / (e) 38.53% 33.24% International Services (b) / (f) 9.47% 5.93% Merchant Services (c) / (g) 30.90% 28.83% NetSpend (d) / (h) 22.87% 21.65%
(in thousands)
40

> APPENDIX: Non-GAAP Reconciliation – Constant Currency
© 2015 Total System Services, Inc.® All rights reserved worldwide.
Three Months Ended
3/31/15 3/31/14 Percentage
Change
(1) Reflects current period results on a non-GAAP basis as if foreign currency rates did not change from the comparable prior year period. (2) Reflects the impact of calculated changes in foreign currency rates from the comparable period.
(in thousands)
Consolidated:
Constant Currency (1) $669,863 $592,848 13.0 %
Foreign Currency (2) (7,707 ) ---
Total Revenues $662,156 $592,848 11.7 %
International Services:
Constant Currency (1) $87,381 $82,378 6.1 %
Foreign Currency (2) (7,579 ) ---
Total Revenues $79,802 $82,378 (3.1 %)
41

> APPENDIX: Non-GAAP Reconciliation – Constant Currency
© 2015 Total System Services, Inc.® All rights reserved worldwide.
(1) Reflects current period results on a non-GAAP basis as if foreign currency rates did not change from the comparable prior year period. (2) Reflects the impact of calculated changes in foreign currency rates from the comparable period.
Three Months Ended
3/31/15 3/31/14 Percentage
Change (in thousands)
Consolidated:
Constant Currency (1) $602,902 $532,750 13.2 %
Foreign Currency (2) (7,118 ) --- Revenues Before
Reimbursable Items $595,784 $532,750 11.8 %
International Services:
Constant Currency (1) $80,719 $76,773 5.1 %
Foreign Currency (2) (6,989 ) --- Revenues Before
Reimbursable Items $73,730 $76,773 (4.0 %)
42

> APPENDIX: Non-GAAP Reconciliation – EBITDA and Adjusted EBITDA
© 2015 Total System Services, Inc.® All rights reserved worldwide.
(in thousands)
Three Months Ended Mar 2015
Mar 2014
Net Income : As Reported (GAAP) (a) $78,899 $51,625 Adjusted for: Add/(Deduct): Loss/(Income) from
Discontinued Operations -- (980 ) Deduct: Equity in Income of Equity
Investments (5,394 ) (4,096 ) Add: Income Taxes 39,782 24,335 Add: Non-operating Expenses 9,209 9,813
Add: Depreciation and Amortization 62,815 60,035 EBITDA $185,311 $140,732 Adjust for: Add: Share-based Compensation 8,143 7,611 Add: NetSpend M&A Expenses -- 1,253 Adjusted EBITDA $193,454 $149,596
43

> APPENDIX: Non-GAAP Reconciliation – Adjusted EPS
© 2015 Total System Services, Inc.® All rights reserved worldwide.
(in thousands) Three Months Ended
Mar 2015
Mar 2014
Income from Continuing Operations Available to TSYS common shareholders:
As Reported (GAAP) (a) $77,755 $49,321
Adjusted for Amounts Attributable to TSYS Common Shareholders (net of taxes):
Acquisition Intangible Amortization 15,761 15,813
Share-Based Compensation 5,441 5,017
NetSpend M&A Expenses -- 1,204
Adjusted Earnings (b) $98,957 $71,355
Average Common Shares Outstanding and Participating Securities (c) 184,481 187,752
Basic EPS Available to TSYS Common Shareholders (a) / (c) $0.42 $0.26
Adjusted EPS Available to TSYS Common Shareholders (b) / (c) $0.54 $0.38
44

> APPENDIX: Non-GAAP Reconciliation – Free Cash Flow
© 2015 Total System Services, Inc.® All rights reserved worldwide.
Trailing Twelve Months Ended
3/31/2015
Cash Flows from Operating Activities $569,987
Less:
Purchases of Property and Equipment (72,320 )
Additions to Licensed Computer Software from Vendors (35,256 )
Additions to Internally Developed Computer Software (41,327 )
Additions to Contract Acquisition Costs (83,332 )
Free Cash Flow $337,752
(in thousands)
45

Twelve Months
Ended 12/31/2014
Cash Flows from Operating Activities $560,201
Less:
Purchase of Property and Equipment (75,913 )
Additions to Licensed Computer Software from Vendors (29,638 )
Additions to Internally Developed Computer Software (41,501 )
Additions to Contract Acquisition Costs (88,871 )
Free Cash Flow $324,278
(in thousands)
> APPENDIX: Non-GAAP Reconciliation – Free Cash Flow
46 © 2015 Total System Services, Inc.® All rights reserved worldwide.

> APPENDIX: Non-GAAP Reconciliation – EBITDA and Adjusted EBITDA
© 2015 Total System Services, Inc.® All rights reserved worldwide.
Trailing Twelve Months Ended
3/31/2015
Net Income $356,679
Adjusted for:
Deduct: Discontinued Operations (47,674 )
Deduct: Equity in Income of Equity Investments (18,881 )
Add: Income Taxes 145,207
Add: Non-operating Expense 38,108
Add: Depreciation and Amortization 249,401
EBITDA $722,840
Adjust for: Share-based Compensation 31,322
NetSpend M&A Operating Expenses* 1,963
Adjusted EBITDA $756,125
(in thousands)
* Excludes share-based compensation
47

Twelve Months Ended
12/31/2014
Net Income $329,406
Adjusted for:
Deduct: Discontinued Operations (48,655 )
Deduct: Equity in Income of Equity Investments (17,583 )
Add: Income Taxes 129,761
Add: Non-operating Expense 38,711
Add: Depreciation and Amortization 246,620
EBITDA $678,260
Adjust for: Share-based Compensation 30,790
NetSpend M&A Operating Expenses* 3,217
Adjusted EBITDA $712,267
> APPENDIX: Non-GAAP Reconciliation – EBITDA and Adjusted EBITDA
48
(in thousands)
* Excludes share-based compensation
© 2015 Total System Services, Inc.® All rights reserved worldwide.

> APPENDIX: 2015 Revised Guidance Assumptions
© 2015 Total System Services, Inc.® All rights reserved worldwide. 49
The guidance assumes: !! There will be no significant movements in the London Interbank Offered rate
and TSYS will not make any significant draws on the remaining balance of its credit facility;
!! There will be no significant movement in foreign currency exchange rates related to TSYS’ business;
!! TSYS will not incur significant expenses associated with the conversion of new large clients other than included in the 2015 estimate, additional acquisitions, or any significant impairment of goodwill or other intangibles;
!! There will be no deconversions of large clients during the year; !! No future share repurchases are included; and !! The economy will not worsen.