Embed Size (px)
Citation preview

TSX Turning Point
6 June 2018
1
TSX Quant/Technical Ranker
Summary
This is a tool for a Canadian Portfolio Manager to quickly screen their coverage universe and identify the stocks with the strongest
quantitative (Quest®) and technical (momentum) characteristics.
For long-term investors:
Add exposure to/overweight those names with the strongest QUEST® scores, and with monthly momentum scores that are Accelerating
(Quadrant 2) or Pulling Back (Quadrant 3) (see Appendix 1).
Reduce exposure to/underweight those names with the weakest QUEST® scores, and with monthly momentum scores that are
Deteriorating (Quadrant 4) or Turning Up (Quadrant 1) (see Appendix 1).
For intermediate-term/short-term investors:
Add exposure to/overweight those names with the strongest QUEST® scores, and with weekly momentum scores that are Accelerating
(Quadrant 2) or Pulling Back (Quadrant 3) (see Appendix 1).
Reduce exposure to/underweight those names with the weakest QUEST® scores, and with weekly momentum scores that are
Deteriorating (Quadrant 4) or Turning Up (Quadrant 1) (see Appendix 1).
For Experienced Investors:
Reduce Exposure Screen - Those names with monthly/weekly scores that are Pulling Back (Quadrant 3), with deteriorating QUEST®
Value/Quality scores.
Add Exposure Screen - Those names with monthly/weekly scores that are Turning Up (Quadrant 1), with improving QUEST® Value/Quality
scores.
Javed Mirza, CFA, CMT, MBA
Analyst | Canaccord Genuity Corp. (Canada)
416.867.6089
All values in Canadian dollars unless otherwise
noted.
Priced as of prior trading day's market close, ET (unless otherwise stated).
For important information, please see the Important Disclosures beginning on page 24 of this document.
2
Table of Contents
Overview: TSX Sectors .................................................................................................3
Overview: Top Fifteen & Bottom Fifteen Companies ...................................................4
S&P TSX: Consumer Discretionary ..............................................................................5
S&P TSX: Consumer Staples .......................................................................................6
S&P TSX: Energy ..........................................................................................................7
S&P TSX: Financials ....................................................................................................9
S&P TSX: Health Care .............................................................................................. 10
S&P TSX: Industrials ................................................................................................. 11
S&P TSX: Information Technology ............................................................................ 12
S&P TSX: Materials .................................................................................................. 13
S&P TSX: Real Estate ............................................................................................... 15
S&P TSX: Telecom .................................................................................................... 16
S&P TSX: Utilities...................................................................................................... 17
Technical - TSX Turning Point Methodology ............................................................. 18
Technical - Momentum Diagram .............................................................................. 19
What is Quest® triAngle ........................................................................................... 20
How the Quest® triAngle score is calculated ........................................................... 21
Quest® triAngle Definitions...................................................................................... 22
Notes on Quest® ..................................................................................................... 23
TSX Turning PointMacro Update
6 June 2018 2

3
Overview: TSX Sectors
Source: Canaccord Genuity Research, Canaccord Genuity Quest®
TSX Sector Sector Weight
Capped Index
Absolute
Momentum
(Weekly)
Capped Index
Trend Relative to
the TSX (Weekly)
% of Stocks
With Positive
Momentum (Daily)
% of Stocks
Improving (Daily)
% of Stocks
Accelerating (Daily)
% of Stocks
Pulling Back (Daily)
% of Stocks
Deteriorating
(Daily)
Consumer Discretionary 5.69% Pulling Back Bull 68.2% 13.6% 36.4% 31.8% 18.2%
Consumer Staples 3.37% Accelerating Bear 90.0% 10.0% 50.0% 40.0% 0.0%
Energy 19.05% Deteriorating Bull 28.6% 10.2% 10.2% 18.4% 61.2%
Financials 33.62% Deteriorating Bear 48.1% 14.8% 14.8% 33.3% 37.0%
Health Care 1.39% Pulling Back Bear 77.8% 22.2% 22.2% 55.6% 0.0%
Industrials 10.24% Accelerating Bull 74.1% 11.1% 44.4% 29.6% 14.8%
Information Technology 4.11% Accelerating Bull 90.9% 0.0% 81.8% 9.1% 9.1%
Materials 11.91% Pulling Back Bull 54.7% 24.5% 28.3% 26.4% 20.8%
Real Estate 2.81% Accelerating Bear 85.7% 9.5% 47.6% 38.1% 4.8%
Telecommunication Services 4.40% Deteriorating Bear 66.7% 0.0% 33.3% 33.3% 33.3%
Utilities 3.41% Improving Bear 53.3% 20.0% 40.0% 13.3% 26.7%
TSX Sector Value ScoreValue Score
(Weekly Change)Quality Score
Quality Score
(Weekly Change)Momentum Score
Momentum Score
(Weekly Change)Triangle Score
triAngle Score
(Weekly Change)
Consumer Discretionary 16.82 -0.09 19.82 0.05 19.00 0.09 55.68 -0.18
Consumer Staples 15.70 -0.10 19.50 0.10 17.00 -0.20 52.00 -0.30
Energy 18.96 0.02 15.80 -0.02 19.18 0.00 53.73 -0.14
Financials 12.00 -0.04 13.59 -0.04 10.33 0.11 35.81 -0.07
Health Care 14.67 -0.22 17.22 0.00 17.44 -0.22 49.44 -0.44
Industrials 14.26 -0.19 20.26 0.04 21.15 -0.04 55.70 -0.11
Information Technology 9.91 -0.09 22.45 -0.18 24.55 0.64 56.73 0.27
Materials 19.58 -0.06 20.36 0.00 18.51 0.13 58.42 0.11
Real Estate 3.10 0.00 4.57 0.00 4.00 -0.24 11.62 -0.24
Telecommunication Services 15.67 0.00 17.00 0.00 16.67 0.00 49.67 0.00
Utilities 20.13 0.07 17.93 0.07 14.27 -0.67 52.40 -0.33
Momentum Scores
Quest Quantitative Scores
M-Score Data Updated: June 06, 2018
Each column's colour scale is independent of other columns
TSX Turning PointMacro Update
6 June 2018 3

4
Overview: Top Fifteen & Bottom Fifteen Companies
Source: Canaccord Genuity Research, Canaccord Genuity Quest®
triAngle (/100) Value (/33) Quality (/33) Momentum (/33) Quadrant (Monthly) Quadrant (Weekly) Quadrant (Daily)
Parex Resources Inc. PXT-CA 83 23 27 33 2 2 1
Kirkland Lake Gold Ltd. KL-CA 78 17 29 32 2 2 4
Tricon Capital Group Inc. TCN-CA 77 27 30 21 3 2 3
Raging River Exploration Inc. RRX-CA 75 24 28 23 1 2 4
Norbord Inc. OSB-CA 75 20 26 29 2 2 2
Alacer Gold Corp. ASR-CA 75 27 23 25 1 2 4
TORC Oil & Gas Ltd. TOG-CA 75 27 19 29 2 2 4
Magna International Inc. MG-CA 74 19 26 29 2 2 3
Canfor Corporation CFP-CA 73 21 22 30 2 2 3
MARTINREA International Inc. MRE-CA 73 25 21 27 3 3 4
West Fraser Timber Co. Ltd. WFT-CA 73 19 25 30 2 2 2
Imperial Oil Limited IMO-CA 73 25 21 27 1 2 3
Fortuna Silver Mines Inc. FVI-CA 72 20 25 27 1 2 1
Nutrien Ltd. NTR-CA 71 21 22 28 n/a n/a 3
Constellation Software Inc. CSU-CA 71 10 31 30 2 2 2
triAngle (/100) Value (/33) Quality (/33) Momentum (/33) Quadrant (Monthly) Quadrant (Weekly) Quadrant (Daily)
Advantage Oil & Gas Ltd. AAV-CA 43 21 15 7 4 2 4
Ensign Energy Services Inc. ESI-CA 42 23 10 9 4 1 4
Dorel Industries Inc. Class B DII.B-CA 42 24 12 6 4 4 1
Cineplex Inc. CGX-CA 41 18 13 9 4 4 3
Trican Well Service Ltd. TCW-CA 41 24 9 9 4 1 1
Chemtrade Logistics Income Fund CHE.UT-CA 41 14 17 10 4 1 2
Sierra Wireless Inc. SW-CA 41 13 16 12 4 2 4
ShawCor Ltd. SCL-CA 40 17 11 13 1 1 3
CES Energy Solutions Corp CEU-CA 39 13 14 12 4 4 1
NexGen Energy Ltd. NXE-CA 39 11 12 15 3 1 2
ProMetic Life Sciences Inc. PLI-CA 37 13 19 5 4 1 3
Extendicare Inc. EXE-CA 37 14 15 8 4 4 1
BlackBerry Limited BB-CA 37 4 11 23 2 1 2
Paramount Resources Ltd. Class A POU-CA 32 17 8 7 3 1 2
Thomson Reuters Corporation TRI-CA 30 10 10 10 4 1 2
Momentum
Momentum
Top Fifteen Companies Ticker
Quest Quant Scores
Bottom Fifteen Companies Ticker
Quest Quant Scores
M-Score Data Updated: June 06, 2018
Each column's colour scale is independent of other columns
TSX Turning PointMacro Update
6 June 2018 4

5
S&P TSX: Consumer Discretionary
Source: Canaccord Genuity Research, Canaccord Genuity Quest®
triAngle (/100) Value (/33) Quality (/33) Momentum (/33) Quadrant (Monthly) Quadrant (Weekly) Quadrant (Daily)
Magna International Inc. MG-CA 74 19 26 29 2 2 3
MARTINREA International Inc. MRE-CA 73 25 21 27 3 3 4
Great Canadian Gaming Corporation GC-CA 67 10 23 33 2 2 3
Canada Goose Holdings, Inc. GOOS-CA 66 7 27 32 n/a 2 2
Stars Group Inc. TSGI-CA 65 13 21 32 2 2 3
Linamar Corporation LNR-CA 65 23 28 13 3 4 4
BRP, Inc. DOO-CA 65 13 22 30 2 2 2
Gildan Activewear Inc. GIL-CA 59 18 26 15 3 1 2
Spin Master Corp TOY-CA 58 11 26 21 3 4 4
Quebecor Inc. Class B QBR.B-CA 57 15 17 24 3 2 3
Canadian Tire Corporation, Limited Class A CTC.A-CA 57 19 17 21 3 4 1
Corus Entertainment Inc. Class B CJR.B-CA 53 25 19 9 4 1 2
Dollarama Inc. DOL-CA 51 8 19 24 3 1 2
Sleep Country Canada Holdings Inc ZZZ-CA 50 19 17 14 3 4 1
EnerCare Inc. ECI-CA 50 16 21 13 4 1 2
Cogeco Communications Inc. CCA-CA 49 21 18 11 3 1 4
Restaurant Brands International Inc QSR-CA 49 18 16 15 3 1 2
Hudson's Bay Co. HBC-CA 45 15 15 15 1 1 2
Uni-Select Inc. UNS-CA 45 18 19 8 4 1 3
Shaw Communications Inc. Class B SJR.B-CA 44 15 13 17 4 2 3
Dorel Industries Inc. Class B DII.B-CA 42 24 12 6 4 4 1
Cineplex Inc. CGX-CA 41 18 13 9 4 4 3
M-Score Data Updated: June 06, 2018
Each column's colour scale is independent of other columns
Company Name Ticker
MomentumQuest Quant Scores
TSX Turning PointMacro Update
6 June 2018 5

6
S&P TSX: Consumer Staples
Source: Canaccord Genuity Research, Canaccord Genuity Quest®
triAngle (/100) Value (/33) Quality (/33) Momentum (/33) Quadrant (Monthly) Quadrant (Weekly) Quadrant (Daily)
Premium Brands Holdings Corporation PBH-CA 59 9 27 24 3 3 1
Empire Co. Ltd. Class A EMP.A-CA 58 18 16 24 3 3 2
North West Company Inc. NWC-CA 53 21 21 12 4 1 2
Saputo Inc. SAP-CA 53 13 21 19 1 2 3
Metro Inc. MRU-CA 53 15 19 19 1 2 3
Alimentation Couche-Tard Inc. Class B ATD.B-CA 53 18 24 11 4 1 2
George Weston Limited WN-CA 52 21 17 14 4 1 2
Loblaw Companies Limited L-CA 48 16 15 17 4 1 3
Cott Corporation BCB-CA 48 11 18 19 2 2 3
Maple Leaf Foods Inc. MFI-CA 43 15 17 11 3 1 2
M-Score Data Updated: June 06, 2018
Each column's colour scale is independent of other columns
Company Name TickerMomentumQuest Quant Scores
TSX Turning PointMacro Update
6 June 2018 6

7
S&P TSX: Energy (1 of 2)
Source: Canaccord Genuity Research, Canaccord Genuity Quest®
triAngle (/100) Value (/33) Quality (/33) Momentum (/33) Quadrant (Monthly) Quadrant (Weekly) Quadrant (Daily)
Parex Resources Inc. PXT-CA 83 23 27 33 2 2 1
Raging River Exploration Inc. RRX-CA 75 24 28 23 1 2 4
TORC Oil & Gas Ltd. TOG-CA 75 27 19 29 2 2 4
Imperial Oil Limited IMO-CA 73 25 21 27 1 2 3
Tourmaline Oil Corp. TOU-CA 70 25 21 24 1 2 3
Husky Energy Inc. HSE-CA 70 25 17 29 2 2 4
Gran Tierra Energy Inc. GTE-CA 69 21 17 30 2 2 4
Suncor Energy Inc. SU-CA 69 20 21 29 2 2 4
Enerplus Corporation ERF-CA 68 25 15 28 2 3 3
Kelt Exploration Ltd. KEL-CA 67 19 19 30 2 2 4
Canadian Natural Resources Limited CNQ-CA 67 24 19 24 2 2 4
Pembina Pipeline Corporation PPL-CA 64 17 23 24 3 2 3
Whitecap Resources Inc. WCP-CA 63 25 17 21 1 2 4
NuVista Energy Ltd. NVA-CA 63 17 16 30 2 2 4
Seven Generations Energy Ltd. Class A VII-CA 63 25 25 14 1 3 4
Crescent Point Energy Corp. CPG-CA 62 28 15 19 1 3 4
Parkland Fuel Corporation PKI-CA 61 13 21 27 2 2 2
Baytex Energy Corp. BTE-CA 61 20 11 31 1 2 4
Birchcliff Energy Ltd. BIR-CA 60 29 15 16 1 2 4
MEG Energy Corp. MEG-CA 59 18 9 33 2 2 3
Encana Corporation ECA-CA 59 23 12 25 2 2 4
Precision Dril l ing Corporation PD-CA 57 19 11 27 1 2 4
Vermilion Energy Inc. VET-CA 57 16 16 25 1 2 3
Pason Systems Inc. PSI-CA 55 14 13 27 2 2 4
Keyera Corp. KEY-CA 53 15 21 17 1 2 2
Computer Modelling Group Ltd. CMG-CA 53 11 25 18 4 2 4
Cameco Corporation CCO-CA 53 17 11 26 1 2 1
Inter Pipeline Ltd. IPL-CA 52 15 19 18 1 2 3
Gibson Energy Inc. GEI-CA 51 17 13 21 4 2 2
Peyto Exploration & Development Corp. PEY-CA 50 24 18 8 4 3 4
M-Score Data Updated: June 06, 2018
Each column's colour scale is independent of other columns
Company Name Ticker
MomentumQuest Quant Scores
TSX Turning PointMacro Update
6 June 2018 7

8
S&P TSX: Energy (2 of 2)
Source: Canaccord Genuity Research, Canaccord Genuity Quest®
M-Score Data Updated: June 06, 2018
Each column's colour scale is independent of other columns
triAngle (/100) Value (/33) Quality (/33) Momentum (/33) Quadrant (Monthly) Quadrant (Weekly) Quadrant (Daily)
Secure Energy Services Inc. SES-CA 49 23 14 12 4 4 4
Cenovus Energy Inc. CVE-CA 49 19 8 23 1 2 4
PrairieSky Royalty Ltd PSK-CA 49 11 23 15 4 1 4
Enbridge Inc. ENB-CA 49 17 20 12 4 1 4
ARC Resources Ltd. ARX-CA 48 23 15 11 1 3 4
TransCanada Corporation TRP-CA 48 17 18 13 4 1 1
Enerflex Ltd. EFX-CA 47 20 16 11 4 4 4
Freehold Royalties Ltd. FRU-CA 47 15 17 15 4 1 4
AltaGas Ltd. ALA-CA 46 20 14 12 4 1 4
Mullen Group Ltd. MTL-CA 43 17 15 11 4 3 4
Advantage Oil & Gas Ltd. AAV-CA 43 21 15 7 4 2 4
Ensign Energy Services Inc. ESI-CA 42 23 10 9 4 1 4
Trican Well Service Ltd. TCW-CA 41 24 9 9 4 1 1
ShawCor Ltd. SCL-CA 40 17 11 13 1 1 3
CES Energy Solutions Corp CEU-CA 39 13 14 12 4 4 1
NexGen Energy Ltd. NXE-CA 39 11 12 15 3 1 2
Paramount Resources Ltd. Class A POU-CA 32 17 8 7 3 1 2
Enbridge Income Fund Holdings Inc. ENF-CA 0 0 0 0 4 2 3
Kinder Morgan Canada Ltd. KML-CA 0 0 0 0 n/a 4 4
Company Name Ticker
MomentumQuest Quant Scores
TSX Turning PointMacro Update
6 June 2018 8

9
S&P TSX: Financials
Source: Canaccord Genuity Research, Canaccord Genuity Quest®
triAngle (/100) Value (/33) Quality (/33) Momentum (/33) Quadrant (Monthly) Quadrant (Weekly) Quadrant (Daily)
Home Capital Group Inc. HCG-CA 71 27 27 17 1 1 2
Canadian Western Bank CWB-CA 65 21 25 20 3 1 4
National Bank of Canada NA-CA 65 17 27 21 3 1 4
Canadian Imperial Bank of Commerce CM-CA 65 19 28 19 3 1 4
Toronto-Dominion Bank TD-CA 64 15 27 23 2 2 3
Bank of Montreal BMO-CA 61 15 23 22 3 2 4
Onex Corporation ONEX-CA 59 27 15 17 3 3 3
Bank of Nova Scotia BNS-CA 58 18 26 14 3 4 4
ECN Capital Corp. ECN-CA 57 26 15 16 n/a 1 3
Royal Bank of Canada RY-CA 57 15 25 17 3 1 4
Laurentian Bank of Canada LB-CA 55 21 24 11 4 4 4
CI Financial Corp. CIX-CA 55 18 25 11 3 4 1
Alaris Royalty Corp. AD-CA 54 24 22 8 4 1 1
TMX Group Ltd. X-CA 54 13 15 27 2 2 3
Element Fleet Management Corporation EFN-CA 50 21 17 12 4 2 3
IGM Financial Inc. IGM-CA 47 17 16 14 3 1 4
Thomson Reuters Corporation TRI-CA 30 10 10 10 4 1 2
Genworth MI Canada Inc. MIC-CA 0 0 0 0 3 1 1
Power Corporation of Canada POW-CA 0 0 0 0 3 1 2
Intact Financial Corporation IFC-CA 0 0 0 0 3 1 3
Power Financial Corporation PWF-CA 0 0 0 0 4 1 2
Industrial Alliance Insurance and Financial Services Inc. IAG-CA 0 0 0 0 3 1 3
Great-West Lifeco Inc. GWO-CA 0 0 0 0 4 1 1
Fairfax Financial Holdings Limited FFH-CA 0 0 0 0 2 2 3
Brookfield Asset Management Inc. Class A BAM.A-CA 0 0 0 0 3 2 3
Sun Life Financial Inc. SLF-CA 0 0 0 0 2 2 4
Manulife Financial Corporation MFC-CA 0 0 0 0 3 1 4
M-Score Data Updated: June 06, 2018
Each column's colour scale is independent of other columns
Company Name Ticker
MomentumQuest Quant Scores
TSX Turning PointMacro Update
6 June 2018 9

10
S&P TSX: Health Care
Source: Canaccord Genuity Research, Canaccord Genuity Quest®
triAngle (/100) Value (/33) Quality (/33) Momentum (/33) Quadrant (Monthly) Quadrant (Weekly) Quadrant (Daily)
Valeant Pharmaceuticals International Inc VRX-CA 59 9 17 32 2 2 3
Aphria Inc APH-CA 58 17 21 20 3 1 3
Aurora Cannabis Inc. ACB-CA 57 17 21 19 3 1 2
Canopy Growth Corporation WEED-CA 54 14 13 27 2 2 3
Knight Therapeutics, Inc. GUD-CA 54 17 23 14 4 2 3
Sienna Senior Living Inc. SIA-CA 45 16 15 14 3 4 1
Chartwell Retirement Residences CSH.UT-CA 44 15 11 18 4 4 2
ProMetic Life Sciences Inc. PLI-CA 37 13 19 5 4 1 3
Extendicare Inc. EXE-CA 37 14 15 8 4 4 1
M-Score Data Updated: June 06, 2018
Each column's colour scale is independent of other columns
Company Name Ticker
MomentumQuest Quant Scores
TSX Turning PointMacro Update
6 June 2018 10

11
S&P TSX: Industrials
Source: Canaccord Genuity Research, Canaccord Genuity Quest®
triAngle (/100) Value (/33) Quality (/33) Momentum (/33) Quadrant (Monthly) Quadrant (Weekly) Quadrant (Daily)
Toromont Industries Ltd. TIH-CA 67 13 27 26 3 2 3
Transcontinental Inc. Class A TCL.A-CA 65 17 21 27 3 2 2
Ritchie Bros. Auctioneers Incorporated RBA-CA 64 13 23 28 1 2 2
Waste Connections, Inc. WCN-CA 64 13 24 27 3 2 2
Canadian Pacific Railway Limited CP-CA 64 15 22 27 2 2 2
SNC-Lavalin Group Inc. SNC-CA 63 18 25 21 2 2 2
Exchange Income Corporation EIF-CA 63 19 22 22 1 1 3
Badger Daylighting Ltd. BAD-CA 61 15 24 22 1 2 3
Finning International Inc. FTT-CA 61 16 19 26 2 1 2
WSP Global Inc. WSP-CA 61 11 20 29 2 2 2
CAE Inc. CAE-CA 61 12 21 27 2 2 2
TFI International Inc. TFII-CA 59 13 17 29 2 2 3
Boyd Group Income Fund BYD.UT-CA 58 8 22 28 2 2 3
Canadian National Railway Company CNR-CA 58 15 22 21 3 2 3
Air Canada AC-CA 57 19 21 17 3 4 4
Westshore Terminals Investment Corporation WTE-CA 57 19 23 15 4 1 1
Automation Tooling Systems Inc. ATA-CA 56 6 21 29 2 2 3
Russel Metals Inc. RUS-CA 56 19 17 21 3 1 4
Aecon Group Inc. ARE-CA 55 23 21 11 3 4 4
Bombardier Inc. Class B BBD.B-CA 53 9 13 31 2 2 2
Stantec Inc STN-CA 53 17 22 14 4 1 1
Morneau Shepell Inc. MSI-CA 53 11 16 26 2 3 2
NFI Group Inc. NFI-CA 53 11 23 18 3 4 1
Maxar Technologies Ltd. MAXR-CA 49 15 23 12 4 1 2
Chorus Aviation Inc. CHR-CA 48 16 21 11 3 1 4
WestJet WJA-CA 45 22 17 6 3 4 2
Brookfield Business Partners LP BBU.UT-CA 0 0 0 0 2 2 3
M-Score Data Updated: June 06, 2018
Each column's colour scale is independent of other columns
Company Name Ticker
MomentumQuest Quant Scores
TSX Turning PointMacro Update
6 June 2018 11
12
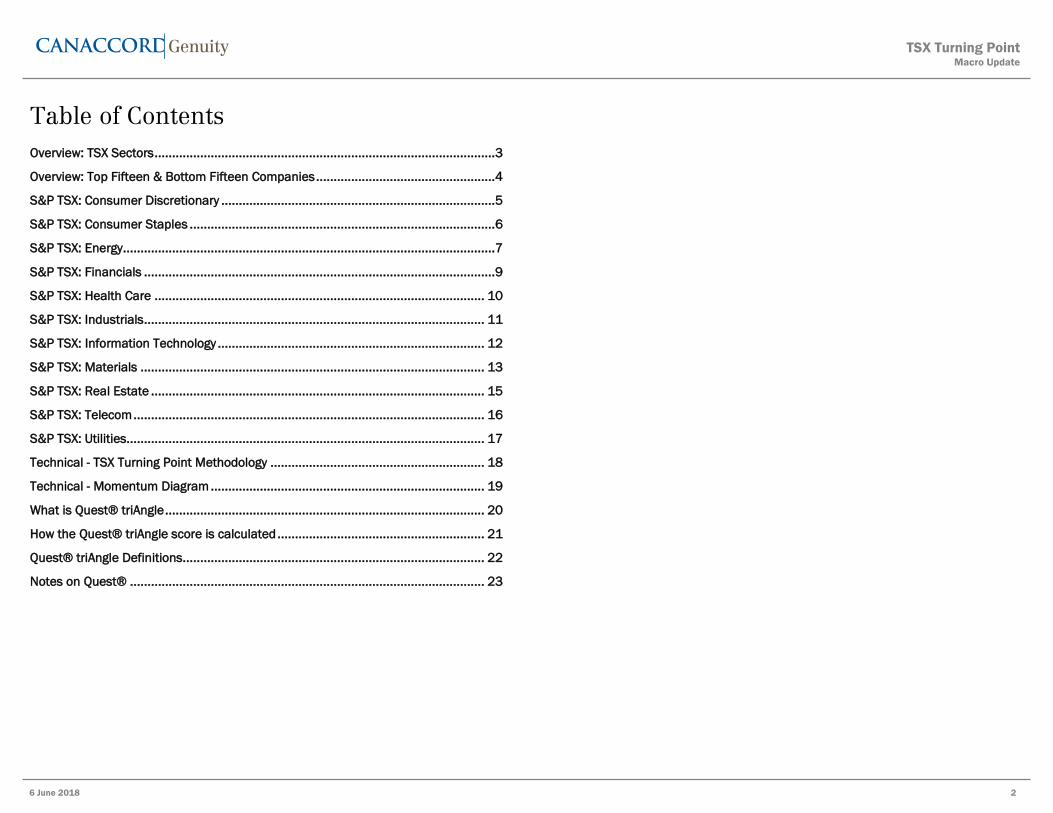
S&P TSX: Information Technology
Source: Canaccord Genuity Research, Canaccord Genuity Quest®
triAngle (/100) Value (/33) Quality (/33) Momentum (/33) Quadrant (Monthly) Quadrant (Weekly) Quadrant (Daily)
Constellation Software Inc. CSU-CA 71 10 31 30 2 2 2
Open Text Corporation OTEX-CA 65 17 26 22 2 3 2
Enghouse Systems Limited ENGH-CA 62 10 27 25 2 3 2
Shopify, Inc. Class A SHOP-CA 59 9 19 32 3 2 2
Mitel Networks Corporation MNW-CA 59 7 21 31 2 2 2
Kinaxis, Inc. KXS-CA 59 8 29 22 3 4 2
Celestica Inc. CLS-CA 59 15 21 23 4 2 2
CGI Group Inc. Class A GIB.A-CA 59 9 23 27 2 2 2
Descartes Systems Group Inc. DSG-CA 53 7 23 23 2 2 3
Sierra Wireless Inc. SW-CA 41 13 16 12 4 2 4
BlackBerry Limited BB-CA 37 4 11 23 2 1 2
M-Score Data Updated: June 06, 2018
Each column's colour scale is independent of other columns
Company Name Ticker
MomentumQuest Quant Scores
TSX Turning PointMacro Update
6 June 2018 12

13
S&P TSX: Materials (1 of 2)
Source: Canaccord Genuity Research, Canaccord Genuity Quest®
triAngle (/100) Value (/33) Quality (/33) Momentum (/33) Quadrant (Monthly) Quadrant (Weekly) Quadrant (Daily)
Kirkland Lake Gold Ltd. KL-CA 78 17 29 32 2 2 4
Norbord Inc. OSB-CA 75 20 26 29 2 2 2
Alacer Gold Corp. ASR-CA 75 27 23 25 1 2 4
Canfor Corporation CFP-CA 73 21 22 30 2 2 3
West Fraser Timber Co. Ltd. WFT-CA 73 19 25 30 2 2 2
Fortuna Silver Mines Inc. FVI-CA 72 20 25 27 1 2 1
Nutrien Ltd. NTR-CA 71 21 22 28 n/a n/a 3
Tahoe Resources Inc. THO-CA 71 29 25 17 1 3 2
First Quantum Minerals Ltd. FM-CA 71 21 22 27 2 2 4
SSR Mining Inc SSRM-CA 71 23 21 26 1 2 2
Interfor Corporation IFP-CA 70 18 22 30 2 2 3
Teck Resources Limited Class B TECK.B-CA 68 23 19 26 2 1 3
SEMAFO Inc. SMF-CA 67 21 25 21 1 2 1
Guyana Goldfields Inc. GUY-CA 67 22 24 21 1 3 1
Western Forest Products Inc. WEF-CA 66 23 22 21 3 3 4
Torex Gold Resources Inc. TXG-CA 65 25 23 18 4 2 4
B2Gold Corp. BTO-CA 65 23 25 18 4 1 1
Wheaton Precious Metals Corp WPM-CA 65 18 23 24 1 2 2
Methanex Corporation MX-CA 65 17 17 31 2 2 3
Pan American Silver Corp. PAAS-CA 65 21 20 24 1 2 3
Sandstorm Gold Ltd. SSL-CA 64 20 22 22 2 1 1
OceanaGold Corporation OGC-CA 64 24 24 16 4 4 1
IAMGOLD Corporation IMG-CA 64 22 17 25 3 2 3
Endeavour Mining Corporation EDV-CA 63 23 23 17 3 1 2
Kinross Gold Corporation K-CA 63 32 17 14 3 1 1
Lundin Mining Corporation LUN-CA 62 25 18 19 3 1 1
Turquoise Hill Resources Ltd. TRQ-CA 61 23 20 18 1 4 1
Nevsun Resources Ltd. NSU-CA 61 11 23 27 1 2 4
Goldcorp Inc. G-CA 61 23 17 21 1 2 2
CCL Industries Inc. Class B CCL.B-CA 60 11 28 21 3 3 3
M-Score Data Updated: June 06, 2018
Each column's colour scale is independent of other columns
Company Name Ticker
MomentumQuest Quant Scores
TSX Turning PointMacro Update
6 June 2018 13

14
S&P TSX: Materials (2 of 2)
Source: Canaccord Genuity Research, Canaccord Genuity Quest®
M-Score Data Updated: June 06, 2018
Each column's colour scale is independent of other columns
triAngle (/100) Value (/33) Quality (/33) Momentum (/33) Quadrant (Monthly) Quadrant (Weekly) Quadrant (Daily)
Centerra Gold Inc. CG-CA 60 23 23 15 3 3 1
Yamana Gold Inc. YRI-CA 59 23 16 19 1 1 2
Pretium Resources Inc. PVG-CA 57 21 24 12 4 2 3
Intertape Polymer Group Inc. ITP-CA 57 21 21 15 4 1 2
Alamos Gold Inc. AGI-CA 56 23 21 11 4 2 2
Lucara Diamond Corp. LUC-CA 56 27 23 7 4 1 3
Hudbay Minerals Inc HBM-CA 55 25 17 13 3 1 4
Winpak Ltd. WPK-CA 54 13 27 15 4 4 4
Ivanhoe Mines Ltd. Class A IVN-CA 54 13 25 16 3 1 3
Barrick Gold Corporation ABX-CA 53 23 17 13 4 2 4
Stella-Jones Inc. SJ-CA 52 14 24 14 2 1 2
Osisko Gold Royalties Ltd OR-CA 52 20 23 9 4 1 1
Franco-Nevada Corporation FNV-CA 51 13 23 15 3 2 1
Detour Gold Corporation DGC-CA 48 25 17 7 1 4 1
MAG Silver Corp. MAG-CA 48 11 17 20 1 2 3
New Gold Inc. NGD-CA 47 23 19 5 4 1 4
Cascades Inc. CAS-CA 46 21 15 10 3 4 2
First Majestic Silver Corp. FR-CA 46 12 16 18 1 2 3
Eldorado Gold Corporation ELD-CA 45 19 17 9 4 1 3
Novagold Resources Inc NG-CA 43 11 8 23 1 3 4
Chemtrade Logistics Income Fund CHE.UT-CA 41 14 17 10 4 1 2
Labrador Iron Ore Royalty Corporation LIF-CA 0 0 0 0 2 1 2
Agnico Eagle Mines Limited AEM-CA 0 0 0 0 1 h 2
Company Name Ticker
MomentumQuest Quant Scores
TSX Turning PointMacro Update
6 June 2018 14

15
S&P TSX: Real Estate
Source: Canaccord Genuity Research, Canaccord Genuity Quest®
triAngle (/100) Value (/33) Quality (/33) Momentum (/33) Quadrant (Monthly) Quadrant (Weekly) Quadrant (Daily)
Tricon Capital Group Inc. TCN-CA 77 27 30 21 3 2 3
Colliers International Group Inc. CIGI-CA 63 12 22 29 2 3 3
FirstService Corp FSV-CA 61 13 25 23 3 3 2
Altus Group Limited AIF-CA 43 13 19 11 3 1 2
SmartCentres Real Estate Investment Trust SRU.UT-CA 0 0 0 0 1 1 2
Killam Apartment Real Estate Investment Trust KMP.UT-CA 0 0 0 0 2 2 3
First Capital Realty Inc. FCR-CA 0 0 0 0 1 2 3
Crombie Real Estate Investment Trust CRR.UT-CA 0 0 0 0 4 1 2
RioCan Real Estate Investment Trust REI.UT-CA 0 0 0 0 1 1 2
Cominar Real Estate Investment Trust CUF.UT-CA 0 0 0 0 4 1 1
Canadian Apartment Properties Real Estate Investment Trust CAR.UT-CA 0 0 0 0 2 2 3
Artis Real Estate Investment Trust AX.UT-CA 0 0 0 0 3 1 4
Dream Office Real Estate Investment Trust Class A D.UT-CA 0 0 0 0 2 2 3
Allied Properties Real Estate Investment Trust AP.UT-CA 0 0 0 0 2 2 2
H&R Real Estate Investment Trust Stapled Units Cons of 1 H&R
REIT Ut + 1 H&R Finance Trust Ut HR.UT-CA 0 0 0 0 4 2 1
Brookfield Property Partners LP BPY.UT-CA 0 0 0 0 4 1 2
Boardwalk REIT BEI.UT-CA 0 0 0 0 1 2 2
Northview Apartment Real Estate Investment Trust NVU.UT-CA 0 0 0 0 2 2 3
Granite Real Estate Investment Trust Stapled Units - 1 Granite
RE Inc + 1 TU Granite REIT GRT.UT-CA 0 0 0 0 3 2 2
Choice Properties Real Estate Investment Trust CHP.UT-CA 0 0 0 0 4 1 2
Dream Global Real Estate Investment Trust DRG.UT-CA 0 0 0 0 2 3 3
M-Score Data Updated: June 06, 2018
Each column's colour scale is independent of other columns
Company Name Ticker
MomentumQuest Quant Scores
TSX Turning PointMacro Update
6 June 2018 15

16
S&P TSX: Telecom
Source: Canaccord Genuity Research, Canaccord Genuity Quest®
triAngle (/100) Value (/33) Quality (/33) Momentum (/33) Quadrant (Monthly) Quadrant (Weekly) Quadrant (Daily)
TELUS Corporation T-CA 51 15 17 19 3 1 2
BCE Inc. BCE-CA 49 17 17 14 4 1 3
Rogers Communications Inc. Class B RCI.B-CA 49 15 17 17 3 2 4
M-Score Data Updated: June 06, 2018
Each column's colour scale is independent of other columns
Company Name Ticker
MomentumQuest Quant Scores
TSX Turning PointMacro Update
6 June 2018 16

17
S&P TSX: Utilities
Source: Canaccord Genuity Research, Canaccord Genuity Quest®
triAngle (/100) Value (/33) Quality (/33) Momentum (/33) Quadrant (Monthly) Quadrant (Weekly) Quadrant (Daily)
TransAlta Renewables, Inc. RNW-CA 63 23 23 17 4 2 2
Northland Power Inc. NPI-CA 59 17 19 23 1 2 3
Capital Power Corporation CPX-CA 56 19 17 20 3 2 2
TransAlta Corporation TA-CA 55 26 16 13 4 4 4
Superior Plus Corp SPB-CA 53 18 16 19 2 3 4
Brookfield Renewable Partners LP BEP.UT-CA 52 21 17 13 3 1 3
ATCO Ltd. Class I ACO.X-CA 51 21 19 10 4 1 2
Emera Inc EMA-CA 51 20 19 12 4 1 4
Algonquin Power & Utilities Corp. AQN-CA 51 16 20 15 3 1 2
Hydro One Ltd. H-CA 51 22 17 12 4 4 2
Brookfield Infrastructure Partners L.P. BIP.UT-CA 51 21 20 10 3 4 1
Boralex Inc. Class A BLX-CA 50 19 17 14 3 4 1
Fortis Inc. FTS-CA 49 19 19 12 3 4 4
Innergex Renewable Energy Inc. INE-CA 49 20 13 16 4 2 2
Canadian Util ities Limited Class A CU-CA 45 20 17 8 4 4 1
Company Name TickerQuest Quant Scores Momentum
M-Score Data Updated: June 06, 2018
Each column's colour scale is independent of other columns
TSX Turning PointMacro Update
6 June 2018 17

18
Technical - TSX Turning Point Methodology
Our process involves bucketing financial instruments (typically stocks) into four categories based on their first derivative of price (momentum).
We utilize a smoothed momentum oscillator similar to Gerald Appel’s Moving Average Convergence Divergence (MACD).
The categories are ranked based on order of attractiveness from a technical perspective.
The technical analysis discipline looks to:
Add exposure to stocks that are Accelerating (Category 2) and Pulling Back (Category 3)
Reduce exposure to stocks that are Improving (Category 1) and Deteriorating (Category 4)
Category Explanation (ranked in order of attractiveness)
Beginner/Intermediate Explanation
Accelerating - Upside momentum is increasing, and the trend is up.
Pulling Back – Downside momentum is increasing; however, the trend is up.
Improving - Upside momentum is increasing; however, the trend is down.
Deteriorating - Downside momentum is increasing, and the trend is down.
Expert Explanation
Accelerating - The first derivative of price is accelerating (upside momentum is increasing) and remains above the zero axis, indicating that price momentum is trending
higher (the trend is up).
Pulling Back - The first derivative of price is decelerating (downside momentum is increasing), however, it remains above the zero axis, indicating that price momentum is
trending higher (the trend is up).
Improving - The first derivative of price is accelerating (upside momentum is increasing), however, it is below the zero axis, indicating that price momentum is trending lower
(the trend is down).
Deteriorating - The first derivative of price is decelerating (downside momentum is increasing), and it is below the zero axis, indicating that price momentum is trending
lower (the trend is down).
TSX Turning PointMacro Update
6 June 2018 18

19
Technical - Momentum Diagram
Figure 1: Momentum Diagram
Source: Canaccord Genuity Research, Canaccord Genuity Quest®
Improving(Quadrant 1)
Deteriorating (Quadrant 4)
Pulling Back (Quadrant 3)
Accelerating(Quadrant 2)
TSX Turning PointMacro Update
6 June 2018 19

20
What is Quest® triAngle
The Quest® triAngle is designed to provide broad-based measures of Value, Quality and Momentum, each consisting of five factors outlined below. This broad approach adds
more consistency than reliance on one single measure, and also helps to address the issue that different factors work at different times.
Value combines Quest® CFROC valuation and Quest® market-to-book with more traditional measures of EV/sales, dividend yield and P/E.
Quality measures historic corporate performance through returns (CFROC spread), growth in invested capital, and free cash flow, together with forecast changes in CFROC, and
fixed charge cover as a measure of solvency.
Momentum evaluates share price trends through the 9-month relative trend, the 12-month relative range and the 100/200-day switch. Inflection points are seen on the short-
term 30/90-day switch, and changes in consensus earnings estimates also form part of the overall Momentum picture.
Figure 2: triAngle factors
Source: Canaccord Genuity Quest ®
We also use a mix of historic and forecast data. Too much history makes any system backward looking. But, too much reliance on forecast data, particularly far out into the
future, leaves any system prone to the problem that consensus forecasts are nearly always wrong. In our experience, using forecasts further out than 12 months can lead to
reduced performance.
Finally, we use absolute value data and also comparisons relative to history. Looking relative to a 10-year history helps address the problem that some stocks always look
‘cheap’. However, it’s also important to balance against absolute valuation.
Quest® triAngle Score
Value
Quest® valuation
Quest® market-to-book
EV/sales rel. to the long-run average
Dividend yield rel. to the long-run average
P/E rel. to the long-run average
Quality
CFROC spreads
Capital growth
Equilibrium growth
Fixed charge cover
Forecasted CFROC change
Momentum
9-month rel. price trend
100/200-day switch
12-month rel. range
30/90-day switch
Earnings momentum
TSX Turning PointMacro Update
6 June 2018 20

21
How the Quest® triAngle score is calculated
For each of the 15 triAngle measures, the universe of companies is ranked in order from top to bottom and divided into deciles. 10/10 is a positive signal (good or cheap), while
1/10 is negative. The decile scores of the five measures for each factor (Value, Quality and Momentum) are then added together and divided by 1.5, giving a maximum score of
33. The scores from the Value, Quality and Momentum are aggregated to give the total Quest® triAngle score. This has a maximum value of 100. The triAngle score is then
ranked by decile, once again with 10 being positive and 1 being negative.
Figure 3: How the triAngle score is calculated
Source: Canaccord Genuity Quest ®
TSX Turning PointMacro Update
6 June 2018 21

22
Quest® triAngle Definitions
Figure 4: Quest® Triangle Definitions
The Quest® triAngle analyses companies on three factors: Value, Quality and Momentum. For each factor, five measures are analyzed. On each measure stocks are compared with all other stocks in the universe,
ranked in order, then divided into deciles.
Value
The rankings for Quest® valuation and Quest® mkt-to-book are based on the absolute valuation. For the other three Value factors, rankings are based on valuations against long-run averages.
1. Quest® valuation The Quest® value per share, shown as a percentage upside or downside from the current share price. An absolute measure of whether the shares are
cheap.
2. Quest® market-to-book The total capitalization of the company (market cap plus gross debt plus capitalized leases) divided by the estimated replacement cost of the firm’s
assets (excluding goodwill). The definition used in triAngle changed in Q1 2004. The previous definition measured valuation relative to history and
included goodwill in the denominator. In 2015 intangibles were added to the asset base calculation.
3. EV/ sales rel. LRA Market cap plus net debt divided by sales. Companies with high revenue growth and high growth prospects often trade at high EV/Sales multiples.
4. Dividend yield rel. LRA Dividend per share divided by the share price. Stocks with higher yields are awarded a higher rank through this system.
5. Price earnings ratio (P/E) rel. LRA Still the most commonly quoted valuation measure. Earnings are calculated pre-goodwill amortization and pre-exceptional items.
Quality
1. CFROC spread – five-year average The five-year average of the spread between the Quest® CFROC (Cash Flow Return on Capital) and the weighted average cost of capital. Typically,
companies with a positive CFROC spread are of higher quality.
2. Real capital growth – three-year average The average growth in the total capital base over the last three years. High growth companies are ranked above low growth companies although growth
is only value creating when incremental capital earns a positive CFROC® spread.
3. Equilibrium growth – three-year average Equilibrium growth is the ability to sustain growth in the invested capital base from internally generated free cash flow. Free cash flow is defined as gross
cash flow less interest, tax, dividends & maintenance capex.
4. Fixed charge cover FY1 EBIT before operating lease payments divided by all fixed charges - interest, preference dividends & lease payments. A measure of solvency. Definition
changed in Q1 2004. Previous factor measures earnings growth (EPS growth - FY1).
5. CFROC change FY1 The percentage change in the CFROC from the last historic year to the first forecast year. An indication of the forecast growth of the company.
Momentum
1. 9-month relative trend Measures the direction of the 9m moving average of the relative. A useful summary of the balance of institutional sentiment.
2. 100/ 200-day switch Measures where the 100-day moving average of the share price relative is compared with the 200-day moving average.
3. 12-month relative range Measures where a stock is within the relative trading range of the past 12m. Outperformers will tend to remain in the top half of that range.
4. 30/ 90-day switch A shorter term dynamic version of the 100/200-day switch. Helps to identify short-term swings within the long-term trend and acts as an early warning
signal of a turning point. Definition changed in Q1 2004. Previous definition was volume/move indicator.
5. EPS momentum – 3-month Change in consensus earnings per share estimates in the past three months. Earnings momentum is a useful indicator of short-term share price
performance since it indicates those companies that are performing above market expectations.
TSX Turning PointMacro Update
6 June 2018 22

23
Notes on Quest®
Quest® Methodology
Quest® is an analytical tool that involves use of a set of proprietary quantitative algorithms and value calculations to derive a number of corporate performance and valuation
metrics, including assigning a Default Quest® value per share and generating a triAngle Score, which is a relative ranking based on a number of operational and valuation
metrics. These algorithms and value calculations are consistently applied to all the companies included in the Quest® database. Third-party data (including consensus earnings
estimates) are systematically translated into a number of default variables and incorporated into the algorithms. The source financial statement, pricing, and earnings data
provided by outside data vendors are subject to quality control and may also be adjusted to more closely measure the underlying economics of firm performance. These
adjustments provide consistency when analyzing a single company across time, or analyzing multiple companies across industries or national borders. As the third-party data
are updated, the triAngle Score generated by Quest®, and the Default Quest® value per share may change. The default variables may also be adjusted by the user to produce
alternative values, any of which could occur. Additional information about the Quest® methodology is available on request.
Canaccord Genuity Quest® Disclosures
Quest® is at this stage registered in the UK and in the USA, and common law trademark rights are asserted in other jurisdictions.
Quest® is non-independent research and is a marketing communication under the Market Abuse Regulation and the FCA Conduct of Business rules.
All rights reserved. Quest®, CITN®, Companies in the News™, CFROC®, and triAngle™ are all trademarks of Canaccord Genuity Limited. E&OE. © Canaccord Genuity Limited.
For important information and company-specific Quest® disclosures please see Important Disclosures at the following website (provided as a hyperlink if this report is being
read electronically): https://disclosuresquest.canaccordgenuity.com/.
Please note that analyst data and Quest® data may differ due to different sources and calculation methods.
The Quest® platform may be found at the following website www.canaccordquest.com.
Accounts, Share Prices & Global Consensus Estimates data provided in conjunction
with S&P Capital IQ © 2017; Benchmark Sector comparatives are based on the Global
Industry Classification Standard (GICS®) and provided in conjunction with S&P Capital
IQ © 2017 (and its affiliates, as applicable). Share prices are relative to the relevant
regional benchmark MSCI Index.
TSX Turning PointMacro Update
6 June 2018 23

Appendix: Important DisclosuresTECHNICAL RESEARCHThis research is based upon technical and/or event-driven analysis. Technical analysis is the study of price and volume and theinterpretation of trading patterns associated with such studies in an attempt to project future price movements. Technical analysis solelyexamines the past trading history of a security to arrive at anticipated market fluctuations. The analyses contained in this research reportare based on numerous assumptions and predictions regarding future stock price movements. There can be no assurance that suchassumptions and predictions will ultimately prove accurate or correct. Adverse changes in stock price trends or patterns could impedeachievement of our technical price objectives.This report may contain a short-term trading idea or recommendation that highlights a specific near-term catalyst or event that isanticipated to have a short term effect on the equity securities of the subject company or companies. Short-term trading ideas andrecommendations are different from and do not affect a stock's fundamental equity rating, which reflects a longer-term total returnexpectation. Short-term trading ideas and recommendations may be more or less positive than a stock's fundamental equity rating.Recommendations based upon a technical analysis are primarily designed for the short-term trader and differ from fundamentalopinions, which are typically suited toward the long-term investor.This report does not constitute research regarding the fundamental financial information, operations, or business prospects of theunderlying subject company. Technical analysis is inherently uncertain, and does not consider any of the fundamentals of the underlyingsubject company and recipients should not rely on technical or event-driven analysis alone in making an investment decision, but shouldreview all publicly available information regarding the subject company or companies, including, but not limited to, the fundamentals ofthe underlying security or securities and other information provided in filings with the Securities Exchange Commission (SEC).This report may offer an investment view that is inconsistent with other research issued by Canaccord Genuity. Canaccord Genuity hasmultiple analysts, and their views may differ from time to time. Technical research on a subject company is issued at irregular intervalsdependent upon market conditions. With regard to technical research, a subject company is not “followed”, “covered” or “rated” byCanaccord Genuity, and there is no assurance or likelihood that additional technical research will follow previously issued technicalresearch.Technical analysis is inherently uncertain, and investors should not use technical analysis as the only resource in formulating aninvestment opinion.The following disclosures concerning Canaccord Genuity, the authoring analyst and/or the subject company are relevant to bothtechnical and fundamental research.
Analyst CertificationEach authoring analyst of Canaccord Genuity whose name appears on the front page of this research hereby certifies that (i) therecommendations and opinions expressed in this research accurately reflect the authoring analyst’s personal, independent andobjective views about any and all of the designated investments or relevant issuers discussed herein that are within such authoringanalyst’s coverage universe and (ii) no part of the authoring analyst’s compensation was, is, or will be, directly or indirectly, related to thespecific recommendations or views expressed by the authoring analyst in the research.Analysts employed outside the US are not registered as research analysts with FINRA. These analysts may not be associated persons ofCanaccord Genuity LLC and therefore may not be subject to the FINRA Rule 2241 and NYSE Rule 472 restrictions on communicationswith a subject company, public appearances and trading securities held by a research analyst account.Sector CoverageIndividuals identified as “Sector Coverage” cover a subject company’s industry in the identified jurisdiction, but are not authoringanalysts of the report.
Investment RecommendationDate and time of first dissemination: June 06, 2018, 22:28 ETDate and time of production: June 06, 2018, 22:28 ET
TSX Turning PointMacro Update
6 June 2018 24

Distribution of Ratings:Global Stock Ratings (as of 06/06/18)Rating Coverage Universe IB Clients
# % %Buy 574 61.52% 41.81%Hold 229 24.54% 24.89%Sell 22 2.36% 18.18%Speculative Buy 108 11.58% 64.81%
933* 100.0%*Total includes stocks that are Under Review
Canaccord Genuity Ratings SystemBUY: The stock is expected to generate risk-adjusted returns of over 10% during the next 12 months.
HOLD: The stock is expected to generate risk-adjusted returns of 0-10% during the next 12 months.
SELL: The stock is expected to generate negative risk-adjusted returns during the next 12 months.
NOT RATED: Canaccord Genuity does not provide research coverage of the relevant issuer.“Risk-adjusted return” refers to the expected return in relation to the amount of risk associated with the designated investment or therelevant issuer.Risk QualifierSPECULATIVE: Stocks bear significantly higher risk that typically cannot be valued by normal fundamental criteria. Investments in thestock may result in material loss.
12-Month Recommendation History (as of date same as the Global Stock Ratings table)A list of all the recommendations on any issuer under coverage that was disseminated during the preceding 12-month periodmay be obtained at the following website (provided as a hyperlink if this report is being read electronically) http://disclosures-mar.canaccordgenuity.com/EN/Pages/default.aspxPast performanceIn line with Article 44(4)(b), MiFID II Delegated Regulation, we disclose price performance for the preceding five years or the whole periodfor which the financial instrument has been offered or investment service provided where less than five years. Please note price historyrefers to actual past performance, and that past performance is not a reliable indicator of future price and/or performance.
Online DisclosuresUp-to-date disclosures may be obtained at the following website (provided as a hyperlink if this report is being read electronically)http://disclosures.canaccordgenuity.com/EN/Pages/default.aspx; or by sending a request to Canaccord Genuity Corp. Research, Attn:Disclosures, P.O. Box 10337 Pacific Centre, 2200-609 Granville Street, Vancouver, BC, Canada V7Y 1H2; or by sending a requestby email to [email protected]. The reader may also obtain a copy of Canaccord Genuity’s policies and proceduresregarding the dissemination of research by following the steps outlined above.General DisclaimersSee “Required Company-Specific Disclosures” above for any of the following disclosures required as to companies referred to in thisreport: manager or co-manager roles; 1% or other ownership; compensation for certain services; types of client relationships; researchanalyst conflicts; managed/co-managed public offerings in prior periods; directorships; market making in equity securities and relatedderivatives. For reports identified above as compendium reports, the foregoing required company-specific disclosures can be found ina hyperlink located in the section labeled, “Compendium Reports.” “Canaccord Genuity” is the business name used by certain whollyowned subsidiaries of Canaccord Genuity Group Inc., including Canaccord Genuity LLC, Canaccord Genuity Limited, Canaccord GenuityCorp., and Canaccord Genuity (Australia) Limited, an affiliated company that is 50%-owned by Canaccord Genuity Group Inc.The authoring analysts who are responsible for the preparation of this research are employed by Canaccord Genuity Corp. a Canadianbroker-dealer with principal offices located in Vancouver, Calgary, Toronto, Montreal, or Canaccord Genuity LLC, a US broker-dealerwith principal offices located in New York, Boston, San Francisco and Houston, or Canaccord Genuity Limited., a UK broker-dealer withprincipal offices located in London (UK) and Dublin (Ireland), or Canaccord Genuity (Australia) Limited, an Australian broker-dealer withprincipal offices located in Sydney and Melbourne.The authoring analysts who are responsible for the preparation of this research have received (or will receive) compensation based upon(among other factors) the Investment Banking revenues and general profits of Canaccord Genuity. However, such authoring analysts
TSX Turning PointMacro Update
6 June 2018 25

have not received, and will not receive, compensation that is directly based upon or linked to one or more specific Investment Bankingactivities, or to recommendations contained in the research.Some regulators require that a firm must establish, implement and make available a policy for managing conflicts of interest arising asa result of publication or distribution of research. This research has been prepared in accordance with Canaccord Genuity’s policy onmanaging conflicts of interest, and information barriers or firewalls have been used where appropriate. Canaccord Genuity’s policy isavailable upon request.The information contained in this research has been compiled by Canaccord Genuity from sources believed to be reliable, but (with theexception of the information about Canaccord Genuity) no representation or warranty, express or implied, is made by Canaccord Genuity,its affiliated companies or any other person as to its fairness, accuracy, completeness or correctness. Canaccord Genuity has notindependently verified the facts, assumptions, and estimates contained herein. All estimates, opinions and other information containedin this research constitute Canaccord Genuity’s judgement as of the date of this research, are subject to change without notice and areprovided in good faith but without legal responsibility or liability.From time to time, Canaccord Genuity salespeople, traders, and other professionals provide oral or written market commentary ortrading strategies to our clients and our principal trading desk that reflect opinions that are contrary to the opinions expressed in thisresearch. Canaccord Genuity’s affiliates, principal trading desk, and investing businesses also from time to time make investmentdecisions that are inconsistent with the recommendations or views expressed in this research.This research is provided for information purposes only and does not constitute an offer or solicitation to buy or sell any designatedinvestments discussed herein in any jurisdiction where such offer or solicitation would be prohibited. As a result, the designatedinvestments discussed in this research may not be eligible for sale in some jurisdictions. This research is not, and under nocircumstances should be construed as, a solicitation to act as a securities broker or dealer in any jurisdiction by any person or companythat is not legally permitted to carry on the business of a securities broker or dealer in that jurisdiction. This material is prepared forgeneral circulation to clients and does not have regard to the investment objectives, financial situation or particular needs of anyparticular person. Investors should obtain advice based on their own individual circumstances before making an investment decision.To the fullest extent permitted by law, none of Canaccord Genuity, its affiliated companies or any other person accepts any liabilitywhatsoever for any direct or consequential loss arising from or relating to any use of the information contained in this research.Research Distribution PolicyCanaccord Genuity research is posted on the Canaccord Genuity Research Portal and will be available simultaneously for access by allof Canaccord Genuity’s customers who are entitled to receive the firm's research. In addition research may be distributed by the firm’ssales and trading personnel via email, instant message or other electronic means. Customers entitled to receive research may alsoreceive it via third party vendors. Until such time as research is made available to Canaccord Genuity’s customers as described above,Authoring Analysts will not discuss the contents of their research with Sales and Trading or Investment Banking employees without priorcompliance consent.For further information about the proprietary model(s) associated with the covered issuer(s) in this research report, clients shouldcontact their local sales representative.Short-Term Trade IdeasResearch Analysts may, from time to time, discuss “short-term trade ideas” in research reports. A short-term trade idea offers a near-term view on how a security may trade, based on market and trading events or catalysts, and the resulting trading opportunity that maybe available. Any such trading strategies are distinct from and do not affect the analysts' fundamental equity rating for such stocks. Ashort-term trade idea may differ from the price targets and recommendations in our published research reports that reflect the researchanalyst's views of the longer-term (i.e. one-year or greater) prospects of the subject company, as a result of the differing time horizons,methodologies and/or other factors. It is possible, for example, that a subject company's common equity that is considered a long-term ‘Hold' or 'Sell' might present a short-term buying opportunity as a result of temporary selling pressure in the market or for otherreasons described in the research report; conversely, a subject company's stock rated a long-term 'Buy' or “Speculative Buy’ could beconsidered susceptible to a downward price correction, or other factors may exist that lead the research analyst to suggest a sale overthe short-term. Short-term trade ideas are not ratings, nor are they part of any ratings system, and the firm does not intend, and does notundertake any obligation, to maintain or update short-term trade ideas. Short-term trade ideas are not suitable for all investors and arenot tailored to individual investor circumstances and objectives, and investors should make their own independent decisions regardingany securities or strategies discussed herein. Please contact your salesperson for more information regarding Canaccord Genuity’sresearch.For Canadian Residents:This research has been approved by Canaccord Genuity Corp., which accepts sole responsibility for this research and its disseminationin Canada. Canaccord Genuity Corp. is registered and regulated by the Investment Industry Regulatory Organization of Canada (IIROC)and is a Member of the Canadian Investor Protection Fund. Canadian clients wishing to effect transactions in any designated investmentdiscussed should do so through a qualified salesperson of Canaccord Genuity Corp. in their particular province or territory.For United States Persons:
TSX Turning PointMacro Update
6 June 2018 26

Canaccord Genuity LLC, a US registered broker-dealer, accepts responsibility for this research and its dissemination in the United States.This research is intended for distribution in the United States only to certain US institutional investors. US clients wishing to effecttransactions in any designated investment discussed should do so through a qualified salesperson of Canaccord Genuity LLC. Analystsemployed outside the US, as specifically indicated elsewhere in this report, are not registered as research analysts with FINRA. Theseanalysts may not be associated persons of Canaccord Genuity LLC and therefore may not be subject to the FINRA Rule 2241 and NYSERule 472 restrictions on communications with a subject company, public appearances and trading securities held by a research analystaccount.For United Kingdom and European Residents:This research is distributed in the United Kingdom and elsewhere Europe, as third party research by Canaccord Genuity Limited,which is authorized and regulated by the Financial Conduct Authority. This research is for distribution only to persons who are EligibleCounterparties or Professional Clients only and is exempt from the general restrictions in section 21 of the Financial Services andMarkets Act 2000 on the communication of invitations or inducements to engage in investment activity on the grounds that it is beingdistributed in the United Kingdom only to persons of a kind described in Article 19(5) (Investment Professionals) and 49(2) (High NetWorth companies, unincorporated associations etc) of the Financial Services and Markets Act 2000 (Financial Promotion) Order 2005(as amended). It is not intended to be distributed or passed on, directly or indirectly, to any other class of persons. This material is not fordistribution in the United Kingdom or elsewhere in Europe to retail clients, as defined under the rules of the Financial Conduct Authority.For Jersey, Guernsey and Isle of Man Residents:This research is sent to you by Canaccord Genuity Wealth (International) Limited (CGWI) for information purposes and is not to beconstrued as a solicitation or an offer to purchase or sell investments or related financial instruments. This research has been producedby an affiliate of CGWI for circulation to its institutional clients and also CGWI. Its contents have been approved by CGWI and we areproviding it to you on the basis that we believe it to be of interest to you. This statement should be read in conjunction with your clientagreement, CGWI's current terms of business and the other disclosures and disclaimers contained within this research. If you are in anydoubt, you should consult your financial adviser.CGWI is licensed and regulated by the Guernsey Financial Services Commission, the Jersey Financial Services Commission and the Isleof Man Financial Supervision Commission. CGWI is registered in Guernsey and is a wholly owned subsidiary of Canaccord Genuity GroupInc.For Australian Residents:This research is distributed in Australia by Canaccord Genuity (Australia) Limited ABN 19 075 071 466 holder of AFS Licence No234666. To the extent that this research contains any advice, this is limited to general advice only. Recipients should take into accounttheir own personal circumstances before making an investment decision. Clients wishing to effect any transactions in any financialproducts discussed in the research should do so through a qualified representative of Canaccord Genuity (Australia) Limited. CanaccordGenuity Wealth Management is a division of Canaccord Genuity (Australia) Limited.For Hong Kong Residents:This research is distributed in Hong Kong by Canaccord Genuity (Hong Kong) Limited which is licensed by the Securities and FuturesCommission. This research is only intended for persons who fall within the definition of professional investor as defined in the Securitiesand Futures Ordinance. It is not intended to be distributed or passed on, directly or indirectly, to any other class of persons. Recipients ofthis report can contact Canaccord Genuity (Hong Kong) Limited. (Contact Tel: +852 3919 2561) in respect of any matters arising from, orin connection with, this research.Additional information is available on request.Copyright © Canaccord Genuity Corp. 2018 – Member IIROC/Canadian Investor Protection Fund
Copyright © Canaccord Genuity Limited. 2018 – Member LSE, authorized and regulated by the Financial Conduct Authority.
Copyright © Canaccord Genuity LLC 2018 – Member FINRA/SIPC
Copyright © Canaccord Genuity (Australia) Limited. 2018 – Participant of ASX Group, Chi-x Australia and of the NSX. Authorized andregulated by ASIC.
All rights reserved. All material presented in this document, unless specifically indicated otherwise, is under copyright to CanaccordGenuity Corp., Canaccord Genuity Limited, Canaccord Genuity LLC or Canaccord Genuity Group Inc. None of the material, nor itscontent, nor any copy of it, may be altered in any way, or transmitted to or distributed to any other party, without the prior express writtenpermission of the entities listed above.None of the material, nor its content, nor any copy of it, may be altered in any way, reproduced, or distributed to any other partyincluding by way of any form of social media, without the prior express written permission of the entities listed above.
TSX Turning PointMacro Update
6 June 2018 27