Embed Size (px)
Citation preview

Tsunami science before and beyondBoxing Day 2004
BY COSTAS E. SYNOLAKIS1,2,* AND EDDIE N. BERNARD
3
1Coastal Engineering and Natural Hazards Laboratory,Technical University of Crete, Chanea 73100, Greece
2Viterbi School of Engineering, University of Southern California,Los Angeles, CA 90089-2531, USA
3Pacific Marine Environmental Laboratory, NOAA,Seattle, WA 98115-6349, USA
Tsunami science has evolved differently from research on other extreme natural hazards,primarily because of the unavailability until recently of instrumental recordings of tsunamisin the open ocean. Here, the progress towards developing tsunami inundation modellingtools for use in inundation forecasting is discussed historically from the perspective ofhydrodynamics. The state-of-knowledge before the 26 December 2004 tsunami is described.Remaining aspects for future research are identified. One, validated inundation models needto be further developed through benchmark testing and instrumental tsunametermeasurements and standards for operational codes need to be established. Two, amethodology is needed to better quantify short-duration impact forces on structures. Three,the mapping of vulnerable continental margins to identify unrecognized hazards mustproceed expeditiously, along with palaeotsunami research to establish repeat intervals.Four, the development of better coupling between deforming seafloor motions and modelinitialization needs further refinement. Five, in an era of global citizenship, morecomprehensive educational efforts on tsunami hazard mitigation are necessary worldwide.
Keywords: tsunamis; tsunameter; tsunami forecasting; hydrodynamics; run-up;inundation
On
*A
1. Introduction
The evaluation of the terminal effects of natural hazards remains one of the holygrails of geophysical research. Uncertainties arise in the specification of the initialcondition, the calculation of the evolution of the geophysical process and finallyassessing the repeat interval of the phenomenon. By some measures, tsunamis aremore extreme hazards than earthquakes, hurricanes and tornadoes. They occurless frequently, and, except possibly in Japan, historic records are unsystematic.Smaller tsunamis have highly localized impact, and tsunamis in the past centuriesprobably were under-reported and unrecognized, as the recent once-a-year, onaverage, worldwide incidence suggests. While in earthquake and atmospheric
Phil. Trans. R. Soc. A (2006) 364, 2231–2265
doi:10.1098/rsta.2006.1824
Published online 30 June 2006
e contribution of 20 to a Discussion Meeting Issue ‘Extreme natural hazards’.
uthor for correspondence ([email protected]).
2231 q 2006 The Royal Society

C. E. Synolakis and E. N. Bernard2232
sciences, inferring gross estimates of the repeat period preceded any understandingof the basic physical phenomena, the evolution of tsunami hydrodynamics is anexample of extreme natural hazard research where progress in developingmodelling tools preceded developments in probabilistic hazard assessment.
The reason has been the lack of tsunami measurements in the open ocean, onlyaccomplished in the later 1990s, by the National Oceanic and AtmosphericAdministration’s (NOAA) tsunameters, discussed by Bernard et al. (2006).Without instrumental recordings, there has been no widely applicable tsunamimagnitude scale, but only qualitative intensity scales, e.g. the six pointSieberg–Ambraseys. Tsunami science has evolved through a combination ofnear hits and near misses and worse. While the basic governing equations havebeen known for over 150 years, without instrumental recordings of tsunamisignatures, even the appropriate idealized initial conditions for modelinitialization were not well understood. Until very recently, the only availablerecordings were from tide gages, which are known to only represent arrival timesand possibly the character of the first wave reliably. Tide gauges are located insheltered regions inside harbours; once the basin is forced, they just record thebasin excitation, not the offshore tsunami waveform. Tsunameters are free-fieldinstruments, generally less dependent on location response.
The grand synthesis had to await the development of sophisticated modellingtools, high-resolution laboratory experiments in the 1980s and the field surveyresults of the 1990s, which served as crude proxies to free-field recordings andallowed for validation of the numerical models. Tsunami forecasting was onlymade possible through the availability of instrumental tsunameter recordings,which also allowed for closure, e.g. Titov et al. (2005a,b). Starting with hindsight,the process would have been entirely different, but as is most often the case inscience, incremental Brownian-moving advances in the entire web of knowledgeare eventually integrated. This was largely the case just before the horrificcatastrophe of 26 December 2004, whose only silver lining has been the impetusto pursue the asymptotic limit even more vigorously.
Tsunamis are long waves of small steepness generated by impulsive geophysicalevents of the seafloor and of the coastline, such as earthquakes, submarine andaerial mass failures, volcanic eruptions and asteroid impacts. Tsunamis undergosubstantial deformations as they propagate over bathymetry or when evolvingover the continental shelf. The determination of the inundation and run-up oftsunamis and forces on coastal structures is one of the quintessential problems intsunami hazard mitigation. Operational and mitigation issues as well as severalrelevant tsunami statistics are discussed by Bernard et al. (2006). For a detailedsummary of field observation of the 2004 megatsunami refer to Synolakis (2006).Here we will present a short history of the evolution of tsunami hydrodynamics anddraw some conclusions on lessons learned and unlearned, and then identify theremaining challenges. We will not comment on complementary harbour excitationfrom tsunamis; for this, refer to Raichlen (1966) or Synolakis (2002).
2. A short history of tsunami hydrodynamics before 1980
The study of the propagation, run-up and inundation of tsunamis mirrors to acertain extent the evolution of coastal engineering and in some cases has driven
Phil. Trans. R. Soc. A (2006)

2233Tsunami science before and beyond Boxing Day
it. Early efforts were restricted to one propagation direction, with subsequentattempts directed toward solving the more physically relevant two-dimensionalproblems. Interestingly, but perhaps not entirely surprisingly, given thedifferences in cultures between applied mathematicians and hydraulic engineers,the laboratory studies proceeded independently from advances in analyticalsolutions, and both almost entirely separately from geophysics. The initial modelfor tsunamis evolved from a bore to a solitary wave, a single wave with theparticular property that it does not change its shape when propagating overconstant depth. Without any direct measurements of tsunamis in the open sea,there was little realization as to the character or the scale of tsunamis, with fewattempts to couple the seafloor motion with the generated wave.
Despite the tsunami catastrophes following the 1946 Aleutian tsunami locallyat Scotch Cap, Unimak, Alaska, and at Hilo, Hawaii, and the inundation ofPetrapavlosk following the 1952 Kamchatkan tsunami, studies of impulsivelygenerated waves had focused on explosion-triggered water waves, and manyremained classified for decades. Numerical studies were non-existent. Laboratoryand analytical studies of long waves in the 1950s contained only cursoryreferences to tsunamis. Yet, they did set the foundations for the development ofthe basic numerical modelling tools.
As a preamble, and to introduce the nomenclature, the equations that governthe motion of tsunamis, as all incompressible fluids, are the Navier–Stokes (NS)equations. These three equations reflect Newton’s conservation of momentum, inthree directions, and they equate the density times the material acceleration ofan infinitesimal fluid particle to the gradients of pressure and viscous stresses,and external body force fields. Along with the equation of conservation of mass,they form four coupled nonlinear equations for the three velocity componentsand pressure. They are notoriously difficult to solve for free-surface geophysicalflows, and approximations are introduced depending on the particular scale ofthe problem considered. When calculating the evolution of tectonic tsunamis, themost common approximation is the elimination of viscous stresses and of anyflow gradients in the vertical direction, given that tsunamis are long waves.
Then, the NS equations are averaged over the flow depth, from the seafloor tothe free surface, and the pressure is eliminated directly as a dependent variableand the wave amplitude h introduced through the hydrostatic approximation forthe pressure pZrg(total depth)Zrg(hCh). In the lowest order of approximation,over a flat seafloor, the three resulting equations reduce to one, V2hZcK2v2h=vt2,the classic wave equation, with cZ
ffiffiffiffiffigh
pthe wave celerity. When the seafloor
varies, as is always the case, the resulting equation is known as the linear shallowwater wave (LSW) equation. In the next level of approximation, nonlinear termsare kept, and the resulting equations are known as the nonlinear shallow waterwave (NSW) equations. In the next level, dispersive terms are kept, and theresulting equations are known as the Boussinesq equations. When the viscousstresses are eliminated from the NS equations, the resulting forms are known asthe Euler equations and sometimes as potential flow models. Depth-averagedmodels that study evolution in one propagation direction are referred to as 1C1,and similarly 2C1 models refer to two-directional evolution. For a comprehen-sive exposition of the orders of approximation through a perturbation expansion,refer to Peregrine (1967).
Phil. Trans. R. Soc. A (2006)

d
H
bL
t*=0 t*=t*
initial shorelineposition x*=0
x*
y*R
max
1x*=X* 0x*=X*
Figure 1. A definition sketch for long waves climbing a sloping beach.
C. E. Synolakis and E. N. Bernard2234
The first study of a single long wave approaching a sloping beach appears to bethat of Hall & Watts (1953). They were the first to employ what is now known asthe 1C1 canonical problem of one-dimensional long-wave theory, i.e. long wavesgenerated over a constant depth region, evolving over constant depth, and thenclimbing a sloping beach, as shown in figure 1. The analogy is of waves propagatingover a flat ocean and then climbing up a uniformly sloping continental shelf. Thewater waves they generated empirically in the laboratory resembled the classicshape of solitary waves, as described by Russel (1845). Using dimensional analysis,they normalized the offshore height H of the wave with the offshore depth d andrelated the normalized run-up to the run-up R normalized by the depth d. Theyconcluded thatR=dZaðbÞðH=dÞf ðbÞ, wherea(b) and f (b) were empirical coefficientsdependent on the beach slope. They did not distinguish between breaking and non-breaking waves, thus haunting investigators up to three decades later.
Wiegel (1955) investigated landslide generated waves in the laboratory. Hemodelled landslides using a wedge-shaped box sliding down a plane beach, thusestablishing the standard model of a moving block still used in many landslidewave studies, but only measured the waves propagating offshore. He concludedthat only about 1% of the energy in the landslide motion is ‘converted’ to energyin the generated waves.
While researching hodograph type transformations in gas dynamics, Carrier &Greenspan (1958) derived a seminal 1C1 nonlinear transformation (CCG, forshort) that transformed the two NSW equations into a single linear Bessel-typeequation solvable with standard methods. The transformation involved changingthe physical variables x, t into the set s, l, with the peculiarity that, in the s, lspace, the evolving shoreline in (x, t) remains fixed at sZ0. Their results were formonochromatic waves approaching from infinity. Carrier & Greenspan (1958)did not back calculate the run-up in terms of the physical variables (x, t), andtheir work remained largely unrecognized and unused outside appliedmathematics for decades.
Fortuitously, in the same year, Whitham (1958), while working on shock wavepropagation through non-uniform flow regions, suggested a method tocircumvent the difficulty of evaluating differential relationships at a disconti-nuity. He applied the differential relationships to be satisfied by the flowvariables on the shock wave, immediately behind it, a practice known inhydrodynamics as the Whitham bore rule. Whitham (1958) then derivedapproximate formulae of the variation in height and the strength of the bore, arelationship later re-affirmed numerically. Shen & Meyer (1963), extendingearlier results, were able to calculate an approximate bore path after the bore
Phil. Trans. R. Soc. A (2006)

2235Tsunami science before and beyond Boxing Day
collapsed. While not recognized by the time, the bore rule proved useful in thedevelopment of inundation algorithms.
Using the LSW equations, Keller & Keller (1964) first derived a Bessel-typeequation for monochromatic wave 1C1 evolution over a sloping beach, whichpeculiarly was the same as the one derived through the GCC transformation forthe NSW equations. They then matched this inner solution to an outer solutionof periodic waves over constant depth at the transition point, i.e. the toe of thebeach, and derived an amplification factor for monochromatic waves.
By the time the Great Chilean tsunami of 1960—triggered by the largestearthquake ever instrumentally measured—struck the Chilean coastline,inundated Hilo, Hawaii, once again, and then struck Japan, little progress beyondcalculating estimated arrival times had been accomplished. In the study of theAmorgos, Greece tsunami of 1956, Ambraseys (1960) had demonstrated howsimple linear wave theory can be used to derive isochrones, lines of equal traveltime from the source. A similar analysis was probably used to estimate arrivaltimes in Hilo in 1960, and there was a warning. Yet, casualties were not avoided, asthe first wave was not the largest, triggering a false sense of security, quitereminiscent of what was observed during the 26 December 2004 megatsunami.Most contemporaneous tsunami observations from 1960 were interpreted astsunamis resembling turbulent bores, fluid structures notorious for the difficulty incalculating their evolution, thus further discouraging any quantitative analysis.
One fundamental observation linking the source with inundation, and neverpublished as such, was George Plafker’s. While surveying the aftermath of the1964 Great Alaskan tsunami, he proposed that the maximum run-up locally doesnot exceed twice the height of deformed seafloor offshore. This is now referred toas the Plafker rule, and has largely withstood the test of time, remainingunrecognized for three decades (Synolakis & Okal 2005).
Otherwise during the 1960s, tsunami studies focused on refining earlier results.Raichlen (1966) described the problem of harbour resonance for a rectangulargeometry and synthesized earlier results within a systematic framework, stillused today. In resonance problems, it is the period of the incoming tsunami thatis of primary interest, hence progress was possible without precise offshorerecordings, or shoreline computations. Tide gauge recordings existed allowingimprovement of harbour models much more rapidly than inundation models.Camfield & Street (1966) undertook more comprehensive studies of the evolutionof solitary-like waves in the laboratory. Carrier (1966) matched an inner solutionusing the CCG formulation of the NSW equations to an outer solution at thetransition point of the canonical problem. While Carrier boldly attempted tocalculate the run-up of a fairly arbitrary disturbance coming from offshore, hisanalysis did not include reflection. The work did not receive attention until twodecades later, as the inversion from the transformed space appeared formidable.
The main advance in tsunami hydrodynamics in the 1960s came with the workof Peregrine (1966) who was able to calculate the evolution of a 1C1 undularbore over constant depth. Peregrine defined for the first time a bore as atransition between two different uniform flows of water, and wrote ‘in its mostcommon form, a bore is a turbulent, breaking zone of water whose length is a fewtimes the depth’. Continuing, Peregrine (1967) derived the different approxi-mations of depth-averaged equations, as widely used today, thus systematicallyestablishing the basic mathematical theory of tsunamis.
Phil. Trans. R. Soc. A (2006)
C. E. Synolakis and E. N. Bernard2236
By the end of the 1960s, the analytical results remained disjointed to thelaboratory experiments on periodic waves. There was still little realization ofwhat tsunamis resembled, beyond that they were long water waves. In the 1970s,there were several substantial advances, including attempts to link the seafloormotion to tsunami evolution.
The worldwide hazard posed by near-field earthquakes in many coastal zoneswas not fully appreciated until the 1990s, and the paradigm was atranscontinental tsunami striking Japan, Hawaii or the west coast of the US.Most studies in this decade focused on the waves propagating far field away fromthe source, without really examining the near-field evolution. Ben-Menahem &Rosenman (1972) used linear theory to calculate the two-directional radiationpattern from a moving source. They were able to demonstrate, that given thatthe velocity of fault rupture was more than 10 times greater than the speed ofpropagation of tsunamis even in deep water, tsunami energy was shown toradiate primarily at right angles to a rupturing fault. They derived elegantresults showing the dependence of the directivity on the seafloor rupture andwave celerity, and proceeded to explain the path followed by the 1964 GreatChilean tsunami. One example of such calculations is shown in figure 2, wheresimply on the basis of directivity, it was possible to quickly eliminate a shortersource for the Boxing Day tsunami proposed in its immediate aftermath.
Another kind of coupling of the seafloor with the free surface was investigatedin 1C1 propagation by Tuck & Hwang (1972). They derived a solution to aforced wave equation for a deforming sloping beach, and suggested that itrepresented a fault rupture on a continental shelf. No inundation results wereshown as their attention was focused on the waves propagating offshore, as theirinitial condition was an exponential decaying from the shoreline seaward. Whilethe Ben-Menahem & Rosenman (1972) study has been widely used in seismology,as it allowed for a quick but crude evaluation of the tsunami path, the latterstudy was not rediscovered until the 1990s.
Up until the late 1960s, waves were generated in the laboratory using ahorizontally moving vertical paddle. In a landmark study, Hammack (1972) useda novel generation method in the 30 m long, 76 cm wide wave tank at Caltech.One end of the channel had a short section that could be impulsively raised ordown-dropped, to model the seafloor motion that triggers tsunamis. Hammackmeasured very precisely the evolution of the resulting waveforms over constantdepth. He used the laboratory measurements to validate Peregrine’s (1966)solution method for the nonlinear and dispersive Korteweg–de Vries equation,one form of the depth-averaged equation of motion. Hammack then related theinitial wave to the wave motion at large distances, by using the inverse-scattering (INS) algorithm. The INS methodology developed by Gardner et al.(1967) for solving certain nonlinear equations with soliton solutions, predictedthat fairly arbitrary initial conditions would generate a sequence of solitarywaves at infinity, also allowing for the calculation of the leading soliton height.
Once it was clear, or so it seemed, that arbitrary disturbances wouldeventually fission into series of solitary waves, it was not necessary to fullyunderstand the initial condition. If far enough away, the source details wereirrelevant. The focus shifted to evaluating the transformation of solitary waves asthey propagate over the continental shelf. This was accomplished by Goring(1978) who not only developed an algorithm for driving a laboratory wavemaker
Phil. Trans. R. Soc. A (2006)

70°30°
25°
20°
15°
10°
5°
0°
–5°
–10°
–15°70° 75° 80° 85° 90° 95° 100° 105° 110°
75° 80° 85° 90° 95° 100° 105° 110°
Figure 2. Preliminary qualitative assessment of the radiation field from Boxing Day tsunami byE. A. Okal (2005, personal communication) to rapidly identify the far-field impact of short versuslong earthquake sources. The short source with dramatically different directivity was proposed bysome in the immediate aftermath of the megatsunami. As observed, its radiated waves did notimpact India or Sri Lanka, hence it was soon abandoned in favour of the larger sources, laterconfirmed by Stein & Okal (2005) and discussed in detail by Sieh (2005).
2237Tsunami science before and beyond Boxing Day
to generate precise solitary waves, but also developed a finite-element solution tothe 1C1 Boussinesq equations and validated it with the laboratory data, thusconfirming earlier theoretical predictions by Madsen & Mei (1969), suggestive ofsoliton fission at transitions in depth.
At about the same time, Houston & Garcia (1974a,b) in an attempt todevelop flooding maps for the Federal Emergency Management Agency (FEMA)calculated the 2C1 deep-ocean propagation of tsunamis from Chile and Alaskaevolving towards the west coast of the United States. They used a hybridmethod and first solved a linear form of the spherical long-wave equations topropagate the tsunami from the source to the edge of the continental shelf, usinga finite-difference model; at the continental shelf, they matched the outeramplitudes to an ‘equivalent’ sinusoid and determined a simple amplification todetermine wave heights. Houston (1978) further refined the method to hindcastthe tsunami response of the Hawaiian Islands, using steady-state models.Bernard & Vestano (1977) had earlier determined the transient excitation ofthe islands.
Phil. Trans. R. Soc. A (2006)

C. E. Synolakis and E. N. Bernard2238
The Houston & Garcia work was groundbreaking, also because Houston &Garcia attempted to use more geophysically realistic initial conditions. Theyargued that the only reliable data for defining source characteristics at that timewere from the 1964 Alaskan and the 1960 Chilean earthquakes. Based on thesedata, they approximated the initial ground deformation by a 1000 km longhypothetical uplift mass of ellipsoidal shape, with a 10 m maximum verticaluplift. They then divided the Aleutian trench into 12 segments and calculatedthe wave evolution from each segment, and repeated the procedure for tsunamisfrom the Peru–Chile trench, convolved their results with tidal cycles and thusdeveloped the first ever probabilistic tsunami hazard analysis. While theirpredictions for the offshore wave height were repeatedly interpreted as run-up,and were later shown to differ with detailed run-up computations, in some cases,by a factor of two (e.g. Synolakis et al. 1997a,b), the scope of the work waspioneering.
Hibberd & Peregrine (1979) brought back the focus to coastal effects. Theyproposed an entirely new shoreline algorithm to calculate the evolution of strongbores over a sloping beach and then computed run-up using the NSW equations.This was a spectacular advance. The wave may break during the run-up over thedryland, bores collapse, and the moving front is thin with high initial velocities, asituation which usually results in instabilities in numerical computations. Thislast run-up step had been entirely missing in earlier numerical calculations of1C1 propagation. Models either ignored it altogether and interrupted thecomputation at some threshold offshore location, from which point inundationwas inferred—hence their name as threshold models—or attempted shorelinecomputations irreproducibly. Run-up calculations are still missing even in mostcurrent 2C1 propagation models owing to the perceived complexity whenapplied over physical bathymetries. This is quite regrettable, as some studieshave suggested that run-up inferences from threshold models may differ frommodels with shoreline algorithms by factors up to two, and sometimes even more.The Hibberd & Peregrine evolution computation was ad hoc and conceived forbores that evolve more rapidly than non-breaking waves; this analysis allowedfor the development of all shoreline algorithms used since then.
By the end of the decade, there was still little realization of the scales oftsunamis of geophysical interest, or the differences in the run-up variation forbreaking and non-breaking waves. Even the term run-up promulgated sinceHibberd & Peregrine’s work, up to this time, tsunami vertical rise (andoccasionally tsunami run-up) had been used interchangeably with tsunamiheight. These issues were addressed in the 1980s, and many of the earlier resultswere synthesized into powerful analytical and numerical tools, validated withlaboratory experiments, setting thus the stage for the advances in the now widelyused tsunami forecast models, as developed in the 1990s.
3. Tsunami hydrodynamics in the 1980s
Early in the decade of the 1980s, and motivated from Hibberd & Peregrine’sanalysis, numerical methods for calculating run-up started to rapidly develop. Thefocus remained on solitary waves as initial conditions, except one approachpursued by geophysicists and yet to be reconciled in classic hydrodynamic practice.
Phil. Trans. R. Soc. A (2006)

2239Tsunami science before and beyond Boxing Day
Ward (1980) introduced the concept of tsunami waves as a particular branchof the spheroidal family of normal modes, or free oscillations, of the Earth. Thisformalism is traceable to Love’s (1911) famous monograph for the computationof the eigenfunctions of the Earth’s modes. Ward asserted that it is directlyapplicable to the case of tsunamis, as long as the Earth model includes an oceaniclayer, and the computation is carried in the full six-dimensional space allowingfor gravitational effects. As discussed later by Okal (1982, 1988), this allows thedirect and seamless handling of the coupling between the ocean water layer andany vertically heterogeneous solid Earth structure. While the normal modesmethodology is not limited to long water waves, it is by nature linear. It alsorequires a spherically symmetric structure involving an ocean covering the wholeplanet with a uniform depth d. It remains largely unused in inundationmodelling, and its veracity is not widely recognized outside geophysics.
Given the extensive work in the 1970s on the evolution of solitary waves, theprevailing paradigm as to the leading wave of tsunamis, their run-up wasrevisited 30 years later by Pedersen & Gjevik (1983). They numerically solved a1C1 Boussinesq equation in Lagrangian coordinates. For a given solitary wave,they compared their results with analytical predictions for a sinusoid that bestapproximated the shape of a solitary wave far from its tails. Based on thissinusoid, they derived a breaking criterion for the run-down of the wave andattempted comparisons with their own laboratory data. Kim et al. (1983) alsosolved a potential flow 1C1 equation and compared their results for themaximum run-up with some of the Hall & Watts (1953) data, with varyingdegrees of agreement.
By the later 1980s, in a series of Ph.D. dissertations at Caltech, significantadvances were achieved in exploring the characteristics of breaking and non-breaking solitary waves and their run-up. Synolakis (1986, 1987) solved the initial-value problem (IVP) of the NSW for the evolution and run-up of solitary wavesfirst propagating over constant depth and then evolving over a sloping beach. Topredict the run-up of wave of the classic Boussinesq solitary wave shape, he firstused the Keller & Keller (1964) formalism to derive a boundary condition at thetransition point between the sloping beach and constant depth region. He thenlinearized the CCG transformation at the transition point, arguing that far off thebeach nonlinear effects were expected to be small. Synolakis (1986) then proceededto derive a new solution of the CCG equation for general offshore initial conditionsand calculated the evolution of a solitary wave with nonlinear theory, through theentire run-up and run-down process. As opposed to Carrier (1966), he was able toback calculate the evolution of the wave in the physical (x, t) space, andsuccessfully compared the analytical predictions with laboratory measurements inthe 30 m long, 76 cm wide Caltech channel.
This methodology was used to demonstrate the run-up invariance betweenmaximum run-up results from the nonlinear and linear forms of the ShallowWaterwave equations. This invariance was first suggested by Carrier (1966), withoutaccounting for reflection off the beachwhich can drastically change the wave shape.Synolakis was able to demonstrate that for the same initial wave offshore, anddespite the fact that linear and nonlinear theory predicted differentwave evolutionsnearshore, their predictions for the maximum run-up were mathematicallyidentical. The key advance was the development of a mathematical formalismthat allowed for direct contour integration of the resulting Hankel transforms and
Phil. Trans. R. Soc. A (2006)

100(b)
80
60
40
20
0
the
dim
ensi
onle
ss ti
me
–2 0 2 4 6 8 10 12 14 16 18 20
the normalized horizontal distance along the sloping beach
the wavefront path over the sloping beach
nonlinear theory771aa 723aa
724ab523aa526aa75cde
772ab775ab776aa717ab
the shoreline path during run-down
the shoreline path during run-upmaximum run-up
initi
al s
hore
line
101 : 19.851 : 11.431 : 5.671 : 3.731 : 2.751 : 2.141 : 1.00run-up law
10
1
1.0
0.1
R/d
0.12.831 cot b (H/d)5.4
0.010.01
(a)
Figure 3. (a) The run-up of solitary waves, comparison of measurements from different experiments(symbols) with the predictions (solid line) from the run-up law, equation (3.1). (b) The wavefrontpath for a 0.02 solitary wave climbing up a 1 : 20 sloping beach. Comparison of laboratorymeasurements with nonlinear theory. The different symbols represent different realizations of thesame experiment. Note the acceleration once the wavefront crosses the initial shoreline. AfterSynolakis (1987).
C. E. Synolakis and E. N. Bernard2240
the derivation of McLaurin series that could be summed up asymptotically, inparameter ranges of geophysical interest. For example, for the run-upR of solitarywaves of offshore heightH, propagating over depth d and then climbing up a beachof angle b, with profile hðx; 0ÞZH sech2½gðxKbÞ�; gZ
ffiffiffiffiffiffiffiffiffiffiffiffiffiffiffiffi3H=4d3
p, he derived
asymptotically that
R
dZ 2:831
ffiffiffiffiffiffiffiffiffifficotb
p H
d
� �5=4
; ð3:1Þ
Phil. Trans. R. Soc. A (2006)
2241Tsunami science before and beyond Boxing Day
where the coefficient and the exponent are exact. By calculating the Jacobian of theCCG transformation, he derived a breaking criterion to identify among his ownrun-up data and Hall & Watts’ (1953), the non-breaking solitary waves andcompared the predictions from the asymptotic result (3.1) to the data, as shown infigure 3. It appeared, that at least the problem of scaling solitary wave run-up wassolved and the differences in functional variations for the run-up of breaking andnon-breaking waves were identified. Most later work with numerical solutions forsolitary waves has used (3.1) for validation.
Another result whose usefulness was not entirely recognized until the wideavailability of amateur videos of the 26 December 2004 megatsunami was theacceleration of the wavefront past the initial shoreline. As shown in theevolution of the front of the solitary wave in figure 3, the wave first slows downas it climbs up the sloping beach, due to the reduction in depth, as the wave
celerity czffiffiffiffiffiffiffiffiffiffiffighðxÞ
p, where h(x) is the changing depth. As the wave hits the
initial shoreline, it slows down considerably, but accelerates again, beforedecelerating to its ultimate onland penetration point, the maximum wave run-up. In a video taken near the Grand Mosque in Aceh, one can infer that thewavefront first moved at speeds less than 8 km hK1, then accelerated to35 km hK1. The same phenomenon is probably responsible for the mesmeriza-tion of victims during tsunami attacks, first noted in series of photographs ofthe 1946 Aleutian tsunami approaching Hilo, Hawaii, and noted again incountless photographs and videos from the 2004 megatsunami. The wavefrontappears slow as it approaches the shoreline, leading to a sense of false security,it appears as if one can outrun it, but then the wavefront accelerates rapidly asthe main disturbance arrives.
Skjelbreia (1987) measured flow velocities in breaking solitary waves generateddirectly on a sloping beach using a laser Doppler velocimeter. The data allowed fortesting of approximate long-wave relationships for the horizontal and verticalvelocities with the wave amplitude. Away from the breaking point, even steepwaves were shown to have an approximately uniform horizontal velocitystructure, up to the boundary layer, as anticipated by SW theory. In the samelaboratory of Fred Raichlen at Caltech, Zelt (1991) developed a Lagrangiansolution of the 2C1 Boussinesq equation and calculated the run-up distribution ofa solitary wave entering a parabolic basin.
4. The 1990 Catalina long-wave run-up workshop
The decade of the 1990s was launched with two landmark scientific meetings, onein Novosibirsk, Russia in 1989 and another in Twin Harbors, Catalina Island inthe US in the 1990. While the Novosibirsk symposium organized primarily byGusiakov (1990) included mostly geophysicists and applied mathematicians, theCatalina workshop brought together applied mathematicians and coastalengineers and was geared more towards understanding the state-of-the-art oftsunami hydrodynamics.
In the National Science Foundation (NSF) workshop in Catalina, key existingresults were summarized and discussed (Liu et al. 1991). The emphasis was onexamining how to best validate numerical and analytical tools underdevelopment. E. Pelinofsky demonstrated, albeit with a different transformation,
Phil. Trans. R. Soc. A (2006)

C. E. Synolakis and E. N. Bernard2242
the run-up invariance between linear and nonlinear theories. C. E. Synolakisdiscussed the generalization of Green’s law (1833), a classic result for theamplitude evolution of periodic waves on sloping beaches, to solitary waves; farfrom the shoreline, hmax the maximum height of solitary waves of heightH evolves with the inverse quarter power of the depth, even with reflectionincluded, as predicted by Green’s law, which did not include reflection.
D. H. Peregrine presented novel computations of colliding breaking waves andinferred that the associated fluid accelerations when a breaking wave collapses ona vertical wall can reach 1000g, and noted that the associated high pressures weresuch that compressibility effects remained unimportant, at least for this type ofimpact. Peregrine then presented numerical results of the evolution of groups ofbores whose run-down was interacting with the run-up of the subsequent front, afiercely feared computation. C. C. Mei presented new results with a multiple-scale perturbation theory to study harbour resonance. H. Yeh presentedlaboratory measurements of a bore climbing a sloping beach, taken with ahigh-speed camera, and observed that the bore collapse was not as anticipated inearlier analytical predictions. Ramsden & Raichlen (1990) presented results forthe impact pressure of a bore on a vertical wall.
In terms of numerical modelling, V. V. Titov presented the Novosibirsk’sComputing Center’s finite-difference 2C1 algorithm that allowed for efficientcalculations of the far-field evolution of tsunami-looking waves, a computationthat whose propagation algorithm became the basis of the code MOST (Methodof Splitting Tsunami; Titov & Synolakis 1998) now used by NOAA for tsunamiinundation forecasting. N. Shuto presented a spectacular animation of a longwave flooding rectangular shaped structures on dry land which, however, did notinclude actual inundation calculations. Z. Kowalik presented a 1C1 computationfor bore run-up. S. Grili and I. A. Svendsen presented what they referred to asexact numerical computation using the boundary-element method for 1C1 long-wave evolution, up to its maximum run-up but no further, solving Euler’sequations. P. L.-F. Liu presented an animation of a three-dimensional potentialflow solution for a wave sloshing in a rectangular basin.
F. Gonzalez presented the first ever measurement of waves with a periodgreater than 5 min in the open ocean at a resolution of 1 mm, with a pressuregauge at 6000 m depth. This instrument was the basis of what is now known astsunameters or Deep Ocean Assessment and Recording of Tsunamis (DART)buoys (Bernard et al. 2006). E. N. Bernard emphasized the link betweenmodelling and civil defence strategies and suggested the importance of both site-specific and source-specific inundation maps that would depict the floodinghazard from scenario events.
With the exception of the latter presentation, it would have been clear toanyone not involved in tsunami research that despite the advances and thescientific talent involved with them, the understanding of real tsunamis wasnot altogether entirely different from 20 years earlier with improvementsonly in the least realistic problems, which could not rapidly lead to tsunamiforecasting or inundation mapping. The main conclusion of the Catalinaworkshop was that the run-up of a single non-breaking wave could becomputed analytically and numerically. The NSW model was determined tobe adequate for the applications of geophysical interest. There was consensusof a pervasive need for laboratory data for long waves propagating in two
Phil. Trans. R. Soc. A (2006)

2243Tsunami science before and beyond Boxing Day
directions to allow further progress in computational models particularly for2C1 run-up computations. There was no realization of the importance of theseafloor/water-surface coupling, and the solitary wave model remained thestandard. All this was to change.
5. Tsunami hydrodynamics in the 1990s
The decade of the 1990s showed rapid progress towards a more realisticunderstanding of the entire tsunami evolution process from generation to run-up.Not only did large-scale two-directional laboratory data became available, butalso tsunamis started to be fortuitously reported at a rate of almost one per year,debunking their extreme hazard status, at least for moderate events. Dr CliffAstill of the Natural Hazards Mitigation Program of NSF aggressivelyencouraged field measurements in the aftermath of tsunami catastrophes togenerate datasets to be used for code validation. The field surveys and model-validation workshops brought applied mathematicians, coastal engineers,geologists and geophysicists closer together, and advances and results wereabsorbed and implemented across fields with increasing vigour (Synolakis & Okal2005). NOAA started deploying tsunameters, and the first measurement of atsunami in the open ocean was made possible. By the end of the decade, someregions in the US and Japan had inundation maps derived with the state-of-the-art modelling tools based on actual tsunami scenario events and with physicallyrealistic initial conditions. Further, various paradoxes associated with earlierresults were explained. Finally, with the Papua New Guinea (PNG) tsunami of1998, the importance of landslide-triggered tsunamis was realized and asignificant effort materialized to better understand landslide waves within thecontext of long-wave theory.
The tsunami decade was launched with the 1 September 1992 Nicaraguantsunami. It was the first of 15 surveys carried by the International Tsunami SurveyTeam (ITST). With more than 160 people killed, this was the first major tsunamito strike in 9 years. This and its clear nature as a tsunami earthquake (Kanamori1972), motivated a number of detailed surveys and studies. A tsunami earthquakeis seafloor motion whose resulting tsunami has far greater amplitude thanexpected from conventional magnitudes, while its characteristic slow motion isoften not reported felt, as was the case with the M0Z3.4!1027dyn cm parentearthquake in Nicaragua. Only the shoreline recession was a precursor to coastalresidents, who regrettably did not identify it as such, similar to what happened inthe 2004 Boxing Day megatsunami, far field from the source. Run-up values alongthe Nicaraguan coastline ranged up to 11 m in El Transito, the most devastatedlocale, yet in the adjoining Playa Hermosa, even the beach umbrellas had been leftstanding, as widely noted then in local newspapers.
Without due regard to the nature of signals from tide gauges, and usingestablished tools for inverting seismic wave time-histories, seismologistsattempted hydrodynamic inversions to better define the seafloor motion, giventhat little is known as to the quantitative differences in the distribution of seafloordisplacement of such events compared with more conventional earthquakes. Theunderlying assumption was that the seafloor/free-surface coupling is instan-taneous, so once the initial seafloor surface was determined through inversion, the
Phil. Trans. R. Soc. A (2006)

Figure 4. (a) Top view and (b) side view of the laboratory manifestation of a 0.2 solitary waveattacking a conical island of slope 1 : 2 to model the catastrophe in Babi Island in 1992. Waterdepth is 32 cm. (c) Early numerical animations from Titov & Synolakis (1998) who used the conicalisland laboratory data for model validation.
C. E. Synolakis and E. N. Bernard2244
seafloor deformation becomes explicit. A less appropriate assumption in someinversion models was that the water wave propagation is as linear as seismic wavepropagation, discounting the pervasive nonlinearities that inadvertently arise inthe extreme nearshore. There was no discussion as to how many records wereneeded to regularize the inverse problem which otherwise is mathematically illposed. This remains an unresolved problem.
In the absence of more sophisticated source models, the seafloor or onlandground displacement of non-tsunami earthquakes is computed through a series ofanalytical formulae, after Okada (1985). They represent the displacement fieldon the surface of an elastic half-space, when a dislocation of given direction andsize is introduced at a given epicentral depth. The deformation is thentransferred to the free surface. This differs from the normal modes approach,
Phil. Trans. R. Soc. A (2006)

–209
run-
up (
m)
latit
ude
05
1015202530
–69.4
–69.2
–69.0
–68.8
–68.6
–68.4
–68.2
–68.0
–67.8
(a)
(b)
–210 –211longitude
–212 –213 –214
–209 –210 –211 –212 –213 –214
data labels: topography contours:stereo data 40 m
stereo shorelinenumerical shorelinemodel results
field observations
Figure 5. Comparison of field measurements from the Okushiri 1993 tsunami with measurementsfrom (a) aerial photos and (b) model inundation predictions using MOST. To predict the extremerun-up of 33 m successfully, a resolution of 5 m was necessary.
2245Tsunami science before and beyond Boxing Day
which allows the direct handling of the coupling between an ocean water layer ofconstant depth and any vertically heterogeneous solid Earth structure. To matchqualitatively the patterns of observed run-up and tide gauge recordings, complexmulti-segment fault models for 1992 Nicaragua were proposed throughhydrodynamic inversion. Even so, predictions using seafloor displacementsderived through the inversions and using 2C1 threshold type models differed byfactors up to 10 from run-up measurements. Since threshold models do notcalculate run-up, and given the uncertainty in defining the parent seafloormotion, a debate raged for several years, whether it was deficiencies in thehydrodynamics or the seismologic models that were at fault.
Without any time to absorb the impact of this event in scientific terms, the12 December 1992, Flores, IndonesiaM0Z5.1!1027 dyn cm earthquake triggereda large tsunami. Run-up heights ranged from 5 m along the north coast of Floresacross from the epicentre, to 26 m in Rangrioko in northeastern Flores. Simula-tions using the state-of-the-art code of the 1980s now known as TUNAMI-N2,a derivative of the Goto & Shuto (1983) model, again underpredicted themeasured run-up by a factor of up to 7.
Flores 1992 is mostly remembered by the catastrophe in Babi Island andoverland flow in Wurhing. Babi is volcanic, of conical shape with a diameter atthe shoreline of about 2 km. It is situated about 5 km directly north of Flores, inbetween the epicentral region and Flores Island. While the tsunami attackedfrom the north, most of the inundation was in the south, normally protected from
Phil. Trans. R. Soc. A (2006)

C. E. Synolakis and E. N. Bernard2246
wind waves. The two fishing villages in Babi were completely inundated and run-up values ranged up to 7 m. Survivors described particularly gruesome sceneswith human remains left dangling on trees. Wuhring, a 400 m long, 200 m widedensely populated peninsula, was completely inundated with overland flow of3 m depth with more deaths per 100 persons than anywhere else other than Babi.Photographs from Wuhring are quite reminiscent of images from Banda Aceh,including the surviving mosque (Yeh et al. 1993).
At the time little attention was paid to Wuhring and the overland flow depthwas noted and referred to as run-up, the differentiation between the two was notintroduced until later in the decade. However, Babi received considerably moreattention. Fortuitously and in response to the Catalina workshop, large-scale2C1 laboratory experiments had been under way at a 27 m wide, 30 m long and60 cm deep wave basin of what is now known as the Coastal and EngineeringLaboratory. A series of laboratory tests were undertaken by Briggs et al. (1994,1995). Solitary waves were created by a horizontal wave generator with 60different 45 cm wide paddles moving independently. Given the Babi Islandcontroversy, a laboratory model of a 7.2 m base-diameter conical island wasconstructed with a slope angle of 148.
The experiments demonstrated that once the wave hits the side of the islandacross from the generator, the crest splits into two waves (see figure 4). Thesetwo waves move with the crest perpendicular to the shoreline, propagate aroundthe island and collide behind it, in a spectacular demonstration of constructiveinterference, (Yeh et al. 1994). Neither long waves of smaller crest length norperiodic storm waves do so. This appears to be the first laboratory visualizationto an observed tsunami catastrophe.
The circular island data measurements were then used to refine shoreline 2C1algorithms under development. Preliminary modelling results were published byYeh et al. (1994), and more comprehensive analyses by Liu et al. (1995) andTitov & Synolakis (1995, 1998), where the code used by NOAA for real-timeforecasting MOST was most comprehensively presented. The experimental dataformed the basis of one of the four benchmark problems used in a subsequentNSF workshop for inter-model comparison and code validation.
As experiments were still progressing, the 12 July 1993 Hokkaido-Nansei-Okitsunami hit northern Japan and devastated the island of Okushiri west ofHokkaido. The parent earthquake had an M0Z4.7!1027 dyn cm and fieldmeasurements identified extreme run-up values of 31 m at a river gully nearMonai. The wave overflowed a 7 m high protection wall and destroyed the townof Aonae situated at the southern most tip of the island. Excellent bathymetrydata existed before the tsunami, and hydrographic surveys were able to measurethe deformed seafloor to high resolution, leading to a more realistic initialcondition, used since as another benchmark test for model validation along withthe field measurements. Results from a classic comparison are shown in figure 5.
In 1994, the paradigm of a solitary wave as an appropriate initial condition foranalytical tsunami modelling—still widely used today for developing benchmarksolutions—was challenged for the first time, and Kajiura’s (1963) work revisited,unknowingly. By noting that the first arrival in Nicaragua and Flores were wavesthat caused the shoreline to recede before advancing, Tadepalli & Synolakis (1994)proposed a model for the leading wave of tsunamis with an N-wave shape, inanalogy to dipole waves in gas dynamics. To facilitate asymptotic analysis, they
Phil. Trans. R. Soc. A (2006)

2247Tsunami science before and beyond Boxing Day
chose a certain class of dipolar waveforms with amplitude given byhðx; 0ÞZEHðxKaÞsech2½gsðxKbÞ�, where a, b define the locations of the crestand the trough, gs is a wavenumber parameter that defines the spread of the waveby analogy to the solitary wave profile hðx; 0ÞZH sech2½gðxKbÞ�; gZ
ffiffiffiffiffiffiffiffiffiffiffiffiffiffiffiffi3H=4d3
p,
and E is a scaling parameter to allow for direct comparison with solitary waves.Tadepalli & Synolakis (1994) used the methodology of Synolakis (1987) to evolvethese N-waves in the canonical geometry and found that N-waves with the troughfirst run-up higher than N-waves with the crest arriving first. They named thelatter leading elevation N-waves (LEN), and the former leading depressionN-waves (LDN). They derived asymptotic results for different families of N-wavesand showed that LEN waves run-up higher than the equivalent solitary waves.
Their work at the time was controversial, for it was not reconcilable with thesolitary wave paradigm. LDN waves were believed to be hydrodynamicallyunstable, the crest was supposed to quickly overtake the trough, while inlaboratory realizations of LEN waves the crest quickly separated from the tail, asexpected. The additional reports of the LDN waves striking the south coast ofJava, Mindoro Island and Shitokan Island, following three more tsunamigenicearthquakes in 1994, did little to settle the controversy. Initial shorelinerecessions were dismissed by many as unconfirmed reports of ‘untrained’eyewitnesses.
In the summer of 1995, the follow-up of the Catalina workshop materialized atFriday Harbor, Washington. The focus here was validation of computationalcodes to predict run-up and inundation. The organizers had prepared fourbenchmark problems with laboratory data on the propagation of edge waves,solitary wave run-up, conical island run-up and the field run-up measurementsfrom the 1993 Okushiri tsunami. They provided the initial conditions but no run-up measurements, except as published already. As perhaps expected, there wereseveral 1C1 computations that predicted the run-up of solitary waves, but onlythree models were able to reproduce more than one of the 2C1 problems,TUNAMI-N2, Liu et al.’s (1995) code, and VTCS-3, a code that became knownas MOST. Further, Kanoglu & Synolakis (1995, 1998) were able to compute therun-up around a conical island using analytical tools.
A weak 2C1 solution to the NSW was proposed by Brocchini & Peregrine(1996). Using a similarity transformation to relate the longshore coordinate ywith t, they were able to derive a simple expression for the horizontal velocitywhich further transformed the 2C1 problem into a solvable 1C1 Synolakis(1987) formulation. Even though valid for small angles of incidence, as is themore realistic case, their formulation remains largely unexplored, possiblybecause of a perceived difficulty in numerically translating their initial condition.Nonetheless, it remains the only 2C1 analytical solution for benchmark testing.
On 9 October 1995, an M0Z1.15!1028 dyn cm earthquake struck Manzanillo,Mexico and generated a moderate tsunami. The parent earthquake was thelargest to strike the Mexican coastline since the 1932 series, yet run-up rangedmostly up to 4 m with extreme values of 11 m on steep coastal cliffs. The ITSTsurvey was able to acquire two series of photographs from eyewitnesses. In thefirst, a family was sitting in a veranda of their hotel in the steep coastal cliffs onthe south end of la Manzanilla. As soon as they felt the ground shake, they notedthe Manzanillo Bay emptying. They took a photograph, believed to be the firstdocumented observation of a leading-depression N-wave causing shoreline
Phil. Trans. R. Soc. A (2006)
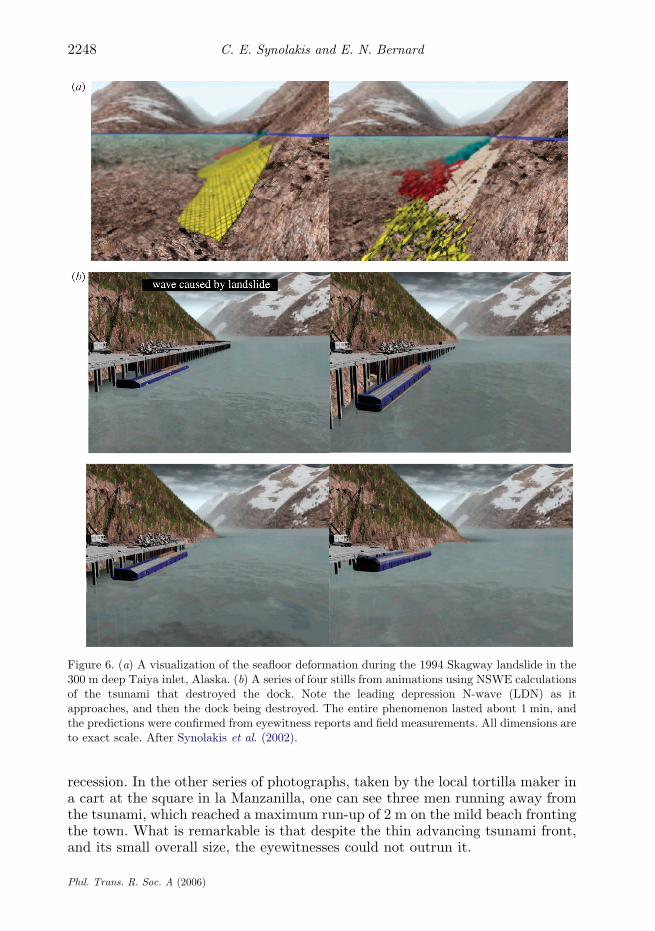
Figure 6. (a) A visualization of the seafloor deformation during the 1994 Skagway landslide in the300 m deep Taiya inlet, Alaska. (b) A series of four stills from animations using NSWE calculationsof the tsunami that destroyed the dock. Note the leading depression N-wave (LDN) as itapproaches, and then the dock being destroyed. The entire phenomenon lasted about 1 min, andthe predictions were confirmed from eyewitness reports and field measurements. All dimensions areto exact scale. After Synolakis et al. (2002).
C. E. Synolakis and E. N. Bernard2248
recession. In the other series of photographs, taken by the local tortilla maker ina cart at the square in la Manzanilla, one can see three men running away fromthe tsunami, which reached a maximum run-up of 2 m on the mild beach frontingthe town. What is remarkable is that despite the thin advancing tsunami front,and its small overall size, the eyewitnesses could not outrun it.
Phil. Trans. R. Soc. A (2006)

Figure 7. Animation stills from Borrero et al.’s (2001) calculations of the evolution of the landslidewave off Palos Verdes, California.
2249Tsunami science before and beyond Boxing Day
The photographs motivated the long overdue reconciliation of recedingshorelines with the prevailing INS-based theory and the resulting solitary waveparadigm. Tadepalli & Synolakis (1996) forced the LSW equation with a step-function motion to imitate fault rupture, and showed that N-waves were oneparticular exact solution for the LSW. Using the INS theory to determine whenleading solitary waves would emerge from LDN waves generated from their step-function seafloor rupture, they found that N-waves of geophysical scales wouldhave to evolve more than once around the perimeter of the Earth, to reach closeto the idealized infinity of INS theory. LDN waves of steepness less than 0.0001were found stable over 1000 km propagation distances.
Tadepalli & Synolakis (1994, 1996) suggested that because of the nature of thedipolar seafloor deformation unzipping in subduction zones, LDN waves wouldstrike the adjacent shoreline of the subsiding plate, while LEN waves would movetowards the open ocean. Using their asymptotic formulae on a representation ofthe initial 1992 Nicaraguan tsunami as derived from more evolved seismicmodels, and a simplified form of the long Nicaraguan shoreline, they showed thatthey could predict the observed run-up analytically within a factor of two. Geist(1998) confirmed these inferences by demonstrating how subduction zone eventsgenerated N-waves and developed approximate formulae based on theasymptotic results Tadepalli & Synolakis (1994).
The event, however, that shook tsunami science on a scale analogous to the 2004megatsunami,was the17July1998PNGtsunami.Despite the relatively small size ofthe parent earthquake with M0Z3.7!1026 dyn cm, this tsunami resulted in over2100 fatalities, officially surpassed in the twentieth centuryonlyby the1933Sanriku,Japan tsunami. The field survey (Kawata et al. 1999) confirmed exceptional run-upheights, reaching 15 m, but concentrated on a 25 km stretch of coastline outsidewhich the effects of the tsunamiwereminimal. As documented in detail in Synolakiset al. (2002), the combination of excessive amplitude and concentration of the run-upwas quickly recognized as incompatible with any simulation model based on theexcitation of the tsunami by a seismic dislocation; in addition, the earthquake didnot feature a slow source comparable to those of documented ‘tsunami earthquakes’.Finally, eyewitness reports generally indicated that the tsunami had arrived at least10 min later than predicted by all acceptable models of propagation.
Phil. Trans. R. Soc. A (2006)

C. E. Synolakis and E. N. Bernard2250
Based on the identification of a hydroacoustic signal recorded near WakeIsland featuring an anomalous combination of amplitude and duration, Okal(2003) proposed that the tsunami had been generated by an underwaterlandslide, itself triggered by the earthquake with a delay of 13 min. A number ofhydrographic surveys, using seismic refraction and remotely operated sub-mersibles later identified a 4 km3 slump contained in a submarine bowl-shapedamphitheatre located 25 km off the coast. This was used as the source of thetsunami in several successful numerical run-up simulations.
The identification of a submarine landslide as the source of the 1998 tsunamiresulted in renewed sensitivity for the hazards created by underwater landslides.Before then, the understanding of the mechanics of landslide tsunamis was solacking, that a simple arithmetic error of two orders of magnitude in an empiricalformula had remained unnoticed, leading to a substantial underprediction of theheight of the leading wave from a landslide off Palos Verdes, California. With thewrong 0.15 m estimate, many had dismissed the local landslide hazard altogether.The PNG analysis allowed for the resolution of an earlier bitter dispute concerningthe landslide trigger of the 1994 Skagway, Alaska tsunami, see figure 6.
The 17 August 1999 Izmit, Turkey and 26 November 1999 Vanuatu earthquakesare believed to have triggered mass movements that generated the larger thanotherwise expected observed tsunamis. These events, along with the 13 September1999 Fatu Hiva, Marquesas aseismic tsunami generated by an aerial slump due tothe collapse of weathered cliff, further focused interest on landslide tsunamis, assummarized by Bardet et al. (2003). In the aftermath, marine geology surveys thatwere published suggested that some continental margins in California, Oregon andeven the east Coast of the US and elsewhere were especially susceptible tosubmarine landslides due to the combination of offshore faults and nearshoresubmarine canyons with stored sediment, as well as bottom material on relativelysteep slopes. As a result, the level of hazard posed by relatively moderateearthquakes (typically at the magnitude 6 level) started to be re-examinedupwards, on a case-by-case basis (Borrero et al. 2001, 2004). Figure 7 shows theirevolution of a landslide tsunami from a source off Palos Verdes, California.
One vexing question raised by the PNG landslide trigger was whether theextreme coastal evolution of landslide tsunamis could be effectively modelledwith the NSW equations, or whether the Boussinesq equations would have to beinvoked. Landslide waves are steeper and shorter than tectonic tsunamis andhence disperse more rapidly. Lynett et al. (2003) compared Boussinesq and NSWmodels with the field measurements and concluded that while the nearshoreevolution was different, the run-up predictions did not appreciably differ. In theprocess, they also differentiated run-up and flow depth measurements in the fieldobservations, Before 2000, the term run-up, the elevation of the most inwardpenetration of the wave was used to refer to the flow depth as well, introducingfurther challenges in the interpretations of older field datasets.
6. Progress just before the megatsunami
By 2000, some claimed that as many as one-third of the tsunamis ever historicallyreported were due to landslides, and earlier events were re-interpreted to accountfor what appeared then as anomalous. Gutenberg’s (1939) aphorism that
Phil. Trans. R. Soc. A (2006)

2251Tsunami science before and beyond Boxing Day
‘submarine landslides are to be considered at least as one of the chief causes, if notindeed the major cause of tsunamis’ was rediscovered with a vengeance.
Fortuitously, again, the M0Z2.8!1027dyn cm Wewak, Papuan New Guineaearthquake of 8 September 2002, occurred 135 km northwest of the 1998 event andallowed for less speculative revisionism. The moment of the 2002 event was seventimes larger than in 1998, yet the tsunami generated was much smaller, with noassociated tsunamigenic landslide. The field survey of Borrero et al. (2003)revealed a strikingly different run-up distribution from the 1998 event, figure 8.Okal & Synolakis (2004) fitted Gaussian distributions to the respective longshorerun-up measurements. For tectonic (dislocation-triggered) tsunamis, theyproposed two dimensionless parameters I1Zb/Du and I2Zb/a, where b is ameasure of the width of the run-up distribution in the longshore direction; Du, ameasure of the seafloor vertical displacement; and a, a measure of the maximumheight of the run-up distribution. For landslides, the invariant I1 is replaced withI3Zb/hmin, where hmin is the height of the leading dipole wave in the LDN. I1, I2and I3 behave as invariants; while they characterize the tsunami source landslideversus dislocation, they are largely independent of the exact parametersdescribing the sources, and can be used as discriminants to identify the natureof the tsunami source. Figure 8 also shows how I1 varies with I2 for 37 simulationsof tectonic sources, I3 with I2 for 37 landslide sources, with field data for validation.It is clear that landslide and tectonic sources can be identified on the basis of I2.
A new methodology for modelling landslide tsunamis was pursued by Ward(2001). If the equations of motion are not depth averaged, but only linearized,the resulting formulation involves solving Laplace’s equation. Ward re-derivedGreen’s functions and proceeded to describe complex landslide sources throughtheir linear superposition, as discussed earlier by Mei (1983). One advantage isthat the formalism is by definition dispersive. A disadvantage is that for some ofthe extreme waves considered in later work, e.g. volcanic collapse waves of 900 mheight in 2000 m depth, these waves are highly nonlinear. Nonlinear effects startto become important in tsunami evolution when the height-to-depth ratioexceeds 0.1, and they rapidly reduce the wave height of larger and steeper waves.Occasionally, dispersion and nonlinearity balance and the resulting wave doesnot evolve rapidly, but this remains to be established for waves of the size andsteepness often considered by Ward in subsequent work.
When available, historical archives can be used successfully, as demonstratedby the brilliant reconstruction of the effects of the 1700 Cascadia tsunami in Japan(Satake et al. 1996; Atwater et al. 2005). In their absence, and to better identifythe source mechanism of anomalous events such as the 1946 Aleutian tsunami orthe 1956 Amorgos tsunami, interest in surveys of historic events has renewed. The1946 tsunami was triggered by a deceptively small M0Z9!1028 dyn cmearthquake, yet eradicated Scotch Cap in the near field, killed 159 people inHawaii, far field, and wrought significant damage in the Marquesas, with somereports that it was noted as far as Antarctica. During several field surveys in1999–2002, Okal & Synolakis (2004) were able to compile a database of 86 far-fieldand near-field run-up measurements through the interview of 69 witnesses aged59–89 years, with two fundamental results. In the near field, the maximum run-upwas revised upward to 42 m at Scotch Cap, rapidly decayed along the coast ofUnimak Island. Their measurements require the involvement of a majorunderwater landslide, as they indicate an aspect ratio of the longshore run-up
Phil. Trans. R. Soc. A (2006)

–1000
0
0
–0.5
–1–6 –5.5 –5.0 –4.0 –3.5 –3.0 –2.5–4.5
log I2
0.5
1.0
2
4
6
5run-
up (
m)
run-
up (
m)
log
[I1,
I3]
10
15(a)
(b)
(c)
0 100
–100 0 100
distance y along beach (km)
PNG
PNG
distance y along beach (km)
aspect ratio
aspect ratio I2 = 1.17×10⁻⁵
I2 = 4.74×10–498198
02251
96052
94153 92246
95282
01174
98198
46091
8526202251
Figure 8. (a) The measured maximum run-up plotted against the distance along the shoreline for the1998 and (b) 2002 PNG waves (left). (c) The scaled invariants I1 and I3 are plotted against I2, fortectonic numerical simulations (blue circles) and landslide simulations (red circles) and as derivedfrom field measurements (inverted triangles) from near-field events from 1992 to 2001. Note that alllandslide events feature aspect ratios with log I2OK4.2. After Okal & Synolakis (2004).
C. E. Synolakis and E. N. Bernard2252
distribution I2Z6.7!10K4 and a ratio of maximum run-up to seismic slip I1Z3.4,both in excess of those theoretically acceptable for any dislocation. In the far field,and based principally on their field measurements at Juan Fernandez Island, theydocumented a very pronounced directivity, which cannot be reconciled with alandslide source, and requires a substantial dislocation. The 1946 controversyappears to start being reconciled.
In an effort to better understand the generation and run-up of waves fromsubmarine and subaerial slides, Raichlen & Synolakis (2004) conducted large-scale experiments in a 104 m long, 3.7 m deep and 4.6 m wide wave channel witha plane slope (1 : 2) located at one end of the tank. Following Wiegel’s (1955)
Phil. Trans. R. Soc. A (2006)

0
0 2 4 6
0.5–4
–12
–10
–8
–6
–4
–2
0
–3
–2
0
1t=0.1
t=0.1 t=1.5
–1
1x
x0 2 4 6
x
y
y
1.5 2 0 0.5
t=0.5
1x
1.5 2
Figure 9. The analytical solution of Liu et al. (2003) for a moving thin slide.
2253Tsunami science before and beyond Boxing Day
experiments, they first used a 91 cm long, 61 cm wide with a 46 cm high verticalface wedge block, and then semi-spherical and rectangular boxes of equal volume.By varying the weight of the blocks, they were able to vary the initialacceleration, while the initial position varied from totally aerial to totallysubmerged. The experiments revealed a three-dimensional depression formingover the wedge as motion initiates. The depression forms the leading portion ofthe LDN propagating towards shore and running up the slope, while an LENwave propagates offshore. For the aspect ratio of their boxes, they observed thatwave generation became rapidly inefficient as the submergence of the blocksexceeded one block height. These experiments have since been used as anotherbenchmark test for model validation.
The forced linear long-wave equation was revisited by Liu et al. (2003) with asech-shaped block sliding from the initial shoreline. A new exact solution usefulfor code-validation was developed as shown in figure 9. Numerically, near theinitial shoreline, landslides pose a vexing computational challenge, for not onlythe shoreline retreats and advances, but also the seafloor is deforming at a ratethat cannot be ignored in simulations, as when calculating the evolution oftectonic tsunamis. The analytic solution allowed for a direct comparison ofpredictions and guided shoreline algorithm improvement. The variation of the1C1 run-up with the triggering fault generation mechanism based on one-dimensional approximations was accomplished by Tinti & Tonini (2005).
Phil. Trans. R. Soc. A (2006)

C. E. Synolakis and E. N. Bernard2254
Physically, realistic fault ruptures on a uniformly sloping beach were found toresult in amplification factors in the range of 1–2, implying that even in 1C1propagation, the Okal & Synolakis (2004) parameter I1!2, precisely what theempirical Plafker rule suggests.
The 1C1 IVP of the NSW was also revisited by Carrier et al. (2003) with ahodograph transformation for a uniformly sloping beach, in contrast to thecanonical problem, whose existing IVP solution is for an initial wave at constantdepth and then evolving over a sloping beach. The results showed howN-waves notonly have different run-up, but different onland velocity distributions. The Carrieret al. (2003) solution includes integrals with singularities and ad hoc linearizationsof the transformation, issues addressed shortly thereafter by Kanoglu (2004).
Before briefly describing the surprises and challenges presented so far by the26 December 2004 event, it is helpful to summarize the state-of-the-art. The last-to-date intermodel and code validation took place again on Catalina Island in2004. Four benchmark problems were presented. One, the prediction of theshoreline motion from the wedge experimental data; two, the prediction of therun-up distribution measured in a laboratory model of the locale where extremerun-up occurred during the 1993 Okushiri tsunami; three, the prediction of theshoreline evolution of thin landslides and comparison with the Liu et al. (2003)exact solution; and four, the prediction of the of the run-up to be compared withthe IVP solution of Carrier et al. (2003).
An entirely novel model of solving the benchmark problems using smoothparticle hydrodynamics (SPH) was presented by R.A Dalrymple. SPH describesa fluid by replacing its continuum properties with locally (smoothed) quantitiesat discrete Lagrangian locations and hence it is meshless. However, only theSynolakis’s (1987) and Carrier et al. (2003) benchmark IVP solutions were shownto be amenable to most models presented, whether solving the SW, Boussinesq orEuler’s equations, as was the case in Friday Harbor in 1995. A few models wereable to predict reasonable results compared with the predictions of the Liu et al.(2003) exact solution for thin landslides. Practically, all 2C1 directional modelspresented had attempted the Okushiri simulation with varying degrees ofsuccess. MOST, TUNAMI-N2 and Lynett et al.’s (2003) methodology appearedto have an edge, with the Boussinesq solution at greater computational cost.Only the code developed by Liu et al. (2005a) appeared capable of modelling thewedge landslide data, but with extreme computational complexity. Figure 10shows stills from their laboratory experiments, the numerical results andcomparisons of measurements with predictions for the shoreline motion. It isquite clear that operational and research applications require different models,but that both require comprehensive validation of the numerical codes.
Overall, substantial progress had been achieved in 50 years of tsunami science.Integrated tsunami inundation forecasts integrating seismic and tsunameterrecordings in real time and leading to cancellation of warnings have beenattempted successfully (Bernard et al. 2006). Based on a single reading off aNOAA tsunameter in the North Pacific for the 17 November 2003 tsunami, Titovet al. (2005a) scaled their precomputed scenario event that most closely matchedthe parent earthquake to evaluate the leading wave height off Hilo, Hawaii. Theythen proceeded with a real-time NSW computation that resulted in the firsttsunami forecast and a warning was cancelled. Their comparison of the forecastto the measured wave is the new golden standard for operational models.
Phil. Trans. R. Soc. A (2006)
2255Tsunami science before and beyond Boxing Day
The code most used in inundation mapping in the US has been validatedthrough extensive series of benchmark tests. Validation remains an ongoingprocess, with every new event posing a new, but diminishing challenge. A firstgeneration of inundation maps based mostly on validated 2C1 models now existsfor the US and Japan and in some places in South America. A high-resolutionprobabilistic tsunami hazard map is now available for Seaside, Oregon,integrating near-field and far-field hazards and showing the geographicaldistribution of different levels of flooding with associated probabilities, includinghigh impact zones. The latter are based on estimates of the normalizedmomentum flux, and account for the fact that the flow depth is not the onlypredictor of damage. The impact zones reflect the variation of simple Froudenumber type parameter V 2/gD, where V is the magnitude of the overland flowvelocity and D the overland flow depth.
If the tsunami community appeared at first perplexed in the aftermath of theBoxing Day tsunami, it was not due to the failure of hydrodynamic paradigms,but because of the unprecedented loss of life, the worst possible surprise.
7. Lessons learned and unlearned
A recurring question among all pre-2004 Sumatra tsunami scientists has beenwhat else could had been done from the basic science viewpoint to have reducedthe horrific disaster. Given that the hazard had not been realized earlier, thisdeconstructionism is mute. Had the hazard been known, the basic scienceexisted to have produced inundation maps depicting possible flooding zonesfrom a variant of the 26 December 2004 event, everywhere across the IndianOcean. Widely media-published simulations were rapidly prepared in theimmediate aftermath, without the benefit of field measurements for guidance,and eventually published in the scientific literature with little changes (e.g.Smith et al. 2005; Titov et al. 2005b; Geist et al. 2006b). More importantly theyappear in overall agreement with satellite observations, underscoring how atleast the far-field impact was predictable. Even a crude tsunami warningwithout tsunameter data might had been taken seriously. Education campaignsmight had been undertaken to better acquaint people everywhere with whatwas a possible, however unlikely, worst-case flooding event. A yet easierquestion is which specific lessons learned and advances in our understanding oftsunamis might have been useful and how the Boxing Day tsunami changed anyof it, if at all.
Possibly the most glaring surprise was the hundreds of pictures in Phuket oftourists just casually watching the onslaught of the tsunami within 100 m of thecoastline. Undoubtedly most perished. The images of inundation were practicallyindistinguishable from photos from the 15 events since 1992. The response oflocal residents and tourists in 2004 was unfamiliar, at least for post-1998tsunamis. Neither the pre-existing tsunami folklore, recorded in numerouspopular-science books since 1946, nor the telling Manzanillo pictures and theirimpact in changing the scientific paradigm of tsunamis had reached the widerpublic, worldwide. Whether the better communication of established scientificresults on tsunami precursors was an issue for scientists, media, governments ornon-governmental organizations, this is yet unresolved. Mercifully all four
Phil. Trans. R. Soc. A (2006)

0
–0.10
–0.05
0
0
0
0.51.0
z z1.52.02.5
(a)
(b)
(c)
0
0.51.0
1.52.02.5
0 1–1
1 23
45
x
01
23
45
x
y0
–1
1
y
0.05
0.10
0.15gauge #2 gauge #3
0.5 1 1.5 2time (s)
elev
atio
n (m
)
–0.10
–0.05
0
0.05
0.10
0.15
elev
atio
n (m
)
2.5 3 3.5 4 0 0.5 1 1.5 2time (s)
2.5 3 3.5 4
xyz
xyz
Figure 10. Amovingwedgeas amodel of submarine landslide. (a, left)The initialwave fromasubmergedslide, immediately after motion started; note the LDN. (a, right) The wave about 1 s later, as the run-upformsperRaichlen&Synolakis (2004). (b)Animation stills fromLiu et al.’s (2005a) simulations as guidedby the landslide experiments. (c) Comparison of laboratory measurements (solid line) with numericalpredictions (dashed line) for the shorelinemotion for two locationsoff thecentreline fromLiuetal. (2005a).
C. E. Synolakis and E. N. Bernard2256
stakeholders have made significant progress to avert another catastrophe, asevidenced by the response to the 28 March 2004 Sumatran event; it is estimatedthat about 75% of the aid pledges for the Boxing Day tsunami have alreadymaterialized. If true, this is an astounding figure.
Phil. Trans. R. Soc. A (2006)
2257Tsunami science before and beyond Boxing Day
Less surprising as a concept, but not so in terms of impact, were the effects ofhuman modifications and poor land use in enhancing tsunami risk. By their verynature, long waves were not supposed to be so exquisitely affected by featuresseveral orders of magnitude smaller than their wavelength. At one extreme, tidesflood irrespective of small-scale human modifications; at the other end, stormwaves are very responsive to the same features. Many tsunamis resemble a fastreceding and then fast moving tide, yet their interaction with coastlinesresembles more that of storm waves, particularly on gentle beaches, where thewavefront breaks.
The reef fronting the devastated El Transito during the Nicaraguan 1992 eventhad an opening to allow for easier navigation, hence its rapid development as afishing village. The adjacent Playa Hermosa that was largely spared did not.During the 1993 tsunami at Aonae, a manmade dune and about 50 concrete waveprotectors channelled the tsunami into the populated portions of the town, whileprotecting the unpopulated areas. In Sri Lanka, the Sumudra Devi, a passengertrain out of Colombo, was derailed and overturned by the tsunami killing morethan 1000 (Liu et al. 2005b). In the immediate fronting area, significant coralmining had occurred, related to tourism development (Fernando et al. 2005). InPatong Beach, Thailand, a less than 60 cm high seawall separating the beachfrom the road reduced impact velocities (Dalrymple & Kriebel 2005). Mangroveswere observed to have protected coastal communities in southeastern India(Danielsen et al. 2005).
In the 1994 East Javan and 1996 Peruvian tsunamis, it had been observed thatcoastal dunes limited the amount of tsunami penetration, although then therehad been no human settlements to be impacted. In Karon Beach, Thailand, a lowsand dune protected the area behind it. In Yala, Sri Lanka, a resort, for thepurpose of better scenic views, had removed some of the dune seaward of thehotel. The hotel was entirely razed to the ground. Substantially larger waterelevations and greater damage observations were found in the hotel grounds ascompared to neighbouring areas, located behind unaltered dunes. Earlieranalytical work was suggestive that in many cases the last topographic slopelong waves encountered as they attacked composite beaches affected the run-upto first order, and it was further inferred that other small-scale features do so aswell (Synolakis et al. 1997b).
Low lying coastlines have been known to be particularly vulnerable to tsunamiattacks, as first observed in Wuhring during the 1992 Flores tsunami. In thecontext of inundation mapping in California, it had been observed that areas thatget severely flooded during El Nino events, such as Seal Beach, feature thelongest inundation distances when exposed to scenario tsunamis. Areas where thetsunami can attack from two sides are very prone to severe inundation even fromsmall tsunamis, as observed in 1994 in East Java and in 1996 in both Biak andPeru. Despite the Boxing Day tsunami being the fifth to hit Indonesia in a periodof 13 years, the population was unprepared and was decimated in the low lyingarea between Banda Aceh and Longhka in northern Sumatra, see figure 11.
All over the Indian Ocean, observations of tsunami damage to buildings wereunsurprisingly similar. In numerous locations in Sri Lanka, churches andBuddhist temples were left standing. Closer to the beach in Aceh, the onlyconspicuously standing structures in the devastated wasteland of coastal areaswere mosques. In both locales, residents credited divine intervention, but another
Phil. Trans. R. Soc. A (2006)

Figure 11. (a) The inundation line (red line), locations of field measurements (red dots) andinferred directions of inundation in Banda Aceh, during the 2004 megatsunami (Borrero 2005). (b)The distribution of maximum inundation depths as modelled by Titov et al. (2005b).
C. E. Synolakis and E. N. Bernard2258
explanation is that places of worship are more carefully constructed to a higherstandard than the surrounding non-engineered buildings. Also, the openarchitecture of mosques in southeast Asia, featuring multiple circular columnson the ground floor with no surrounding walls, allows the tsunami to flow freelythrough it, with little impact on the superstructure above them; few if any knewto evacuate to upper floors of surviving structures. Even in Vilufushi, the mostseverely impacted atoll in the Maldivian archipelago, the local school and cityhall, both two-storey structures, survived with no damage (Fritz et al. 2006).Yet, people in surrounding non-engineered houses perished. While the furthersurvival of buildings left standing from the shaking might not be known a priori,when there is no other choice, vertical evacuation is the only choice.
In terms of basic hydrodynamic science, to date, there were four noteworthyphenomena unobserved earlier. One, the manifestation of the Boxing Daytsunami as an LEN in coastlines west of the subduction zone and as an LDN eastof the subduction zone. As shown in figure 12, this behaviour was implicit in thework of Tadepalli & Synolakis (1994, 1996) but had not been observed in nature.Two, the waveguide type effect from mid-ocean ridges that appears to havefunnelled the megatsunami away from the tip of Africa (Titov et al. 2005b).Three, the sparing of the Maldives, an archipelago with coral atolls which rise tono more than 2 m at best from mean water level. The islands rise from theseafloor as pillared structures, and there was no significant wave amplification.While the reef fronting the islands determined the extend of inundation, there islittle question that the Maldives experienced a tsunami with heights closer to thefree-field tsunami height that elsewhere, as could had been inferred from earlieranalytic work by Lautenbacher (1979) and Kanoglu & Synolakis (1998). Four,the comparison between 28 March 2005 and 26 December 2004 tsunamis which
Phil. Trans. R. Soc. A (2006)

10–1
10–2R
10–3
10–3 10–2
2.831e÷(cot b0)H5/4 [|b –a –0.366/g | + 0.618/g]
run-up of LDN
a leading depressionN-wave (LEN)
a leading depression N-wave (LDN)
150–0.01
0run-up of LEN
0.01
200 250 300x
h
150 200 250 300x
–0.01
0
0.01
h
10–1
–2
0
2 Male, Maldives
–2
02
am
plitu
de, m
–3 0 3 6 9 12
time, hour from earthquake
Phuket, Thailand
Figure 12. The normalized maximum run-up of N-waves and of solitary waves (ordinate) versus theasymptotic expression of Tadepalli & Synolakis (1994); note that the bracket includes an absolutevalue. The upper solid line is the run-up predicted by the asymptotic result for leading–depressionN-waves (LDN)—as shown in the upper left inset. The lower solid line is the run-up of leadingelevation N-waves (LEN), as shown in the lower right inset. The different points are numericalevaluations of the maximum run-up for different beach slopes. E is a scaling parameter to allowcomparison with a solitary wave, hðx; tÞZH sech2gðxKtÞ; of height H evolving on the same beachof angle b0. bKa is the distance between the crest and trough. The run-up of this type of LENfollows the solitary wave run-up. The inset on the upper right (after Satake, 2007) shows tworecordings from tide gauges during the 2004 Boxing Day tsunami. In Male, Maldives (upper trace),the tsunami manifested itself as an LEN, as elsewhere to the west of the Sumatran subductionzone (SSZ). In Phuket, Thailand, it manifested itself as an LDN, as elsewhere to the east of theSSZ. This was consistent to the inferences of Tadepalli & Synolakis (1994, 1996).
2259Tsunami science before and beyond Boxing Day
suggests that the smaller water depth and the presence of the islands of Nias andSimeulue reduced the effective water mass set into motion during the later event,thereby drastically reducing the size and the impact of the generated tsunami.(See figure of Arcas and Synolakis in Kerr (2005) and Geist et al. (2006a,b).)
8. The asymptotic limit
What remains in terms of emergency management and warning is discussed byBernard et al. (2006) and Geist et al. (2006b). Clearly, tsunameter measurementsare not only needed for real-time forecasting and warning, but also to quantify
Phil. Trans. R. Soc. A (2006)

C. E. Synolakis and E. N. Bernard2260
what is still a very inexact science as far as developing tsunami magnitude scales,a most basic step. The 1C1 and 2C1 tsunami wave evolution is by now wellunderstood, with uncertainties arising only from the seafloor–water wave motioncoupling that initializes the models. Futile as the exercise of prescribing theprogress of science is, the glaring show-stoppers are obvious.
One, tsunami numerical models must continue to improve through acombination of testing with benchmark laboratory data, instrumental tsunameterrecordings and field inundationmeasurements. Specific emphasis needs to be givento landslide initial conditions and sediment layers, a problem identified almost 10years earlier (Synolakis et al. 1997a,b). The potential hazard from a tsunamisource should never again be underestimated by two orders of magnitude, becauseof the use of untested empirical numerical models. As elsewhere in science, justbecause a numerical model produces results, it does not imply they are meaningfulor always physically realistic. This was painfully demonstrated in the 2005 FallMeeting of the American Geophysical Union where inundation results werepresented for Cascadia with estimates differing by a factor of four frommeasurements from sedimentologic studies. These ‘new’ unreviewed predictionsadversely affected for a few months the credibility and work emergency managersin the Pacific Northwest, who had to explain to their citizenry the differencesbetween peer-reviewed science and the alternatives. Worse, the same model wasused to predict future inundation in southern Sumatra. There needs to be adifferentiation between research and operational modelling, and hopefullyeventually there will not need to be. Until then, validation standards forinundation mapping and tsunami forecasting need to be established, there is nowmore than ever a greater risk of over-reaction than vice-versa.
Two, the forces on structures need to be better understood, particularly sincetsunami floods are really debris floods. Existing methodologies are based onriverine flooding results, and there is little understanding of impulsive or impactloads of small duration or of the uplift pressures from splashing tsunamis. Giventhe survival of places of worship, and their likely use as shelters in the future,whether planned or not, comprehensive simulations need to establish how safe theyreally are. Further, most coastal dwellings andmarine structures are only designedto survive extreme storm loads. Tsunami engineering stands where earthquakeengineering was in 1971, when the San Fernando earthquake in Californiatriggered massive revisions of building codes worldwide. This needs to change.
Three, continental margins in seismic areas around the world need to bemapped at high resolution to allow for better offshore hazard identification.There should never be another incidence of an unrecognized megathrust fault, oran unknown submarine amphitheatre capable of producing a massive slumpthreatening a nearby populated coastline. Palaeotsunami studies must continuewith increased vigour to allow for better identification of the repeat interval oftsunamis to better define risk. Even the Chixulub impact left its trace in thesediment record. Experience suggests that for really extreme events of themagnitude contemplated recently for volcanic flank collapses in the Atlantic,absence of evidence of extensive tsunami inundation is often evidence of absence.
Four, our understanding of the coupling of the seafloor motion with the initialtsunami wave remains marginal in all but the simplest cases. While in the BoxingDay tsunami existing paradigms performed well to first order for far-fieldpropagation, and they appear adequate for tsunami forecasting, they may not
Phil. Trans. R. Soc. A (2006)

2261Tsunami science before and beyond Boxing Day
perform equally well for nearsource forecasting of extreme events, such asseafloor ruptures over 1000 km long, or submarine landslides. The perceiveduncertainty has led to numerous highly speculative mechanisms being proposedfor the 2004 seafloor deformation and how it transferred energy to the tsunami,interestingly all claiming excellent agreement with the same dataset that theresults of simpler models agree with. Seafloor deformations from slumps and solidslides need to be studied time-coupled with the sea-surface waves they trigger todevelop confidence in initializing numerical models to predict the inundation ofnearsource coastlines.
Five, the shortcomings in the population and emergency response observedunderscore the urgent need for a worldwide educational effort on tsunamihazards mitigation. This was most recently underscored with the 2006 Tongaand Kythira, Greece earthquakes. In both events, the shaking was widely felt incoastal regions, but it did not trigger any spontaneous evacuations, as theresidents reportedly were expecting formal warnings. The latter were unlikely tohave been timely, it took longer for the earthquake source motion to becharacterized by the ITWC and the Observatory of Athens (respectively) thanthe travel time of the tsunami to nearby coastlines, had one occurred. Due todeep epicentral depths it did not. Further simply educating local populations atrisk is not enough. In an era of global citizenship, it is important that everyonecan identify the precursors of a tsunami attack and knows to evacuate to highground or inland as quickly as possible, and if not, how to more safely verticallyevacuate to well-built surviving structures.
References
Ambraseys, N. N. 1960 The seismic sea wave of 9 July 1956 in the Greek Archipelago. J. Geophys.Res. 65, 1257–1265.
Atwater, B. F., Musimi, S. Satake, K., Tsuji, Y., Ueda, K. & Yamaguchi, D. K. 2005 The orphantsunami of 1700. US Geological Survey Professional Paper 1707. Washington, DC: USGS.
Bardet, J.-P., Synolakis, C. E., Davies, H. L., Imamura, F. & Okal, E. A. 2003 Landslide tsunamis:recent findings and research directions. Pure Appl. Geophys. 160, 179–1809. (doi:10.1007/s00024-003-2406-0)
Ben-Menahem, A. & Rosenman, M. 1972 Amplitude patterns of tsunami waves from submarineearthquakes. J. Geophys. Res. 77, 3097–3128.
Bernard, E. N. & Vastano, A. C. 1977 Numerical computation of tsunami response for islandsystems. J. Phys. Oceanogr. 7, 389–395. (doi:10.1175/1520-0485(1977)007!0389:NCOTRFO2.0.CO;2)
Bernard, E. N., Mofjeld, H. O., Titov,, V., Synolakis, C. E. & Gonzalez, F. I. 2006 Tsunami:scientific frontiers, mitigation, forecasting, and policy implications. Phil. Trans. R. Soc. A 364,1989–2007. (doi:10.1098/rsta.2006.1809)
Borrero, J. C. 2005 Field data and satellite imagery of tsunami effects in Banda Aceh. Science 308,1596. (doi:10.1126/science.1110957)
Borrero, J. C., Dolan, J. F. & Synolakis, C. E. 2001 Tsunamis within the eastern Santa BarbaraChannel. Geophys. Res. Lett. 28, 643–646. (doi:10.1029/2000GL011980)
Borrero, J. C., Bu, J., Saiang, C., Uslu, B., Freckman, J., Gomer, B., Okal, E. A. & Synolakis,C. E. 2003 Field survey and preliminary modeling of the Wewak, Papua New Guineaearthquake and tsunami of September 9, 2002. Seismol. Res. Lett. 74, 393–405.
Borrero, J. C., Legg, M. R. & Synolakis, C. E. 2004 Tsunami sources in the southern CaliforniaBight. Geophys. Res. Lett. 28, 643–646. (doi:10.1029/2000GL011980)
Phil. Trans. R. Soc. A (2006)

C. E. Synolakis and E. N. Bernard2262
Briggs, M. J., Synolakis, C. E., Harkins, G. S. & Green, D. 1994 Laboratory experiments of
tsunami runup on a circular island. Pure Appl. Geophys. 144, 569–593. (doi:10.1007/
BF00874384)
Briggs, M. J., Synolakis, C. E., Harkins, G. S. & Hughes, S. A. 1995 Large scale three dimensional
experiments of tsunami indundation. In Tsunami: progress in prediction, disaster prevention
and warning (ed. Y. Tsuchiya & N. Shuto), pp. 129–149. Boston, MA: Kluwer.
Brocchini, M. & Peregrine, D. H. 1996 Integral flow properties in the swash zone and averaging.
J. Fluid Mech. 317, 241–273. (doi:10.1017/S0022112096000742)
Camfield, F. E. & Street, R. L. 1966 Shoaling of solitary waves on small slopes. Proc. ASCE
WW95, 1–22.
Carrier, G. F. 1966 Gravity waves of water of variable depth. J. Fluid Mech. 24, 641–659. (doi:10.
1017/S0022112066000892)
Carrier, G. F. & Greenspan, H. P. 1958 Water waves of finite amplitude on a sloping beach.
J. Fluid Mech. 17, 97–110. (doi:10.1017/S0022112058000331)
Carrier, G. F., Wu, T. T. & Yeh, H. 2003 Tsunami runup and drawdown on a plane beach. J. Fluid
Mech. 475, 79–99.
Dalrymple, R. A. & Kriebel, D. L. 2005 Lessons in engineering from the tsunami in Thailand. The
Bridge, Proc. Natl Acad. Eng. 35, 4–13.
Daniellsen, F. et al. 2005 The Asian tsunami: a protective role for coastal vegetation. Science 310, 643.
(doi:10.1126/science.1118387)
Fernando, H. J. S., McCulley, J. L., Mendis, S. G. & Perera, K. 2005 Coral poaching worsens
tsunami destruction in Sri Lanka. EOS 86, 301–304.
Fritz, H. M., Synolakis, C. E. & McAdoo, B. G. 2006 Maldives survey of the 2004 Indian Ocean
Tsumani. Earthquake Spectra EERI Special Volume on 2004 Sumatran Tsunami.
Gardner, C. S., Green, J. M., Kruskal, M. D. & Miura, R. M. 1967 Method for solving the KdV
equation. Phys. Rev. Lett. 19, 1095–1097. (doi:10.1103/PhysRevLett.19.1095)
Geist, E. 1998 Local tsunamis and earthquake source parameters. Adv. Geophys. 39, 117–209.
Geist, E. L., Bilek, S. L., Arcas, D. & Titov, V. V. 2006a Differences in tsunami generation between
the December 26, 2004 and March 28, 2005 Sumatra earthquakes. Earth Planets Space 58,
185–193.
Geist, E. L., Titov, V. V. & Synolakis, C. E. 2006b Tsunami: wave of change. Sci. Am., 56–63.
Goring, D. G. 1978 Tsunamis—the propagation of long waves onto a shelf. Report no. Kh-R-38,
W.M. Keck Laboratory of Hydraulics and Water Resources, California Institute of Technology.
Goto, C. & Shuto, N. 1983 Numerical propagation of tsunami propagation and runup. In Tsunamis
and their engineering, pp. 439–451. Tokyo, Japan: Terrapub.
Gusiakov, V. K. 1990 Tsunamis: their science and hazard mitigation. Proc. International Tsunami
Symposium International Union of Geodesy and Geophysics, Novosibirsk Computing Center,
USSR. Academy of Sciences, US Library of Congress Number 92–246716.
Gutenberg, B. 1939 Tsunamis and earthquakes. Bull. Seismol. Soc. Am. 29, 517–526.
Hall J. V. & Watts, J. W. 1953 Laboratory investigation of the vertical rise of solitary waves on
impermeable slopes. Tech. Memo. 33, Beach Erosion Board, USACE, p. 14.
Hammack, J. L. 1972 Tsunamis—a model for their generation and propagation. Report no. Kh-R-28,
W.M. Keck Laboratory of Hydraulica andWater Resources, California Institute of Technology.
Hibberd, S. & Peregrine, D. H. 1979 Surf and run-up on a beach: a uniform bore. J. Fluid Mech. 95,
323–345. (doi:10.1017/S002211207900149X)
Houston, J. R. 1978 Interaction of tsunamis with the Hawaiian Islands. J. Phys. Oceanogr. 9,
93–102. (doi:10.1175/1520-0485(1978)008!0093:IOTWTHO2.0.CO;2)
Houston, J. R. & Garcia, A. W. 1974a Type 16 flood insurance study. USACE WES Report H-74-3.
Houston, J. R. & Garcia, A.W. 1974b Type 19 flood insurance study. USACEWES Report HL-80-18.
Kajiura, K. 1963 The leading wave of a tsunami. Bull. Earthq. Res. Inst., Univ. Tokyo 41, 535–571.
Kanamori, H. 1972 Mechanisms of tsunami earthquakes. Phys. Earth Planet. In. 6, 346–359.
(doi:10.1016/0031-9201(72)90058-1)
Phil. Trans. R. Soc. A (2006)

2263Tsunami science before and beyond Boxing Day
Kanoglu, U. 2004 Nonlinear evolution and runup–rundown of long waves over a sloping beach.
J. Fluid Mech. 513, 363–372. (doi:10.1017/S002211200400970X)Kanoglu, U. & Synolakis, C. E. 1995 Analytic solutions of solitary wave runup. In Long wave runup
models (ed. H. Yeh, P. Liu C. E. Synolakis). Singapore: World Scientific.Kanoglu, U. & Synolakis, C. E. 1998 Long wave runup on piecewise linear topographies. J. Fluid
Mech. 374, 1–28. (doi:10.1017/S0022112098002468)Kawata, Y. et al. 1999 Tsunami in Papua New Guinea was as intense as first thought. Eos, Trans.
AGU 80, 101. (see also pp. 104–105).Keller, J. B. & Keller, H. B. 1964 Water wave run-up on a beach. ONR Research Report NONR-
3828(00), Department of the Navy, Washington, DC, p. 40.Kerr, R. 2005 Model shows islands muted tsunami. Science 308, 341. (doi:10.1126/science.308.
5720.341a)Kim, S. K., Liu, P. L.-F. & Liggett, J. A. 1983 Boundary integral equation solutions for solitary
wave generation, propagation and run-up. Coastal Eng. 7, 299–317.Lautenbacher, C. C. 1979 Gravity wave refraction by island. J. Fluid Mech. 41, 655–672. (doi:10.
1017/S0022112070000824)Liu, P. L.-F., Synolakis, C. E. & Yeh, H. H. 1991 Report on the international workshop on long
wave runup. J. Fluid Mech. 229, 675–688. (doi:10.1017/S0022112091003221)Liu, P. L.-F., Cho, Y.-S., Briggs, M. J., Kanoglu, U. & Synolakis, C. E. 1995 Runup of solitary
waves on a circular island. J. Fluid Mech. 320, 259–285. (doi:10.1017/S0022112095004095)Liu, P. L.-F., Lynett, P. & Synolakis, C. E. 2003 Analytical solutions for forced long waves on a
sloping beach. J. Fluid Mech. 478, 101–109. (doi:10.1017/S0022112002003385)Liu, P. L.-F., Wu, T.-R., Raichlen, F., Synolakis, C. E. & Borrero, J. 2005a Runup and rundown
generated by three-dimensional sliding masses. J. Fluid Mech. 536, 107–144.Liu, P. L.-F., Lynett, P., Fernando, H., Jaffe, B. E., Fritz, H., Higman, B., Morton, R., Goff, J. &
Synolakis, C. E. 2005b Observations by the International Tsunami Survey Team in Sri Lanka.
Science 308, 1595. (doi:10.1126/science.1110730)Love, A. E. H. 1911 Some problems in geodynamics. New York, NY: Dover.Lynett, P. J., Borrero, J. C., Liu, P. L.-F. & Synolakis, C. E. 2003 Field survey and numerical
simulations: a review of the 1998 Papua New Guinea earthquake and tsunami. Pure Appl.Geophys. 160, 2119–2146. (doi:10.1007/s00024-003-2422-0)
Madsen, O. S. & Mei, C. C. 1969 The transformation of a solitary wave over an uneven bottom.J. Fluid Mech. 39, 781–791. (doi:10.1017/S0022112069002461)
Mei, C. C. 1983 The applied dynamics of ocean surface waves, p 32. New York, NY: Wiley.Okada, Y. 1985 Surface deformation due to shear and tensile faults in a half-space. Bull. Seismol.
Soc. Am. 75, 1135–1154.Okal, E. A. 1982 Mode-wave equivalence and other asymptotic problems in tsunami theory. Phys.
Earth Planet. In. 30, 1–11. (doi:10.1016/0031-9201(82)90123-6)Okal, E. A. 1988 Seismic parameters controlling far-field tsunami amplitudes: a review. Nat.
Hazards 1, 67–96. (doi:10.1007/BF00168222) (see also Erratum 4, p 433).Okal, E. A. 2003 T waves from the 1998 Papua New Guinea earthquake and its aftershocks: timing
the tsunamigenic slump. Pure Appl. Geophys. 160, 1843–1863.Okal, E. A. & Synolakis, C. E. 2004 Source discriminants for nearfield tsunamis. Geophys. J. Int.
158, 899–912. (doi:10.1111/j.1365-246X.2004.02347.x)Pedersen, G. & Gjevik, B. 1983 Runup of solitary waves. J. Fluid Mech. 135, 283–390. (doi:10.
1017/S0022112083003080)Peregrine, D. H. 1966 Calculations of the development of an undular bore. J. Fluid Mech. 35,
321–330. (doi:10.1017/S0022112066001678)Peregrine, D. H. 1967 Long waves on a beach. J. Fluid Mech. 35, 321–330.Raichlen, F. 1966 Harbor resonance. In Coastline and estuarine hydrodynamics (ed. A. T. Ippen),
pp. 281–340. New York, NY: McGraw-Hill.Raichlen, F. & Synolakis, C. E. 2004 Runup from three dimensional sliding masses. Long Waves
Symposium (ed. M. Briggs Ch. Koputitas) pp. 246-256. Salonica, Greece.
Phil. Trans. R. Soc. A (2006)

C. E. Synolakis and E. N. Bernard2264
Ramsden, J. D. & Raichlen, F. 1990 Forces on vertical wall caused by incedent bores. J. Waterway
Port Coast. Ocean Eng. ASCE 116, 592–613.Russel, J. S. 1845 Report on waves. Report of the 14th Meeting of the British Association for the
Advancement of Science, John Murray, London, pp. 311–390.Satake, K., Shimazaki, K., Tsuji, Y. & Ueda, K. 1996 Time and size of a giant earthquake in
Cascadia inferred from Japanese tsunami. Nature 379, 203–204. (doi:10.1038/379246a0)Satake, K. 2007 Tsunamis, Treatise on Geophysics (ed. G. Schubert), vol. 4. Elsevier.Shen, M. C. & Meyer, R. E. 1963 Climb of a bore on a beach. Part 3. Runup. J. Fluid Mech. 16,
113–125. (doi:10.1017/S0022112063000628)Sieh, K. 2005 Aceh-Andaman earthquake: What happened and what’s next? Nature 434, 573–574.
(doi:10.1038/434573a)Skjelbreia, J. E. 1987 Observations of breaking waves on sloping bottoms by use of laser doppler
velocimetry, PhD thesis., p. 211. Pasadena, CA: California Institute of Technology.Smith, W. H. F., Scharroo, R., Titov, V. V., Arcas, D. & Arabic, B. K. 2005 Satellite altimeters
measure tsunami. Oceanography 18, 11–13.Stein, S. & Okal, E. A. 2005 Speed and size of the Sumatra earthquake. Nature 434, 581–582.
(doi:10.1038/434581a)Synolakis, C. E. 1986 The runup of long waves. Ph.D. thesis, California Institute of Technology,
Pasadena, CA 91125, p. 228.Synolakis, C. E. 1987 The runup of solitary waves. J. Fluid Mech. 185, 523–545. (doi:10.1017/
S002211208700329X)Synolakis, C. E. 2002 Tsunami and seiche. In Earthquake engineering handbook (ed. W.-F. Chen &
C. Scawthorn), pp. 9-1–9-90. New York, NY: CRC Press.Synolakis, C. E. & Kong, L. 2006 Runup measurements of the December 26 2004 Indian Ocean
tsunami. Earthquake Spectra 22, S3(June).Synolakis, C. E. & Okal,, E. A. 2005 1992–2002: perspective on a decade of posttsunami surveys.
Adv. Nat. Technol. Hazards 23, 1–30.Synolakis, C. E., McCarthy, R. & Bernard, E. N. 1997a Evaluating the tsunami risk in California.
In Proc. ASCE California and the World Ocean ’97, San Diego, CA, pp. 1225–1236.Synolakis, C. E., Liu, P., Carrier, G. & Yeh, J. 1997b Tsunamigenic sea-floor deformations. Science
278, 598–600. (doi:10.1126/science.278.5338.598)Synolakis, C. E., Bardet, J. P., Borrero, J. C., Davies, H., Okal, E. A., Silver, E. A., Sweet, S. &
Tappin, D. R. 2002 Slump origin of the 1998 Papua New Guinea tsunami. Proc. R. Soc. A 458,763–789. (doi:10.1098/rspa.2001.0915)
Tadepalli, S. & Synolakis, C. E. 1994 The runup of N-waves on sloping beaches. Proc. R. Soc. A
445, 99–112.Tadepalli, S. & Synolakis, C. E. 1996 Model for the leading waves of tsunamis. Phys. Rev. Lett. 77,
2141–2144. (doi:10.1103/PhysRevLett.77.2141)Tinti, S. & Toni, R. 2005 Analytical evolution of tsunamis induced by nearshore earthquakes on a
constant-slope ocean. J. Fluid Mech. 535, 33–64. (doi:10.1017/S0022112005004532)Titov, V. V. & Synolakis, C. E. 1995 Modeling of breaking and non-breaking long-wave evolution
and runup using VTCS-2. J. Waterway Port Ocean Coast. Eng. 121, 308–316. (doi:10.1061/
(ASCE)0733-950X(1995)121:6(308))Titov, V. V. & Synolakis, C. E. 1998 Numerical modeling of tidal wave runup. J. Waterway Port
Ocean Coast. Eng. 124, 157–171. (doi:10.1061/(ASCE)0733-950X(1998)124:4(157))Titov, V. V., Gonzlez, F. I., Bernard, E. M., Eble, M. C., Mofjeld, H. O., Newman, J. C. &
Venturato, A. J. 2005a Real-time tsunami forecasting: challenges and solutions. Nat. Hazards35, 45–58. (doi:10.1007/s11069-004-2403-3)
Titov, V. V., Rabinovich, A. B., Mofjeld, H. O., Thomson, R. E. & Gonzalez, F. I. 2005b The
global reach of the 26 December 2004 Sumatra tsunami. Science 309, 2045–2048. (doi:10.1126/science.1114576)
Tuck, E. O. & Hwang, L. S. 1972 Long wave generation on a sloping beach. J. Fluid Mech. 51,449–461. (doi:10.1017/S0022112072002289)
Phil. Trans. R. Soc. A (2006)

2265Tsunami science before and beyond Boxing Day
Ward, S. N. 1980 Relation of tsunami generation and an earthquake source. J. Phys. Earth 28,441–474.
Ward, S. N. 2001 Landslide tsunami. J. Geophys. Res. 106, 11 201–11 215. (doi:10.1029/2000JB900450)
Whitham, G. B. 1958 On the propagation of shock waves through regions of nonuniform area offlow. J. Fluid Mech. 4, 337–360. (doi:10.1017/S0022112058000495)
Wiegel, R. L. 1955 Laboratory studies of gravity waves generated by the movement of a submergedbody. Trans. AGU 36, 759–774.
Yeh, H., Imamura, C. E., Tsuji, Y., Liu, P. L.-F. & Shi, S. 1993 The Flores island tsunamis.Eos Trans. AGU 7, 369 371–373.
Yeh, H., Liu, P. L.-F., Briggs, M. & Synolakis, C. E. 1994 Tsunami catastrophe in Babi Island.Nature 372, 6503–6508.
Zelt, J. A. 1991 The runup of breaking and nonbreaking solitary waves. Coast. Eng. 125, 205–246.(doi:10.1016/0378-3839(91)90003-Y)
Phil. Trans. R. Soc. A (2006)