Embed Size (px)
Citation preview

TSUNAMI RISK REDUCTION
Are we better prepared today than in 2004?
Authors
Norwegian Geotechnical Institute / Finn Løvholt, Carl B. Harbitz, Farrokh Nadim
UNU-EHS / Joern Birkmann, Neysa J. Setiadi, Claudia Bach
University of Colombo / Nishara Fernando
Prepared for the Global Assessment Report on Disaster Risk Reduction 2015
31 January 2014
INPUT PAPER

2
Table of Contents Background .................................................................................................................... 3
Progress in Understanding and Mapping Tsunami Hazard .................................................. 4
Progress in Understanding and Assessing Exposure and Vulnerability ................................. 5
Physical vulnerability ................................................................................................... 6
Mortality .................................................................................................................. 6
Building fragility ....................................................................................................... 7
Societal vulnerability .................................................................................................... 8
Spatial exposure and demographic factors ................................................................. 9
Tsunami awareness ................................................................................................ 10
Early warning and evacuation .................................................................................. 10
Factors related with reconstruction and restoring livelihoods ...................................... 11
Progress in Using Hazard and Vulnerability Information .................................................... 12
Consideration of vulnerability aspects in urban planning ................................................ 12
Consideration of vulnerability aspects in early warning .................................................. 14
Consideration of vulnerability aspects in awareness raising ............................................ 14
Identified Gaps .............................................................................................................. 14
Conclusions and Recommendations ................................................................................. 16
References .................................................................................................................... 18

3
Background Recent disasters triggered by natural hazards provide further evidence of the need for Disaster Risk Reduction (DRR) strategies that address the mitigation of hazard impact and reduction of vulnerability and its root causes. This need is also stressed by the post-2015 Hyogo Framework for Action process. In this context, tsunamis have played an important role due to their devastating impacts, exemplifying the tremendous fatalities and losses that could have been reduced by effective risk reduction activities. With over 220,000 fatalities, the 26th December 2004 Indian Ocean tsunami was one of the deadliest disasters triggered by a natural hazard event (MunichRE 2013a). It demonstrated the need for more research, improved planning activities, awareness raising, as well as the need for establishing early warning systems (UNISDR 2005). The Indian Ocean tsunami provided important lessons for developing the Hyogo Framework for Action (HFA) and sharpened the commitment for its implementation (UNISDR 2009).
Although a variety of tsunami risk reduction measures, such as the establishment of the Indian Ocean tsunami early warning system, have been implemented since then, additional tsunamis occurring during the last decade illustrated remaining deficiencies. The 11th March 2011 Tohoku Earthquake and subsequent tsunami causing a nuclear catastrophe is just the most recent example (Table 1). The tsunami hitting the Mentawai Islands in Indonesia on 24th October 2010 is another. Both events occurred in regions were tsunami risk prevention measures had been implemented.
Year Country/ies affected Economic losses (million US $)
Fatalities
26th December 2004 Sri Lanka, Indonesia, Thailand, India, Bangladesh, Myanmar, Maldives, Malaysia
11,200 220,000
17th July 2006 Indonesia 55 802
2nd April 2007 Solomon Islands Several millions 112
29th September 2009 Samoa and American Samoa 150 177
27th February 2010 Chile 30,000 520
24th October 2010 Indonesia - 530
11th March 2011 Japan 210,000 15,840
Table 1: Tsunamis worldwide and related economic losses and fatalities between 2004 and 2013 (Sources: MunichRE 2013a, 2013b and CRED 2014)
In the past decade, tremendous efforts have been made by the international community in order to develop DRR methodologies and strategies which allow policy makers and practitioners to actively engage in disaster risk management. These encompass, for example, the identification of areas at risk including hazard mapping activities (Kanakubo et al. 1980). On the other hand, it is realized that disaster risk is determined by additional factors than hazard intensity and extension of inundated areas. This has led to the integration of

4
susceptibility and coping factors into risk assessment methodologies (Liverman 1990, Blaikie et al 1994, Cutter et al. 2003, Birkmann 2013 and most recently also IPCC 2012).
Although the tools for tsunami hazard, exposure, and vulnerability assessment are available from a scientific point of view, it remains unclear whether they are actually used in national and regional DRR efforts. It is thus the aim of this paper to review the application of DRR methodologies with regard to tsunami risk, with focus on southeast Asia, especially Indonesia and Sri Lanka which were highly impacted by the 2004 Indian Ocean Tsunami. Measures for bridging the potential implementation gap are also discussed.
Progress in Understanding and Mapping Tsunami Hazard Before 2004, and for a few years after the Boxing Day tsunami, tsunami hazard assessment was mainly based on worst case scenario analysis (Tinti and Armigliato 2003; Legg et al., 2004; Hebert et al., 2005; Løvholt et al. 2006; Okal et al., 2006; Venturato et al., 2007; Lorito et al. 2008). Worst scenarios are used to delineate the possible impact of high consequence events of a relatively small likelihood. In the design of the tsunami sources, information regarding the seismicity and tectonics are utilized if available. As tsunamis having long return periods are believed to dominate the risk (Nadim and Glade, 2006), the worst case scenario approaches may sometimes be preferable due to the large uncertainty linked to events having return periods of hundreds or even thousands of years. Furthermore, scenarios are often useful in areas having a complex tectonic or geological setting with too limited information to conduct a proper probabilistic analysis (Løvholt et al., 2012a).
Throughout the last decade, probabilistic methods for estimating the tsunami hazard has become increasingly popular. The Probabilistic Hazard Assessment method (PTHA) was develop during the eighties (Lin and Tung, 1982; Rikitake and Aida, 1988), but was sparsely used before the 2004 Boxing Day tsunami. PTHA is largely based on Probabilistic Seismic Hazard Analysis (PSHA) originally proposed by Cornell (1968) and is well documented in many references (e.g. SSHAC, 1997). The application of PTHA was revitalized following the Boxing Day tsunami, largely due to the developments of Geist and Parsons (2006). In recent years, PTHA has been utilized to quantify the probability of the tsunami metric (usually the run-up height) in a number of areas (Annaka et al., 2007; Burbidge et al., 2008; Parsons and Geist, 2009; Gonzalez et al., 2009; Thio et al., 2010; Sørensen et al., 2012). The PTHA framework is usually implemented by assuming linearity, which allows construction of events by superposition from a large amount of unit sources. By pre-computing and storing the tsunami waveforms at points along the coast generated by each subfault for a unit slip, the tsunami waveforms are synthesized for any slip distribution by summing the individual subfault tsunami waveforms (weighted by their slip). This approach makes it feasible to use summation which eases computational load. Probabilities may be assigned to each source through a recurrence model. The linear assumption holds for small amplitude-to-depth-to-amplitude- ratios, but extra measures have to be taken to allow for simulating shoaling and inundation.
A crucial element in PTHA is the estimation of the frequency of occurrence and maximum magnitudes of large tsunami-generating earthquakes in each source region. Due to the very short historical record for mega-thrusts and other large earthquakes in relation to their

5
recurrence times, it is not possible to base such constraints directly on the observed seismicity. In recent history, we have not seen events similar to the size of the 2004 Indian Ocean tsunami and the 2011 Tohoku tsunami locally in these regions. However, we now know that megathrust events such as the 1960 Chile and 1964 Alaska along other faults zones should have been sufficient to warrant caution. Although subduction zones are different, the potential for large megathrust events should therefore not be ruled out along any large subduction zone as our present understanding on how to discriminate them are still limited (Stein and Okal, 2007). For hazard assessment, tsunami hazard modellers may need to be conservative. A possible conservative strategy is to take into account the tectonic convergence rate and assume fault locking over the entire return period. This method has been utilized in the methodology for estimating the tsunami hazard for the UN-ISDR Global Assessment reports in 2009 and 2013 (UN-ISDR, 2009; Løvholt et al., 2012b; UN-ISDR, 2013; Løvholt et al., submitted).
Progress in Understanding and Assessing Exposure and Vulnerability Vulnerability is a multi-faceted concept that has different definitions depending on the context and discipline. In natural sciences and engineering, vulnerability often refers to the physical vulnerability of the exposed population or elements at risk, and is quantified on a scale of 0 (not damage and/or very little chance of being killed) to 1 (complete destruction and/or certain death). In social sciences, the term vulnerability refers to societal
Box 1: Stakeholders´ involvement in development of the tsunami hazard map in Padang city, Indonesia
The city of Padang, Indonesia, has been recognized as a tsunami-‐prone area, where a potential major earthquake and tsunami could occur in the near future. As part of the tsunami risk reduction efforts in the city, various international scientific groups as well as local actors developed tsunami hazard maps as basis for mitigation and evacuation planning. However, the hazard information contained in the maps (hazard zone) was significantly different due to different approaches and basis data used. As of August 2008, at least eight different hazard maps were identified (GTZ, personal communication 2008).
The so-‐called “Padang consensus” meetings were conducted as a platform for different groups of international and national scientists, as well as local decision makers, to discuss the most acceptable hazard scenario and mapping approach for the city. Agreement was reached on the following major issues: earthquake source scenario (e.g. most plausible worst case, multi-‐scenario probability approach), basis data (topographical, bathymetry), and modelling parameters (e.g. consideration of roughness coefficient, consideration of buildings that modify the tsunami wave energy and potentially inundated areas). Despite ongoing discussion on the most suitable planning basis and existing uncertainty, such a process has provided an opportunity of reconciling various state-‐of-‐the-‐art scientific findings and has been a showcase of a science-‐policy platform in advancing tsunami hazard information.

6
vulnerability, which is related to exposure, susceptibility and fragility of the society, as well its capacity to react to a hazardous event. Both concepts are important in understanding and reducing the risk posed by tsunamis and great progress has been made on both fronts since 2004.
Physical vulnerability Physical vulnerability to tsunamis is a relatively unexplored discipline, and few reliable models exist. There is thus a need for improving the tsunami vulnerability models. However, this is also a field where substantial development is currently being made.
The Tsunami Pilot Study Working Group (2006) lists the following tsunami parameters as possible impacts metrics (intensity measures) that may enter as parameters in tsunami models for assessment of mortality, building damage and forces on structures:
• Tsunami flow depth • Wave current speed • Wave current acceleration • Wave current inertia component (product of acceleration and flow depth) • The momentum flux (product of squared wave current speed and flow depth). In
many circumstances, this is the best damage indicator.
The above-mentioned parameters are important in estimating the expected number of fatalities for a tsunami scenario, as well as the wave forces on structures. The selection of the flow depth is obvious, being a direct measure of the thickness of the flowing water; the flow depth is also influencing the current velocity. The fluid force on a structure is proportional to the momentum flux, as well as impact forces of flotsam, and hence also a natural possibility as an impact metric. Perhaps more surprising is the inclusion of the wave current acceleration. However, a tsunami wave that run-up on the beach will often accelerate when it hits the shoreline after breaking (Synolakis, 1987), and this effect may be counterintuitive for a lay person observing the tsunami, leading to a misinterpretation of the escape time. The physical vulnerability would be a product of the fragility or the different likelihoods of buildings to collapse.
Mortality In a national tsunami risk evaluation for New Zealand, Berryman et al. (2005) suggested an empirically derived mortality model solely based on the flow depth of the tsunami (Figure 1). A similar model based on the flow depth was suggested by Reese et al. (2007), also shown in Figure 1. The latter model includes all casualties (both injuries and fatality). Another model distinguishing between fatalities and injuries are included also in Berryman et al. (2005) (not shown). The latter model is a typical example of most mortality models in current practice, assuming that no warning systems are available. It parameterizes the amount of people present in buildings at nighttime or daytime. Apparent from both models shown in Figure 1, there is large spread in the mortality and casualty as a function of the flow depth, suggesting that other factors than the flow depth influences the vulnerability.
7
Figure 1 : Left: Empirical vulnerability (mortality) model of Berryman et al. (2005). Right: Empirical vulnerability (injuries and death), red and blue markers indicate casualties caused by the 2006 Java tsunami, black markers other events (Reese et al. 2007).
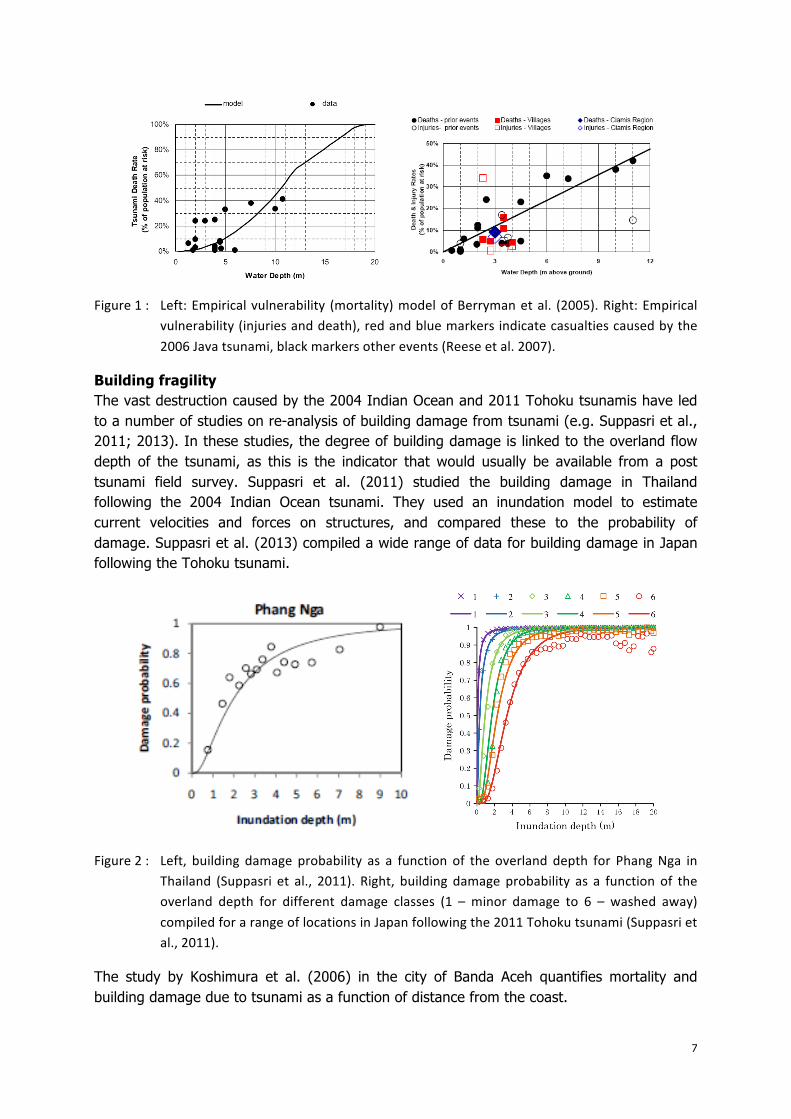
Building fragility The vast destruction caused by the 2004 Indian Ocean and 2011 Tohoku tsunamis have led to a number of studies on re-analysis of building damage from tsunami (e.g. Suppasri et al., 2011; 2013). In these studies, the degree of building damage is linked to the overland flow depth of the tsunami, as this is the indicator that would usually be available from a post tsunami field survey. Suppasri et al. (2011) studied the building damage in Thailand following the 2004 Indian Ocean tsunami. They used an inundation model to estimate current velocities and forces on structures, and compared these to the probability of damage. Suppasri et al. (2013) compiled a wide range of data for building damage in Japan following the Tohoku tsunami.
Figure 2 : Left, building damage probability as a function of the overland depth for Phang Nga in Thailand (Suppasri et al., 2011). Right, building damage probability as a function of the overland depth for different damage classes (1 – minor damage to 6 – washed away) compiled for a range of locations in Japan following the 2011 Tohoku tsunami (Suppasri et al., 2011).
The study by Koshimura et al. (2006) in the city of Banda Aceh quantifies mortality and building damage due to tsunami as a function of distance from the coast.

8
Reese et al. (2007) established a fragility model for building damage based on damage observations following the 2006 Java tsunami. They investigated the damage ratio (cost to repair/cost to replace) for four different building types as a function of the flow depth. An example of the observed damage ratio for traditional brick buildings with reinforced concrete is shown in Figure 3.
Figure 3 : Example of building fragility models due to the 2006 Java tsunami, damage ratio for traditional brick buildings with reinforced concrete columns following the 2006 Java tsunami (Reese et al., 2007)
It should be noted that the one parameter models described above are too simplistic. In general, a reliable quantification of physical vulnerability or expected mortality rate should take into account all important factors that could possibly affect the elements at risk. These include all the damage metrics listed above, but also parameters like tsunami warning time, time of day, population distribution, population age, population awareness, building design, etc.
Societal vulnerability There has been much progress in understanding the societal vulnerability factors, as well as in development of assessment methodologies in recent years. Some important vulnerability factors were revealed by the Indian Ocean Tsunami in 2004, which devastated the Province of Aceh, Indonesia, and many coastal districts of Sri Lanka. The especially high number of victims was due to the very low – if any – preparedness of the impacted regions to such an extreme tsunami event. Further factors have also emerged in the ongoing process of the development of an end-to-end tsunami early warning system and tsunami preparedness in the Indian Ocean region, especially in Indonesia.
The following factors were identified as important indicators of societal vulnerability on the basis of the existing studies in the 2004 Indian Ocean Tsunami affected areas in Aceh, Indonesia, as well as in-depth case studies in the tsunami-prone city of Padang, Indonesia (Taubenböck et al. 2013; Setiadi upcoming; Birkmann et al. 2008) and in the city of Galle, Sri Lanka (Birkmann et al. 2007; Birkmann and Fernando 2008; Fernando 2012; Fernando and Punchihewa 2013). The studies used various quantitative and qualitative data collection

9
and analysis methods, combining existing statistical and spatial data, as well as additional data from household surveys, non-structured and in-depth interviews, and focus group discussions (further information on the data, methodology, and analysis results can be found in the above-mentioned references).
Spatial exposure and demographic factors Exposure in various hazard zones can be mapped using remote sensing data and geo-information systems combining the hazard information with the data about population density, location and typology of buildings, critical facilities, etc. Population data are normally obtained from the available statistical data (population census) at the lowest administrative level, while data about the building stock are often obtained by means of remote sensing analysis (e.g. Taubenböck et al. 2008).
The relevant factors are particularly the density of development in the coastal areas and its relation with the existence of vulnerable groups (cf. Oxfam, 2005; Rofi et al 2006; Birkmann 2007). The spatial exposure of the population and buildings in the coastal areas, which are located near the coastline contributed largely to the magnitude of fatalities and damages in Indonesia.
Similarly in Sri Lanka, people within the 100 m zone from the shoreline were more likely to die and to be seriously injured than people living outside this zone although inundation in many cases stretched inland across the 200 and 300 m zones. The same accounted for housing damage. Using the example of the district of Galle, about 50 % of the houses within the 100m zone were totally damaged or damaged partially but could not be used anymore as compared to about 20 % outside this area (Figure 4) (Birkmann et al. 2007).
Figure 4 : Housing damage inside and outside the 100 m zone in Galle (Source: Birkmann et al. 2007, p 29).
Moreover, many reports mentioned that the differences in the mortality rates among different population groups were correlated with demographic factors, especially age and gender (Oxfam, 2005; Rofi et al, 2006). In Aceh, the number of female, children and elderly victims was much higher / less likely to survive than of other population groups. This seems to relate with their differentiated exposure (Oxfam, 2005), e.g. many male population

10
conducted activities outside exposed areas and women were carrying children with them, and their physical capability. For Sri Lanka, using the example of Galle, also showed that age and gender played a significant role. While among the dead and missing people, children younger than 9 years (25 %) as well as people aged 40 or older (44 %) were most vulnerable1, two thirds of the dead and missing were women2.
Exposure in various hazard zones can be mapped using remote sensing data and geo-information systems combining the hazard information with the existing population (and others like buildings, critical facilities, etc.) data. Population data is normally attainable from the available statistical data (population census) at lowest administrative level, while data at the building level is normally made available by means of remote sensing analysis (e.g. Taubenböck et al. 2008). An exposure analysis for the city of Padang was conducted for population groups with different evacuation (physical) capability, using activity dairy as part of household surveys, combined with local statistics and building data from remote sensing analysis (Setiadi et al. 2010). It emphasizes differentiated exposure due to spatial distribution of the city functions (building uses) and characteristics of the population such as working activities, gender, income groups (Setiadi, upcoming).
Tsunami awareness Knowledge and education about tsunamis are essential with regard to taking evacuation action. It is obvious that there was hardly any knowledge about tsunamis in the affected areas in Indonesia and Sri Lanka prior to 2004. In Aceh, an ADRC Survey in Oct-Dec 2005 (ADRC, 2005) in Banda Aceh and Aceh Besar showed that most of the Aceh population had never heard about tsunamis before the Boxing Day event (88.50%). The others (11.50%) said that they have heard about a big sea wave coming to land (from Islamic story telling) from family, friends, books, from schools or television. In Sri Lanka, less than 10% of the respondents any tsunami knowledge before 2004 (Jayasinghem and J. Birkmann 2007, p. 47). Such lack of knowledge consequently led to lack of preparedness to such an extreme event. This was identified as a main reason for the high number of fatalities – specifically as many people ran to the beach to watch the setback of the sea (Amarasinghe 2007, p. 50).
Early warning and evacuation The factors related to early warning and evacuation were particularly explored further and assessed in the case study of Padang, Indonesia.
Access to safe places or available infrastructure (transportation networks) for evacuation also determine the evacuation time. For example, various modeling methods were developed and utilized to estimate the evacuation time and identifying the need for evacuation measures in the city of Padang like additional bridges, roads, vertical shelters (cf. Lämmel 2011; di Mauro et al. 2013; Muhari et al. 2012). Furthermore, locations with high proportion of vulnerable people (informal settlements, schools, hospitals, and lower class settlement areas) should be factored in the provision of evacuation shelters, improvement of evacuation routes, and provision of vehicle support, as well as designing evacuation shelters oriented to meet the specific needs of these groups (Setiadi, upcoming).
1 In absolute terms, the youngest age group shows the most fatalities. 2 Similar findings were also generated through studies in India (Guha-Sapir et al. 2006)
11
Access to warning was assessed using household survey, survey in critical facilities and spatial data on location of warning devices resulting different levels of access to warning due to dynamic population distribution (Setiadi upcoming). Moreover, access and utilization of private devices to receive warning information is proven to be related with socio-economic characteristics (income, gender, age) (ibid.). Thus, the allocation of public broadcasting devices needs to take into consideration such conditions.
Evacuation behaviour determines the utilization and effectiveness of the existing infrastructure and technical measures. The data analysis in Padang showed that evacuation bottlenecks are likely to occur due to the delays in evacuation decisions at household level, lack of harmonized evacuation arrangements, gaps in knowledge of recommended safe places, and the preferred use of available motorized vehicles as mode of evacuation (Setiadi upcoming). Moreover, correlation and regression analysis of the cognitive factors derived from household surveys showed a significant influence of cognitive factors influencing the intention to conduct reactive (evacuation after a warning) and proactive (support and participation in the improvement of evacuation infrastructures) action (Setiadi upcoming). Various cognitive factors related to objective knowledge (e.g. indicators of tsunami occurrence) and socio-psychological factors (e.g. recognition of lack of preparedness, concerns of livelihoods) needs to be incorporated into the development of risk communication strategies (ibid.).
The case study of Padang also revealed that the gender, age, income level, and ethnic groups played a role in response capability of the population, such as differentiated exposure, level of awareness, access to existing measures and facilities (Setiadi upcoming). Different strategies should be developed to meet the needs of different social groups.
Factors related with reconstruction and restoring livelihoods On this aspect, additional susceptibility and coping factors were identified particularly in the case study of Sri Lanka. Here, income and employment were revealed as important factors. Low income groups considerably lost income in the aftermath of the tsunami and were more likely to lose their jobs than those households with comparatively high income (21,000 rupees or more) (Birkmann et al. 2007, p. 30 f).
The economic and financial status also played an important role with respect to coping with the tsunami impacts since low income households require a longer period of time to reconstruct housing and/or replace other damages (Birkmann et al. 2007, p. 32, Wisner 2002). In this respect, the occupation of the household head played an important role. Specifically those households with a lower economic and financial status were over-proportionally exposed in the 100, zone as compared to higher income groups. The land title is an additional factor being closely related to financial status and the marginal living spaces of lower income groups (the number of illegal settlers is twice as high in the 100m high risk zone than outside of it, Birkmann and Fernando 2008, p. 97) is the land which was also found to play an important role with respect to recovery. While house owners or those renting housing needed about a year to recover from the tsunami, those living in informal settlement needed almost four times as long (based on the median of answers) (Figure 5). Households without a land title can also be regarded as potentially more vulnerable since it

12
serves also as economic and livelihood resource which can even be sold in times of crisis (Satterthwaite 2000).
Figure 5 : House damage and land title (Source: Birkmann et al. 2007, p. 35).
Comparing the case studies of Galle and Batticaloa, people in Batticaloa were found to have difficulties in recovering from the hazard impact due to lower job diversity, an overall lower income and limited options for opening an employment – all results of the armed conflict of the past two decades (Jayasinghem and J. Birkmann 2006, p. 45).
Progress in Using Hazard and Vulnerability Information The research conducted in the two case study areas shows that a variety of factors play an important role for determining the hazard impact. These include generic factors such as distance to the sea, and disaster risk management specific factors regarding early warning and evacuation as well as resettlement strategies. Various tsunami risk reduction measures have been developed since 2004, especially with regard to improvement of urban planning, tsunami early warning system, and tsunami awareness.
Consideration of vulnerability aspects in urban planning Vulnerability patterns towards tsunami risk were found to be more distinct within the 100 m zone with respect to exposure but also susceptibility and (lack of) coping capacities. Accordingly, the development of a buffer or no construction zone where building is restricted by urban development was suggested (Birkmann and Fernando 2008, p. 99). In Sri Lanka, buffer zones of 100m and 200m respectively were initially discussed but suggested to be reduced to 50 m after the election in 2007 (ibid.)) causing insecurity with respect to (individual) investment decisions and tensions (Birkmann and Fernando 2007, p. 53). Accordingly, buffer zones have to be developed consistently and transparently while considering the needs of different household types such as fishermen (ibid.). Overall, the implementation of buffer zones can be a challenge specifically due to the scarcity of land close to the original settlements (Birkmann 2007, p. 63 f).

13
With regards to exposure reduction, tsunami hazard considerations were integrated into the city spatial plan of the Indonesian city of Padang (RTRW 2010-2030). Based on the new plan, the area where the tsunami hazard level is high and very high should be used asopen space.. The development in the coastal areas should also be oriented rather towards non-settlement development with lower density. The seismic building code is more strictly applied especially for new buildings in the hazard zone. However, specific protection standards for facilities or buildings with more vulnerable people (hospitals, schools, even settlements) are still needed.
With respect to the establishment of buffer zones, resettlement played an important role in the aftermath of the 2004 tsunami and the respective reconstruction efforts. This is also the case in the already densely built coastal areas with high tsunami hazard level (like in the case of Padang). However, resettlement strategies are still discussed in the context of the establishment of no construction/development areas. Resettlement decision can thereby be influenced by a variety of factors. In Galle, Sri Lanka the decision was e. g. shaped by characteristics such as the lack of a land title (Birkmann and Fernando 2008, p. 100) or the level of destruction of the housing (Grote et al 2007). It appears that immediately after the tsunami event the affected households might have been traumatized and not being able to start a new life at a different location (ibid., p. 72). Relatives in the resettlement areas instead served as pull factors (Grote et al 2007, p. 74).
Other studies (Birkmann et al. 2007; Fernando 2012) demonstrated that most of the people displaced due to tsunami – except for the households in the buffer zone that were engaged in fishery - preferred to move outside the affected areas, but still wanted to keep their access to the previous locations. In contrast, the enforcement of the buffer zone regulation by the Sri Lankan government forced those people to move to new settlements far away from their previous locations, due to limited available space (Fernando 2012). In spite of government´s efforts to implement an inclusive resettlement policy, most of the relocatees were not fully involved in the relocation process. Identification of beneficiaries to handover houses was done by the government officials through a process that was not transparent. No proper vulnerability assessment was conducted by either the donors or the government officials among the selected beneficiaries in order to identify those households with inherent or other socio-economic vulnerabilities who needed more assistance in the relocation process to gradually adapt to the new location (Fernando and Punchihewa 2013).
The resettlement process caused multiple stress factors such as long distance to the city, lack of employment opportunities in the new place, lack of common services, conflicts between new and old settlers for common property resources, more expenses for electricity, water and transportation, and poor quality houses, which especially affected the vulnerable households. This in turn forced many of the relocatees to move back to the buffer zone illegally by renting, closing or selling their new houses in the new settlements several years after the relocation. Consequently, they are once again exposed to tsunami and other coastal hazards (Fernando 2012; Fernando and Punchihewa 2013). This highlights the need for a people-centred resettlement process from the beginning in order to ensure an effective disaster risk reduction (Fernando and Punchihewa 2013).

14
Consideration of vulnerability aspects in early warning Overall, Indonesia has made significant progress in incorporating early warning systems (including tsunami) in development planning. Development of early warning systems is among the five key priorities in the National Action Plan for Disaster Reduction 2006-2009 (UNDP, 2009). The development of Tsunami Early Warning System in Indonesia, in cooperation with local authorities and disaster management bodies, has been advancing in the past decade. In the city of Padang, the new disaster management body was established in 2009, and it has been coordinating with various local governmental and non-governmental actors in tsunami risk reduction efforts. The tsunami hazard map was utilized as a basis of evacuation planning (an official evacuation map was developed based on the agreed hazard zone and urban physical boundaries), which were disseminated through street billboards and leaflets to the community.
Additionally, the needs of vertical evacuation shelters in the coastal districts, including in the city of Padang was recognized and funding have been allocated by the National Disaster Management Agency. In this respect, several new vertical evacuation shelters were constructed especially after the earthquake event in September 2009 in Padang as part of reconstruction activities, mostly in form of multifunctional, multistory buildings (e.g. schools), as well as large space for evacuation hills were allocated. It was also mentioned in the spatial plan, that the planning of evacuation shelters need to take into account the women, children, and elderly. Thus, specific information such as spatio-temporal distribution of vulnerable groups, but also evacuation behaviour still needs to be considered in the future planning of such facilities.
Despite of these developments, the tsunami that hit Mentawai Islands in 2010, killing more than 500 persons, demonstrated that significant challenges remain in designing a successful early warning system for tsunamis. Although a tsunami warning was issued, only a few people were able to evacuate at Mentawai. This shows that more progress needs to be made both with respect to the warning architecture in poorly-developed regions, and with respect to building tsunami awareness in exposed areas.
Consideration of vulnerability aspects in awareness raising Various awareness raising and community preparedness activities were arranged by local NGOs in the city of Padang. Different approaches were applied (involvement of religious and community leaders, focusing on emergency training, community evacuation planning, etc.) and various social groups in the city were covered. Additionally, city-wide tsunami drills were conducted regularly, and tsunami knowledge is now incorporated in school activities (to be institutionalized as a formal curricula). Information and criteria from the vulnerability analysis related to cognitive factors of various social groups have also been used to assess the impact of community capacity building activities. However, this has only been done in a pilot scale.
Identified Gaps From a methodological perspective, important progress has be made in the last decade advancing from hazard mapping to the identification of vulnerability factors and the development of methodologies to analyse the overall tsunami risk. Some of these tools are applied in Disaster Risk Management activities at national and local levels. However, they

15
often encompass the use of hazards maps only for the establishment of buffer zones without any further planning of construction/development areas or evacuation routes. More advanced methodologies encompassing vulnerability factors have not been integrated into risk management activities. In addition, the incorporation of the existing vulnerability information into DRM is still low and existing information is not translated systematically into action.
Another challenge found from the case study of Padang, Indonesia was the inexistence of centralized database and information sharing among different agencies and local and regional institutions in the city. The information is often scattered or stored locally, and consequently it is difficult to use and update vulnerability information systematically. At the moment there are also no standardized common guidelines on tsunami vulnerability and risk assessment (cf. LIPI/DLR/UNU-EHS 2011; Permen PU 6/PRT/M/2009 Indonesian Public Work Ministry´s guidelines on infrastructure planning in tsunami prone areas), that may impede continuous monitoring of vulnerability to tsunamis. There is also trade-off between the level of detail of assessment and the costs: the more detail, the more cost intensive. Costs of vulnerability assessment should be properly budgeted to ensure its sustainability.
The systematic utilization of vulnerability information related to people´s response capability (exposure map, early warning access map, analysis of evacuation behaviour) for planning was also not clearly indicated. Specific recommendations derived from the vulnerability assessment (e.g. potential locations and considerations for evacuation shelters) were not fully materialized presently, due to limited financial resources available with regard to many other competitive development needs (Setiadi, non-structure interviews in 2009, review of local planning documents and newsletters). Information and assessment e.g. on the cognitive factors was utilized to monitor awareness raising activities, however only for pilot project activities. Instead, the planning of evacuation shelters focused rather on physical construction of the shelters, but has not fully considered specific aspects such as evacuation behaviour, utilizations by various social groups as revealed in the vulnerability assessment previously. It is crucial to ensure the position and role of vulnerability and risk assessment in ongoing development planning.
The same holds true for the case studies in Sri Lanka. Although a variety of vulnerability indicators such as socio-economic factors, the lack of land title or information of resettlement decisions were identified, the respective information did not translate into Disaster Risk Management. This was partially reflected in the failed resettlement processes. Even though the 2006 Disaster Management Roadmap identified the need for integrating DRM and land use planning (Ministry of Disaster Management and Human Rights 2006, p. 172), guidelines have been developed while concrete codes are lacking (e.g. Ministry of Disaster Management 2013 or 2009). Existing guidelines are, however, not applied consistently. The resettlement policy for development activities developed in 2001 was not used when relocating tsunami-displaced households under the buffer zone regulation. Nowadays, additional topics such as climate change adaptation and other, more frequent hazards, such as landslides or floods seem to compete for attention and financial resources (Ministry for Disaster Management 2009).

16
Finally, it also needs to be mentioned that some putative risk reduction measures might also create second-order vulnerabilities, calling for detailed analysis and careful implementation in DRM. Regarding resettlement policies, livelihood aspects such as land tenure as well as proximity to livestock, access to fishing grounds and farmland have to be integrated into resettlement planning in order to avoid worsening the individual situation of households (Kennedy et al. 2008 or Leckie 2005). Nevertheless, access to physical and social infrastructure was disrupted through the resettlement and not sufficiently represented at the resettlement sites (Birkmann 2007, p. 69).
Conclusions and Recommendations In hindsight, maybe the 2004 Indian Ocean should not have come as a surprise (Satake and Atwater 2007). Old historical events occurring two centuries ago provided a warning sign that was raised a short time before the disaster hit (Cummins and Leonard 2004). Recent paleotsunami deposits have revealed evidence for past events in pre-historical times (Jankaew et al 2008), meaning that the 2004 Indian Ocean tsunami is not an isolated event. The 2004 Indian Ocean tsunami did introduce a paradigm change in the sense that previous models for constraining earthquake magnitudes along fault zones are now refuted (Stein and Okal 2007). As a consequence, megathrust earthquakes emerging from any of the large subduction zones in the world should not be ruled out.
The tsunamis that hit Japan in 2011 and Mentawai Islands in 2010 have revealed weaknesses in the way society deals with tsunami hazard. The 2011 Tohoku tsunami was stronger than barriers were designed for (Cyranowski 2011). It is also revealed that Japanese hazard maps were largely based on historical earthquake records limiting the earthquake moment magnitude to about 8, one order of magnitude lower than the 2011 event (Geller 2011). Recent analyses have in fact shown that a tsunami of this size may have a return period of about 500 years and should by no means have been a surprise (Kagan and Jackson 2013). A 500-year return period is well below the typical return periods of the extreme events nuclear power plants are designed to withstand. Still, one should keep in mind that the destructive power of the wave that hit Japan in 2011 was no less than the 2004 Indian Ocean tsunami. The fact that the relative death toll in Japan was one order of magnitude lower than that caused by the Indian Ocean tsunami shows that the exposed population in Japan was far better prepared. Even in retrospect, it is hard to see how the physical damage that Japan suffered in 2011 could have been avoided. However, much stronger precautions should have been applied to design of the nuclear power plants in the exposed areas. Although parts of the scientific community had expressed concern about the possible scale of the threat, the political will for more stringent precautions may not have been sufficient.
Ten years after the 2004 Indian Ocean Tsunami, it is evident that Indonesia has taken major steps to improve its preparedness for dealing with the tsunami threat in its most populated coastal communities, as demonstrated in this paper for Padang. In this respect, the international assistance and cooperation among different countries have been essential. Yet most people in the nearby Mentawai Islands were unprepared when the tsunami hit those islands in October 2010. At that time, a new warning system was at place, but there were no tsunami sirens located along the most exposed shorelines near the Sumatra trench. Here,

17
the population did not self-evacuate (Synolakis, 2011). It seems that despite the alarming reports above, it is difficult to build tsunami awareness in areas not previously hit. The long-term recurrence rate associated with the destructive tsunamis makes it challenging for the population to build this experience. In many situations, unprecedented factors play a major role in large disasters. For instance, could a tsunami triggered by a large submarine landslide cause the next great disaster in a coastal region with low seismic activity (Harbitz et al. 2013)? Such unprecedented events would certainly pose new challenges to vulnerable coastal communities.
In the past decade, progress was made in the development of vulnerability assessment methodologies providing additional information that can form the basis for the development of disaster risk reducing strategies. However, systematic utilization of vulnerability information for development of tsunami risk reduction in the case study areas is limited. Well-designed early warning systems, as well as evacuation and land use strategies are still lacking in many tsunami-exposed regions.
For the post-Hyogo process this is relevant in three ways: 1) More stringent implementation of existing priorities and actions under the HFA, for example in the context of land-use planning (Action 4-3), 2) Identification of new indicators and criteria to promote the continuous monitoring and use of vulnerability information in actual planning, and 3) Increasing the awareness of the exposed population.
Regarding the implementation of existing HFA priorities, there is a need for more detailed studies regarding why they were not applied. Limitations in the availability of data and lack of capacities might play a role. Planning regulations should provide a strong institutional basis to clarify the role and requirements of vulnerability and risk information in the planning process. Furthermore, a clarification of the roles of various stakeholders (government agencies, local community and private sector) is needed in many places.
More work on the development of indicators and criteria to determine the use of vulnerability information in disaster risk management is needed, that also allows to assess the effectiveness of key strategies and tools, like people-centred early warning systems. This will ensure the application of the most recent findings on disaster risk and assist in choosing the appropriate risk reduction strategies. Furthermore, respective indicators and criteria (e.g. specifically developed for the use of vulnerability aspects in resettlement strategies) will allow for the identification and reduction of the causes of disaster risk. While global databases and indicators might allow for an overall assessment of risk or vulnerability profile on a national or regional level, the lack of conserving vulnerability aspects in evacuation plans or missing building codes are not reflected in such assessments. Effective application of the knowledge about vulnerability aspects is thus needed for successful implementation of DRR measures. Finally, the development of risk and vulnerability indicators and assessment methodologies are of little help if no or hardly any use is made of them at the national and local level.

18
References ADRC (2006): Report on Survey on Tsunami Awareness in Indonesia: Banda Aceh and Aceh
Besar area of Aceh Province. ADRC.
Amarasinghe, S. (2007): Identifying Vulnerability Using Semi-structured Interviews. In: J. Birkmann, N. Fernando, S. Hettige, S. Amarasinghe, T. Jayasingam, D. Paranagama, M. D. A. Nandana, M. Naßl, S. Voigt, U. Grote, S. Engel, B. Schraven and J.Wolfertz: Rapid Vulnerability Assessment in Sri Lanka: Post-Tsunami Study of Two Cities: Galle and Batticaloa. SOURCE Publication No. 7, 47-53.
Annaka, T., K. Satake, T. Sakakiyama, K. Yanagisawa, and N. Shuto (2007): Logic-tree approach for probabilistic tsunami hazard analysis and its applications to the Japanese coasts. Pure Appl. Geophys., 164, pp 577-92.
Berryman, K. et al. (ed) (2005): Review of tsunami hazard and risk in New Zealand. Geological and Nuclear Sciences (GNS) report 2005/104. 140 p.
Birkmann J. (2013): Measuring Vulnerability to Natural Hazards – Towards Disaster Resilient Societies, Second Edition. Tokyo : UNU Press.
Birkmann, J. (2007): Tsunami: Socio-Economic Insecurities - Direct and Indirect Impacts and the Post Tsunami Process, Special Focus on: Indonesia and Sri Lanka. Background paper for the World Economic and Social Survey of UN/DESA. New York: UN/DESA.
Birkmann, J. (2007): Tsunami: Socio-Economic Insecurities, Direct and Indirect Impacts and the Post-Tsunami Process, Background Paper on the WESS (World Economic and Social Survey) of UNDESA (United Nations Department of Economic and Social Affairs).
Birkmann, J. and N. Fernando (2007): Reducing Vulnerability: Intervention Tools. In: J. Birkmann, N. Fernando, S. Hettige, S. Amarasinghe, T. Jayasingam, D. Paranagama, M. D. A. Nandana, M. Naßl, S. Voigt, U. Grote, S. Engel, B. Schraven and J.Wolfertz: Rapid Vulnerability Assessment in Sri Lanka: Post-Tsunami Study of Two Cities: Galle and Batticaloa. SOURCE Publication No. 7, 53-56.
Birkmann, J. and N. Fernando (2008): Measuring revealed and emergent vulnerabilities of coastal communities to tsunami in Sri Lanka. Disasters, 32(1), 82-105.
Birkmann, J., Fernando, N., Hettige, S. and S. Amarasinghe (2007): Vulnerability Assessment of Social Groups In: J. Birkmann, N. Fernando, S. Hettige, S. Amarasinghe, T. Jayasingam, D. Paranagama, M. D. A. Nandana, M. Naßl, S. Voigt, U. Grote, S. Engel, B. Schraven and J.Wolfertz: Rapid Vulnerability Assessment in Sri Lanka: Post-Tsunami Study of Two Cities: Galle and Batticaloa. SOURCE Publication No. 7, 25-38.
Birkmann, J., Setiadi, N., and N. Gebert (2008): Socio-economic Vulnerability Assessment at the Local Level in Context of Tsunami Early Warning and Evacuation Planning in the City of Padang, West Sumatra. Paper for International Conference on Tsunami Warning (ICTW), Bali, Indonesia, November 12-14, 2008 .
Blaikie, P., Cannon, T., Davis, I. and B. Wisner. (1994). At Risk: Natural hazards, People's vulnerability, and disasters. London: Routledge.

19
Burbidge, D., Cummins, P. , Mleczko, R. and H. Thio (2008): A probabilistic tsunami hazard assessment for Western Australia, Pure App. Geophys., 165, 2059-2088.
Clinton, W.J. (2006): Lessons Learned from Tsunami Recovery: Key Propositions for Building Back Better, United Nations Secretary-General’s Special Envoy for Tsunami Recovery, United Nations, New York.
Cornell, C. A. (1968): Engineering seismic risk analysis. Bull. Seism. Soc. Am 58, 1583-1606.
CRED (Center for Research on the Epidemiology of Disasters) (2014): Search Details Disasters List. EM-DAT Database. Available at: http://www.emdat.be (10.01.2014).
Cummins, P. and Leonard, M. (2004): Small Threat but Warning Sounded for Tsunami Research, AusGeo News, 75, 2004/9
Cutter, S., Bryan, L., Boruff, J., and W. Lynn Shirley (2003): Social vulnerability to environmental hazards. Social Science Quarterly, 84(2), 242-261.
Cyranoski, D. (2011): Japan faces up to failure of its earthquake preparations. Nature, 471, 556-557.
Di Mauro, M., Megawati, K., Cedillos, V., and B. Tucker (2013): Tsunami risk reduction for densely populated Southeast Asian cities: analysis of vehicular and pedestrian evacuation for the city of Padang, Indonesia, and assessment of interventions. Natural Hazards, doi: 10.1007/s11069-013-0632-z.
Fernando, N. (2012): Forced relocation after the Indian Ocean tsunami, 2004: Case study of vulnerable populations in three relocation settlements in Galle, Sri Lanka. Graduate Research Series PhD dissertation. Publication series of UNU-EHS Volume 6. Bonn: United Nations University, Institute of Human Security and Environment.
Fernando, N. and A. Punchihewa (2013): Relocating the Displaced: Strategies for Sustainable Relocation. Colombo: Friedrich Ebert Stiftung.
Geller, R. J. (2011): Shake up time for Japanese seismology, Nature, 472, 407-409.
Gonzalez, F., Geist, E., Jaffe, B., Kanoglu, U., Mofjeld, H., Synolakis, C., Titov, V., Arcas, D., Bellomo, D., Carlton, D., Horning, T., Johnson, J., Newman, J., Parsons, T., Peters, R., Peterson, C., Priest, G., Venturato, A., Weber, J., Wong, F., and A. Yalciner (2009): Probabilistic tsunami hazard assessment at Seaside, Oregon, for near- and far-field seismic sources, J. Geophys. Res, 114 C11023.
Grote, U., Engel, S., and B. Schraven (2007): Migration Due to the Tsunami in Galle. In: J. Birkmann, N. Fernando, S. Hettige, S. Amarasinghe, T. Jayasingam, D. Paranagama, M. D. A. Nandana, M. Naßl, S. Voigt, U. Grote, S. Engel, B. Schraven and J.Wolfertz: Rapid Vulnerability Assessment in Sri Lanka: Post-Tsunami Study of Two Cities: Galle and Batticaloa. SOURCE Publication No. 7, 53-56.
Harbitz, C.B., Løvholt, F. and H. Bungum (2013): Submarine landslide tsunamis: how extreme and how likely? Natural Hazards, 1–34, URL http://dx.doi.org/10.1007/s11069-013-0681-3.

20
Hebert, H., Schindele, F., Altinok, Y., Alpar, B., and C. Gazioglu (2005): Tsunami hazard in the Marmara Sea (Turkey): a numerical approach to discuss active faulting and impact on the Istanbul coastal areas. Mar. Geol. 215, 23– 43.
Intergovernmental Panel on Climate Change (IPCC) (2012): Managing the Risks of Extreme Event and Disasters to advance Climate Change Adaptation. A Special Report of Working Groups I and II of the Intergovernmental Panel on Climate Change. Field, C. B., Barros, V., Stocker, T. F., Qin, D., Dokken, D. J., Ebi, K. L., Mastrandrea, M. D., Mach, K. J., Plattner, G.-K., Allen, S. K., Tignor, M. and P. M. Midgley (Eds.). Cambridge and New York : Cambridge University Press.
Jankaew, K., Atwater, B. F., Sawai, Y., Choowong, M., Charoentitirat, T., Martin M.E. and A. Prendergast (2008): Medieval forewarning of the 2004 Indian Ocean tsunami in Thailand. Nature, 455, 1228-1231.
Jayasinghem, T. and J. Birkmann (2007): Vulnerability Comparision between Galle and Batticaloa based on the Household Survey using Questionnaires. In: J. Birkmann, N. Fernando, S. Hettige, S. Amarasinghe, T. Jayasingam, D. Paranagama, M. D. A. Nandana, M. Naßl, S. Voigt, U. Grote, S. Engel, B. Schraven and J.Wolfertz: Rapid Vulnerability Assessment in Sri Lanka: Post-Tsunami Study of Two Cities: Galle and Batticaloa. SOURCE Publication No. 7, 39-47.
Kagan, Y.Y. and D.D. Jackson (2013): Tohoku Earthquake: A Surprise? Bull. Seis. Soc. Am. 103 (2B), 1181-1194, doi: 10.1785/0120120110
Kanakubo, T. and S. Tanioka (1980): Natural Hazard Mapping. GeoJournal, 4.4, 333-340.
Kaplan, M., Renaud, F. G., and G.L. Lüchters (2009): Vulnerability assessment and protective effects of coastal vegetation during the 2004 Tsunami in Sri Lanka. Natural Hazards and Earth System Sciences, 9, 1479–1494.
Kennedy, J., Ashmore, J., Babister, E. and I. Kelman (2008): The Meaning of ‘Build Back Better’: Evidence From Post-Tsunami Aceh and Sri Lanka. Journal of Contingencies and Crisis Management, 16(1), 24-36.
Koshimura, S. (2006): Vulnerability estimation in Banda Aceh using the tsunami numerical model and the post-tsunami survey data. In: Proceedings of 4th International Workshop on Remote Sensing for Post-Disaster Response, 2006 .
Lämmel, G. (2011): Escaping the Tsunami: Evacuation Strategies for Large Urban Areas Concepts and Implementation of a Multi-Agent Based Approach. Dissertation. Berlin: Technische Universität Berlin.
Leckie, S. (2005): The Great Land Theft. Forced Migration Review, July 2005 Special Issue, 15–16.
Legg, M.R., Borrero, J.C., and C.E. Synolakis (2004): Tsunami Hazards associated with the Catalina fault in Southern California. Earthquake Spectra, 20 (3), 917-950.
Lin, I., and C.C. Tung (1982): A preliminary investigation of tsunami hazard. Bull. Seismol. Soc. Am., 72, 2323-2337.

21
LIPI / DLR / UNU-EHS (2011): Guideline for Tsunami Risk Assessment in Indonesia: Scientific Proposal for Practitioner and End Users: Provided by the Indonesian – German Working Group on Tsunami Risk Assessment .
Livermann, D., M. (1990): Vulnerability to global environmental change. In: Kasperson, R. E., Dow, K., Golding, D. and J. X. Kapserson (Eds.): Understanding Global Environmental Change: the Contribution of Risk Analysis and Management, Worcester, 27-44.
Lorito, S., Tiberti, M.M., Basili, R., Piatanesi, A., and G. Valensise (2008): Earthquake-generated tsunamis in the Mediterranean Sea: Scenarios of potential threats to Southern Italy. J. Geoph. Res. 113( B1), B01301.
Løvholt, F., Bungum, H., Harbitz, C.B., Glimsdal, S., Lindholm, C.D. and G. Pedersen (2006): Earthquake related tsunami hazard along the western coast of Thailand. Nat. Hazards Earth Sys. Sci. 6, 1–19.
Løvholt, F., Kühn, D., Bungum, H., Harbitz, C.B., and S. Glimsdal (2012a): Historical tsunamis and present tsunami hazard in Eastern Indonesia and the Philippines. J. Geoph. Res. - Solid Earth.
Løvholt, F., Glimsdal, S., Harbitz, C., Zamora, N., Nadim, F., Peduzzi, P., Dao, H., and H. Smebye (2012b): Tsunami hazard and exposure on the global scale, Earth-Sci. Rev., 110, 58–73.
Løvholt, F., Glimsdal, S., Harbitz, C.B., Horspool, N., Smebye, H., de Bono, A., and F. Nadim, (submitted): Global tsunami hazard and exposure due to large co-seismic slip. International Journal of Disaster Risk Reduction.
Ministry of Disaster Management and Human Rights Sri Lanka (2006): Towards a Safer Sri Lanka – Road Map for Disaster Risk Management, Government of Sri Lanka and UNDP (United Nations Development Programme. Available at: http://www.dmc.gov.lk/Publications/Road_Map_Volume_2.pdf (21.01.2014).
Ministry of Disaster Management and Human Rights Sri Lanka (2009): Performance Report 2009. Available at: http://www.disastermin.gov.lk/web/index.php?option=com_content&view=category&layout=blog&id=73&Itemid=70&lang=en (28.01.2014).
Ministry of Disaster Management Sri Lanka (2013): Safer Sri Lanka - Progress Report 2013. Available at: http://www.disastermin.gov.lk/web/index.php?option=com_content&view=category&layout=blog&id=73&Itemid=70&lang=en (28.01.2014).
Ministry of Finance and Planning (n. d.): Ten year horizon development framework 2006-2016, Panaluwa. Available at: http://www.houseconmin.gov.lk/images/download/mahindachintanatenyeardevelopmentplan.pdf (21.01.2014):

22
Muhari, A., Koshimura, S., and F. Imamura (2012): Performance evaluation of pedestrian bridge as vertical evacuation site during the 2011 tsunami in Japan. Journal of Natural Disaster Science, 34(1), 79–90.
MunichRE (Münchener Rückversicherungs-Gesellschaft) (2013a): Significant natural catastrophes 1980 – 2012, 10 deadliest worldwide events. Geo Risks Research, NatCatSERVICE, available at: https://www.munichre.com/app_pages/www/@res/pdf/natcatservice/significant_natural_catastrophes/2012/NatCatSERVICE_significant_dth_touch_en.pdf?1 (10.01.2014).
MunichRE (Münchener Rückversicherungs-Gesellschaft) (2013b): Significant natural catastrophes 1980 – 2012, 10 costliest events worldwide. Geo Risks Research, NatCatSERVICE, available at: https://www.munichre.com/app_pages/www/@res/pdf/natcatservice/significant_natural_catastrophes/2012/NatCatSERVICE_significant_eco_touch_en.pdf?1 (10.01.2014).
Nadim, F., and T. Glade (2006): On tsunami risk assessment for the west coast of Thailand, Nadim, F., Pöttler, R., Einstein, H., Klapperich, H., and S. Kramer (Eds), ECI Symposium Series, 7. http://services.bepress.com/eci/geohazards/28.
Naßl, M and S. Voigt (2007): Vulnerability Assessment of the Built Environment. In: J. Birkmann, N. Fernando, S. Hettige, S.Amarasinghe, T. Jayasingam, D.Paranagama, M.D. A.Nandana, M.Naßl, S.Voigt, U. Grote, S. Engel, B. Schraven and J.Wolfertz: Rapid Vulnerability Assessment in Sri Lanka: Post-Tsunami Study of Two Cities:Galle and Batticaloa. SOURCE Publication No. 7, 14-22.
Okal, E.A., Borrero, J.C., and C.E. Synolakis (2006): Evaluation of tsunami risk from regional earthquakes at Pisco, Peru. Bull. Seism. Soc. of Am. 96(5), 1634-1648.
Oxfam International (2005): The tsunami’s impact on women. Oxfam Briefing Note.
Parsons, T. and E. Geist (2009): Tsunami probability in the Caribbean Region. Pure and App.Geoph. 165, 2089-2116.
Reese, S., Cousins, W.J., Power, W.L., Palmer, N.G., Tejakusuma, I.G, and S. Nugrahadi (2007): Tsunami vulnerability of buildings and people in South Java – field observations after the July 2006 Java tsunami. Nat. Hazards Earth Syst. Sci., 7, 573–589.
Rikitake, T. and I. Aida (1988): Tsunami hazard probability in Japan. Bull. Seism. Soc. Am., 78, 1266-1278.
Rofi, A., Doocy, S., and C. Robinson (2006): Tsunami mortality and displacement in Aceh province, Indonesia. Disasters, 30(3), 340–350.
Satake, K. and B. F. Atwater (2007): Long-Term Perspectives on Giant Earthquakes and Tsunamis at Subduction Zones. Ann. Rev. Earth Planet. Sci., 35, 349–74.
Satterthwaite, D. (2000): Seeking an Understanding of poverty that recognises rural-urban differences and rural-urban linkages, Paper presented at World Bank Forum for Urban

23
Poverty Reduction in the 21st Century, International Institute for Environment and Development (IIED), Washington, USA.
Setiadi, N. J. (upcoming): Assessing People´s Early Warning Response Capability to Inform Urban Planning Interventions to Reduce Vulnerability to Tsunamis: Case Study of Padang City, Indonesia. Dissertation. Bonn: Rheinische Friedrich�Wilhelms�Universität zu Bonn.
Setiadi, N., Taubenböck, H., Raupp, S., and J. Birkmann (2010): Integrating Socio-Economic Data in Spatial Analysis: An Exposure Analysis Method for Planning Urban Risk Mitigation. In: Manfred Schrenk, Vasily V. Popovich, Dirk Engelke, & Pietro Elisei (Eds.), REAL CORP 2010, Vienna, 18-20 May 2010 .
Sørensen, M., Spada, M., Babeyko, A., Wiemer, S., and Grünthal, G. (2012): Probabilistic tsunami hazard in the Mediterranean Sea, Journal of Geophysical Research: Solid Earth, 117, B1, 2156-2202.
Sri Lankan Ministry of Disaster Management (2013): Safer Sri Lanka Progress Report.
SSHAC (Senior Seismic Hazard Analysis Committee) (1997): Recommendations for Probabilistic Seismic Hazard Analysis: Guidance on Uncertainty and Use of Experts, US Nuclear Regulatory. Commission report CR-6372, Washington DC.
Stein, S., and E. Okal (2007): Ultralong period seismic study of the December 2004 Indian ocean earthquake and implications for regional tectonics and the subduction process, Bull. Seis. Soc. Am., 97 (1A), pp 279–295.
Synolakis, C.E. (1987): The run-up of solitary waves, J. Fluid Mech., 185, pp 523-545.
Synolakis, C.E. (2011): Tsunamis: When will we learn? Newsweek.
Taubenböck, H., Goseberg, N., Lämmel, G., Setiadi, N., Schlurmann, T., Nagel, K., et al. (2013): Risk reduction at the “Last-Mile”: an attempt to turn science into action by the example of Padang, Indonesia. Natural Hazards, doi: 10.1007/s11069-012-0377-0.
Taubenböck, H., Goseberg, N., Setiadi, N., Lämmel, G., Moder, F., Oczipka, M., Klüpfel, H., Wahl, R., Schlurmann, T., Strunz, G., Birkmann, J., Nagel, K., Siegert, F., Lehmann, F., Dech, S., Gress, A., and R. Klein (2009): "Last-Mile" preparation for a potential disaster – Interdisciplinary approach towards tsunami early warning and an evacuation information system for the coastal city of Padang, Indonesia. Natural Hazards and Earth System Science, 9, 1509–1528.
Taubenböck, H., Post, J., Roth, A., Strunz, G., Kief, R., Dech, S., et al. (2008): Multi-scale Assessment of Population Distribution Utilizing Remotely Sensed Data: The Case Study Padang, West Sumatra, Indonesia. In: ICTW (Ed.), International Conference on Tsunami Warning (ICTW), Bali, Indonesia, November 12-14, 2008 .
Thio, H.K., P. Somerville, and J. Polet (2010): Probabilistic Tsunami Hazard in California, PEER Report 2010/108 Pacific Earthquake Engineering Research Center.
Tinti, S. and Armigliato, A. (2003): The use of scenarios to evaluate the tsunami impact in southern Italy. Mar Geol. 199(3-4), 221-243.

24
Tsunami Pilot Study Working Group, (2006): Seaside, Oregon Tsunami Pilot Study—Modernization of FEMA flood hazard maps. NOAA OAR Special Report, NOAA/OAR/PMEL, Seattle, WA, 94 pp. + 7 appendices.
UNDP (2009): Institutional and Legislative Systems for Early Warning and Disaster Risk Reduction: Indonesia Summary. Bangkok, Thailand: UNDP.
UNESCO IOC (Ed.) (2009): Hazard awareness and risk mitigation in integrated coastal management (ICAM): Intergovernmental Oceanographic Commission, IOC Manual and Guides No. 50, ICAM Dossier No. 5. Paris: UNESCO.
UNISDR (2009a): Global assessment report on disaster risk reduction. pp. 207. ISBN/ISSN: 9789211320282, http://www.preventionweb.net/english/hyogo/gar/report/index.php
UNISDR (2013): Global assessment report on disaster risk reduction - From Shared Risk to Shared Value: The Business Case for Disaster Risk Reduction. Report (2013).
UNISDR (United Nations International Strategy for Disaster Reduction) (2005): 10 preliminary lessons learned from the Indian Ocean tsunami of 26 December 2004. Available at: http://www.unisdr.org/files/5605_ISDR10lessonslearned.pdf (10.01.2014).
UNISDR (United Nations International Strategy for Disaster Reduction) (2009b): Five years after the Indian Ocean Tsunami – are we better prepared and more resilient to disasters? Press release of 24th December 2009. Available at: http://www.preventionweb.net/files/12158_UNISDRPR242009.pdf (10.01.2014).
Venturato, A.J., Arcas, D., Titov, V.V., Mofjeld, H.O., Chamberlin, C.C. and F.I. González (2007): Tacoma, Washington, tsunami hazard mapping project: Modeling tsunami inundation from Tacoma and Seattle fault earthquakes. NOAA Tech. Memo. OAR PMEL-132, 23 p.
Wegscheider, S., Post, J., Zosseder, K., Mück, M., Strunz, G., Riedlinger, T., Muhari, A. and H. Z. Anwar (2011): Generating tsunami risk knowledge at community level as a base for planning and implementation of risk reduction strategies. Natural Hazards and Earth System Science, 11, 249–258.
Wisner, B. (2002): ‘Who? What? Where? When? In an Emergency: Notes on Possible Indicators of Vulnerability and Resilience by Phase of the Disaster Management Cycle and Social Actor’. In: Plate, E., (Ed.): ‘Environment and Human Security: Contributions to a workshop in Bonn’, 12/7-12/14, Bonn.