Embed Size (px)
Citation preview

〔Delayed〕The original disclosure in Japanese was released on February 14, 2020 at 15:00 (GMT+9)
February 14, 2020 Tsukada Global Holdings Inc.
Consolidated Earnings Report for the Fiscal Year ended December 31, 2019 (Japanese GAAP)
Stock listing: Tokyo Stock Exchange (First Section) Securities code: 2418 URL: http://www.tsukada-global.holdings/en/ Representative: Masayuki Tsukada, President and CEO Information contact: Masahiro Yamazaki, Manager, Finance &
Accounting Department Tel: +81-3-5464-0081
Scheduled dates: Annual general meeting of shareholders: March 26, 2020 Filing of statutory year-end financial report: March 26, 2020 Dividend payout: March 27, 2020 Supplementary materials to year-end financial results available: Yes Year-end earnings presentation held: Yes (targeted at institutional investors and analysts)
(Amounts rounded down to the nearest million yen)
1. Consolidated Performance for the Fiscal Year ended December 31, 2019 (January 1, 2019 – December 31, 2019) (1) Consolidated Operating Results (Percentages indicate year-on-year changes)
Net sales Operating income Ordinary income Profit attributable to owners of the parent
million yen % million yen % million yen % million yen % Year ended December 31, 2019 61,121 1.5 6,383 21.6 6,222 18.4 2,565 5.8
Year ended December 31, 2018 60,197 5.1 5,249 23.0 5,257 19.5 2,424 10.0
Note: Comprehensive income: Year ended December 31, 2019: 2,302 million yen (33.5%) Year ended December 31, 2018: 1,724 million yen (-15.7%)
Profit per share
Diluted profit per share Return on equity Ordinary income
to total assets Operating income
to net sales yen yen % % %
Year ended December 31, 2019 53.78 - 7.0 6.5 10.4
Year ended December 31, 2018 50.82 50.40 7.0 6.0 8.7
Reference: Equity in (earnings) losses of affiliates: Year ended December 31, 2019:- 47 million yen Year ended December 31, 2018: - million yen (2) Consolidated Financial Position
Total assets Net assets Equity ratio Net assets per share million yen million yen % yen December 31, 2019 99,343 37,404 37.7 784.15 December 31, 2018 90,841 37,081 39.1 745.24
Reference: Total equity: December 31, 2019: 37,404 million yen December 31, 2018: 35,548 million yen
Total equity = Shareholders’ equity plus total accumulated other comprehensive income Note: “Partial Amendments to Accounting Standard for Tax Effect Accounting” (Accounting Standards Board of Japan (ASBJ) Statement No. 28, February 16, 2018) have been applied, effective from the first three months of the fiscal year ended

December 31, 2019. Figures in the financial position as of December 31, 2018 were retroactively restated in accordance with said ASBJ amendments.
(3) Consolidated Cash Flows
Cash flows from operating activities
Cash flows from investing activities
Cash flows from financing activities
Cash and cash equivalents at end of
period million yen million yen million yen million yen Year ended December 31, 2019 7,297 (12,838) 9,686 28,259
Year ended December 31, 2018 6,050 (375) 3,704 24,117
2. Dividends
Dividend per share Total
dividends
Dividend payout ratio (consolidated)
Rate of total dividend to net assets
(consolidated) End-Q1 End-Q2 End-Q3 Year-end Annual total yen yen yen yen yen million yen % %
Year ended December 31, 2018 - 5.00 - 5.00 10.00 477 19.7 1.4
Year ended December 31, 2019 - 5.00 - 5.00 10.00 477 18.6 1.3
Year ending December 31, 2020 (Forecast)
- 5.00 - 5.00 10.00
12.6
3. Earnings Forecast for the Fiscal Year ending December 31, 2020 (January 1, 2020 – December 31, 2020) (Percentages indicate year-on-year changes)
Net sales Operating income Ordinary income Profit attributable to owners of the parent
Profit per share
million yen % million yen % million yen % million yen % yen Six months ending June 30, 2020 29,500 1.5 900 (60.2) 900 (55.3) 100 (92.2) 2.10
Year ending December 31, 2020 64,000 4.7 6,700 5.0 6,500 4.5 3,800 48.1 79.66
*Notes
(1) Changes in significant subsidiaries during the period: Yes (Changes in specific subsidiaries accompanying a change in scope of consolidation) Newly Consolidated: BEST LIFE STYLE Inc. Newly Deconsolidated: BT KALAKAUA, LLC Note: For details, please refer to “(5) Notes on Consolidated Financial Statements (Changes in Significant Subsidiaries for Fiscal 2019)” in the section “3. Consolidated Financial Statements and Main Notes” on page 14 in the accompanying materials.
(2) Changes in accounting policy, changes in accounting estimates, and retrospective restatement
1) Changes in accordance with amendments to accounting standards, etc.: None 2) Changes other than noted in 1) above: None

3) Changes in accounting estimates: None 4) Retrospective restatement: None
(3) Shares issued (common stock)
December 31, 2019 December 31, 2018 1) Number of shares issued at end of period
(including treasury stock) 48,960,000 48,960,000
2) Number of shares held in treasury at end of period 1,259,834 1,259,834
Year ended
December 31, 2019 Year ended
December 31, 2018 3) Average number of shares outstanding during the period 47,700,166 47,700,166
* This Earnings Report is exempt from auditing conducted by certified public accountants or by
auditing firms. *Appropriate Use of Earnings Forecast and Other Important Information (Cautionary Statement with Respect to Forward-Looking Statements) Any forecasts and forward-looking statements given herein are based on information available as of this report’s publication and on certain assumptions that are deemed reasonable. These forecasts are not guarantees of future performance, and actual results may differ from forecasts due to changes in the business environment. For the assumptions underlying the forecasts herein and other notice on the use of earnings forecasts, please refer to “(4) Earnings Forecast for the Fiscal Year Ending December 31, 2020” in the section “1. Review of Consolidated Financial Results” on page 5. 2 in the accompanying materials. (Presentation handout materials) The Company has scheduled an earnings presentation targeted at institutional investors and analysts on February 17, 2020. The presentation handout materials will be posted on the Company's website immediately after the event.

1
Accompanying Material – Contents 1. Review of Consolidated Financial Results 2 (1) Operating Results for Fiscal 2019 2 (2) Analysis of Financial Condition 3 (3) Overview of Cash Flows 4 (4) Earnings Forecast for the Fiscal Year Ending December 31, 2020 5 2. Basic Views on Adoption of Accounting Standards 5 3. Consolidated Financial Statements and Main Notes 6 (1) Consolidated Balance Sheets 6 (2) Consolidated Statements of Income and Comprehensive Income 8 Consolidated Statements of Income 8 Consolidated Statements of Comprehensive Income 8 (3) Consolidated Statements of Changes in Net Assets 9 (4) Consolidated Statements of Cash Flows 12 (5) Notes on Consolidated Financial Statements 14 (Note on the Going-concern Assumption) 14 (Changes in Significant Subsidiaries for Fiscal 2019) 14 (Changes in Method of Presentation) 14 (Additional Information) 14 (Segment Information) 15 (Per Share Information) 18 (Significant Subsequent Events) 18 4. Other Information 19 (1) Changes in Officers 19 (2) Weddings Held and Orders Received 19

2
1. Review of Consolidated Financial Results (1) Operating Results
In the fiscal year ended December 31, 2019, the Japanese economy followed a recovery path thanks to expanded corporate earnings, a recovery in personal spending and improved employment conditions on the back of the government’s various economic policies. However, the future outlook remains clouded by the impact that tensions in the Middle East may have on the global economy and the uncertainties in economic conditions abroad.
In the bridal market, the core business of the Tsukada Global Holdings Group (“the Group”), the number of weddings in Japan in fiscal 2019 was estimated at 583,000, compared with 586,000, down 0.6% from fiscal 2018 (source: Outline of Vital Statistics in Japan, Ministry of Health, Labour and Welfare). Although the rate of decline slowed from 3.4% in the previous fiscal year, the declining birthrate is gradually having a discernible impact. However, Japan’s wedding market environment remains generally stable, due partly to a steady rise in expenditures per wedding due to late-life marriages. Moreover, the number of foreign visitors to Japan, even though the growth rate slowed from 8.7% in 2018, is estimated to have reached 31.88 million in 2019 (up 2.2% year-on-year from 31.19 million in 2018 according to the Japan National Tourism Organization). Thus, the hotel market is continuing to expand steadily owing to the recovery in the Japanese economy and continued increase in the number of foreign visitors. The relaxation-related market, though witnessing a slowdown in growth on the whole, enjoyed stable growth thanks to the burgeoning interest in health and beauty in addition to the market’s existing underlying strength.
In this environment, the Group endeavored to increase sales and profitability by accurately responding to increasingly individualized and diversifying customer needs in the bridal, hotel, and wellness and relaxation (W&R) markets, while also continuing its efforts to create new value and develop high-quality, appealing outlets capable of providing high value-added services.
Based on this policy, the Group continued efforts to create new value and further improve the quality of its hospitality services in the hotel business in anticipation of the Tokyo Olympic and Paralympic Games by, for example, beginning preparations for the opening of the Kimpton Hotel Shinjuku, Tokyo (provisional name), major renovations of The Strings by InterContinental Tokyo in Shinagawa, Tokyo, and refurbishment and rebranding of The Strings Hotel Yagoto Nagoya in Showa Ward, Nagoya.
In the wedding business, the Group increased internal production of mainstay wedding-related products such as floral decorations, photographs, videos, and audio content, and promoted external sales of these products. The Group also focused on expanding the earnings and business areas of the Wellness & Relaxation (W&R) business, which opened comprehensive fitness club Best Style Fitness Kyoto Karasuma (Nakagyo-ku, Kyoto) in September 2019.
As a result of these efforts, in the fiscal year ended December 31, 2019, the Group posted increased sales and profits. Consolidated net sales were ¥61,121 million (up 1.5% year on year). Operating income totaled ¥6,383 million (up 21.6%) and ordinary income totaled ¥6,222 million (up 18.4%). However, given signs of potential impairment of some assets due to declines in profitability, the Group posted an impairment loss of ¥1,015 million as an extraordinary loss, taking into account future business plans and recoverability in accordance with the Accounting Standard for Impairment of Fixed Assets, and as a result profit attributable to owners of the parent came to ¥2,565 million (up 5.8%). The results for each business segment were as follows.

3
1) Wedding business In fiscal 2019, sales grew in the wedding business bolstered primarily by an increase in the number of weddings held in the mainstay Japanese market, a solid increase in spend per wedding, and progress with external sales. Segment income significantly increased mainly due to increased internal production of wedding-related products and content such as photographs, audio, videos, and floral decorations.
As a result, net sales in the wedding business were ¥39,414 million (up 3.4% year on year), and segment income was ¥7,797 million (up 23.1%).
2) Hotel business Segment sales declined in fiscal 2019 despite solid growth of overnight occupancy rates and average charge per night, because the number of weddings held at our hotels decreased, and the number of guest rooms available for sale decreased due to major renovation work at The Strings Hotel Tokyo Intercontinental and The Strings Hotel Yagoto Nagoya. Segment income halved due to lower segment sales and expenses related to the preparations for opening Kimpton Hotel Shinjuku, Tokyo (provisional name).
As a result, net sales in the hotel business came to ¥17,768 million (down 2.6% year on year), and segment income totaled ¥477 million (down 51.3%).
3) W&R business (Wellness & Relaxation business) This segment achieved sales growth in fiscal 2019 due to full-year operation of the comprehensive fitness club Best Style Fitness Kaihin Makuhari, which opened in December 2018, and the opening of Best Style Fitness Kyoto Karasuma in September. However, the segment posted an operating loss owing to the startup costs of the new fitness clubs and some delay in attracting members at some fitness clubs.
As a result, the W&R business posted net sales of ¥3,939 million (up 2.6% year on year), and a segment loss of ¥229 million (compared with a loss of ¥426 million a year earlier).
(2) Analysis of Financial Condition
Assets, Liabilities, and Net Assets Total assets at the end of fiscal 2019 (December 31, 2019) amounted to ¥99,343 million, an increase of ¥8,502 million from the end of the previous fiscal year (December 31, 2018). The increase mainly reflects a ¥7,864 million increase in construction in progress related to the construction of Kimpton Hotel Shinjuku, Tokyo (provisional name), a ¥4,164 million increase in investment securities as a result of investment of surplus funds, and a ¥4,141 million increase in cash and deposits due to fund procurement. These were partially offset by a ¥3,162 million decline in buildings and structures and a ¥5,979 million decrease in land, as a result of the exclusion of former consolidated subsidiary BT KALAKAUA, LLC from the scope of consolidation due to a reduced equity stake following partial divestment.
Total liabilities at the end of fiscal 2019 came to ¥61,939 million, an increase of ¥8,179 million from the end of the previous fiscal year. The increase is chiefly attributable to an increase of ¥3,039 million in long-term debt (including the current portion) owing to fund procurement for capital investment and ¥2,110 million from the issuance of bonds (including the current portion).
Net assets at the end of fiscal 2019 totaled ¥37,404 million, an increase of ¥322 million from the end

4
of the previous fiscal year. The change is primarily due to a ¥2,088 million increase in retained earnings reflecting the posting of profit attributable to owners of the parent, which was partially offset by a ¥1,533 million decrease in non-controlling interests due to the exclusion of a subsidiary from the scope of consolidation.
(3) Overview of Cash Flows
Cash and cash equivalents (“cash”) at the end of fiscal 2019 increased by ¥4,141 million from the end of the previous fiscal year to ¥28,259 million. Cash flows and factors behind changes in the cash flows are explained below. (Operating cash flow) Cash provided by operating activities during fiscal 2019 totaled ¥7,297 million, an increase of 20.6% from the previous fiscal year. The change is mainly attributable to ¥3,140 million in depreciation and amortization and ¥5,122 million in profit before income taxes, which were partially offset by ¥2,449 million in income taxes paid.
(Investing cash flow) Cash used in investing activities totaled ¥12,838 million, compared with ¥375 million used in the previous fiscal year. The change is mainly the result of ¥10,969 million used for purchase of tangible assets.
(Financing cash flow) Cash provided by financing activities in fiscal 2019 totaled ¥9,686 million, an increase of 161.5% from the previous fiscal year. The change is mainly attributable to proceeds of ¥11,990 million from long-term debt and ¥2,689 million from the issuance of bonds, which were partially offset by repayments of long-term debt of ¥3,400 million and payments for redemption of bonds of ¥590 million.
Changes in the Group’s cash flow-related indicators are as follows. FY2015 FY2016 FY2017 FY2018 FY2019 Return on equity (%) 39.6 38.5 40.5 39.1 37.7 Return on equity based on market value (%)
47.7 39.3 37.5 31.3 29.3
Cash flow to interest-bearing debt (years) 6.2 5.8 5.0 6.6 6.1 Interest coverage ratio (times) 24.8 27.2 33.9 26.3 17.3
Notes: Return on equity: Total equity/Total assets Return on equity based on market value: Market valuation/Total assets Cash flow to interest-bearing debt: Interest-bearing debt/Operating cash flow Interest coverage ratio: Operating cash flow/Interest expenses 1. All indicators are calculated based on consolidated figures. 2. Cash flows from operating activities in the Consolidated Statements of Cash Flows are used for operating
cash flow. Interest-bearing debt includes all liabilities recorded on the Consolidated Balance Sheets on which interest is paid. Interest paid in the Consolidated Statements of Cash Flows is used for interest expenses.

5
(4) Earnings Forecast for the Fiscal Year Ending December 31, 2020
Regarding the economic environment in which the Group operates, the economy continues on a recovery track, reflecting expanded corporate earnings, an upturn in consumer spending and improved employment conditions thanks partly to the effects of various economic policies. However, the economic outlook is likely to remain unclear primarily due to the tensions in the Middle East, developments regarding trade disputes between the U.S. and China, and concerns about the impact of the COVID-19 coronavirus disease on Japan’s tourism market.
In addition to taking appropriate steps to counteract the above risks, the Group intends to constantly strive to create new value and proactively develop products that accurately meet ever-changing customer needs. It will also aim to improve its cost-competitiveness and further enhance profitability through efficient outlet operations and the proactive development of human resources.
The wedding order backlog at the end of the fiscal year under review (December 31, 2019) was 7,549 (down 9.0% year on year). For the fiscal year ending December 31, 2020, the Group forecasts consolidated net sales of ¥64,000 million (up 4.7%), operating income of ¥6,700 million (up 5.0%), ordinary income of ¥6,500 million (up 4.5%), and profit attributable to owners of the parent of ¥3,800 million (up 48.1%). The forecast for sales and profit growth in the fiscal year ending December 31, 2020 is due in part to the opening of the new Kimpton Hotel Shinjuku, Tokyo (provisional name) and the impact of hosting the Tokyo Olympic and Paralympic Games.
2. Basic Views on Adoption of Accounting Standards
The Group’s financial statements are prepared in accordance with the accounting principles generally accepted in Japan (Japanese GAAP), in order to ensure comparability with other companies in the peer group. As to the possible future adoption of the International Financial Reporting Standards (IFRS), the Group shall continue its study going forward, taking into account the future developments of the Group’s business and of the global and Japanese business environments.

6
3. Consolidated Financial Statements and Main Notes (1) Consolidated Balance Sheets
(millions of yen)
December 31, 2018 December 31, 2019
Amount Amount Assets
Current assets Cash and deposits 24,206 28,347 Accounts receivable - trade 1,281 1,259 Marketable securities 289 2,455 Merchandise 127 116 Raw materials and supplies 490 530 Other 1,136 1,389 Allowance for doubtful receivables (24) (22) Total current assets 27,506 34,076
Fixed assets
Tangible assets Buildings and structures 48,680 47,544
Accumulated depreciation (23,318) (25,345) Buildings and structures, net 25,361 22,199
Land 15,553 9,574 Construction in progress 1,972 9,837 Other 8,500 9,141
Accumulated depreciation (6,777) (7,231) Other, net 1,723 1,909
Total tangible assets 44,610 43,520 Intangible assets
Goodwill 1,738 1,475 Other 184 195 Total intangible assets 1,922 1,670
Investments and other assets Investment securities 2,557 6,721 Lease and guarantee deposits 8,152 8,451 Deferred tax assets 4,177 3,973 Other 1,961 990 Allowance for doubtful receivables (206) (213) Total investments and other assets 16,641 19,925
Total fixed assets 63,174 65,115 Deferred assets
Bond issuance costs 160 151 Total deferred assets 160 151
Total assets 90,841 99,343
7
(millions of yen)
December 31, 2018 December 31, 2019
Amount Amount Liabilities
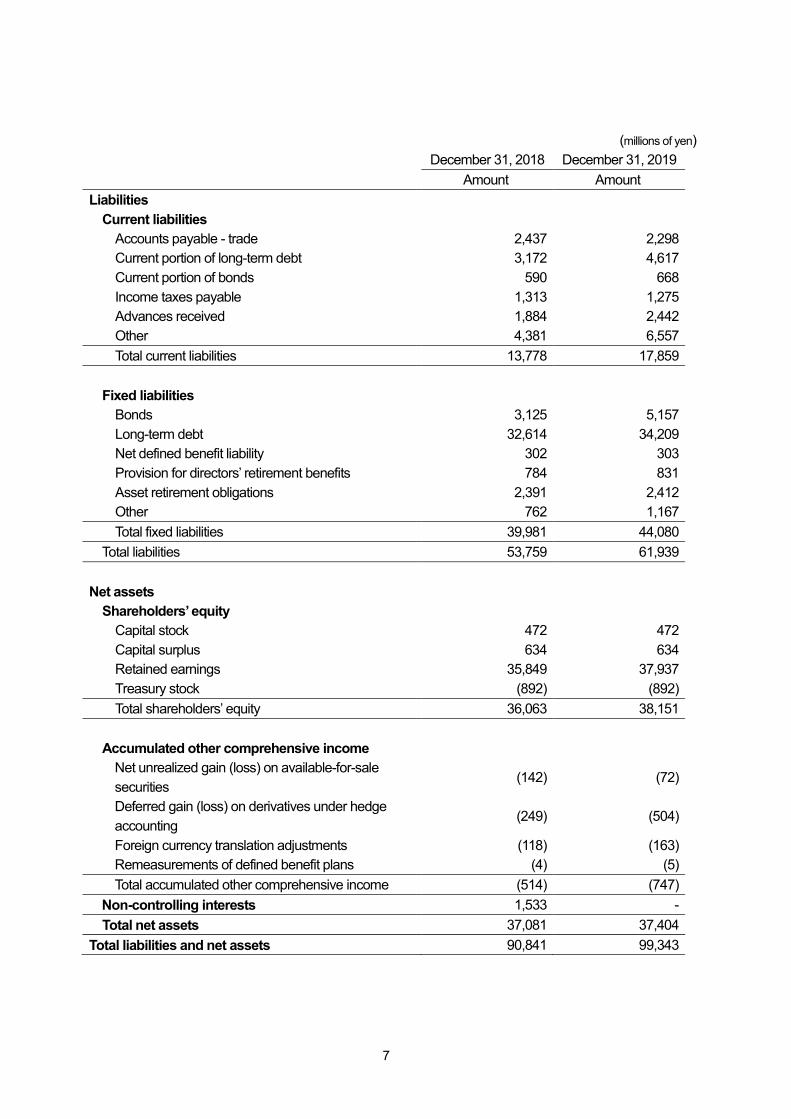
Current liabilities Accounts payable - trade 2,437 2,298 Current portion of long-term debt 3,172 4,617 Current portion of bonds 590 668 Income taxes payable 1,313 1,275 Advances received 1,884 2,442 Other 4,381 6,557 Total current liabilities 13,778 17,859
Fixed liabilities
Bonds 3,125 5,157 Long-term debt 32,614 34,209 Net defined benefit liability 302 303 Provision for directors’ retirement benefits 784 831 Asset retirement obligations 2,391 2,412 Other 762 1,167 Total fixed liabilities 39,981 44,080
Total liabilities 53,759 61,939 Net assets
Shareholders’ equity Capital stock 472 472 Capital surplus 634 634 Retained earnings 35,849 37,937 Treasury stock (892) (892) Total shareholders’ equity 36,063 38,151
Accumulated other comprehensive income
Net unrealized gain (loss) on available-for-sale securities (142) (72)
Deferred gain (loss) on derivatives under hedge accounting
(249) (504)
Foreign currency translation adjustments (118) (163) Remeasurements of defined benefit plans (4) (5) Total accumulated other comprehensive income (514) (747)
Non-controlling interests 1,533 - Total net assets 37,081 37,404
Total liabilities and net assets 90,841 99,343

8
(2) Consolidated Statements of Income and Comprehensive Income Consolidated Statements of Income (millions of yen)
Year ended
December 31, 2018 Year ended
December 31, 2019 Amount Amount
Net sales 60,197 61,121 Cost of sales 40,598 40,014 Gross profit 19,599 21,107 Selling, general and administrative expenses 14,349 14,724 Operating income 5,249 6,383 Non-operating income
Interest income 29 108 Dividend income 8 5 Gain on investments in silent partnership 150 153 Real estate rental income 213 191 Compensation income - 70 Other 93 137 Total non-operating income 495 667
Non-operating expenses Interest expenses 233 422 Real estate rental expenses 96 164 Foreign exchange loss 81 137 Other 77 104 Total non-operating expenses 488 828
Ordinary income 5,257 6,222 Extraordinary income
Gain on sales of fixed assets 492 23 Gain on sale of shares in subsidiaries - 207 Other 2 - Total extraordinary income 494 230
Extraordinary loss Loss on disposal of fixed assets 49 223 Impairment loss 1,183 1,015 Other 128 91 Total extraordinary loss 1,361 1,330
Profit before income taxes 4,389 5,122 Income taxes - current 2,218 2,385 Income taxes - deferred (275) 202 Total income taxes 1,942 2,587 Profit 2,446 2,535 Profit (loss) attributable to non-controlling interests 22 (30) Profit attributable to owners of the parent 2,424 2,565

9
Consolidated Statements of Comprehensive Income (millions of yen)
Year ended
December 31, 2018 Year ended
December 31, 2019 Amount Amount
Profit 2,446 2,535 Other comprehensive income
Net unrealized gain (loss) on available-for-sale securities
(75) 69
Deferred gain (loss) on derivatives under hedge accounting
(249) (255)
Foreign currency translation adjustments (397) (39) Remeasurements of defined benefit plan 0 (1) Share of other comprehensive income of entities accounted for using equity method
- (5)
Total other comprehensive income (722) (232) Comprehensive income 1,724 2,302
(Breakdown) Comprehensive income attributable to owners of the parent 1,731 2,332
Comprehensive income (loss) attributable to non-controlling interests
(6) (30)

10
(3) Consolidated Statements of Changes in Net Assets
Year ended December 31, 2018 (January 1 to December 31, 2018)
(millions of yen) Shareholders’ equity
Capital stock Capital surplus Retained earnings Treasury stock
Total shareholders’
equity Balance at beginning of term 472 634 33,816 (892) 34,030 Changes during term Cash dividends (477) (477) Profit attributable to owners of
the parent 2,424 2,424
Change in scope of consolidation 85 85
Net changes in items other than shareholders’ equity
Total changes during term - - 2,032 - 2,032
Balance at end of term 472 634 35,849 (892) 36,063
Accumulated other comprehensive income
Non-controlling interests
Total net assets Net unrealized gain (loss) on available-for-sale securities
Deferred gain (loss) on
derivatives under hedge accounting
Foreign currency
translation adjustments
Remeasurements of defined
benefit plans
Total accumulated
other comprehensive
income Balance at beginning of term
(66) - 250 (5) 178 1,572 35,781
Changes during term
Cash dividends (477) Profit attributable to owners of the parent
2,424
Change in scope of consolidation 85
Net changes in items other than shareholders’ equity
(75)
(249) (368) 0 (692) (38) (731)
Total changes during term
(75) (249) (368) 0 (692) (38) 1,300
Balance at end of term
(142) (249) (118) (4) (514) 1,533 37,081

11
Year ended December 31, 2019 (January 1 to December 31, 2019)
(millions of yen) Shareholders’ equity
Capital stock Capital surplus Retained earnings Treasury stock
Total shareholders’
equity Balance at beginning of term 472 634 35,849 (892) 36,063 Changes during term Cash dividends (477) (477) Profit attributable to owners of
the parent 2,565 2,565
Net changes in items other than shareholders’ equity
Total changes during term - - 2,088 - 2,088
Balance at end of term 472 634 37,937 (892) 38,151
Accumulated other comprehensive income
Non-controlling interests
Total net assets Net unrealized gain (loss) on available-for-sale securities
Deferred gain (loss) on
derivatives under hedge accounting
Foreign currency
translation adjustments
Remeasurements of defined
benefit plans
Total accumulated
other comprehensive
income Balance at beginning of term
(142) (249) (118) (4) (514) 1,533 37,081
Changes during term
Cash dividends (477) Profit attributable to owners of the parent
2,565
Net changes in items other than shareholders’ equity
69 (255) (45) (1) (232) (1,533) (1,766)
Total changes during term
69 (255) (45) (1) (232) (1,533) 322
Balance at end of term
(72) (504) (163) (5) (747) - 37,404

12
(4) Consolidated Statements of Cash Flows
(millions of yen)
Year ended
December 31, 2018 Year ended
December 31, 2019 Amount Amount
Cash flows from operating activities Profit before income taxes 4,389 5,122 Depreciation and amortization 3,275 3,140 Impairment loss 1,183 1,015 Amortization of goodwill 266 267 Amortization of bond issuance costs 20 20 Increase (decrease) in provision for directors’ retirement
benefits 45 47 Increase (decrease) in allowance for doubtful receivables 11 4 Increase (decrease) in net defined benefit liability (49) (1) Interest and dividend income (38) (114) Interest expenses 233 422 (Gain) loss on sales of shares in subsidiaries - (207) (Gain) loss on redemption of investment securities - 12 Compensation income - (70) Loss on disposal of fixed assets 49 223
(Gain) loss on sales of fixed assets (491) (23) Shop closing expenses 90 72 (Gain) loss on valuation of derivatives (7) (13)
(Gain) loss on investments in silent partnership (150) (153) Foreign exchange (gain) loss 11 36
(Increase) decrease in notes and accounts receivable – trade (173) 20
(Increase) decrease in inventories 57 (28) Increase (decrease) in notes and accounts payable - trade (22) (138)
Increase (decrease) in advances received 262 555 Increase (decrease) in accrued consumption taxes 176 (185) (Increase) decrease in other assets (2) 136 Increase (decrease) in other liabilities (324) (169) Other (236) 92
Sub total 8,578 10,084 Interest and dividends received 18 15 Interest paid (230) (422) Income taxes paid (2,316) (2,449) Compensation income - 70 Net cash provided by (used in) operating activities 6,050 7,297

13
Year ended
December 31, 2018 Year ended
December 31, 2019
Amount Amount Cash flows from investing activities
Purchase of tangible assets (7,255) (10,969) Proceeds from sales of tangible assets 6,800 50 Purchase of intangible assets (38) (88) Purchase of investment securities - (2,521) Proceeds from sales of investment securities 67 395 Repayment of contributions from the silent partnership 82 78 Loans receivable (26) (22) Lease and guarantee deposits (143) (590) Collection of lease and guarantee deposits 200 128
Proceeds from sales of shares of subsidiaries resulting in change in scope of consolidation - 770 Other- net (63) (68) Net cash provided by (used in) investing activities (375) (12,838)
Cash flows from financing activities
Net increase (decrease) in short-term debt (8,100) - Proceeds from long-term debt 17,520 11,990 Repayments of long-term debt (4,164) (3,400) Proceeds from issuance of bonds 201 2,689 Payments for redemption of bonds (744) (590) Payments for redemption of convertible bonds (500) - Dividends paid to non-controlling interests (31) -
Dividends paid to shareholders (477) (476) Repayment to non-controlling interests - (525) Net cash provided by (used in) financing activities 3,704 9,686
Foreign currency translation adjustments on cash and cash equivalents (3) (4)
Net increase (decrease) in cash and cash equivalents 9,375 4,141 Cash and cash equivalents, beginning of period 14,896 24,117 Decrease in cash and cash equivalents resulting from exclusion of subsidiaries from consolidation (154) -
Cash and cash equivalents, end of period 24,117 28,259

14
(5) Notes on Consolidated Financial Statements
(Note on the Going-concern Assumption)
Not applicable
(Changes in Significant Subsidiaries for Fiscal 2019) BEST LIFE STYLE Inc. has been added to the scope of consolidation, due to its establishment during the second quarter of fiscal 2019. Additionally, due to the Company having sold a portion of its shareholding, BT KALAKAUA, LLC has been excluded from the scope of consolidation and was consequently been made an equity method affiliate from the end of the second quarter of fiscal 2019.
(Changes in Method of Presentation) (Consolidated Statements of Income) “Loss on disposal of fixed assets,” which was included under “Other” of the “Extraordinary loss” in the previous fiscal year, has exceeded 10% of the total amount of extraordinary losses. It has therefore been reclassified under a separate and independent heading. The financial statements for the previous fiscal year have therefore been restated in order to reflect this change in the method of presentation. Accordingly, 178 million yen shown under “Other” of “Extraordinary loss” in the consolidated statements of income for the previous fiscal year has been reclassified as 49 million yen in “Loss on disposal of fixed assets” and 128 million yen in “Other.”
(Additional Information)
(Application of “Partial Amendments to Accounting Standard for Tax Effect Accounting”) “Partial Amendments to Accounting Standard for Tax Effect Accounting” (ASBJ Statement No. 28 of February 16, 2018) have been applied, effective from the first quarter of the fiscal 2019. Accordingly, deferred tax assets are shown under investments and other assets, while deferred tax liabilities are shown under fixed liabilities.

15
(Segment Information)
1. Overview of reportable segment
The Group’s reportable segments are components of the Group for which separate financial information is available. These segments are subject to periodic examinations to enable the Company’s board of directors to decide how to allocate resources and assess performance.
The Group’s operations are classified into three reportable segments: the “Wedding business” that provides services such as planning and operation related to wedding ceremonies and banquets in Japan and overseas, the “Hotel business” that offers the management of hotel weddings and banquets, and provision of hotel accommodation services, and the “W&R business” segment that provides reflexology services and management of a spa complex and a comprehensive fitness club.
“Wedding business” comprises outlet management in Japan and sales to customers, provision of food and drinks at wedding banquets, dress rental and beauty care services, as well as management of venues and operations for weddings and banquet in Hawaii and Bali, mainly for customers who book through the Group’s sales salons in Japan.
“Hotel business” offers the management of hotel weddings and banquets, and provision of hotel accommodation services at “Hotel InterContinental Tokyo Bay,” “The Strings by InterContinental Tokyo,” “The Strings Hotel Yagoto Nagoya,” and at “The Strings Hotel Nagoya.”
“W&R business” operates a British-style reflexology salon, “Queensway” with a high level of skills and sophisticated know-how of attending to customers, as well as managing a spa complex, “Beauty &Relax SPA-HERBS,” and “BEST STYLE FITNESS” comprehensive fitness clubs.
2. Calculation of net sales, income/loss, assets, liabilities, and other items by reportable segment
Accounting methods applied in the reportable business segments are in accordance with the accounting policies that are adopted for the preparation of consolidated financial statements.
Reportable segment income is based on operating income. Intersegment sales or transfers are based on market price.

16
3. Net sales, income/loss, assets, liabilities, and other items by reportable segment
Year ended December 31, 2018 (January 1 to December 31, 2018) (millions of yen)
Reportable segment
Wedding business
Hotel business
W&R business
Total Adjustments
(note 1)
Amount recorded on consolidated
financial statements
(note 2) Net sales Sales to outside customers
38,113 18,244 3,839 60,197 - 60,197
Inter-segment sales and transfers
1,447 344 1 1,793 (1,793) -
Total 39,560 18,588 3,841 61,990 (1,793) 60,197 Segment income (loss) 6,333 981 (426) 6,888 (1,638) 5,249 Segment assets 27,731 24,919 5,233 57,885 32,977 90,862 Other items Depreciation/amortization 1,733 1,106 361 3,200 74 3,275 Amortization of goodwill - 128 138 266 - 266 Increase in tangible and intangible assets
1,955
1,612
861 4,429 3,251 7,680
Notes: 1. Details of adjustments are as follows: (1) The minus 1,638 million yen adjustment for segment income or loss includes 114 million yen elimination of inter-
segment sales and minus 1,753 million yen of unallocated corporate expenses. The main component of these unallocated corporate expenses is general and administrative expenses that are not attributable to reportable segments.
(2) The 32,977 million yen adjustment for segment assets comprises unallocated corporate assets. Unallocated corporate assets consist mainly of cash and deposits held by the Company which are not attributable to reportable segments.
(3) The 74 million yen adjustment for depreciation/amortization comprises depreciation/amortization for unallocated corporate assets.
(4) The 3,251 million yen adjustment for increase in tangible and intangible assets comprises investments in unallocated corporate assets.
2. Segment income or segment loss is adjusted to correspond with operating income reported on the consolidated statements of income.

17
Year ended December 31, 2019 (January 1 to December 31, 2019) (millions of yen)
Reportable segment
Wedding business
Hotel business
W&R business
Total Adjustments
(note 1)
Amount recorded on consolidated
financial statements
(note 2) Net sales Sales to outside customers
39,414 17,768 3,939 61,121 - 61,121
Inter-segment sales and transfers
1,630 348 17 1,997 (1,997) -
Total 41,045 18,117 3,956 63,119 (1,997) 61,121 Segment income (loss) 7,797 477 (229) 8,045 (1,661) 6,383 Segment assets 34,334 32,280 4,804 71,420 27,923 99,343 Other items Depreciation/amortization 1,623 1,089 286 2,998 141 3,140 Amortization of goodwill 0 128 138 267 - 267 Increase in tangible and intangible assets
1,906
9,436
237 11,580 63 11,643
Notes: 1. Details of adjustments are as follows: (1) The minus 1,661 million yen adjustment for segment income or loss includes 128 million yen elimination of inter-
segment sales and minus 1,790 million yen of unallocated corporate expenses. The main component of these unallocated corporate expenses is general and administrative expenses that are not attributable to reportable segments.
(2) The 27,923 million yen adjustment for segment assets comprises unallocated corporate assets. Unallocated corporate assets consist mainly of cash and deposits held by the Company which are not attributable to reportable segments.
(3) The 141 million yen adjustment for depreciation/amortization comprises depreciation/amortization for unallocated corporate assets.
(4) The 63 million yen adjustment for increase in tangible and intangible assets comprises investments in unallocated corporate assets.
2. Segment income or segment loss is adjusted to correspond with operating income reported on the consolidated statements of income.

18
(Per Share Information) Year ended December 31, 2018 Year ended December 31, 2019 Net assets per share 745.24 yen 784.15 yen Profit per share 50.82 yen 53.78 yen Diluted profit per share 50.40 yen - yen
Note: The calculation base for profit per share and diluted profit per share is as follows:
Year ended
December 31, 2018 Year ended
December 31, 2019 Profit per share
Profit attributable to owners of the parent (millions of yen) 2,424 2,565
Amount not attributable to common stockholders (millions of yen) - -
Profit attributable to common stock of owners of the parent (millions of yen) 2,424 2,565
Average number of common stock outstanding during the term (shares) 47,700,166 47,700,166
Diluted profit per share
Adjustment to profit attributable to owners of the parent (millions of yen) - -
Increase in the number of common stock (shares) 398,739 -
[Of which convertible bonds with stock acquisition rights (shares)] [398,739] [ - ]
Residual securities that are not dilutive and not included in the calculation for diluted profit per share
-
Note: Diluted profit per share for fiscal 2019 is not disclosed, as there are no dilutive shares. (Significant Subsequent Events)
Not applicable

19
4. Other Information (1) Changes in Officers
Not applicable
(2) Weddings Held and Orders Received
1) Number of weddings held Year ended December 31, 2018 Year ended December 31, 2019
Segment Number of weddings held (cases) Number of weddings held (cases) Wedding business 12,806 12,385
Hotel business 1,712 1,611
Total 14,518 13,996 2) Wedding orders received
Year ended December 31, 2018 Year ended December 31, 2019
Segment Orders received
(cases) Order backlog
(cases) Orders received
(cases) Order backlog
(cases) Wedding business 12,976 7,119 11,784 6,518
Hotel business 1,775 1,179 1,463 1,031
Total 14,751 8,298 13,247 7,549