Embed Size (px)
Citation preview

Trust, Risk and Betrayal
Iris Bohnet* and Richard Zeckhauser**
Using experiments, we examine whether the decision to trust a stranger in a one-shot
interaction is equivalent to taking a risky bet, or if a trust decision entails an additional
risk premium to balance the costs of trust betrayal. We compare a binary-choice Trust
game with a structurally identical, binary-choice Risky Dictator game with good or bad
outcomes. We elicit individuals’ minimum acceptable probabilities (MAPs) of getting
the good outcome such that they would prefer the gamble to the sure payoff. First movers
state higher MAPs in the Trust game than in situations where nature determines the
outcome.
Keywords: Trust, risk, dictator game, betrayal cost, experiments
JEL classification: C72, C91, J15, J16
* Corresponding author: Kennedy School of Government, Harvard University, 79 JFK Street, Cambridge, MA 02138, phone: (617) 495-5605, fax: (617) 496-5747, email: [email protected] ** Kennedy School of Government, Harvard University, 79 JFK Street, Cambridge, MA 02138, email: [email protected] We thank Karen Cook, Rachel Croson, David Laibson, Robert Slonim, and the participants of the “Trust and Institutions” conference at the Radcliffe Institute, Harvard University, 2003, and the Economic Science Association meetings, 2003, for their helpful comments. Yael Baytelman and Jeffrey Bielicki provided excellent research assistance. Financial support from the HBS research fund, the Russell Sage Foundation and the Women and Public Policy Program at the Kennedy School of Government is greatly appreciated.

1. Introduction
“It’s a vice to trust all, and equally a vice to trust none.” This sentiment—from
Seneca’s Letters to Lucilius—inspired our research on when and whom to trust. Seneca,
the great Roman first-century statesman and philosopher, recognized that trust always
involves a gamble. Nineteen centuries later, playwright Tennessee Williams noted the
distinctive costs of betrayal: “We have to distrust each other. It's our only defense against
betrayal.”
Today’s world of depersonalized investments and purchases by Internet enables
us to secure great benefits from specialization, thus catering to particular preferences and
providing diversification. But one price of engaging in consequential relationships at a
distance is that one must choose to trust strangers. This paper conducts experiments to
determine if the decision of whether or not to trust a stranger in a one-shot interaction is
equivalent to taking a risky bet, or if trust decisions entail an additional risk premium to
balance the costs of trust betrayal.
To differentiate between risk preferences and possible betrayal costs as factors in
decisions, we employ a novel design for trust experiments.1 We compare a binary-choice
Decision problem, where nature determines the outcome if people decide to trust, with a
binary-choice Trust game offering the same setup and payoffs.
We consider a decision format where a first mover (the Decision Maker) has to
choose between S (sure-thing) and T (trust). S results in a sure outcome S and T yields a
risky outcome that can be either G (good) or B (bad) for the Decision Maker. The
Decision Maker’s preference ordering is G > S > B. We first consider the decision when
1 For related designs focusing on behavior in the ultimatum game, see Blount (1995), Bolton, Brandts and Ockenfels (2000) and Pillutla and Murnighan (1996).
2

the chance outcome after T involves a lottery. We then see what happens when the
outcome after T is determined by a second mover (the Trustee), whose payoffs at B, G,
and S, are respectively C, H, and S, with C > H > S. (For mnemonic purposes C pairs
with B and H with G. See Figure 1.) This ordering implies that the Trustee would prefer
that the Decision Maker pick T. However, if T were picked, since C > H, the Trustee
would have the temptation to “betray” and select B, making the Decision Maker worse
off than had he chosen S.2 Presumably some individuals are trustworthy and pick G;
others are not and choose B. Our central question is whether a Decision Maker merely
makes a probabilistic assessment of trustworthiness, and then acts as if he were choosing
between a certainty and a lottery, or whether the need to trust introduces additional
elements. That is, do the prospects for betrayal influence the Decision Maker’s decision
beyond mere probabilities?
Figure 1: Monetary payoffs in the Decision problem and the Trust game
(First payoff to Decision Maker, second to Trustee)
DM
S, S Trustee, Nature
B, C G, H
Sure Trust
2 For clarity, we treat the first mover as male and the second mover as female.
3

A large body of work on trust, crossing many disciplines, assumes that the
willingness to trust is closely associated with the willingness to take risk (for example,
within economics see Ben-Ner and Putterman 2001; within philosophy see Luhmann
1979; within sociology, see Cook and Cooper 2003).3 Empirical evidence, however, is
mixed. Results seem to depend on the measurement procedure used. Eckel and Wilson
(this volume) find that subjects’ self-reported risk attitudes (or “sensation seeking” as
measured by the Zuckerman Scale) influence the trust decision in a simplified version of
the investment game (Berg et al. 1995), but subjects’ revealed risk preferences for
financial stakes do not. Ashraf et al. (2003) also do not find any relationship between
risk preferences revealed in a risky-choice tasks and trust decisions in the investment
game.
Snijders and Keren (1998) measure risk directly in a trust game similar to ours.
They define risk as (S-B)/(G-B), which gives the probability of earning G that makes a
risk neutral person indifferent between trusting and not trusting. Varying the payoff
structure, the authors find that the risk ratio strongly affects trust. In addition to risk, the
willingness to trust is also influenced by “temptation,” (C-H)/(C-B), a measure of the
Trustee’s incentive to betray trust.4
While an attractive design, the risk preferences measured by Snijders and Keren
(1998) are influenced by the fact that risk is evaluated in the context of a Trust game.
Risk taking may be influenced by the Decision maker’s expectations of trustworthiness
3 See also the recent survey of trust experiments by Camerer (2003). Hardin (2002) critically discusses the approaches that equate trust with a gamble or a risky investment. 4 They find that subjects with an organ donor card also trusted more, suggesting that trust is also related to other-regarding preferences (which is corroborated by the findings by Ashraf et al. 2003 and Cox 2003).
4

(or expected “temptation”), and by the fact that it is not nature but another person who
decides whether the Decision Maker will earn B or G. In contrast, the instruments used to
measure risk preferences in the studies by Ashraf et al. (2003) and Eckel and Wilson (this
volume) seem to be quite removed from the Trust decision, involving choices between
lotteries whose payoffs differ from the payoffs used in the Trust game. Most importantly,
the typical choice task in a risky decision experiment does not involve a second person.
Rather, the first mover’s choice affects only his own payoffs and does not lead to
potential payoff differences between him and a second person. We address these issues
in our design.
We start with a standard risky-choice task, the Decision problem. For it, we elicit
people’s minimum acceptable probabilities (MAPs) of earning G for which they would
just prefer the gamble to the sure payoff S. We inform subjects that prior to the
experiment we determined a probability, p*, of receiving G. If their MAP is higher than
p*, they will earn S. However, they will play the gamble with probability p* if their
MAP is lower than or equal to p*. The higher one’s MAP, the higher p* must be for the
person to choose T over S. Thus, the less one likes one or both outcomes in T, the higher
will be one’s MAP. This mechanism is incentive compatible, i.e., a rational Decision
Maker should be indifferent between S and the gamble with the reported MAP, since
individuals cannot affect the probability they receive in the lottery.5
5 This is equivalent to asking a consumer her willingness-to-pay for a good, with the understanding that the good will be purchased at the market price if the market price turns out to be lower than the stated price. She has no reason to misrepresent. This is a theoretical argument. We cannot exclude the possibility that our elicitation procedure affects behavior differently than, for example, a standard choice task. Boles and Messick (1990), for example, found that people sometimes regret the consequences that result when such minimal thresholds are implemented.
5

Our procedure is closely related to the Becker-DeGroot-Marshak elicitation
procedure. The principal difference is that we do not generate p* randomly from a
uniform distribution. In the Trust game, p* depends on the distribution of Trustees’
actions. Given our procedure, truth-telling is as good as anything else. It is strictly
dominant—the accomplishment of the Becker-DeGroot-Marschak mechanism—if
subjects subjectively assign positive probability to values of p* in the immediate
neighborhood of their MAP. Potential differences in subjective probability distributions
in the three decision situations do not matter as long as this condition is satisfied.
Our goal is to compare the Decision problem to the Trust game. However, the
Trust game has an additional element beyond the Decision problem: payoffs go to two
players, the Decision Maker and a second person. To reproduce this element apart from a
trust situation, we developed a second treatment, the Risky Dictator game. In it, the
Decision Maker’s choice affects a Recipient’s payoffs as well as his own. The Recipient
is merely that; she makes no decision. As before, the Decision Maker can take a sure
payoff, S, or take a chance between G and B. The probability of earning G is p*. His
choice, and the outcome of the gamble if taken, determines the Recipient’s payoff. The
Recipient receives S if the Decision Maker chooses S. If the Decision Maker chooses T,
the Recipient gets H or C, where C > H > S (see Figure 1).
The Trust game, which we compare to the Risky Dictator game, offers the same
payoffs for the Decision Maker as both the Decision problem and the Risky Dictator
game. It has the same payoffs for the Trustee as the Risky Dictator game has for the
Recipient. The critical difference for the Trust game is that if T is chosen, another player,
the Trustee, not nature, determines the outcome. The Trustee prefers the outcome at B to
6

that at G, whereas the Decision Maker prefers G. The probability of earning G is p*,
which is determined by the fraction of Trustees who reward trust. To determine the value
of p* experimentally, we ran the Trust game first and then employed the identical p* in
the Decision problem and the Risky Dictator game.
If Decision Makers care only about their own payoffs and the probabilities of
securing them, the MAPs in all three games should be the same. However, concerns
about payoffs to others could create a wedge between the MAPs in the Decision problem
and the Risky Dictator game. Recent theoretical models and much empirical evidence
suggest that the Decision Maker may be motivated by altruism (Andreoni and Miller
2002), efficiency gains to the dyad (Charness and Rabin 2002), or concerns about
disparities in payoffs (Fehr and Schmidt 1999, Bolton and Ockenfels 2000). Fehr and
Schmidt (2001) survey the evidence. For the numerical payoffs we employed, altruism
and efficiency preferences increase the attractiveness of the gamble in the Risky Dictator
game compared to the Decision problem. This would lead to lower MAPs in the former
than in the latter. By contrast, inequality aversion makes the gamble less attractive,
inducing higher MAPs in the Risky Dictator game than in the Decision problem. The net
influence of the two effects is unclear, and would presumably depend on the size of the
payoffs.
Our main interest is in the differences in decisions taken in the Trust game and in
the two other games. Our principal hypothesis is that it is fundamentally different to trust
another person than to rely on a random device that offers the same outcomes: people are
averse to being betrayed.7 Betrayal aversion is in line with recent theoretical models and
7 Although people may dislike being betrayed for individualistic reasons, their feelings could be reinforced through their understanding of the special significance of trust in society, as one of the referees noted. In a
7

empirical evidence that people care about how outcomes came to be, or others’ intentions
(Rabin 1993, Charness and Rabin 2002). Thus, we conjecture that we will see higher
MAPs in the Trust game than in the Risky Dictator game. We also hypothesize that such
differences in MAPs apply to all demographic sub-groups. Even though some groups
may be more risk averse or less likely to trust than others, we expect betrayal aversion to
be a universal phenomenon. This paper tests main effects and controls for differences
between various demographic sub-groups.
Our paper is organized as follows: Section 2 presents the central hypothesis, and
Section 3 the details of the experimental design. Section 4 reports the results, and Section
5 concludes.
2. Central Hypothesis
Our central hypothesis is that individuals incur an additional, non-monetary loss
when their trust is betrayed by their Trustee. This will make them more reluctant to take
a chance on another individual being trustworthy, as opposed to taking a chance on a
random device. We measure this effect by comparing MAPs across games.
Consider an individual with von Neumann-Morgenstern preferences choosing
between S and T for the Decision problem described in the Introduction. He attaches
utilities to the three outcomes, denoted as US, UG and UB. His MAP will satisfy the
equation
US = MAP(UG) + (1-MAP) UB . (1)
recent issue of Science, Martin Nowak and Karl Sigmund (2000) called trust and reciprocity the “basis of all human systems of morality”, and Sissela Bok (1978: 31) argued that “whatever matters to human beings, trust is the atmosphere in which it thrives.”
8

Solving for MAP, we have
MAP = (US - UB)/(UG - UB). (2)
Note that this formulation is general, and can allow for a payoff to another player.
Thus, it applies to the Risky Dictator (RD) and Trust games (Trust), not merely the
Decision problem (DP).
Our principal conjecture is that when a Decision Maker gets the bad outcome in
the Trust game—when his trust is betrayed—he incurs an additional negative element.
We call this a betrayal cost. This implies that
UB(Trust) < UB(RD), (3)
even when the monetary payoffs are the same in the two games.8
What happens to MAP as UB falls? A falling UB makes the gamble less attractive,
implying that MAP will have to be raised if the decision maker is to remain indifferent
between S and T.9 Hence, our theory predicts that individuals will have a greater MAP
for the Trust game than for the Risky Dictator game, although the payoffs are identical:
MAPTrust > MAPRD.
3. Experimental design
We employ three treatment conditions to test for the role of betrayal aversion, a
Decision problem, a Risky Dictator and a Trust game. The games have identical payoffs
8 We assume that US and UG are the same in the two games. We will further discuss different assumptions for US below. UG(Trust) > UG(RD) if people derive an additional benefit from having trust rewarded (an “honor reward”) that exceeds the utility from a good outcome produced by chance. If honor rewards matter, betrayal costs have to be larger to lead to our prediction: MAPTrust > MAPRD. We observe net outcomes in our experiments only. They could be due to betrayal costs or to a combination of betrayal costs and honor rewards. 9 The derivative of MAP with respect to UB is negative as US < UG: dMAP/dUB = (US – UG)/(UG - UB)2. This implies that a falling UB increases the MAP.
9

for the Decision Maker. The Risky Dictator game and the Trust game have a second
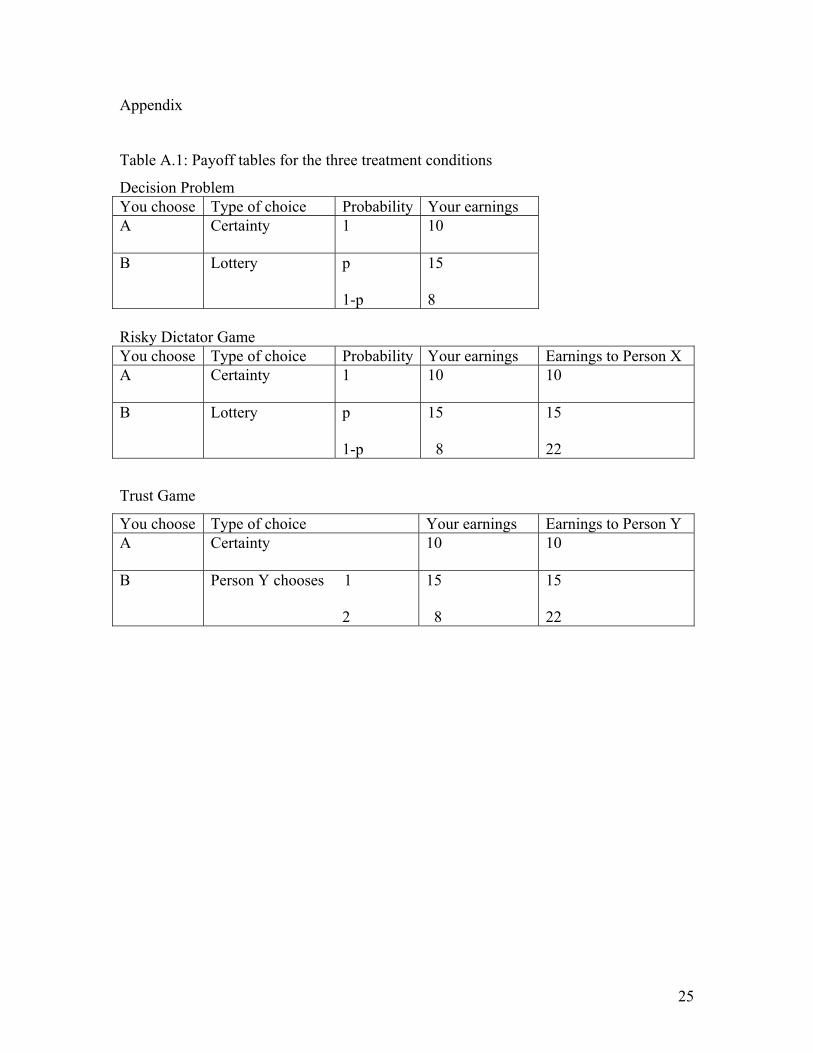
player, called respectively Recipient, and Trustee. In our experiments, S=10, G=15, B=8,
H=15, and C=22. The payoffs were presented to subjects in a matrix form with neutral
terminology. (See Table A.1 in the Appendix.) Payoffs were given in points, which were
converted 1:1 into US dollars at the end of the experiment.
Our experiments were run in the experimental laboratory of the Harvard Business
School. Participants were recruited by advertisements in student newspapers in the
greater Boston area. 145 people participated, 25 Decision Makers in the Decision
problem, 29 pairs in the Risky Dictator game, and 31 pairs in the Trust game. We first ran
the Trust game in two sessions, then the Decision problem in one session and the Risky
Dictator game in two sessions. Subjects earned a $10-show up fee and received on
average an additional $13 for an experiment that took approximately 30-40 minutes.
We did not inform any of our subjects on the value of the probabilities involved in
the risky choice but asked them to indicate their minimum acceptable probability (MAP)
of earning G such that they would be willing to accept the gamble rather than the sure
outcome. If their MAP was higher than a predetermined probability, p*, they were taken
to reject the chance outcome. They were paid the sure payoff. If their MAP was lower
than or equal to p*, we conducted the lottery (Decision problem and Risky Dictator
game) or let the Trustee decide (Trust game). The lower one’s MAP, the more one is
willing to take the risk.
The value of p* was established by the fraction of Trustees who chose to reward
trust in the Trust game in the first two sessions. Though it was not necessary for the
experiment, the payoffs were selected (and pre-tested in classroom experiments) so that
10

the expected fraction of trustworthy Trustees would be close to the value of p that makes
a risk neutral player indifferent between choosing the sure outcome or the gamble, which
implies a 0.285 chance of G. In the first Trust experiment, 4 out of 14 Trustees rewarded
trust (p=0.286) and in the second session, 5 out of 17 Trustees rewarded trust (p=0.294),
or p=0.290 overall. In practice, we set p* = 0.29 by having 29 white marbles in an urn of
100 marbles.
In the Decision problem and the Risky Dictator game, we informed Decision
Makers that p* had been determined before they made their decisions. They were not told
how it was arrived at. The value of p* was written on a piece of paper and sealed in an
envelope that everyone could see taped to the blackboard.
The Trust game required a different treatment for p*. We asked Trustees whether
they would pick G if the Decision Maker selected T.10 We asked Decision Makers, who
were assigned Trustees at random, what minimum percentage of trustworthy behavior
(MAP) they would require to select T. If the percentage of trustworthy Trustees in their
experiment was equal to or exceeded their MAP, we informed them of this, and the two
payoffs were decided by whether their Trustee then chose G or B. Otherwise, we
informed them that the percentage of trustworthy Trustees in their experiment was lower
than their MAP, and thus they would earn the sure payoff of 10.
Each session was organized as follows:
1. Description of the game and the rules of conduct (identical for Decision Makers and second movers for games that involve both). The payoffs were presented and described both in writing and orally to establish common knowledge. Subjects were informed that this was a one-shot interaction, that, except in the DP, they were randomly matched with another person present in
10 That is, we used the strategy method for Trustees. This method has been found to produce similar results in the investment game as standard experimental choice procedures (e.g., Ashraf et al. 2003).
11

the room, that they were identified by code numbers only and would remain anonymous.
2. Explanation of decisions (different for Decision Makers and second movers).
The Decision Makers and the second movers were given different sets of instructions, detailing their own decision. They were not informed on the exact wording of their counterpart’s decision. Most importantly, Trustees were not informed that Decision Makers were asked to state their MAP of being paired with a Trustee who rewards trust since we did not want Trustees to try to influence p*. Decision Makers knew that Trustees were neither informed on p* nor that their actions would determine p*.
a. Decision Makers were asked in the three games: Trust: “How large would the probability of being paired with a Person Y who chose option 1 have to be for you to pick B over A?” DP and RD: “How large would p have to be for you to pick B over A?” In all treatments, they were toldd that if their p is lower than or equal to p*, they would play the gamble, and if it was higher than p*, they would earn S.
b. Second movers were asked (Trustees in Trust, Recipients in RD and no second mover in DP) Trust: ”Which option, 1 or 2, do you choose in case B?” RD: “Please wait until your counterpart has made a decision.”
3. Quiz We tested whether Decision Makers understood the task and made sure that everyone had answered the test questions correctly before continuing.11
4. Decision making
Trust: Decision Makers and Trustees made their decisions simultaneously. DP and RD: Only Decision Makers had a decision to make.
5. Information on p* and its implications for each subject We informed everyone on the details of the decision procedure and on p*. Trust: Here p* was the fraction of Trustees who had chosen to reward trust in their session. If p* was greater than or equal to a Decision Maker’s MAP, his Trustee’s decision determined the outcome. If p* was less than her MAP, he got the sure outcome. DP and RD: We opened the envelope and informed subjects that p*=0.29. If p* was greater than or equal to a Decision Maker’s MAP, he got the gamble.12 If p* was less than his MAP, he got the sure outcome.
11 We presented a number of hypothetical scenarios to Decision Makers, covering the whole range of possible p-values, such as: Assume that your p=0.05 and p*=0.1. Will you participate in the lottery or not? In each session, there were 1 to 3 Decision Makers who did not understand the game in the first attempt. We corrected their mistakes, gave the corrected quiz back, and asked them to answer more questions. We proceeded with the experiment once everyone had answered a set of three questions correctly. 12 We conducted the lottery as follows: We put 29 white and 71 black marbles into a bowl. For each first mover with p*≥ MAP, we pulled a ball from the bowl (and then replaced it). We informed the subjects for which code number we were conducting the lottery. If the marble was white, they (and their Recipient in
12

6. Questionnaire and payment
Subjects completed a questionnaire (see Table A.2 in the Appendix) while we put their earnings in sealed envelopes marked with their code numbers. Subjects collected their earnings by presenting their code numbers.
4. Experimental Results
We focus on treatment effects first. We then test for their robustness by including some
key demographic variables. Table 1 and Figure 1 summarize our primary findings.
Table 1: MAPs in the three treatments: means, medians, modes, [N]
Decision Problem Risky Dictator Game Trust Game Mean Median Mode N
0.37 0.3 0.29 [25]
0.32 0.29 0.29 [29]
0.54 0.5
0.75 [31]
The overall pattern is clear. MAPs are much higher in the Trust game than in the
Risky Dictator game (or in the Decision problem). In contrast, MAPs in the Risky
Dictator game do not seem to differ from the MAPs in the Decision problem. The figure
below shows the complete distribution of values for the three conditions.
the Risky Dictator game) earned G. If the marble was black, they earned B (and their Recipient earned F in the Risky Dictator game).
13

Figure 1: Cumulative distributions of MAP’s
0%10%20%30%40%50%60%70%80%90%
100%
<.1 <.2 <.3 <.4 <.5 <.6 <.7 <.8 <.9 <1
MAP
Decision Risky Dictator Trust
We now investigate the significance of those differences.
Result 1:
MAPTrust>MAPRD
The mean and median MAPs are noticeably higher in the Trust game than in the Risky
Dictator game. A nonparametric ranks test revealed that Trust game MAPs were
significantly higher (Mann-Whitney Z=-3.430, p<0.01).
Our results suggest that the decision to trust is influenced by more than just risk,
other-regarding, and efficiency preferences. People care not only about the payoff
14

outcome but also about how the outcome came to be. They behave as though there is a
betrayal cost above and beyond any dollar losses.13
Result 2:
MAPRD=MAPDP
The mean and median MAPs are quite similar in the Risky Dictator game and in the
Decision problem. A nonparametric ranks test did not identify any significant
differences. Our results suggest that a willingness to take a gamble that will definitely
benefit another party is not strongly influenced on net by either payoff comparisons or
efficiency differences.
There is an interesting anomaly in the Risky Dictator game at the bottom end.
28% of the Decision Makers had a MAP less than 0.285, the value that made T a
breakeven proposition. Presumably, these individuals were motivated by altruism or by a
concern for efficiency.
Our first two results are in line with our principal hypothesis, namely that there
are significant betrayal costs. Indeed, these costs are sufficient to swamp any honor
reward for receiving trustworthy behavior and getting G. As a result, subjects need a
much higher chance to receive the good outcome to choose T in the Trust game than in
the Risky Dictator game or the Decision problem.14
13 We discuss below alternative hypotheses that could conceivably produce the observed pattern. The difference in MAPs between the trust decision and other decisions may have been magnified because p* is relatively low in the range between 0 and 1. 14 The MAP for the Trust game is also significantly greater than the MAP for the Decision problem (Mann-Whitney Z=-2.696, p <0.01).
15

Result 3: Decision Maker’s Choices by Own Demographic Category
Do our results differ by standard demographic categories? There was little
variability in our subject pool in some important categories: All of our 145 subjects were
students (76 percent undergraduates), 88 percent were younger than 30, 89 percent were
American, 72 percent identified with a religion, and 92 percent ranked themselves in the
lower half of the income distribution on a scale from 1 to 6 (see Table A.2 in the
Appendix for the questionnaire).
Our sample varied most on gender and ethnicity. 42 percent of our subjects were
female, and 33 percent identified themselves as members of an ethnic or racial minority.
We focus on these two characteristics. Recent survey evidence suggests that “members of
a group that historically felt discriminated against,” particularly minorities and women,
are less likely than Caucasians or men to report that they “generally trust others” (Alesina
and LaFerrara 2002: 207). We examine whether women and minority group members in
our experiment had higher MAPs than men and Caucasians, respectively.
Table 2 gives the principal MAP results separately for each treatment condition
by our demographic groups, focusing on race and gender.
15 While the sample sizes get quite small, we do want to note that the Decision Maker’s identity seems to affect these assessments: Only 39 percent of the female but 59 percent of the male Decision Makers trust both sexes (chi2=2.959, p<0.1). 55 percent of the female Decision Makers trust women only and 30 percent of the male Decision Makers trust women only (chi2=4.586, p<0.05). 6 percent of the female and 11 percent of the male Decision Makers trust men only (tests n.a.). Only 45 percent of the minority responders but 76 percent of the Caucasians trust both categories (chi2=5.949, p<0.05). 50 percent of the minority Decision Makers but only 6% of Caucasians trust minority members only (chi2=17.883, p<0.01). 5 percent of the minority and 18 percent of Caucasian Decision Makers trust Caucasians only (tests n.a.). The in-group bias seems most pronounced among the groups that have traditionally been discriminated against, women and members of minorities.
16

Table 2. MAPs by Demographic Group, Mean, Median, [N]
Decision Problem Risky Dictator Game Trust Game Men Women
0.36 0.29 [14]
0.39 0.30 [11]
0.28 0.29 [16]
0.38 0.35 [13]
0.50 0.50 [19]
0.61 0.73 [12]
Caucasian Minority
0.37 0.3 [19]
0.39 0.33 [5]
0.26 0.29 [16]
0.40 0.33 [13]
0.51 0.53 [22]
0.62 0.70 [9]
We first compare results in the Decision problem. There were no significant
differences in the values of MAPs by gender or ethnicity. That is, members of these
groups were equally willing to take gambles on their own payoffs. If differences emerge
in the Risky Dictator game or the Trust game, it will be because the groups have different
preferences regarding payoffs to others, efficiency, or betrayal.
Looking at the Decision problem and the Risky Dictator game, we find that the
MAPs of women and minorities do not differ between the two treatments. Men and
Caucasians accept somewhat lower MAPs in the Risky Dictator game than in the
Decision problem, implying either some other-regarding preferences or tastes for
efficiency.17 Our results are in line with earlier findings on gender and efficiency
16 We report the results on the ethnicity of the trusted parties here for completeness but we cannot interpret them due to the small sample sizes. 17 For men: Mann-Whitney Z=-1.782, p=0.075; for whites: Mann-Whitney Z=-2.097, p=0.036. Comparing the behavior of men and women, Caucasians and minorities and those who trust both (or men) versus those who trust women only in RD reveals a significant difference for the last comparison only. Those who trust women only have significantly higher MAPs in RD than those who trust both or men (Mann-Whitney Z=-2.316, p=0.021).
17

preferences. Andreoni and Vesterlund (2001) and Ashraf et al. (2003) find that men
respond more strongly to efficiency gains in various non-risky versions of the dictator
game than women. While women have generally been found to be more generous (e.g.,
Bohnet and Frey 1999, Eckel and Grossman 1998), the relative cost of or benefits from
giving hardly affect their behavior. The relationship between race and risk, efficiency,
and other-regarding preferences has received little study.
Our primary interest is in differences in behavior between the Trust game and the
Risky Dictator game. For each of our demographic groups, the MAPs for the Trust game
substantially exceed those for the Risky Dictator game with equivalent payoffs. This
indicates that each of these groups is concerned with betrayal. Women and minorities
appear to have higher Trust game MAPs than their complementary groups but these
differences are not statistically significant.
Past evidence on the relevance of race and gender in trust experiments is mixed.
Results depend on the specifics of the experimental design (such as the degree of
anonymity between the players), and the country where the experiments were conducted.
For a subject pool similar to ours, Glaeser et al. (2000) report that minority and female
Harvard undergraduates are less likely than others to trust. Croson and Buchan (1999)
find no significant gender differences in trust experiments in the US and various Asian
countries. Ashraf et al. (2003) also report no significant gender differences but that
minority groups are less likely to trust (the race gap is more pronounced in South Africa
than in the United States). In a recent large-scale experiment focusing on gender, Buchan
et al. (2003) find that female students are less likely to trust than male students. Eckel and
Wilson (2003) are among the few who report a higher trust rate for American women
18

than for men. Generally, demographic variables seem to be more strongly associated with
the Trustee’s decision of whether or not to be trustworthy than with the Decision Maker’s
decision of whether or not to trust (Croson and Buchan 1999, Chaudhuri and
Gangadharan 2002, Cox 2003, Eckel and Wilson 2003).
Result 4: Decision Maker’s Choices by Preferred Demographic Category of Counterpart
Rather than focusing only on subjects’ own characteristics, we may learn more
about why Decision Makers demanded a certain MAP by looking at the demographic
characteristics of their preferred counterpart. Thus, we asked our subjects what an “ideal”
Trustee would look like, focusing again on the six characteristics, age, ethnicity, gender,
whether someone identifies with a religion, nationality, and economic situation (see
Table A.2). Within all categories of respondents, a majority indicates that it trusts all
groups.
Focusing on ethnicity/race, 67 percent of our respondents indicate that they trust
both Caucasians and members of a minority, 19 percent trust minority members only, and
14 percent trust Caucasians only (see Table A.3 in the appendix). Gender presents a
different picture. Only a slim majority of our Decision Makers trusts both men and
women (51 percent); 40 percent trust women only; and 9 percent trust men only. The
gender attributions of trustworthiness reported here conform to earlier findings on
gender-role stereotypic attributions of cooperation and defection in the prisoners’
dilemma game. King et al. (1991) found that both genders believe that a male is more
likely to defect.18
18 While the sample sizes get quite small, we do want to note that the Decision Maker’s identity seems to affect these assessments: Only 39 percent of the female but 59 percent of the male Decision Makers trust
19

Those who trust women only demand significantly higher MAPs than those who
trust both or only men. (MAPtrust women only=0.68 whereas MAPothers=0.49; Mann-Whitney
Z=-2.030, p=0.042). While the MAPs of those who trust women or minorities only
typically exceed their complementary groups’ MAPs, the differences in the Risky
Dictator game and the Decision problem are not statistically significant.
Result 5: Relative importance of treatment effects and demographic variables
To test more precisely whether our treatment effects are robust and whether the
identified sub-population differences indeed matter, we ran an OLS regression on MAPs
(see Table A.4). The regressions confirm the differences between the three treatment
conditions. Columns 1 and 2 show that the requested MAPs are higher in the Trust game
than in the Risky Dictator game, but that there is no difference between the Risky
Dictator game and the Decision problem. Nonwhite women demand noticeably higher
MAPs than everyone else. Their mean requested MAPs are 0.43 in the Decision problem,
0.52 in the Risky Dictator Game, and 0.74 in the Trust game. In column 3, we test
whether the gender of the ideal Trustee is related to the requested MAPs, and whether it
interacts with a subject’s own gender. We find that independent of own gender, those
both sexes (chi2=2.959, p<0.1). 55 percent of the female Decision Makers trust women only and 30 percent of the male Decision Makers trust women only (chi2=4.586, p<0.05). 6 percent of the female and 11 percent of the male Decision Makers trust men only (tests n.a.). Only 45 percent of the minority responders but 76 percent of the Caucasians trust both categories (chi2=5.949, p<0.05). 50 percent of the minority Decision Makers but only 6% of Caucasians trust minority members only (chi2=17.883, p<0.01). 5 percent of the minority and 18 percent of Caucasian Decision Makers trust Caucasians only (tests n.a.). The in-group bias seems most pronounced among the groups that have traditionally been discriminated against, women and members of minorities.
20

who trust only women demand significantly higher MAPs than those who either trust
men only or both.19
Alternative explanations
Our principal result is that individuals have higher MAPs in the Trust game than
in the Risky Dictator game with the same payoffs, or a Decision problem offering the
same own payoffs. Such a finding suggests that betrayal costs are consequential—costs
that make it less attractive to rely on a Trustee than a random device offering the same
probabilities. However, in addition to—or in place of—betrayal costs, other elements
could enter a Decision Maker’s utility function. We discuss competing hypotheses here
that could conceivably be compatible with our results.
It might appear that the desire to keep in control, rather than the costs of betrayal,
could be reducing the attractiveness of the Trust game and leading to MAPTrust>MAPRD.
The controllability of risk has been identified as an important determinant of risk
perceptions and risk taking in risky-choice tasks (e.g., Slovic et al. 1986). We rewrite
equation (1) from above to take the cost relating to a loss of control, K, into account:
US(Trust) = MAP(UG) + (1-MAP) UB - K. (4)
As the Risky Dictator game does not involve relinquishing control to a second
person, equation (4) implies that
US(Trust)>US(RD). (5)
19 We have also tested for interactions between the demographic variables and our treatments. As the summary statistics already suggest, neither the gender nor the race interactions are significant.
21

To compensate for the loss of control when trusting another person, a Decision
Maker thus would demand a higher MAP in the Trust game than in the Risky Dictator
game, which is what we find.
Alternative costs in the Trust game (suggested by one of the referees) include
assessment costs (i.e., the cost related to having to assess someone’s trustworthiness),
costs of making a mistaken assessment, and costs from putting another person into an
uncomfortable situation (also leading to US(Trust)>US(RD)). A final alternative explanation
might be that Decision Makers dislike earning money due to another person’s kindness
(leading to UG(Trust)<UG(RD)).
A MAP gives us information on how a Decision Maker assesses the risky-choice
problem he is confronted with, but not on how he values each possible outcome. Based
on our data, we are not able to distinguish whether differences in MAPs are due to
different assessments of S or of B and G. However, a number of recent experimental
results are compatible with betrayal costs but not with any of the alternative hypotheses.
In gift-exchange experiments, for example, employers play a trust game with their
employees. They have to decide whether to offer a high or a low wage to encourage
employees to respond with high effort. Offering a high wage is risky as employees may
shirk, but it may also induce fair-minded employees to reciprocate such trust with high
effort levels. Several studies have found that employers are willing to pay for the
opportunity to punish untrustworthy employees (for a summary, see Gächter and Fehr
2001). Such behavior, we believe, is consistent with betrayal aversion but not with an
aversion to losing control, making a wrong assessment, relying on another’s kindness or
confronting another person with an uncomfortable decision.
22

5. Conclusions
For thousands of life’s risky decisions, be they of the heart or the wallet, from the
everyday to the fundamental, trust is a critical ingredient. Economists now recognize that
trusting is required if a society is to prosper. Trust has been shown to contribute to
economic growth (Knack and Keefer 1997, Zack and Knack 2001), and to enhance some
of the factors that promote it, such as judicial efficiency and reduced corruption (La
Porta, Lopez-de-Silanes, Vishny and Shleifer 1997).
Trust involves a chance outcome under the control of another party; e.g., will the
businesswoman deliver a product of the quality she promised? Some risks effectively
involve a lottery process: will the crop be good, will stock X increase in value. Our
experimental studies find that individuals are much more willing to take risks when the
outcome is due to chance, as opposed to an equivalent-odds situation where the outcome
depends on whether another player proves trustworthy. Taking a chance on the latter
risks incurring betrayal costs, costs shown to be above and beyond mere monetary losses.
Betrayal costs may contribute to the distinction between intentional and accidental
wrongs in both civil and common law. Intentional wrongs are more likely to meet the
criteria of criminal conduct and thus, can be punished more severely. In addition, liability
for intentional harm cannot be excluded contractually while the parties to a contract can
agree to exclude liability for accidental wrongs. Lawmakers seem to understand that
people have to be protected more from intentional than from accidental harm. Therefore,
incentives have to be in place to keep Trustees from intentionally inflicting harm on
23

Decision Makers. Absent such arrangements, as our results suggest, interactions based on
trust may not take place.
24
Appendix
Table A.1: Payoff tables for the three treatment conditions
Decision Problem You choose Type of choice Probability Your earnings A
Certainty 1 10
B
Lottery p 1-p
15 8
Risky Dictator Game You choose Type of choice Probability Your earnings Earnings to Person X A
Certainty 1 10
10
B
Lottery p 1-p
15 8
15 22
Trust Game
You choose Type of choice Your earnings Earnings to Person Y A
Certainty 10
10
B
Person Y chooses 1 2
15 8
15 22
25

Table A.2: Questionnaire
1. How old are you? ________
2. What is the ethnic group with which you most identify?
African or African American Asian or Pacific Islander Caucasian Hispanic Native American Other (Please indicate______________________)
3. What is your gender? male female
4. What is the religion with which you most identify?
Buddhist Catholic Hindu Jewish Muslim Orthodox Protestant None Other (Please indicate_________________________)
5. What country are you from (where have you lived most of your life)? _______________
6. Are you currently pursuing studies at the undergraduate graduate Ph.D. post-graduate level?
7. What is your major? _________________ 8. Please indicate your economic situation on a scale from 1 to 6. 1 2 3 4 5 6 poor wealthy
9. Which are the characteristics of a person you would trust, assuming that the person has no information about you? (please check all that apply)
Age: Younger than 40 between 41 and 60 older than 60 Ethnicity: African or African American Asian or Pacific Islander Caucasian Hispanic Native American Other (Please indicate______________________) Gender: male female Religion: Buddhist Catholic Hindu Jewish Muslim Orthodox Protestant None Other (Please indicate_________________________) Country (please indicate): ________________________ Economic situation:
1 2 3 4 5 6 poor wealthy
26

Table A.3: Percent of Decision Makers (DMs) indicating that they would trust a specific
group [N]
All DMs Female DMs Male DMs Minority DMs Caucasian DMs
Ethnicity/race Minority only Caucasian only Both
[N] = 69 19% 14% 67%
[N] = 29 14% 17% 69%
[N] = 40 23% 13% 65%
[N] = 20 50% 5% 45%
[N] = 49 6% 18% 76%
Gender Female only Male only Both
[N] = 77 40% 9% 51%
[N] = 31 55% 6% 39%
[N] = 46 30% 11% 59%
[N] = 24 42% 17% 42%
[N] = 53 40% 6% 55%
Table A.4: Influences on MAPs (minimum acceptable probabilities) 1 2 3 Decision Problem 0.051
(0.056) 0.069 (0.055)
0.053 (0.054)
Trust game 0.220 ** (0.053)
0.237 ** (0.051)
0.243 ** (0.050)
Woman 0.021 (0.053)
0.007 (0.062)
Minority 0.012 (0.063)
0.009 (0.061)
Minority woman 0.174 ^ (0.092)
0.177 * (0.089)
Trust woman only 0.132 * (0.060)
Woman trusting woman only -0.023 (0.088)
Constant 0.323 ** (0.038)
0.272 ** (0.048)
0.238 ** (0.050)
Adj R-squared 0.1669 0.2416 0.2911 Observations 85 85 85 Standard errors are in parentheses. All regressions are OLS, clustered for experimental sessions. ^significant at 10%; *significant at 5%; **significant at 1%.
27

References Alesina, A., La Ferrara, E., 2002. Who trusts others? Journal of Public Economics 85,
207-234. Andreoni, J., Vesterlund, L., 2001. Which is the fair sex? Gender differences in altruism.
Quarterly Journal of Economics 116, 293-312. Andreoni, J., Miller, J., 2002. Giving according to GARP: An experimental test of the
consistency of preferences for altruism. Econometrica 70(2), 737-753. Ashraf, N., Bohnet, I., Piankov, N., 2003. Is trust a bad investment? Working paper.
Kennedy School of Government, Harvard University. Berg, J., Dickhaut, J., McCabe, K.A., 1995. Trust, reciprocity, and social history. Games
and Economic Behavior 10, 290-307. Ben-Ner, A. and Putterman, L., 2001. Trusting and Trustworthiness. Boston University
Law Review 81, 523-551. Blount, S., 1995. When social outcomes aren’t fair: The effect of causal attributions on
preferences. Organizational Behavior and Human Decision Processes 63(2), 131-144.
Bohnet, I., Frey, B.S., 1999. The sound of silence in prisoner’s dilemma and dictator games. Journal of Economic Behavior and Organization 38, 43-57.
Bok, S., 1978. Lying: Moral choice in public and private life. Vintage, New York. Boles, T.L. and Messick, D.M., 1990. Accepting unfairness: Temporal influence on
choice. In: K. Borcherding, O.I. Larichev, and D.M. Messick (Eds.), Contemporary Issues in Decision Making. North Holland, Amsterdam.
Bolton, G., Ockenfels, A., 2000. ERC: A theory of equity, reciprocity, and competition. American Economic Review 90(1), 166-193.
Bolton, G.E., Brandts, J., Ockenfels, A., 2000. Fair procedures: Evidence from games involving lotteries. Working paper, Penn State University.
Buchan, N., Croson, R., Solnick S., 2003. Trust and gender: An examination of behavior, biases, and beliefs in the investment game. Working paper. The Wharton School, University of Pennsylvania.
Camerer, C.F., 2003. Behavioral game theory. Princeton University Press, Princeton and Russell Sage Foundation, New York.
Charness, G., Rabin, M., 2002. Understanding social preferences with simple tests. Quarterly Journal of Economics 117(3), 817-870.
Chaudhuri, A., Gangadharan, L., 2002. Gender differences in trust and reciprocity. Working paper.
Cook, K.S. and Cooper, R.M., 2003, Experimental Studies of Cooperation, Trust, and Social Exchange. In: E. Ostrom, and J. Walker (Eds.), Trust and Reciprocity. New York: Russell Sage, 209-244.
Cox, J.C., 2003. How To Identify Trust and Reciprocity, Games and Economic Behavior, Forthcoming.
Croson, R., Buchan, N., 1999. Gender and culture: International experimental evidence from trust games. American Economic Review 89(2), 386-391.
Eckel, C.C., Grossman, P., 1998. Are women less selfish than men? Evidence from dictator experiments. Economic Journal 108, 726-735.
Eckel, C.C., Wilson, R.K. Is trust a risky decision?, this volume.
28

Eckel, C.C., Wilson, R.K., 2003. Conditional trust: Sex, race and facial expressions in a trust game. Working paper.
Fehr, E., Schmidt, K., 1999. A theory of fairness, competition, and cooperation. Quarterly Journal of Economics 114(3), 817-868.
Fehr, E., Schmidt, K., 2001. Theories of fairness and reciprocity—Evidence and economic applications. Working paper No. 75, Institute for Empirical Economic Research, University of Zürich.
Fershtman, C., Gneezy, U., 2001. Discrimination in a segmented society: An experimental appproach. Quarterly Journal of Economics 116(1), 351-377.
Gächter, S. and Fehr, E., 2001. Fairness in the labour market—A survey of experimental results. In: F. Bolle and M. Lehmann-Waffenschmidt (Eds.). Surveys in Experimental Economics. Bargaining, Cooperation and Election Stock Markets. Physica, Berlin.
Glaeser, E.L., Laibson, D.I., Scheinkman, J.A., Soutter, C.L., 2000. Measuring trust. Quarterly Journal of Economics 115(3), 811-846.
Hardin, R. 2002. Trust and trustworthiness. Russell Sage, New York. King, W.C., Miles, E.W., Kniska, J., 1991. Boys will be boys (and girls will be girls):
The attribution of gender role stereotypes in a gaming situation. Sex Roles 25 (11-12), 607-623.
Knack, S., Keefer, P., 1997. Does social capital have an economic payoff? A cross-country investigation. Quarterly Journal of Economics, 112(4), 1251-1288.
LaPorta, R., Lopez-de-Silanes, F., Shleifer, A., Vishny, R.W., 1997. Trust in large organizations. American Economic Review 87, 333-338.
Luhmann, N., 1979. Trust: A mechanism for the reduction of social complexity. In: N. Luhmann (Ed.), Trust and Power. Wiley, New York.
Nowak, M.A., Sigmund, K., 2000. Shrewd investments. Science 288: 819-820. Pillutla, M.M., Murnighan, J.K., 1996. Unfairness, anger and spite: Emotional rejections
of ultimatum offers. Organizational Behavior and Human Decision Processes 68, 208-224.
Rabin, M., 1993. Incorporating fairness into game theory and economics. American Economic Review 83(5), 1281-1302.
Slovic, P., Fischhoff, B. and Lichtenstein, S., 1986, The psychometric study of risk perception. In: V.T. Covello, J. Menkes and J. Mumpower (Eds.). Risk Evaluation and Management. New York: Plenum Press, 3-24.
Snijders, C., Keren, G., 1998. Determinants of trust. In: D.V. Budescu, I. Erev, and R. Zwick (Eds.), Games and Human Behavior: Essays in Honor of Amnon Rapoport, Lawrence Erlbaum , Mahwah, NJ, pp. 355-385.
Zack, P., Knack, S., 2001. Trust and growth. Economic Journal 111(1), 295-321.
29