Embed Size (px)
Citation preview

Cisco WOL-15969-01
A
P P E N D I X D TroubleshootingThis appendix lists system messages that can appear on the Cisco UWN Solution interfaces, describes the LED patterns on controllers and lightweight access points, and provides CLI commands that can be used to troubleshoot problems on the controller. It contains these sections:
• Interpreting LEDs, page D-2
• System Messages, page D-2
• Using the CLI to Troubleshoot Problems, page D-5
• Configuring System and Message Logging, page D-7
• Viewing Access Point Event Logs, page D-14
• Troubleshooting CCXv5 Client Devices, page D-15
• Using the Debug Facility, page D-30
• Configuring Wireless Sniffing, page D-35
• Troubleshooting Access Points Using Telnet or SSH, page D-38
D-1ireless LAN Controller Configuration Guide

Appendix D TroubleshootingInterpreting LEDs
Interpreting LEDs
Interpreting Controller LEDsRefer to the quick start guide for your specific controller for a description of the LED patterns. You can find the guides at this URL:
http://www.cisco.com/en/US/products/hw/wireless/index.html
Interpreting Lightweight Access Point LEDsRefer to the hardware installation guide for your specific access point for a description of the LED patterns. You can find the guides at this URL:
http://www.cisco.com/en/US/products/hw/wireless/index.html
System MessagesTable D-1 lists some common system messages and their descriptions. For a complete list of system messages, refer to the Cisco Wireless LAN Controller System Message Guide, Release 5.1.
Table D-1 System Messages and Descriptions
Error Message Description
apf_utils.c 680: Received a CIF field without the protected bit set from mobile xx:xx:xx:xx:xx:xx
A client is sending an association request on a security-enabled WLAN with the protected bit set to 0 (in the Capability field of the association request). As designed, the controller rejects the association request, and the client sees an association failure.
dtl_arp.c 480: Got an idle-timeout message from an unknown client xx:xx:xx:xx:xx:xx
The controller’s network processing unit (NPU) sends a timeout message to the central processing unit (CPU) indicating that a particular client has timed out or aged out. This normally occurs when the CPU has removed a wireless client from its internal database but has not notified the NPU. Because the client remains in the NPU database, it ages out on the network processor and notifies the CPU. The CPU finds the client that is not present in its database and then sends this message.
STATION_DISASSOCIATE Client may have intentionally terminated usage or may have experienced a service disruption.
STATION_DEAUTHENTICATE Client may have intentionally terminated usage or it could indicate an authentication issue.
STATION_AUTHENTICATION_FAIL Check disable, key mismatch or other configuration issues.
D-2Cisco Wireless LAN Controller Configuration Guide
OL-15969-01

Appendix D TroubleshootingSystem Messages
STATION_ASSOCIATE_FAIL Check load on the Cisco radio or signal quality issues.
LRAD_ASSOCIATED The associated lightweight access point is now managed by this controller.
LRAD_DISASSOCIATED The lightweight access point may have associated to a different controller or may have become completely unreachable.
LRAD_UP The lightweight access point is operational, no action required.
LRAD_DOWN The lightweight access point may have a problem or is administratively disabled.
LRADIF_UP Cisco radio is UP.
LRADIF_DOWN Cisco radio may have a problem or is administratively disabled.
LRADIF_LOAD_PROFILE_FAILED Client density may have exceeded system capacity.
LRADIF_NOISE_PROFILE_FAILED The non-802.11 noise has exceed configured threshold.
LRADIF_INTERFERENCE_PROFILE_FAILED 802.11 interference has exceeded threshold on channel -- check channel assignments.
LRADIF_COVERAGE_PROFILE_FAILED Possible coverage hole detected. Check the lightweight access point history to see if it is a common problem and add lightweight access points if necessary.
LRADIF_LOAD_PROFILE_PASSED Load is now within threshold limits.
LRADIF_NOISE_PROFILE_PASSED Detected noise is now less than threshold.
LRADIF_INTERFERENCE_PROFILE_PASSED Detected interference is now less than threshold.
LRADIF_COVERAGE_PROFILE_PASSED Number of clients receiving poor signal are within threshold.
LRADIF_CURRENT_TXPOWER_CHANGED Informational message.
LRADIF_CURRENT_CHANNEL_CHANGED Informational message.
LRADIF_RTS_THRESHOLD_CHANGED Informational message.
LRADIF_ED_THRESHOLD_CHANGED Informational message.
LRADIF_FRAGMENTATION_THRESHOLD_ CHANGED
Informational message.
RRM_DOT11_A_GROUPING_DONE Informational message.
RRM_DOT11_B_GROUPING_DONE Informational message.
ROGUE_AP_DETECTED May be a security issue.Use maps and trends to investigate.
Table D-1 System Messages and Descriptions (continued)
Error Message Description
D-3Cisco Wireless LAN Controller Configuration Guide
OL-15969-01

Appendix D TroubleshootingSystem Messages
ROGUE_AP_REMOVED Detected rogue access point has timed out. The unit might have shut down or moved out of the coverage area.
AP_MAX_ROGUE_COUNT_EXCEEDED The current number of active rogue access points has exceeded system threshold.
LINK_UP Positive confirmation message.
LINK_DOWN Port may have a problem or is administratively disabled.
LINK_FAILURE Port may have a problem or is administratively disabled.
AUTHENTICATION_FAILURE Attempted security breech. Investigate.
STP_NEWROOT Informational message.
STP_TOPOLOGY_CHANGE Informational message.
IPSEC_ESP_AUTH_FAILURE Check WLAN IPSec configuration.
IPSEC_ESP_REPLAY_FAILURE Check for attempt to spoof IP Address.
IPSEC_ESP_POLICY_FAILURE Check for IPSec configuration mismatch between WLAN and client.
IPSEC_ESP_INVALID_SPI Informational message.
IPSEC_OTHER_POLICY_FAILURE Check for IPSec configuration mismatch between WLAN and client.
IPSEC_IKE_NEG_FAILURE Check for IPSec IKE configuration mismatch between WLAN and client.
IPSEC_SUITE_NEG_FAILURE Check for IPSec IKE configuration mismatch between WLAN and client.
IPSEC_INVALID_COOKIE Informational message.
RADIOS_EXCEEDED Maximum number of supported Cisco radios exceeded. Check for controller failure in the same Layer 2 network or add another controller.
SENSED_TEMPERATURE_HIGH Check fan, air conditioning and/or other cooling arrangements.
SENSED_TEMPERATURE_LOW Check room temperature and/or other reasons for low temperature.
TEMPERATURE_SENSOR_FAILURE Replace temperature sensor ASAP.
TEMPERATURE_SENSOR_CLEAR Temperature sensor is operational.
POE_CONTROLLER_FAILURE Check ports — possible serious failure detected.
MAX_ROGUE_COUNT_EXCEEDED The current number of active rogue access points has exceeded system threshold.
SWITCH_UP Controller is responding to SNMP polls.
SWITCH_DOWN Controller is not responding to SNMP polls, check controller and SNMP settings.
Table D-1 System Messages and Descriptions (continued)
Error Message Description
D-4Cisco Wireless LAN Controller Configuration Guide
OL-15969-01

Appendix D TroubleshootingUsing the CLI to Troubleshoot Problems
Using the CLI to Troubleshoot ProblemsIf you experience any problems with your controller, you can use the commands in this section to gather information and debug issues.
1. show process cpu—Shows how various tasks in the system are using the CPU at that instant in time. This command is helpful in understanding if any single task is monopolizing the CPU and preventing other tasks from being performed.
Information similar to the following appears:
Name Priority CPU Use Reaper reaperWatcher ( 3/124) 0 % ( 0/ 0)% I osapiReaper (10/121) 0 % ( 0/ 0)% I TempStatus (255/ 1) 0 % ( 0/ 0)% I emWeb (255/ 1) 0 % ( 0/ 0)% T 300 cliWebTask (255/ 1) 0 % ( 0/ 0)% I UtilTask (255/ 1) 0 % ( 0/ 0)% T 300
In the example above, the following fields provide information:
• The Name field shows the tasks that the CPU is to perform.
• The Priority field shows two values: 1) the original priority of the task that was created by the actual function call and 2) the priority of the task divided by a range of system priorities.
• The CPU Use field shows the CPU usage of a particular task.
• The Reaper field shows three values: 1) the amount of time for which the task is scheduled in user mode operation, 2) the amount of time for which the task is scheduled in system mode operation, and 3) whether the task is being watched by the reaper task monitor (indicated by a “T”). If the task is being watched by the reaper task monitor, this field also shows the timeout value (in seconds) before which the task needs to alert the task monitor.
Note If you want to see the total CPU usage as a percentage, enter the show cpu command.
RADIUS_SERVERS_FAILED Check network connectivity between RADIUS and the controller.
CONFIG_SAVED Running configuration has been saved to flash - will be active after reboot.
MULTIPLE_USERS Another user with the same username has logged in.
FAN_FAILURE Monitor controller temperature to avoid overheating.
POWER_SUPPLY_CHANGE Check for power-supply malfunction.
COLD_START The controller may have been rebooted.
WARM_START The controller may have been rebooted.
Table D-1 System Messages and Descriptions (continued)
Error Message Description
D-5Cisco Wireless LAN Controller Configuration Guide
OL-15969-01

Appendix D TroubleshootingUsing the CLI to Troubleshoot Problems
2. show process memory—Shows the allocation and deallocation of memory from various processes in the system at that instant in time.
Information similar to the following appears:
Name Priority BytesInUse BlocksInUse Reaper reaperWatcher ( 3/124) 0 0 ( 0/ 0)% I osapiReaper (10/121) 0 0 ( 0/ 0)% I TempStatus (255/ 1) 308 1 ( 0/ 0)% I emWeb (255/ 1) 294440 4910 ( 0/ 0)% T 300 cliWebTask (255/ 1) 738 2 ( 0/ 0)% I UtilTask (255/ 1) 308 1 ( 0/ 0)% T 300
In the example above, the following fields provide information:
• The Name field shows the tasks that the CPU is to perform.
• The Priority field shows two values: 1) the original priority of the task that was created by the actual function call and 2) the priority of the task divided by a range of system priorities.
• The BytesInUse field shows the actual number of bytes used by dynamic memory allocation for a particular task.
• The BlocksInUse field shows the chunks of memory that are assigned to perform a particular task.
• The Reaper field shows three values: 1) the amount of time for which the task is scheduled in user mode operation, 2) the amount of time for which the task is scheduled in system mode operation, and 3) whether the task is being watched by the reaper task monitor (indicated by a “T”). If the task is being watched by the reaper task monitor, this field also shows the timeout value (in seconds) before which the task needs to alert the task monitor.
3. show tech-support—Shows an array of information related to the state of the system, including the current configuration, last crash file, CPU utilization, and memory utilization.
4. show running-config—Shows the full current configuration of the controller. Access point configuration settings are not included. This command shows only values configured by the user. It does not show system-configured default values. This command is different from the show run-config command, which outputs a portion of the current configuration plus a lot of extra dynamic information. In contrast, the show running-config command provides a clean configuration output of the controller in command format.
Here is a brief sample of the output:
radius auth add 1 10.50.3.104 1812 ascii ****
radius backward compatibility enable radius admin-authentication disable
radius cred-cache enable radius callStationIdType macAddr radius acct retransmit-timeout 1 4
radius acct network 1 disable
radius auth rfc3576 enable 1 radius auth retransmit-timeout 1 6
D-6Cisco Wireless LAN Controller Configuration Guide
OL-15969-01

Appendix D TroubleshootingConfiguring System and Message Logging
radius auth network 1 disable radius auth management 1 disable radius auth ipsec enable
Note If you want to see the passwords in clear text, enter config passwd-cleartext enable. To execute this command, you must enter an admin password. This command is valid only for this particular session. It is not saved following a reboot.
Note You cannot use TFTP to upload the output of this command. Rather, you can cut and paste the output as necessary.
Configuring System and Message LoggingSystem logging allows controllers to log their system events to up to three remote syslog servers. The controller sends a copy of each syslog message as it is logged to each syslog server configured on the controller. Being able to send the syslog messages to multiple servers ensures that the messages are not lost due to the temporary unavailability of one syslog server. Message logging allows system messages to be logged to the controller buffer or console.
You can use the controller GUI or CLI to configure system and message logging.
Using the GUI to Configure System and Message LoggingUsing the GUI, follow these steps to configure system and message logging.
Step 1 Click Management > Logs > Config. The Syslog Configuration page appears (see Figure D-1).
Figure D-1 Syslog Configuration Page
D-7Cisco Wireless LAN Controller Configuration Guide
OL-15969-01

Appendix D TroubleshootingConfiguring System and Message Logging
Step 2 In the Syslog Server IP Address field, enter the IP address of the server to which to send the syslog messages and click Add. You can add up to three syslog servers to the controller. The list of syslog servers that have already been added to the controller appears below this field.
Note If you ever want to remove a syslog server from the controller, click Remove to the right of the desired server.
Step 3 To set the severity level for filtering syslog messages to the syslog servers, choose one of the following options from the Syslog Level drop-down box:
• Emergencies = Severity level 0
• Alerts = Severity level 1 (default value)
• Critical = Severity level 2
• Errors = Severity level 3
• Warnings = Severity level 4
• Notifications = Severity level 5
• Informational = Severity level 6
• Debugging = Severity level 7
If you set a syslog level, only those messages whose severity is equal to or less than that level are sent to the syslog servers. For example, if you set the syslog level to Warnings (severity level 4), only those messages whose severity is between 0 and 4 are sent to the syslog servers.
Step 4 To set the facility for outgoing syslog messages to the syslog servers, choose one of the following options from the Syslog Facility drop-down box:
• Kernel = Facility level 0
• User Process = Facility level 1
• Mail = Facility level 2
• System Daemons = Facility level 3
• Authorization = Facility level 4
• Syslog = Facility level 5 (default value)
• Line Printer = Facility level 6
• USENET = Facility level 7
• Unix-to-Unix Copy = Facility level 8
• Cron = Facility level 9
• FTP Daemon = Facility level 11
• System Use 1 = Facility level 12
• System Use 2 = Facility level 13
• System Use 3 = Facility level 14
• System Use 4 = Facility level 15
• Local Use 0 = Facility level 16
• Local Use 1 = Facility level 17
• Local Use 2 = Facility level 18
D-8Cisco Wireless LAN Controller Configuration Guide
OL-15969-01

Appendix D TroubleshootingConfiguring System and Message Logging
• Local Use 3 = Facility level 19
• Local Use 4 = Facility level 20
• Local Use 5 = Facility level 21
• Local Use 6 = Facility level 22
• Local Use 7 = Facility level 23
Step 5 Click Apply to commit your changes.
Step 6 To set the severity level for logging messages to the controller buffer and console, choose one of the following options from both the Buffered Log Level and Console Log Level drop-down boxes:
• Emergencies = Severity level 0
• Alerts = Severity level 1
• Critical = Severity level 2
• Errors = Severity level 3 (default value)
• Warnings = Severity level 4
• Notifications = Severity level 5
• Informational = Severity level 6
• Debugging = Severity level 7
If you set a logging level, only those messages whose severity is equal to or less than that level are logged by the controller. For example, if you set the logging level to Warnings (severity level 4), only those messages whose severity is between 0 and 4 are logged.
Step 7 Check the File Info check box if you want the message logs to include information about the source file. The default value is enabled.
Step 8 Check the Proc Info check box if you want the message logs to include process information. The default value is disabled.
Step 9 Check the Trace Info check box if you want the message logs to include traceback information. The default value is disabled.
Step 10 Click Apply to commit your changes.
Step 11 Click Save Configuration to save your changes.
Using the GUI to View Message LogsTo view message logs using the controller GUI, click Management > Logs > Message Logs. The Message Logs page appears (see Figure D-2).
D-9Cisco Wireless LAN Controller Configuration Guide
OL-15969-01
Appendix D TroubleshootingConfiguring System and Message Logging
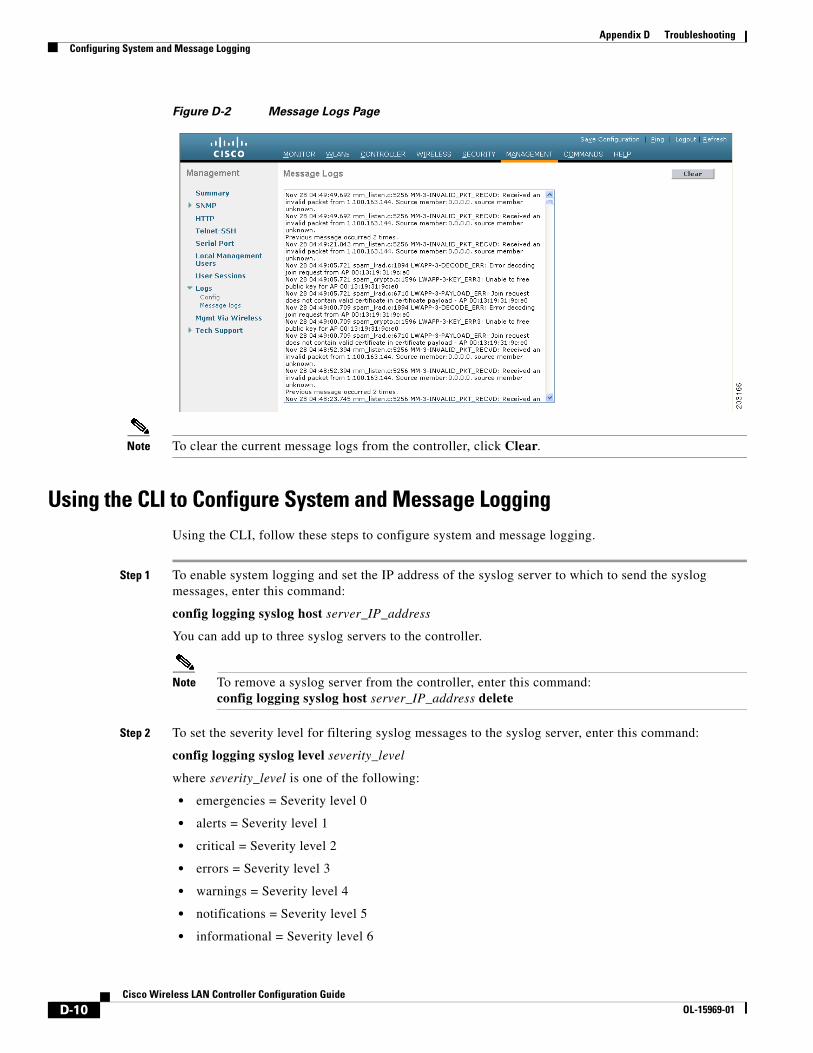
Figure D-2 Message Logs Page
Note To clear the current message logs from the controller, click Clear.
Using the CLI to Configure System and Message LoggingUsing the CLI, follow these steps to configure system and message logging.
Step 1 To enable system logging and set the IP address of the syslog server to which to send the syslog messages, enter this command:
config logging syslog host server_IP_address
You can add up to three syslog servers to the controller.
Note To remove a syslog server from the controller, enter this command:config logging syslog host server_IP_address delete
Step 2 To set the severity level for filtering syslog messages to the syslog server, enter this command:
config logging syslog level severity_level
where severity_level is one of the following:
• emergencies = Severity level 0
• alerts = Severity level 1
• critical = Severity level 2
• errors = Severity level 3
• warnings = Severity level 4
• notifications = Severity level 5
• informational = Severity level 6
D-10Cisco Wireless LAN Controller Configuration Guide
OL-15969-01

Appendix D TroubleshootingConfiguring System and Message Logging
• debugging = Severity level 7
Note As an alternative, you can enter a number from 0 through 7 for the severity_level parameter.
Note If you set a syslog level, only those messages whose severity is equal to or less than that level are sent to the syslog server. For example, if you set the syslog level to Warnings (severity level 4), only those messages whose severity is between 0 and 4 are sent to the syslog server.
Step 3 To set the facility for outgoing syslog messages to the syslog server, enter this command:
config logging syslog facility facility_code
where facility_code is one of the following:
• authorization = Authorization system. Facility level = 4.
• auth-private = Authorization system (private). Facility level = 10.
• cron = Cron/at facility. Facility level = 9.
• daemon = System daemons. Facility level = 3.
• ftp = FTP daemon. Facility level = 11.
• kern = Kernel. Facility level = 0.
• local0 = Local use. Facility level = 16.
• local1 = Local use. Facility level = 17.
• local2 = Local use. Facility level = 18.
• local3 = Local use. Facility level = 19.
• local4 = Local use. Facility level = 20.
• local5 = Local use. Facility level = 21.
• local6 = Local use. Facility level = 22.
• local7 = Local use. Facility level = 23.
• lpr = Line printer system. Facility level = 6.
• mail = Mail system. Facility level = 2.
• news = USENET news. Facility level = 7.
• sys12 = System use. Facility level = 12.
• sys13 = System use. Facility level = 13.
• sys14 = System use. Facility level = 14.
• sys15 = System use. Facility level = 15.
• syslog = The syslog itself. Facility level = 5.
• user = User process. Facility level = 1.
• uucp = Unix-to-Unix copy system. Facility level = 8.
D-11Cisco Wireless LAN Controller Configuration Guide
OL-15969-01

Appendix D TroubleshootingConfiguring System and Message Logging
Step 4 To set the severity level for logging messages to the controller buffer and console, enter these commands:
• config logging buffered severity_level
• config logging console severity_level
where severity_level is one of the following:
• emergencies = Severity level 0
• alerts = Severity level 1
• critical = Severity level 2
• errors = Severity level 3
• warnings = Severity level 4
• notifications = Severity level 5
• informational = Severity level 6
• debugging = Severity level 7
Note As an alternative, you can enter a number from 0 through 7 for the severity_level parameter.
Note If you set a logging level, only those messages whose severity is equal to or less than that level are logged by the controller. For example, if you set the logging level to Warnings (severity level 4), only those messages whose severity is between 0 and 4 are logged.
Step 5 To save debug messages to the controller buffer, the controller console, or a syslog server, enter these commands:
• config logging debug buffered {enable | disable}
• config logging debug console {enable | disable}
• config logging debug syslog {enable | disable}
By default, the console command is enabled, and the buffered and syslog commands are disabled.
Step 6 To cause the controller to include information about the source file in the message logs or to prevent the controller from displaying this information, enter this command:
config logging fileinfo {enable | disable}
The default value is enabled.
Step 7 To cause the controller to include process information in the message logs or to prevent the controller from displaying this information, enter this command:
config logging procinfo {enable | disable}
The default value is disabled.
Step 8 To cause the controller to include traceback information in the message logs or to prevent the controller from displaying this information, enter this command:
config logging traceinfo {enable | disable}
The default value is disabled.
D-12Cisco Wireless LAN Controller Configuration Guide
OL-15969-01
Appendix D TroubleshootingConfiguring System and Message Logging
Step 9 To enable or disable timestamps in log messages and debug messages, enter these commands:
• config service timestamps log {datetime | disable}
• config service timestamps debug {datetime | disable}
where
– datetime = Messages are timestamped with the standard date and time. This is the default value.
– disable = Messages are not timestamped.
Step 10 To save your changes, enter this command:
save config
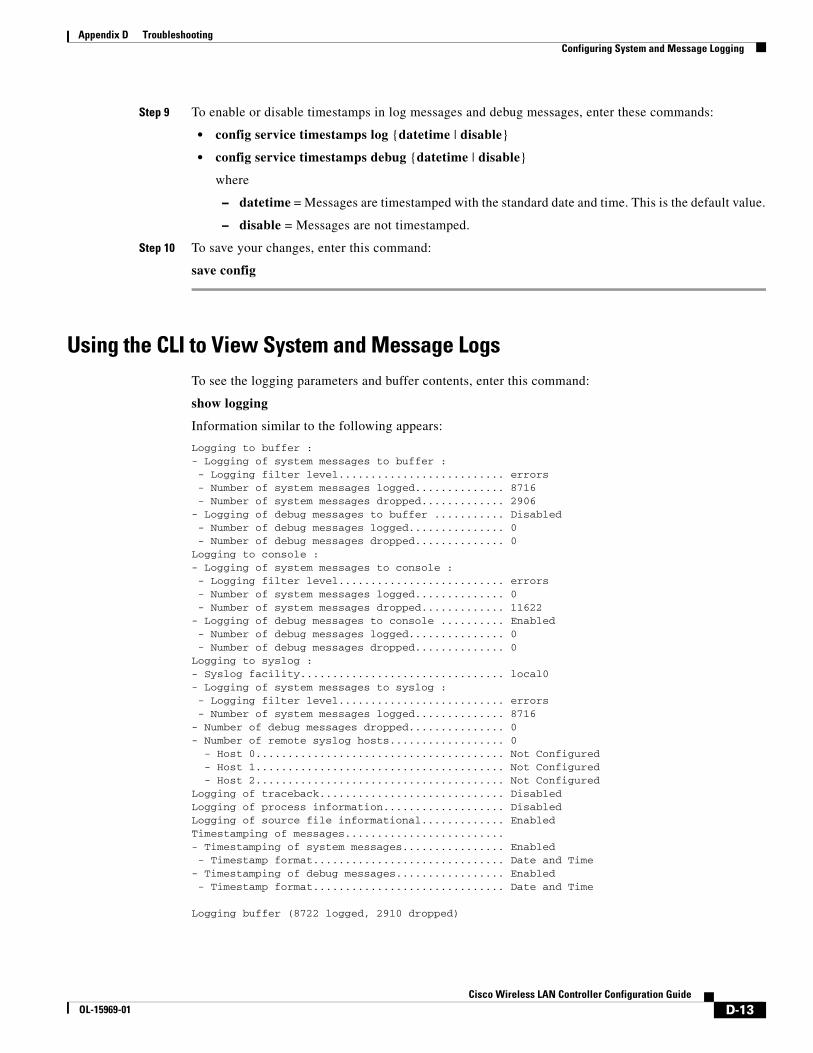
Using the CLI to View System and Message LogsTo see the logging parameters and buffer contents, enter this command:
show logging
Information similar to the following appears:
Logging to buffer :- Logging of system messages to buffer : - Logging filter level.......................... errors - Number of system messages logged.............. 8716 - Number of system messages dropped............. 2906- Logging of debug messages to buffer ........... Disabled - Number of debug messages logged............... 0 - Number of debug messages dropped.............. 0Logging to console :- Logging of system messages to console : - Logging filter level.......................... errors - Number of system messages logged.............. 0 - Number of system messages dropped............. 11622- Logging of debug messages to console .......... Enabled - Number of debug messages logged............... 0 - Number of debug messages dropped.............. 0Logging to syslog :- Syslog facility................................ local0- Logging of system messages to syslog : - Logging filter level.......................... errors - Number of system messages logged.............. 8716 - Number of debug messages dropped............... 0- Number of remote syslog hosts.................. 0 - Host 0....................................... Not Configured - Host 1....................................... Not Configured - Host 2....................................... Not ConfiguredLogging of traceback............................. DisabledLogging of process information................... DisabledLogging of source file informational............. EnabledTimestamping of messages.........................- Timestamping of system messages................ Enabled - Timestamp format.............................. Date and Time- Timestamping of debug messages................. Enabled - Timestamp format.............................. Date and Time
Logging buffer (8722 logged, 2910 dropped)
D-13Cisco Wireless LAN Controller Configuration Guide
OL-15969-01

Appendix D TroubleshootingViewing Access Point Event Logs
*Mar 26 09:23:13.574: %MM-3-INVALID_PKT_RECVD: mm_listen.c:5508 Received an invalid packet from 1.100.163.144. Source member:0.0.0.0. source member unknown.*Mar 26 09:23:13.574: %MM-3-INVALID_PKT_RECVD: mm_listen.c:5508 Received an invalid packet from 1.100.163.144. Source member:0.0.0.0. source member unknown.Previous message occurred 2 times.*Mar 26 09:22:44.925: %MM-3-INVALID_PKT_RECVD: mm_listen.c:5508 Received an invalid packet from 1.100.163.144. Source member:0.0.0.0. source member unknown....
Viewing Access Point Event LogsAccess points log all system messages (with a severity level greater than or equal to notifications) to the access point event log. The event log can contain up to 1024 lines of messages, with up to 128 characters per line. When the event log becomes filled, the oldest message is removed to accommodate a new event message. The event log is saved in a file on the access point flash, which ensures that it is saved through a reboot cycle. To minimize the number of writes to the access point flash, the contents of the event log are written to the event log file during normal reload and crash scenarios only.
Use these CLI commands to view or clear the access point event log from the controller:
• To view the contents of the event log file for an access point that is joined to the controller, enter this command:
show ap eventlog Cisco_AP
Information similar to the following appears:
AP event log download has been initiatedWaiting for download to complete
AP event log download completed. ======================= AP Event log Contents =====================*Feb 13 11:54:17.146: %LWAPP-3-CLIENTEVENTLOG: AP event log has been cleared from the the controller 'admin'*Feb 13 11:54:32.874: *** Access point reloading. Reason: Reload Command ****Mar 1 00:00:39.134: %CDP_PD-4-POWER_OK: Full power - NEGOTIATED inline power source*Mar 1 00:00:39.174: %LINK-3-UPDOWN: Interface Dot11Radio1, changed state to up*Mar 1 00:00:39.211: %LINK-3-UPDOWN: Interface Dot11Radio0, changed state to up*Mar 1 00:00:49.947: %LWAPP-3-CLIENTEVENTLOG: Did not get vendor specific options from DHCP.*Mar 1 00:00:49.948: %LWAPP-3-CLIENTEVENTLOG: Did not get log server settings from DHCP.*Mar 1 00:00:49.949: %LWAPP-3-CLIENTEVENTLOG: Did not get any DNS options from DHCP.*Mar 1 00:00:49.949: %LINEPROTO-5-UPDOWN: Line protocol on Interface Dot11Radio1, changed state to up*Mar 1 00:00:49.949: %LINEPROTO-5-UPDOWN: Line protocol on Interface Dot11Radio0, changed state to up*Mar 1 00:00:49.949: %LWAPP-3-CLIENTEVENTLOG: Performing DNS resolution for CISCO-LWAPP-CONTROLLER*Mar 1 00:00:49.949: %LWAPP-3-CLIENTERRORLOG: DNS Name Lookup: could not resolve CISCO-LWAPP-CONTROLLER*Mar 1 00:01:01.960: %LWAPP-5-CHANGED: LWAPP changed state to JOIN*Mar 1 00:01:01.960: %LINK-5-CHANGED: Interface Dot11Radio0, changed state to administratively down*Mar 1 00:01:01.960: %LINK-5-CHANGED: Interface Dot11Radio1, changed state to administratively down*Mar 1 00:01:01.960: %LINEPROTO-5-UPDOWN: Line protocol on Interface Dot11Radio0, changed state to down*Mar 1 00:01:01.960: %LINEPROTO-5-UPDOWN: Line protocol on Interface Dot11Radio1, changed state to down...
D-14Cisco Wireless LAN Controller Configuration Guide
OL-15969-01

Appendix D TroubleshootingTroubleshooting CCXv5 Client Devices
• To delete the existing event log and create an empty event log file for a specific access point or for all access points joined to the controller, enter this command:
clear ap-eventlog {specific Cisco_AP | all}
Troubleshooting CCXv5 Client DevicesThe controller supports three features designed to help troubleshoot communication problems with CCXv5 clients: diagnostic channel, client reporting, and roaming and real-time diagnostics. See the “Configuring Cisco Client Extensions” section on page 6-38 for more information on CCX.
Note These features are supported only on CCXv5 clients. They are not supported for use with non-CCX clients or with clients running an earlier version of CCX.
Diagnostic ChannelThe diagnostic channel feature enables you to troubleshoot problems regarding client communication with a WLAN. The client and access points can be put through a defined set of tests in an attempt to identify the cause of communication difficulties the client is experiencing and then allow corrective measures to be taken to make the client operational on the network. You can use the controller GUI or CLI to enable the diagnostic channel, and you can use the controller CLI or WCS to run the diagnostic tests.
Note Cisco recommends that you enable the diagnostic channel feature only for non-anchored SSIDs that use the management interface.
Client ReportingThe client reporting protocol is used by the client and the access point to exchange client information. Client reports are collected automatically when the client associates. You can use the controller GUI or CLI to send a client report request to any CCXv5 client any time after the client associates. There are four types of client reports:
• Client profile—Provides information about the configuration of the client.
• Operating parameters—Provides the details of the client’s current operational modes.
• Manufacturers’ information—Provides data about the wireless LAN client adapter in use.
• Client capabilities—Provides information about the client’s capabilities.
Roaming and Real-Time DiagnosticsYou can use roaming and real-time logs and statistics to solve system problems. The event log enables you to identify and track the behavior of a client device. It is especially useful when attempting to diagnose difficulties that a user may be having on a WLAN. The event log provides a log of events and reports them to the access point. There are three categories of event logs:
D-15Cisco Wireless LAN Controller Configuration Guide
OL-15969-01

Appendix D TroubleshootingTroubleshooting CCXv5 Client Devices
• Roaming log—This log provides a historical view of the roaming events for a given client. The client maintains a minimum of five previous roaming events including failed attempts and successful roams.
• Robust Security Network Association (RSNA) log—This log provides a historical view of the authentication events for a given client. The client maintains a minimum of five previous authentication attempts including failed attempts and successful ones.
• Syslog—This log provides internal system information from the client. For example, it may indicate problems with 802.11 operation, system operation, and so on.
The statistics report provides 802.1X and security information for the client. You can use the controller CLI to send the event log and statistics request to any CCXv5 client any time after the client associates.
Using the GUI to Configure the Diagnostic ChannelFollow these steps to configure the diagnostic channel using the controller GUI.
Step 1 Click WLANs to open the WLANs page.
Step 2 Create a new WLAN or click the profile name of an existing WLAN.
Note Cisco recommends that you create a new WLAN on which to run the diagnostic tests.
Step 3 When the WLANs > Edit page appears, click the Advanced tab to open the WLANs > Edit (Advanced) page (see Figure D-3).
Figure D-3 WLANs > Edit (Advanced) Page
Step 4 If you want to enable diagnostic channel troubleshooting on this WLAN, check the Diagnostic Channel check box. Otherwise, leave this check box unchecked, which is the default value.
Note You can use the CLI to initiate diagnostic tests on the client. See the “Using the CLI to Configure the Diagnostic Channel” section on page D-17 for details.
Step 5 Click Apply to commit your changes.
D-16Cisco Wireless LAN Controller Configuration Guide
OL-15969-01

Appendix D TroubleshootingTroubleshooting CCXv5 Client Devices
Step 6 Click Save Configuration to save your changes.
Using the CLI to Configure the Diagnostic ChannelUsing the controller CLI, follow these steps to configure the diagnostic channel.
Step 1 To enable diagnostic channel troubleshooting on a particular WLAN, enter this command:
config wlan diag-channel {enable | disable} wlan_id
Step 2 To verify that your change has been made, enter this command:
show wlan wlan_id
Information similar to the following appears:
WLAN Identifier.................................. 1Profile Name..................................... employee1Network Name (SSID).............................. employeeStatus........................................... DisabledMAC Filtering.................................... DisabledBroadcast SSID................................... EnabledAAA Policy Override.............................. DisabledNumber of Active Clients......................... 0Exclusionlist Timeout............................ 60 secondsSession Timeout.................................. InfinityInterface........................................ managementWLAN ACL......................................... unconfiguredDHCP Server...................................... DefaultDHCP Address Assignment Required................. DisabledQuality of Service............................... Silver (best effort)WMM.............................................. DisabledCCX - AironetIe Support.......................... EnabledCCX - Gratuitous ProbeResponse (GPR)............. DisabledCCX - Diagnostics Channel Capability............. Enabled...
Step 3 To send a request to the client to perform the DHCP test, enter this command:
config client ccx dhcp-test client_mac_address
Note This test does not require the client to use the diagnostic channel.
Step 4 To send a request to the client to perform the default gateway ping test, enter this command:
config client ccx default-gw-ping client_mac_address
Note This test does not require the client to use the diagnostic channel.
Step 5 To send a request to the client to perform the DNS server IP address ping test, enter this command:
config client ccx dns-ping client_mac_address
Note This test does not require the client to use the diagnostic channel.
D-17Cisco Wireless LAN Controller Configuration Guide
OL-15969-01
Appendix D TroubleshootingTroubleshooting CCXv5 Client Devices
Step 6 To send a request to the client to perform the DNS name resolution test to the specified host name, enter this command:
config client ccx dns-resolve client_mac_address host_name
Note This test does not require the client to use the diagnostic channel.
Step 7 To send a request to the client to perform the association test, enter this command:
config client ccx test-association client_mac_address ssid bssid {802.11a | 802.11b | 802.11g} channel
Step 8 To send a request to the client to perform the 802.1X test, enter this command:
config client ccx test-dot1x client_mac_address profile_id bssid {802.11a | 802.11b | 802.11g} channel
Step 9 To send a request to the client to perform the profile redirect test, enter this command:
config client ccx test-profile client_mac_address profile_id
The profile_id should be from one of the client profiles for which client reporting is enabled.
Note Users are redirected back to the parent WLAN, not to any other profile. The only profile shown is the user’s parent profile. Note however that parent WLAN profiles can have one child diagnostic WLAN.
Step 10 Use these commands if necessary to abort or clear a test:
• To send a request to the client to abort the current test, enter this command:
config client ccx test-abort client_mac_address
Only one test can be pending at a time, so this command aborts the current pending test.
• To clear the test results on the controller, enter this command:
config client ccx clear-results client_mac_address
Step 11 To send a message to the client, enter this command:
config client ccx send-message client_mac_address message_id
where message_id is one of the following:
• 1 = The SSID is invalid.
• 2 = The network settings are invalid.
• 3 = There is a WLAN credibility mismatch.
• 4 = The user credentials are incorrect.
• 5 = Please call support.
• 6 = The problem is resolved.
• 7 = The problem has not been resolved.
• 8 = Please try again later.
• 9 = Please correct the indicated problem.
• 10 = Troubleshooting is refused by the network.
• 11 = Retrieving client reports.
• 12 = Retrieving client logs.
D-18Cisco Wireless LAN Controller Configuration Guide
OL-15969-01
Appendix D TroubleshootingTroubleshooting CCXv5 Client Devices
• 13 = Retrieval complete.
• 14 = Beginning association test.
• 15 = Beginning DHCP test.
• 16 = Beginning network connectivity test.
• 17 = Beginning DNS ping test.
• 18 = Beginning name resolution test.
• 19 = Beginning 802.1X authentication test.
• 20 = Redirecting client to a specific profile.
• 21 = Test complete.
• 22 = Test passed.
• 23 = Test failed.
• 24 = Cancel diagnostic channel operation or select a WLAN profile to resume normal operation.
• 25 = Log retrieval refused by the client.
• 26 = Client report retrieval refused by the client.
• 27 = Test request refused by the client.
• 28 = Invalid network (IP) setting.
• 29 = There is a known outage or problem with the network.
• 30 = Scheduled maintenance period.
• 31 = The WLAN security method is not correct.
• 32 = The WLAN encryption method is not correct.
• 33 = The WLAN authentication method is not correct.
Step 12 To see the status of the last test, enter this command:
show client ccx last-test-status client_mac_address
Information similar to the following appears for the default gateway ping test:
Test Type........................................ Gateway Ping TestTest Status...................................... Pending/Success/Timeout
Dialog Token..................................... 15Timeout.......................................... 15000 msRequest Time..................................... 1329 seconds since system boot
Step 13 To see the status of the last test response, enter this command:
show client ccx last-response-status client_mac_address
Information similar to the following appears for the 802.1X authentication test:
Test Status...................................... Success
Response Dialog Token............................ 87Response Status.................................. SuccessfulResponse Test Type............................... 802.1x Authentication TestResponse Time.................................... 3476 seconds since system boot
D-19Cisco Wireless LAN Controller Configuration Guide
OL-15969-01

Appendix D TroubleshootingTroubleshooting CCXv5 Client Devices
Step 14 To see the results from the last successful diagnostics test, enter this command:
show client ccx results client_mac_address
Information similar to the following appears for the 802.1X authentication test:
dot1x Complete................................... SuccessEAP Method....................................... *1,Host OS Login Credentialsdot1x Status.................................. 255
Step 15 To see the relevant data frames captured by the client during the previous test, enter this command:
show client ccx frame-data client_mac_address
Information similar to the following appears:
LOG Frames:
Frame Number:.................................... 1Last Frame Number:............................... 1120Direction:....................................... 1Timestamp:....................................... 0d 00h 50m 39s 863954usFrame Length:.................................... 197Frame Data:00000000: 80 00 00 00 ff ff ff ff ff ff 00 12 44 bd bd b0 ............D...00000010: 00 12 44 bd bd b0 f0 af 43 70 00 f2 82 01 00 00 ..D.....Cp......00000020: 64 00 11 08 00 01 00 01 08 8c 12 98 24 b0 48 60 d...........$.H`00000030: 6c 05 04 01 02 00 00 85 1e 00 00 89 00 0f 00 ff l...............00000040: 03 19 00 41 50 32 33 2d 31 30 00 00 00 00 00 00 ...AP23-10......00000050: 00 00 00 00 00 00 26 96 06 00 40 96 00 ff ff dd ......&[email protected]: 18 00 50 f2 01 01 00 00 50 f2 05 01 00 00 50 f2 ..P.....P.....P.00000070: 05 01 00 00 40 96 00 28 00 dd 06 00 40 96 01 01 ....@..(....@...
00000080: 00 dd 05 00 40 96 03 04 dd 16 00 40 96 04 00 02 ....@[email protected]: 07 a4 00 00 23 a4 00 00 42 43 00 00 62 32 00 00 ....#...BC..b2..000000a0: dd 05 00 40 96 0b 01 dd 18 00 50 f2 02 01 01 82 [email protected]: 00 03 a4 00 00 27 a4 00 00 42 43 5e 00 62 32 2f .....'...BC^.b2/
LOG Frames:
Frame Number:.................................... 2Last Frame Number:............................... 1120Direction:....................................... 1Timestamp:....................................... 0d 00h 50m 39s 878289usFrame Length:.................................... 147Frame Data:00000000: 80 00 00 00 ff ff ff ff ff ff 00 0d ed c3 a0 22 ..............."00000010: 00 0d ed c3 a0 22 00 bd 4d 50 a5 f7 78 08 00 00 ....."..MP..x...00000020: 64 00 01 00 00 01 00 01 08 8c 12 98 24 b0 48 60 d...........$.H`00000030: 6c 05 04 01 02 00 00 85 1e 00 00 84 00 0f 00 ff l...............00000040: 03 19 00 72 6f 67 75 65 2d 74 65 73 74 31 00 00 ...rogue-test1..00000050: 00 00 00 00 00 00 23 96 06 00 40 96 00 10 00 dd ......#[email protected]: 06 00 40 96 01 01 00 dd 05 00 40 96 03 04 dd 05 ..@[email protected]: 00 40 96 0b 01 dd 18 00 50 f2 02 01 01 81 00 03 [email protected].......
00000080: a4 00 00 27 a4 00 00 42 43 5e 00 62 32 2f 00 d2 ...'...BC^.b2/..00000090: b4 ab 84 ...
LOG Frames:
Frame Number:.................................... 3Last Frame Number:............................... 1120Direction:....................................... 1Timestamp:....................................... 0d 00h 50m 39s 881513usFrame Length:.................................... 189
D-20Cisco Wireless LAN Controller Configuration Guide
OL-15969-01
Appendix D TroubleshootingTroubleshooting CCXv5 Client Devices
Frame Data:00000000: 80 00 00 00 ff ff ff ff ff ff 00 12 44 bd 80 30 ............D..000000010: 00 12 44 bd 80 30 60 f7 46 c0 8b 4b d1 05 00 00 ..D..0`.F..K....00000020: 64 00 11 08 00 01 00 01 08 8c 12 98 24 b0 48 60 d...........$.H`00000030: 6c 05 04 00 02 00 00 85 1e 00 00 89 00 0f 00 ff l...............00000040: 03 19 00 41 50 34 30 2d 31 37 00 00 00 00 00 00 ...AP40-17......00000050: 00 00 00 00 00 00 26 dd 18 00 50 f2 01 01 00 00 ......&...P.....00000060: 50 f2 05 01 00 00 50 f2 05 01 00 00 40 96 00 28 P.....P.....@..(00000070: 00 dd 06 00 40 96 01 01 00 dd 05 00 40 96 03 04 ....@.......@...
00000080: dd 16 00 40 96 04 00 05 07 a4 00 00 23 a4 00 00 ...@........#...00000090: 42 43 00 00 62 32 00 00 dd 05 00 40 96 0b 01 dd [email protected]: 18 00 50 f2 02 01 01 85 00 03 a4 00 00 27 a4 00 ..P..........'..000000b0: 00 42 43 5e 00 62 32 2f 00 0b 9a 1d 6f .BC^.b2/....o...
Using the GUI to Configure Client ReportingFollow these steps to configure client reporting using the controller GUI.
Step 1 Click Monitor > Clients to open the Clients page.
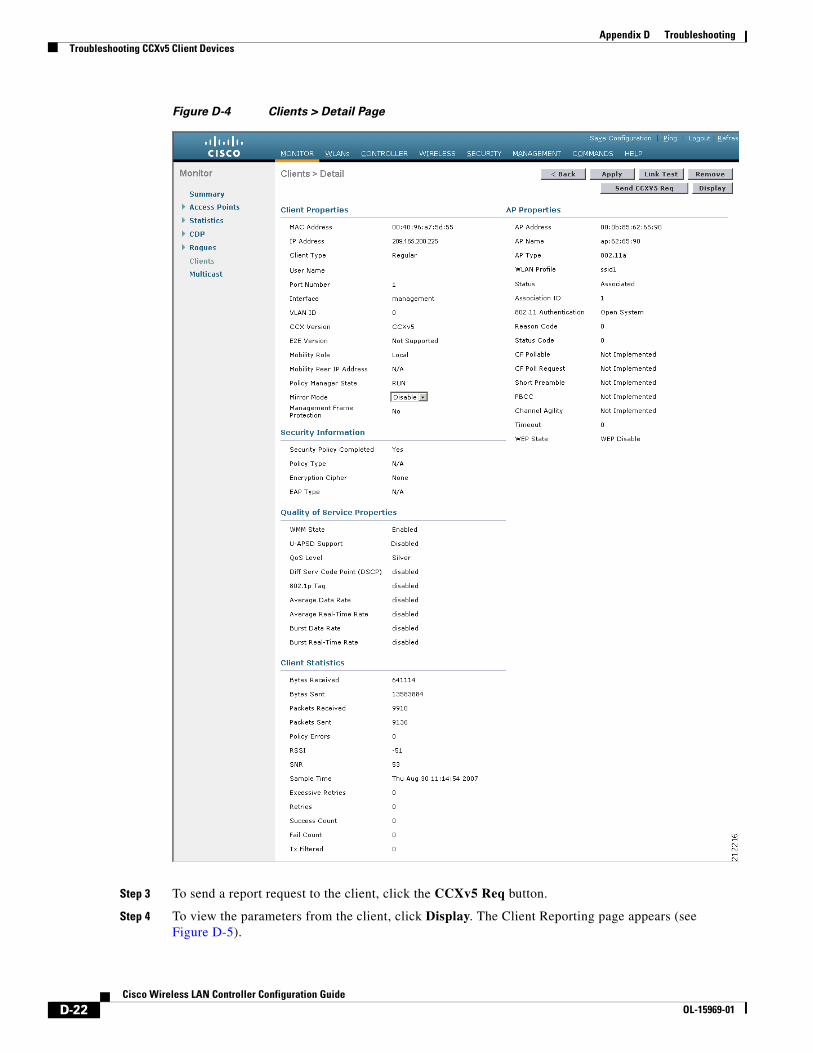
Step 2 Click the MAC address of the desired client. The Clients > Detail page appears (see Figure D-4).
D-21Cisco Wireless LAN Controller Configuration Guide
OL-15969-01
Appendix D TroubleshootingTroubleshooting CCXv5 Client Devices
Figure D-4 Clients > Detail Page
Step 3 To send a report request to the client, click the CCXv5 Req button.
Step 4 To view the parameters from the client, click Display. The Client Reporting page appears (see Figure D-5).
D-22Cisco Wireless LAN Controller Configuration Guide
OL-15969-01

Appendix D TroubleshootingTroubleshooting CCXv5 Client Devices
Figure D-5 Client Reporting Page
This page lists the client profiles and indicates if they are currently in use. It also provides information on the client’s operating parameters, manufacturer, and capabilities.
Step 5 Click the link for the desired client profile. The Profile Details page appears (see Figure D-6).
D-23Cisco Wireless LAN Controller Configuration Guide
OL-15969-01

Appendix D TroubleshootingTroubleshooting CCXv5 Client Devices
Figure D-6 Profile Details Page
This page shows the client profile details, including the SSID, power save mode, radio channel, data rates, and 802.11 security settings.
Using the CLI to Configure Client ReportingUsing the controller CLI, follow these steps to configure client reporting.
Step 1 To send a request to the client to send its profiles, enter this command:
config client ccx get-profiles client_mac_address
Step 2 To send a request to the client to send its current operating parameters, enter this command:
config client ccx get-operating-parameters client_mac_address
Step 3 To send a request to the client to send the manufacturer’s information, enter this command:
config client ccx get-manufacturer-info client_mac_address
Step 4 To send a request to the client to send its capability information, enter this command:
config client ccx get-client-capability client_mac_address
Step 5 To clear the client reporting information, enter this command:
config client ccx clear-reports client_mac_address
D-24Cisco Wireless LAN Controller Configuration Guide
OL-15969-01

Appendix D TroubleshootingTroubleshooting CCXv5 Client Devices
Step 6 To see the client profiles, enter this command:
show client ccx profiles client_mac_address
Information similar to the following appears:
Number of Profiles............................... 1Current Profile.................................. 1
Profile ID....................................... 1Profile Name..................................... wifiEAPSSID............................................. wifiEAPSecurity Parameters[EAP Method,Credential]....... EAP-TLS,Host OS Login CredentialsAuth Method...................................... EAPKey Management................................... WPA2+CCKMEncryption....................................... AES-CCMPPower Save Mode.................................. Constantly AwakeRadio Configuration:Radio Type....................................... DSSS Preamble Type.................................. Long preamble CCA Method..................................... Energy Detect + Carrier Detect/Correlation Data Retries................................... 6 Fragment Threshold............................. 2342 Radio Channels................................. 1 2 3 4 5 6 7 8 9 10 11 Tx Power Mode.................................. Automatic Rate List(MB).................................. 1.0 2.0
Radio Type....................................... HRDSSS(802.11b) Preamble Type.................................. Long preamble CCA Method..................................... Energy Detect + Carrier Detect/Correlation Data Retries................................... 6 Fragment Threshold............................. 2342 Radio Channels................................. 1 2 3 4 5 6 7 8 9 10 11 Tx Power Mode.................................. Automatic Rate List(MB).................................. 5.5 11.0
Radio Type....................................... ERP(802.11g) Preamble Type.................................. Long preamble CCA Method..................................... Energy Detect + Carrier Detect/Correlation Data Retries................................... 6 Fragment Threshold............................. 2342 Radio Channels................................. 1 2 3 4 5 6 7 8 9 10 11 Tx Power Mode.................................. Automatic Rate List(MB).................................. 6.0 9.0 12.0 18.0 24.0 36.0 48.0 54.0
Radio Type....................................... OFDM(802.11a) Preamble Type.................................. Long preamble CCA Method..................................... Energy Detect + Carrier Detect/Correlation Data Retries................................... 6 Fragment Threshold............................. 2342Radio Channels................................. 36 40 44 48 52 56 60 64 149 153 157 161 165 Tx Power Mode.................................. Automatic Rate List(MB).................................. 6.0 9.0 12.0 18.0 24.0 36.0 48.0 54.0
D-25Cisco Wireless LAN Controller Configuration Guide
OL-15969-01

Appendix D TroubleshootingTroubleshooting CCXv5 Client Devices
Step 7 To see the client operating parameters, enter this command:
show client ccx operating-parameters client_mac_address
Information similar to the following appears:
Client Mac....................................... 00:40:96:b2:8d:5eRadio Type....................................... OFDM(802.11a)
Radio Type....................................... OFDM(802.11a) Radio Channels................................. 36 40 44 48 52 56 60 64 100 104 108 112 116 120 124 128 132 136 140 149 153 157 161 165 Tx Power Mode.................................. Automatic Rate List(MB).................................. 6.0 9.0 12.0 18.0 24.0 36.0 48.0 54.0
Power Save Mode.................................. Normal Power SaveSSID............................................. wifiSecurity Parameters[EAP Method,Credential]....... NoneAuth Method...................................... NoneKey Management................................... NoneEncryption....................................... NoneDevice Name...................................... Wireless Network Connection 15Device Type...................................... 0OS Id............................................ Windows XPOS Version....................................... 5.1.2600 Service Pack 2IP Type.......................................... DHCP addressIPv4 Address..................................... AvailableIP Address....................................... 70.0.4.66Subnet Mask...................................... 255.0.0.0Default Gateway.................................. 70.1.0.1IPv6 Address..................................... Not AvailableIPv6 Address..................................... 0: 0: 0: 0: 0: 0: 0: 0: 0: 0: 0: 0: 0: 0: 0: 0:IPv6 Subnet Mask................................. 0: 0: 0: 0: 0: 0: 0: 0: 0: 0: 0: 0: 0: 0: 0: 0:DNS Servers...................................... 103.0.48.0WINS Servers..................................... System Name...................................... URAVAL3777Firmware Version................................. 4.0.0.187Driver Version................................... 4.0.0.187
Step 8 To see the client manufacturer information, enter this command:
show client ccx manufacturer-info client_mac_address
Information similar to the following appears:
Manufacturer OUI................................. 00:40:96 Manufacturer ID.................................. Cisco Manufacturer Model............................... Cisco Aironet 802.11a/b/g Wireless Adapter Manufacturer Serial.............................. FOC1046N3SX Mac Address...................................... 00:40:96:b2:8d:5eRadio Type....................................... DSSS OFDM(802.11a) HRDSSS(802.11b) ERP(802.11g) Antenna Type..................................... Omni-directional diversityAntenna Gain..................................... 2 dBi
Rx Sensitivity:Radio Type....................................... DSSS Rx Sensitivity .................................. Rate:1.0 Mbps, MinRssi:-95, MaxRssi:-30Rx Sensitivity .................................. Rate:2.0 Mbps, MinRssi:-95, MaxRssi:-30Radio Type....................................... HRDSSS(802.11b) Rx Sensitivity .................................. Rate:5.5 Mbps, MinRssi:-95, MaxRssi:-30Rx Sensitivity .................................. Rate:11.0 Mbps, MinRssi:-95, MaxRssi:-30
D-26Cisco Wireless LAN Controller Configuration Guide
OL-15969-01

Appendix D TroubleshootingTroubleshooting CCXv5 Client Devices
Radio Type....................................... ERP(802.11g) Rx Sensitivity .................................. Rate:6.0 Mbps, MinRssi:-95, MaxRssi:-30Rx Sensitivity .................................. Rate:9.0 Mbps, MinRssi:-95, MaxRssi:-30Rx Sensitivity .................................. Rate:12.0 Mbps, MinRssi:-95, MaxRssi:-30Rx Sensitivity .................................. Rate:18.0 Mbps, MinRssi:-95, MaxRssi:-30
Step 9 To see the client’s capability information, enter this command:
show client ccx client-capability client_mac_address
Note This command displays the client’s available capabilities, not current settings for the capabilities.
Information similar to the following appears:
Service Capability............................... Voice, Streaming(uni-directional) Video, Interactive(bi-directional) VideoRadio Type....................................... DSSS OFDM(802.11a) HRDSSS(802.11b) ERP(802.11g)
Radio Type....................................... DSSS Radio Channels................................. 1 2 3 4 5 6 7 8 9 10 11 Tx Power Mode.................................. Automatic Rate List(MB).................................. 1.0 2.0
Radio Type....................................... HRDSSS(802.11b) Radio Channels................................. 1 2 3 4 5 6 7 8 9 10 11 Tx Power Mode.................................. Automatic Rate List(MB).................................. 5.5 11.0
Radio Type....................................... ERP(802.11g) Radio Channels................................. 1 2 3 4 5 6 7 8 9 10 11 Tx Power Mode.................................. Automatic Rate List(MB).................................. 6.0 9.0 12.0 18.0 24.0 36.0 48.0 54.0
Radio Type....................................... OFDM(802.11a) Radio Channels................................. 36 40 44 48 52 56 60 64 100 104 108 112 116 120 124 128 132 136 140 149 153 157 161 165 Tx Power Mode.................................. Automatic Rate List(MB).................................. 6.0 9.0 12.0 18.0 24.0 36.0 48.0 54.0
Using the CLI to Configure Roaming and Real-Time DiagnosticsUsing the controller CLI, follow these steps to configure roaming and real-time diagnostics.
Step 1 To send a log request, enter this command:
config client ccx log-request log_type client_mac_address
where log_type is roam, rsna, or syslog.
Step 2 To view a log response, enter this command:
show client ccx log-response log_type client_mac_address
where log_type is roam, rsna, or syslog.
D-27Cisco Wireless LAN Controller Configuration Guide
OL-15969-01

Appendix D TroubleshootingTroubleshooting CCXv5 Client Devices
Information similar to the following appears for a log response with a log_type of roam:
Tue Jun 26 18:28:48 2007 Roaming Response LogID=133: Status=Successful Event Timestamp=0d 00h 00m 13s 322396us Source BSSID=00:0b:85:81:06:c2, Target BSSID=00:0b:85:81:06:c2, Transition Time=3125(ms) Transition Reason: Normal roam, poor link Transition Result: SuccessTue Jun 26 18:28:48 2007 Roaming Response LogID=133: Status=Successful Event Timestamp=0d 00h 00m 16s 599006us Source BSSID=00:0b:85:81:06:c2, Target BSSID=00:0b:85:81:06:c2, Transition Time=3235(ms) Transition Reason: Normal roam, poor link Transition Result: Success Event Timestamp=0d 00h 00m 19s 882921us Source BSSID=00:0b:85:81:06:c2, Target BSSID=00:0b:85:81:06:c2, Transition Time=3234(ms) Transition Reason: Normal roam, poor link Transition Result: SuccessTue Jun 26 18:28:48 2007 Roaming Response LogID=133: Status=Successful Event Timestamp=0d 00h 00m 08s 815477us Source BSSID=00:0b:85:81:06:c2, Target BSSID=00:0b:85:81:06:d2, Transition Time=3281(ms) Transition Reason: First association to WLAN Transition Result: Success Event Timestamp=0d 00h 00m 26s 637084us Source BSSID=00:0b:85:81:06:d2, Target BSSID=00:0b:85:81:06:c2, Transition Time=3313(ms)
Information similar to the following appears for a log response with a log_type of rsna:
Tue Jun 26 18:24:09 2007 RSNA Response LogID=132: Status=Successful Event Timestamp=0d 00h 00m 00s 246578us Target BSSID=00:14:1b:58:86:cd RSNA Version=1 Group Cipher Suite=00-0f-ac-02 Pairwise Cipher Suite Count = 1 Pairwise Cipher Suite 0 = 00-0f-ac-04 AKM Suite Count = 1 AKM Suite 0 = 00-0f-ac-01 RSN Capability = 0x0 RSNA Result: SuccessTue Jun 26 18:24:09 2007 RSNA Response LogID=132: Status=Successful Event Timestamp=0d 00h 00m 00s 246625us Target BSSID=00:14:1b:58:86:cd RSNA Version=1 Group Cipher Suite=00-0f-ac-02 Pairwise Cipher Suite Count = 1 Pairwise Cipher Suite 0 = 00-0f-ac-04 AKM Suite Count = 1 AKM Suite 0 = 00-0f-ac-01 RSN Capability = 0x0 RSNA Result: Success
D-28Cisco Wireless LAN Controller Configuration Guide
OL-15969-01
Appendix D TroubleshootingTroubleshooting CCXv5 Client Devices
Tue Jun 26 18:24:09 2007 RSNA Response LogID=132: Status=Successful Event Timestamp=0d 00h 00m 01s 624375us Target BSSID=00:14:1b:58:86:cd RSNA Version=1 Group Cipher Suite=00-0f-ac-02 Pairwise Cipher Suite Count = 1 Pairwise Cipher Suite 0 = 00-0f-ac-04 AKM Suite Count = 1 AKM Suite 0 = 00-0f-ac-01 RSN Capability = 0x0
RSNA Result: Success
Information similar to the following appears for a log response with a log_type of syslog:
Tue Jun 26 18:07:48 2007 SysLog Response LogID=131: Status=Successful Event Timestamp=0d 00h 19m 42s 278987us Client SysLog = '<11> Jun 19 11:49:47 uraval3777 Mandatory elements missing in the OID response' Event Timestamp=0d 00h 19m 42s 278990us Client SysLog = '<11> Jun 19 11:49:50 uraval3777 Mandatory elements missing in the OID response'Tue Jun 26 18:07:48 2007 SysLog Response LogID=131: Status=Successful Event Timestamp=0d 00h 19m 42s 278993us Client SysLog = '<11> Jun 19 11:49:53 uraval3777 Mandatory elements missing in the OID response' Event Timestamp=0d 00h 19m 42s 278996us Client SysLog = '<11> Jun 19 11:49:56 uraval3777 Mandatory elements missing in the OID response'Tue Jun 26 18:07:48 2007 SysLog Response LogID=131: Status=Successful Event Timestamp=0d 00h 19m 42s 279000us Client SysLog = '<11> Jun 19 11:50:00 uraval3777 Mandatory elements missing in the OID response' Event Timestamp=0d 00h 19m 42s 279003us Client SysLog = '<11> Jun 19 11:50:03 uraval3777 Mandatory elements missing in the OID response'Tue Jun 26 18:07:48 2007 SysLog Response LogID=131: Status=Successful Event Timestamp=0d 00h 19m 42s 279009us Client SysLog = '<11> Jun 19 11:50:09 uraval3777 Mandatory elements missing in the OID response' Event Timestamp=0d 00h 19m 42s 279012us Client SysLog = '<11> Jun 19 11:50:12 uraval3777 Mandatory elements missing in the OID response'
Step 3 To send a request for statistics, enter this command:
config client ccx stats-request measurement_duration stats_name client_mac_address
where stats_name is dot11 or security.
Step 4 To view the statistics response, enter this command:
show client ccx stats-report client_mac_address
Information similar to the following appears:
Measurement duration = 1
dot11TransmittedFragmentCount = 1 dot11MulticastTransmittedFrameCount = 2 dot11FailedCount = 3 dot11RetryCount = 4 dot11MultipleRetryCount = 5 dot11FrameDuplicateCount = 6 dot11RTSSuccessCount = 7 dot11RTSFailureCount = 8 dot11ACKFailureCount = 9
D-29Cisco Wireless LAN Controller Configuration Guide
OL-15969-01
Appendix D TroubleshootingUsing the Debug Facility
dot11ReceivedFragmentCount = 10 dot11MulticastReceivedFrameCount = 11 dot11FCSErrorCount = 12 dot11TransmittedFrameCount = 13
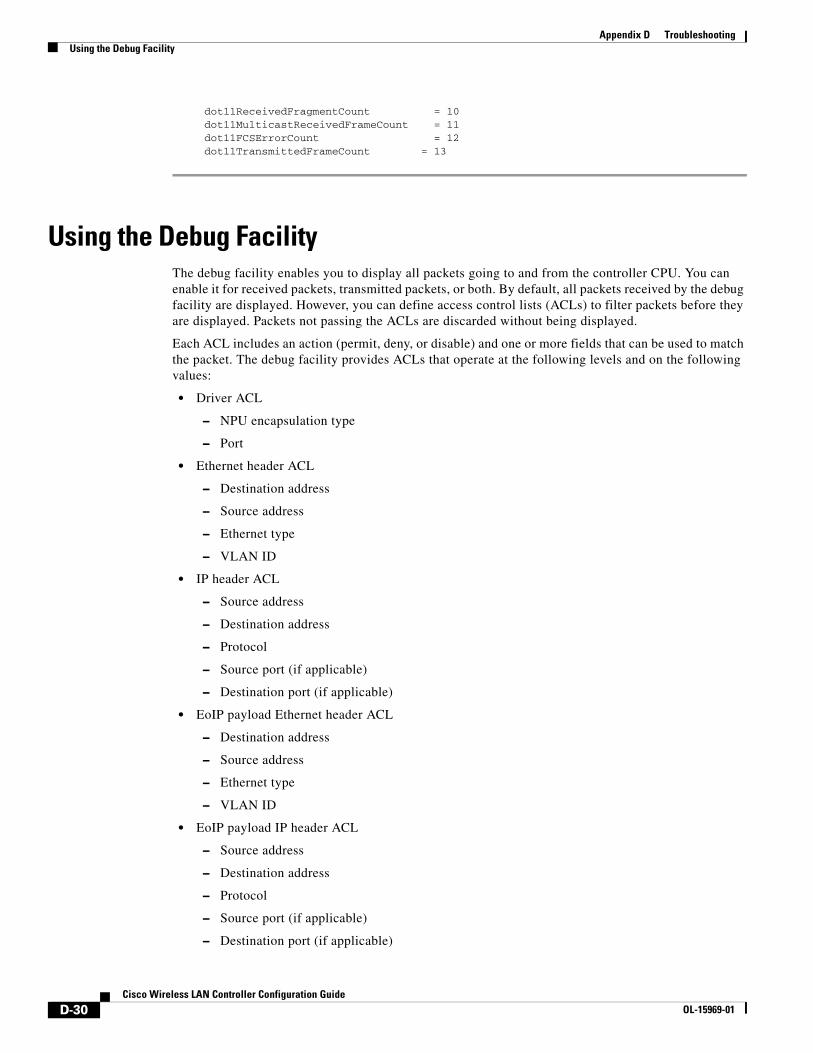
Using the Debug FacilityThe debug facility enables you to display all packets going to and from the controller CPU. You can enable it for received packets, transmitted packets, or both. By default, all packets received by the debug facility are displayed. However, you can define access control lists (ACLs) to filter packets before they are displayed. Packets not passing the ACLs are discarded without being displayed.
Each ACL includes an action (permit, deny, or disable) and one or more fields that can be used to match the packet. The debug facility provides ACLs that operate at the following levels and on the following values:
• Driver ACL
– NPU encapsulation type
– Port
• Ethernet header ACL
– Destination address
– Source address
– Ethernet type
– VLAN ID
• IP header ACL
– Source address
– Destination address
– Protocol
– Source port (if applicable)
– Destination port (if applicable)
• EoIP payload Ethernet header ACL
– Destination address
– Source address
– Ethernet type
– VLAN ID
• EoIP payload IP header ACL
– Source address
– Destination address
– Protocol
– Source port (if applicable)
– Destination port (if applicable)
D-30Cisco Wireless LAN Controller Configuration Guide
OL-15969-01
Appendix D TroubleshootingUsing the Debug Facility
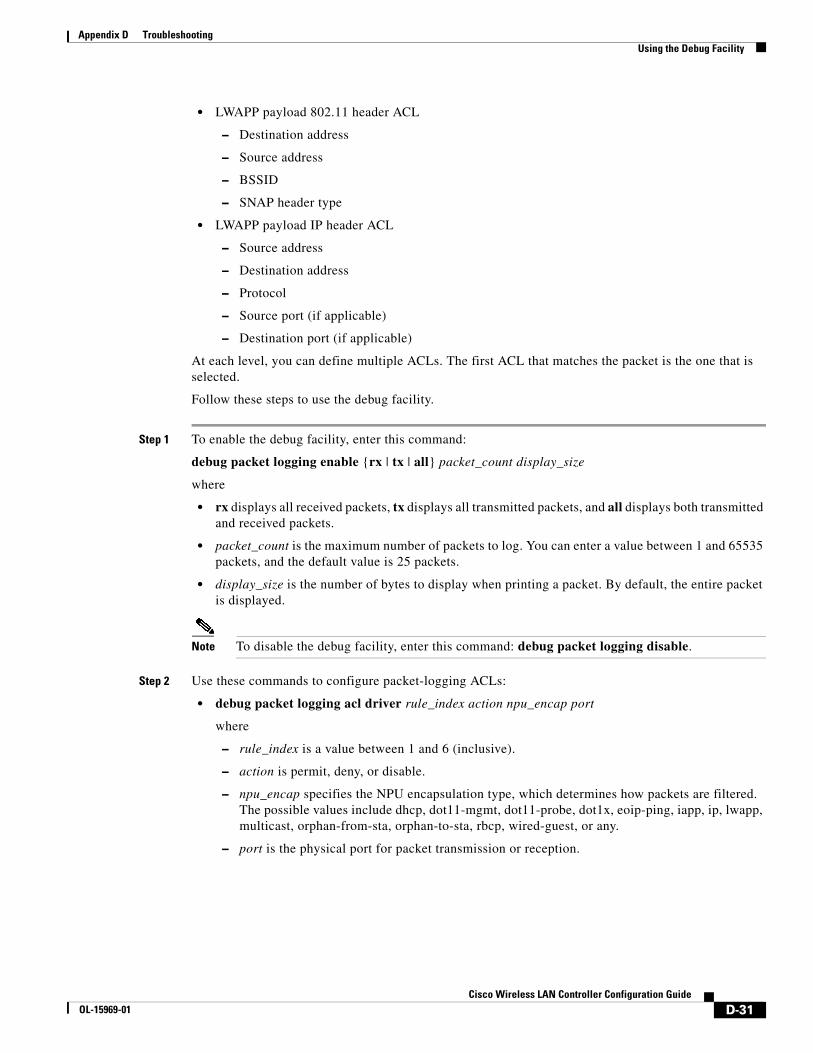
• LWAPP payload 802.11 header ACL
– Destination address
– Source address
– BSSID
– SNAP header type
• LWAPP payload IP header ACL
– Source address
– Destination address
– Protocol
– Source port (if applicable)
– Destination port (if applicable)
At each level, you can define multiple ACLs. The first ACL that matches the packet is the one that is selected.
Follow these steps to use the debug facility.
Step 1 To enable the debug facility, enter this command:
debug packet logging enable {rx | tx | all} packet_count display_size
where
• rx displays all received packets, tx displays all transmitted packets, and all displays both transmitted and received packets.
• packet_count is the maximum number of packets to log. You can enter a value between 1 and 65535 packets, and the default value is 25 packets.
• display_size is the number of bytes to display when printing a packet. By default, the entire packet is displayed.
Note To disable the debug facility, enter this command: debug packet logging disable.
Step 2 Use these commands to configure packet-logging ACLs:
• debug packet logging acl driver rule_index action npu_encap port
where
– rule_index is a value between 1 and 6 (inclusive).
– action is permit, deny, or disable.
– npu_encap specifies the NPU encapsulation type, which determines how packets are filtered. The possible values include dhcp, dot11-mgmt, dot11-probe, dot1x, eoip-ping, iapp, ip, lwapp, multicast, orphan-from-sta, orphan-to-sta, rbcp, wired-guest, or any.
– port is the physical port for packet transmission or reception.
D-31Cisco Wireless LAN Controller Configuration Guide
OL-15969-01

Appendix D TroubleshootingUsing the Debug Facility
• debug packet logging acl eth rule_index action dst src type vlan
where
– rule_index is a value between 1 and 6 (inclusive).
– action is permit, deny, or disable.
– dst is the destination MAC address.
– src is the source MAC address.
– type is the two-byte type code (such as 0x800 for IP, 0x806 for ARP). This parameter also accepts a few common string values such as “ip” (for 0x800) or “arp” (for 0x806).
– vlan is the two-byte VLAN ID.
• debug packet logging acl ip rule_index action src dst proto src_port dst_port
where
– proto is a numeric or any string recognized by getprotobyname(). The controller supports the following strings: ip, icmp, igmp, ggp, ipencap, st, tcp, egp, pup, udp, hmp, xns-idp, rdp, iso-tp4, xtp, ddp, idpr-cmtp, rspf, vmtp, ospf, ipip, and encap.
– src_port is the UDP/TCP two-byte source port (for example, telnet, 23) or “any.” The controller accepts a numeric or any string recognized by getservbyname(). The controller supports the following strings: tcpmux, echo, discard, systat, daytime, netstat, qotd, msp, chargen, ftp-data, ftp, fsp, ssh, telnet, smtp, time, rlp, nameserver, whois, re-mail-ck, domain, mtp, bootps, bootpc, tftp, gopher, rje, finger, www, link, kerberos, supdup, hostnames, iso-tsap, csnet-ns, 3com-tsmux, rtelnet, pop-2, pop-3, sunrpc, auth, sftp, uucp-path, nntp, ntp, netbios-ns, netbios-dgm, netbios-ssn, imap2, snmp, snmp-trap, cmip-man, cmip-agent, xdmcp, nextstep, bgp, prospero, irc, smux, at-rtmp, at-nbp, at-echo, at-zis, qmtp, z3950, ipx, imap3, ulistserv, https, snpp, saft, npmp-local, npmp-gui, and hmmp-ind.
– dst_port is the UDP/TCP two-byte destination port (for example, telnet, 23) or “any.” The controller accepts a numeric or any string recognized by getservbyname(). The controller supports the same strings as those for the src_port.
• debug packet logging acl eoip-eth rule_index action dst src type vlan
• debug packet logging acl eoip-ip rule_index action src dst proto src_port dst_port
• debug packet logging acl lwapp-dot11 rule_index action dst src bssid snap_type
where
– bssid is the Basic Service Set Identifier.
– snap_type is the Ethernet type.
• debug packet logging acl lwapp-ip rule_index action src dst proto src_port dst_port
Note To remove all configured ACLs, enter this command: debug packet logging acl clear-all.
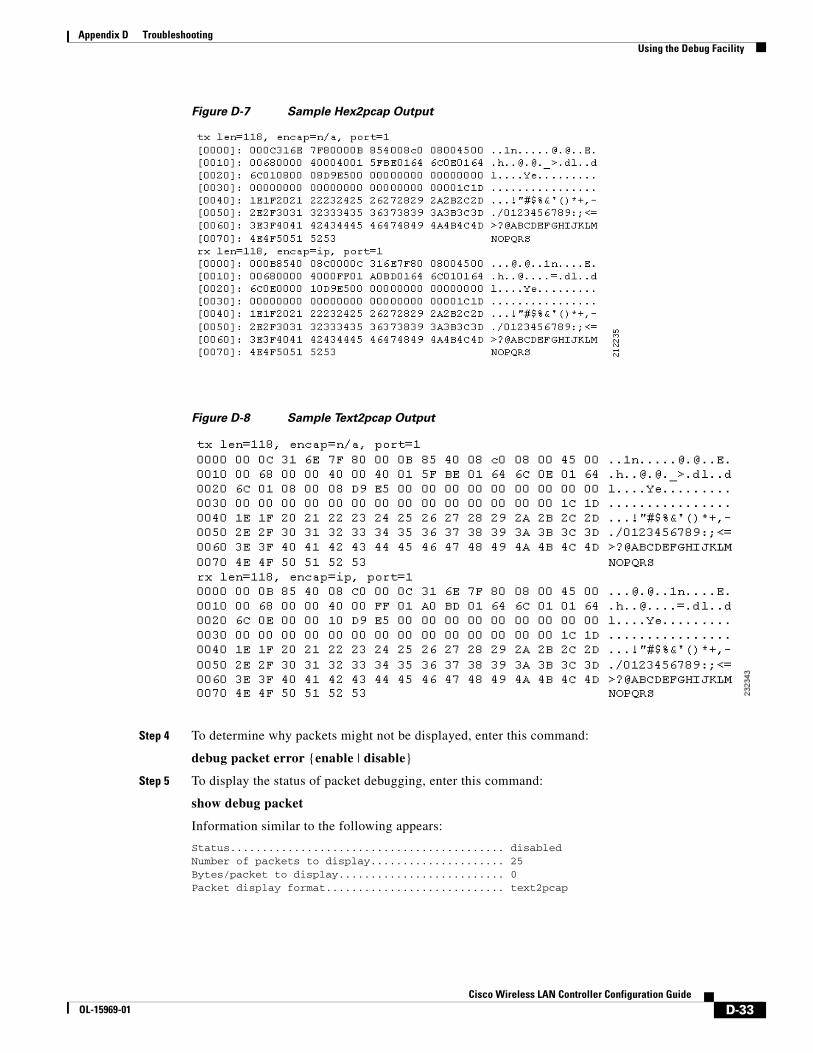
Step 3 To configure the format of the debug output, enter this command:
debug packet logging format {hex2pcap | text2pcap}
The debug facility supports two output formats: hex2pcap and text2pcap. The standard format used by IOS supports the use of hex2pcap and can be decoded using an HTML front end. The text2pcap option is provided as an alternative so that a sequence of packets can be decoded from the same console log file. Figure D-7 shows an example of hex2pcap output, and Figure D-8 shows an example of text2pcap output.
D-32Cisco Wireless LAN Controller Configuration Guide
OL-15969-01
Appendix D TroubleshootingUsing the Debug Facility
Figure D-7 Sample Hex2pcap Output
Figure D-8 Sample Text2pcap Output
Step 4 To determine why packets might not be displayed, enter this command:
debug packet error {enable | disable}
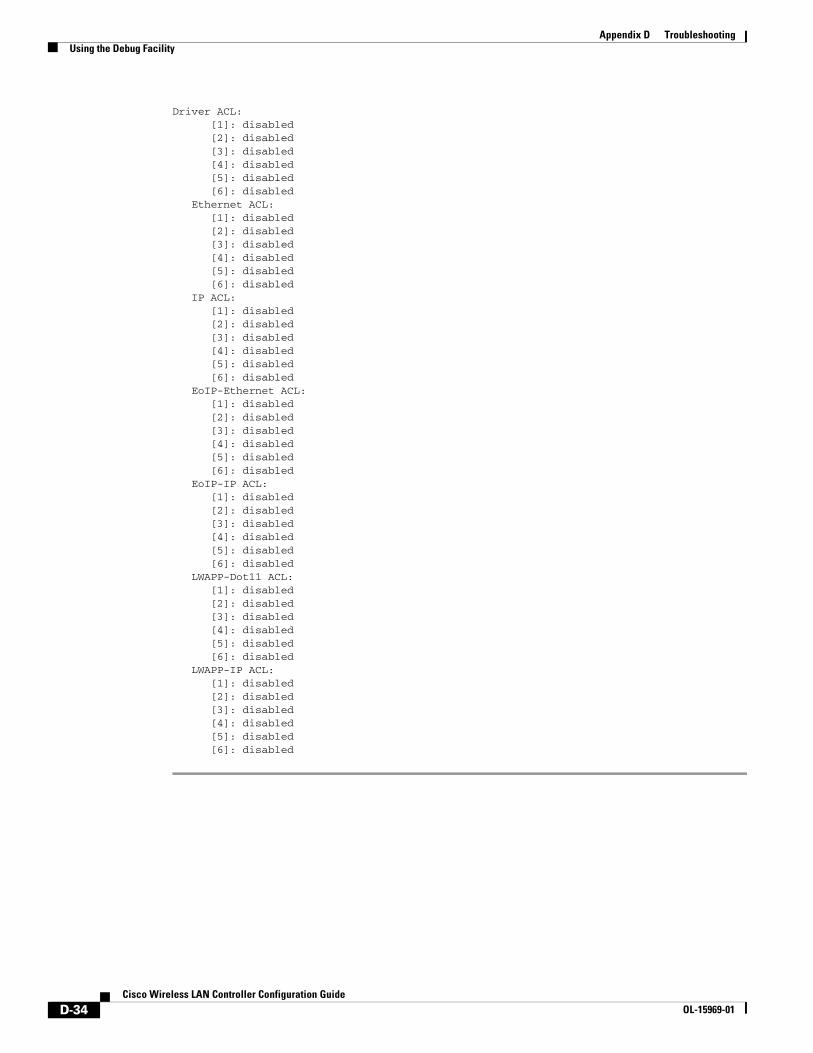
Step 5 To display the status of packet debugging, enter this command:
show debug packet
Information similar to the following appears:
Status........................................... disabledNumber of packets to display..................... 25Bytes/packet to display.......................... 0Packet display format............................ text2pcap
D-33Cisco Wireless LAN Controller Configuration Guide
OL-15969-01
Appendix D TroubleshootingUsing the Debug Facility
Driver ACL: [1]: disabled [2]: disabled [3]: disabled [4]: disabled [5]: disabled [6]: disabled Ethernet ACL: [1]: disabled [2]: disabled [3]: disabled [4]: disabled [5]: disabled [6]: disabled IP ACL: [1]: disabled [2]: disabled [3]: disabled [4]: disabled [5]: disabled [6]: disabled EoIP-Ethernet ACL: [1]: disabled [2]: disabled [3]: disabled [4]: disabled [5]: disabled [6]: disabled EoIP-IP ACL: [1]: disabled [2]: disabled [3]: disabled [4]: disabled [5]: disabled [6]: disabled LWAPP-Dot11 ACL: [1]: disabled [2]: disabled [3]: disabled [4]: disabled [5]: disabled [6]: disabled LWAPP-IP ACL: [1]: disabled [2]: disabled [3]: disabled [4]: disabled [5]: disabled [6]: disabled
D-34Cisco Wireless LAN Controller Configuration Guide
OL-15969-01

Appendix D TroubleshootingConfiguring Wireless Sniffing
Configuring Wireless SniffingThe controller enables you to configure an access point as a network “sniffer,” which captures and forwards all the packets on a particular channel to a remote machine that runs packet analyzer software. These packets contain information on timestamp, signal strength, packet size, and so on. Sniffers allow you to monitor and record network activity and to detect problems.
Supported third-party network analyzer software applications include:
• Wildpackets Omnipeek or Airopeek
• AirMagnet Enterprise Analyzer
• Wireshark
Note The latest version of Wireshark can decode the packets by going to the ‘Anaylze’ mode. select ‘decode as’, and switch UDP5555 to decode as "AIROPEEK".
Prerequisites for Wireless SniffingTo perform wireless sniffing, you need the following hardware and software:
• A dedicated access point—An access point configured as a sniffer cannot simultaneously provide wireless access service on the network. To avoid disrupting coverage, use an access point that is not part of your existing wireless network.
• A remote monitoring device—A computer capable of running the analyzer software.
• Windows XP or Linux operating system—The controller supports sniffing on both Windows XP and Linux machines.
• Software and supporting files, plug-ins, or adapters—Your analyzer software may require specialized files before you can successfully enable sniffing:
– Omnipeek or Airopeek—Go to WildPackets’ website and follow the instructions to purchase, install, and configure the software.
– AirMagnet—Go to Fluke Networks’ website and follow the instructions to purchase, install, and configure the software.
– Wireshark—Go to http://www.cisco.com/cisco/software/navigator.html and follow the instructions to download Wireshark and the correct installation wizard for your operating system.
Using the GUI to Configure Sniffing on an Access PointUsing the controller GUI, follow these steps to configure sniffing on an access point.
Step 1 Click Wireless > Access Points > All APs to open the All APs page.
Step 2 Click the name of the access point that you want to configure as the sniffer. The All APs > Details page appears (see Figure D-9).
D-35Cisco Wireless LAN Controller Configuration Guide
OL-15969-01

Appendix D TroubleshootingConfiguring Wireless Sniffing
Figure D-9 All APs > Details Page
Step 3 From the AP Mode drop-down box, choose Sniffer.
Step 4 Click Apply to commit your changes.
Step 5 Click OK when warned that the access point will be rebooted.
Step 6 Click Wireless > Access Points > Radios > 802.11a/n (or 802.11b/g/n) to open the 802.11a/n (or 802.11b/g/n) Radios page.
Step 7 Hover your cursor over the blue drop-down arrow for the desired access point and choose Configure. The 802.11a/n (or 802.11b/g/n) Cisco APs > Configure page appears (see Figure D-10).
Figure D-10 802.11b/g/n Cisco APs > Configure Page
Step 8 Check the Sniff check box to enable sniffing on this access point, or leave it unchecked to disable sniffing. The default value is unchecked.
D-36Cisco Wireless LAN Controller Configuration Guide
OL-15969-01

Appendix D TroubleshootingConfiguring Wireless Sniffing
Step 9 If you enabled sniffing in Step 8, follow these steps:
a. From the Channel drop-down box, choose the channel on which the access point sniffs for packets.
b. In the Server IP Address field, enter the IP address of the remote machine running Omnipeek, Airopeek, AirMagnet, or Wireshark.
Step 10 Click Apply to commit your changes.
Step 11 Click Save Configuration to save your changes.
Using the CLI to Configure Sniffing on an Access PointUsing the controller CLI, follow these steps to configure sniffing on an access point.
Step 1 To configure the access point as a sniffer, enter this command:
config ap mode sniffer Cisco_AP
where Cisco_AP is the access point configured as the sniffer.
Step 2 When warned that the access point will be rebooted and asked if you want to continue, enter Y. The access point reboots in sniffer mode.
Step 3 To enable sniffing on the access point, enter this command:
config ap sniff {802.11a | 802.11b} enable channel server_IP_address Cisco_AP
where
– channel is the radio channel on which the access point sniffs for packets. The default values are 36 (802.11a/n) and 1 (802.11b/g/n).
– server_IP_address is the IP address of the remote machine running Omnipeek, Airopeek, AirMagnet, or Wireshark.
– Cisco_AP is the access point configured as the sniffer.
Note To disable sniffing on the access point, enter this command: config ap sniff {802.11a | 802.11b} disable Cisco_AP
Step 4 To save your changes, enter this command:
save config
Step 5 To view the sniffer configuration settings for an access point, enter this command:
show ap config {802.11a | 802.11b} Cisco_AP
Information similar to the following appears:
Cisco AP Identifier................................ 17Cisco AP Name.......................................... AP1131:46f2.98ac... AP Mode ........................................... SnifferPublic Safety ..................................... Global: Disabled, Local: DisabledSniffing .............................................. No ...
D-37Cisco Wireless LAN Controller Configuration Guide
OL-15969-01

Appendix D TroubleshootingTroubleshooting Access Points Using Telnet or SSH
Troubleshooting Access Points Using Telnet or SSHThe controller supports the use of Telnet or Secure Shell (SSH) protocols to troubleshoot lightweight access points. Using these protocols makes debugging easier, especially when the access point is unable to connect to the controller.
• To avoid potential conflicts and security threats to the network, the following commands are unavailable while a Telnet or SSH session is enabled: config terminal, telnet, ssh, rsh, ping, traceroute, clear, clock, crypto, delete, fsck, lwapp, mkdir, radius, release, reload, rename, renew, rmdir, save, set, test, upgrade.
• Commands available during a Telnet or SSH session include: debug, disable, enable, help, led, login, logout, more, no debug, show, systat, undebug, where.
Using the controller CLI, follow these steps to enable Telnet or SSH access on lightweight access points.
Step 1 To enable Telnet or SSH connectivity on an access point, enter this command:
config ap {telnet | ssh} enable Cisco_AP
Note To disable Telnet or SSH connectivity on an access point, enter this command:config ap {telnet | ssh} disable Cisco_AP
Step 2 To save your changes, enter this command:
save config
Step 3 To see whether Telnet or SSH is enabled on an access point, enter this command:
show ap config general Cisco_AP
Information similar to the following appears:
Cisco AP Identifier.............................. 5Cisco AP Name.................................... AP33Country code..................................... Multiple Countries:US,AE,AR,AT,AU,BHReg. Domain allowed by Country................... 802.11bg:-ABCENR 802.11a:-ABCENAP Country code.................................. US - United StatesAP Regulatory Domain............................. 802.11bg:-A 802.11a:-A Switch Port Number .............................. 2MAC Address...................................... 00:19:2f:11:16:7aIP Address Configuration......................... Static IP assignedIP Address....................................... 10.22.8.133IP NetMask....................................... 255.255.248.0Gateway IP Addr.................................. 10.22.8.1Domain........................................... Name Server...................................... Telnet State..................................... EnabledSsh State........................................ Enabled...
D-38Cisco Wireless LAN Controller Configuration Guide
OL-15969-01