Embed Size (px)
Citation preview

NATIONAL HURRICANE CENTER TROPICAL CYCLONE REPORT
TROPICAL STORM BILL (AL022015) 16 – 18 June 2015
Robbie Berg National Hurricane Center
9 September 2015
GOES-EAST VISIBLE SATELLITE IMAGE OF TROPICAL STORM BILL AT 1645 UTC 16 JUNE 2015 AT THE TIME OF ITS
LANDFALL ALONG THE TEXAS COAST ON MATAGORDA ISLAND
Tropical Storm Bill formed over the far northwestern Gulf of Mexico and made landfall
along the Texas coast on Matagorda Island. Bill produced heavy rains and flooding while it moved across eastern Texas and Oklahoma.

Tropical Storm Bill 2
Tropical Storm Bill 16 – 18 JUNE 2015
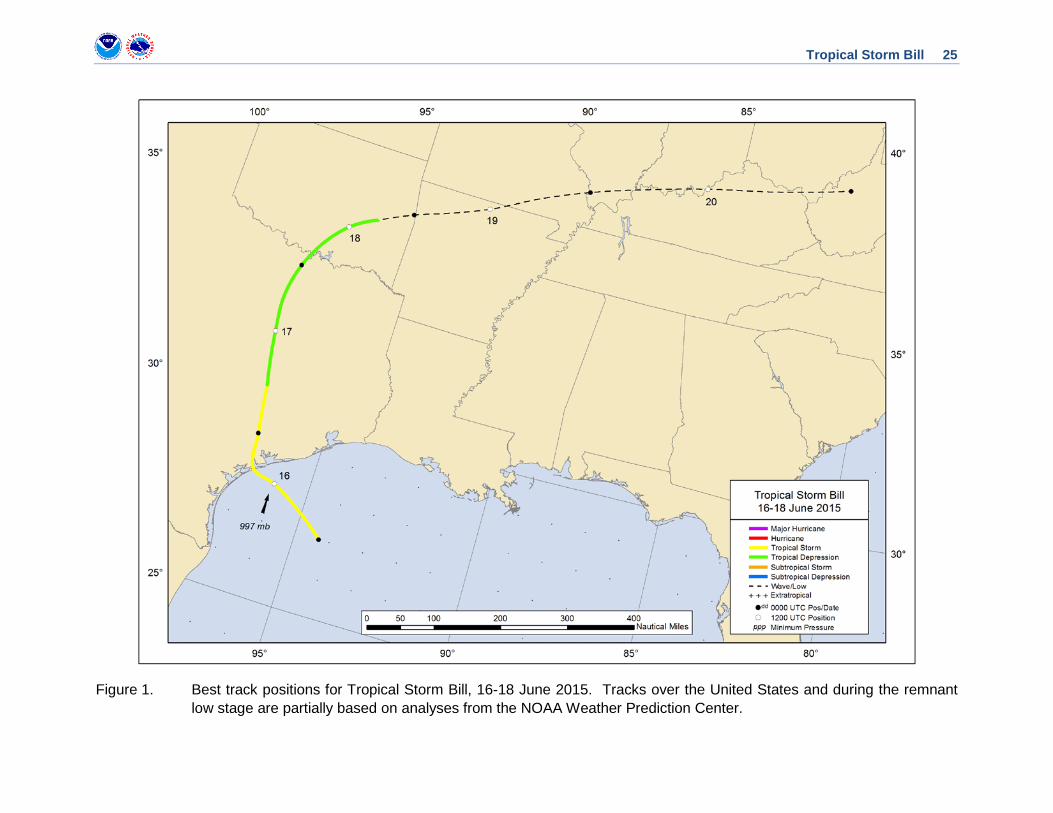
SYNOPTIC HISTORY Tropical Storm Bill formed from the interaction of an upper-level trough over the Gulf of Mexico and a broad area of low pressure near the Yucatan Peninsula and Belize. A weak, low-latitude tropical wave that moved off the west coast of Africa on 31 May could have fostered the development of the broad low, but the wave was difficult to track due to dry air across the tropical Atlantic, which inhibited deep convection. By 11 June, a zone of low-level shear vorticity developed over the western Caribbean Sea and Central America between the subtropical high over the western Atlantic Ocean and Hurricane Carlos off the southern coast of Mexico. Carlos’ circulation, combined with the upper-level trough, advected deep moisture and the vorticity northward over the next couple of days, and a broad, elongated area of low pressure formed over northern Belize and the Yucatan Peninsula on 13 June. Blocked by a mid-tropospheric high near the southeastern U.S. coast, the disturbance was steered northwestward over the western Gulf of Mexico on 14 and 15 June. The low developed a well-defined center of circulation by 0000 UTC 16 June, and since it was already producing tropical-storm-force winds, it was designated as a tropical storm at that time while centered about 175 n mi east-southeast of Corpus Christi, Texas. The “best track” chart of the tropical cyclone’s path is given in Fig. 1, with the wind and pressure histories shown in Figs. 2 and 3, respectively. The best track positions and intensities are listed in Table 11.
Bill continued northwestward early on 16 June but slowed down and turned west-northwestward as it approached the Texas coast. Bill made landfall on Matagorda Island at 1645 UTC 16 June with maximum winds of 50 kt, and was then nearly stationary along the coast for a couple of hours. Later that evening, the center turned northward and accelerated inland over eastern Texas, and surface observations indicated that Bill weakened to a tropical depression by 0600 UTC 17 June when centered about 30 n mi east of Austin, Texas. The depression continued northward on 17 June and early on 18 June, producing heavy rainfall and flooding while it moved through the Dallas/Ft. Worth metro area and into southern Oklahoma. Bill turned northeastward after moving into Oklahoma, and although it was still producing heavy rains, its associated convection was not very deep and had begun to lose organization. Thus, Bill is deemed to have become a remnant low by 1800 UTC 18 June while centered about 65 n mi south-southeast of Tulsa, Oklahoma.
Bill’s remnant low moved east-northeastward for the next few days, producing heavy rain, flooding, and tornadoes across southern Missouri, northern Arkansas, and portions of the
1 A digital record of the complete best track, including wind radii, can be found on line at ftp://ftp.nhc.noaa.gov/atcf. Data for the current year’s storms are located in the btk directory, while previous years’ data are located in the archive directory.

Tropical Storm Bill 3
Ohio River Valley. The low ultimately dissipated just after 0000 UTC 21 June over the mountainous terrain of central West Virginia.
METEOROLOGICAL STATISTICS Observations in Bill (Figs. 2 and 3) include subjective satellite-based Dvorak technique intensity estimates from the Tropical Analysis and Forecast Branch (TAFB) and the Satellite Analysis Branch (SAB), and objective Advanced Dvorak Technique (ADT) estimates from the Cooperative Institute for Meteorological Satellite Studies/University of Wisconsin-Madison. Observations also include flight-level, stepped frequency microwave radiometer (SFMR), and dropwindsonde observations from flights of the 53rd Weather Reconnaissance Squadron of the U. S. Air Force Reserve Command. Data and imagery from NOAA polar-orbiting satellites including the Advanced Microwave Sounding Unit (AMSU), the NASA Global Precipitation Mission (GPM), the European Space Agency’s Advanced Scatterometer (ASCAT), and Defense Meteorological Satellite Program (DMSP) satellites, among others, were also useful in constructing the best track of Bill.
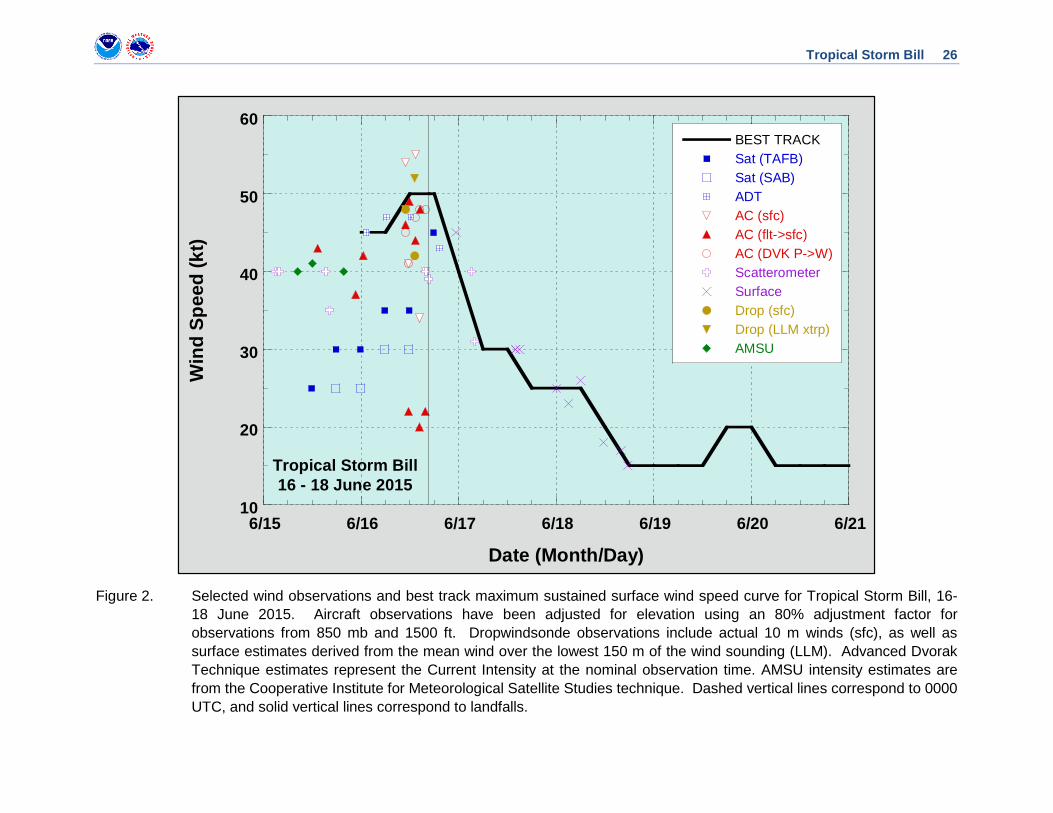
Winds and Pressure Aircraft data indicated that Bill was producing tropical-storm-force winds over the Gulf of Mexico before it had a well-defined center of circulation. During the morning of 15 June, a Hurricane Hunter aircraft measured a peak 1000-ft flight-level wind of 54 kt at 1320 UTC, suggestive of peak surface winds of 40-45 kt, and SFMR values were generally within that range as well. Similar flight-level and SFMR winds were observed on the evening Air Force flight, supporting Bill’s intensity of 45 kt when it was designated a tropical cyclone at 0000 UTC 16 June.
Bill’s estimated peak intensity of 50 kt from 1200 UTC 16 June up until landfall is based on a peak 850-mb flight-level wind of 61 kt at 1150 UTC and two dropsondes that measured average winds of 58 kt and 62 kt in the lowest 150 m of the profile at 1054 UTC and 1311 UTC, respectively. The estimated minimum central pressure of 997 mb is based on surface pressure data from several dropsondes between 1057 UTC and 1548 UTC 16 June.
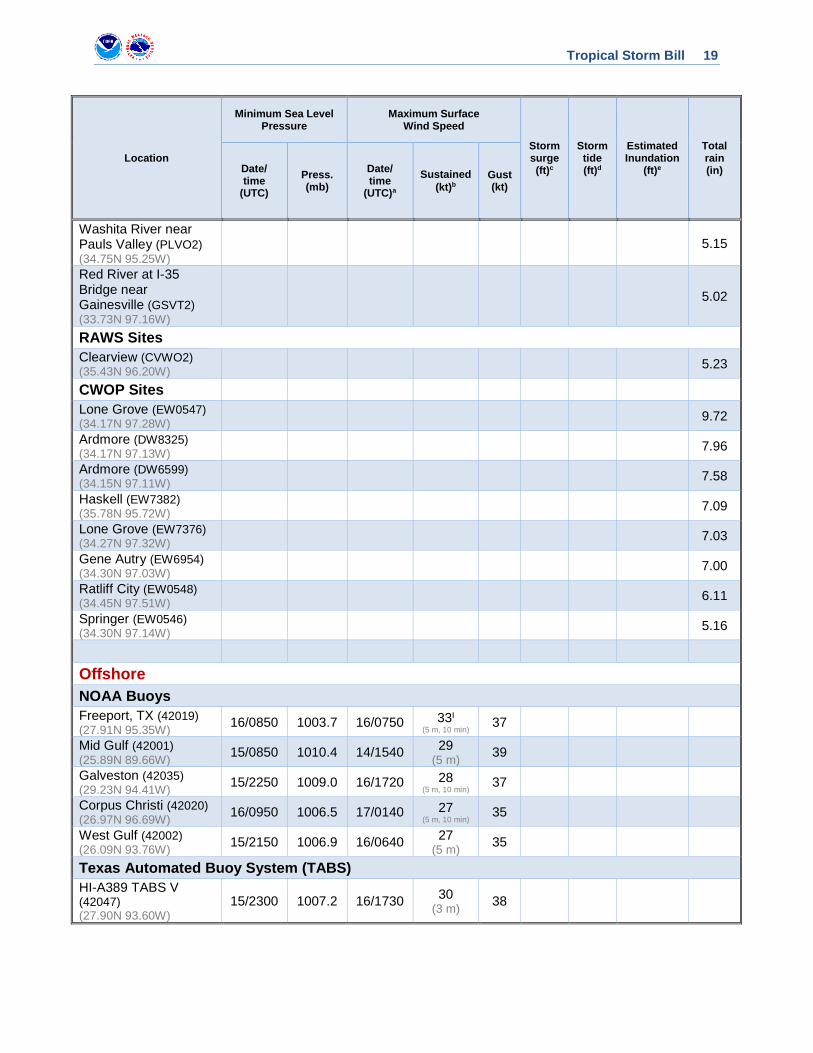
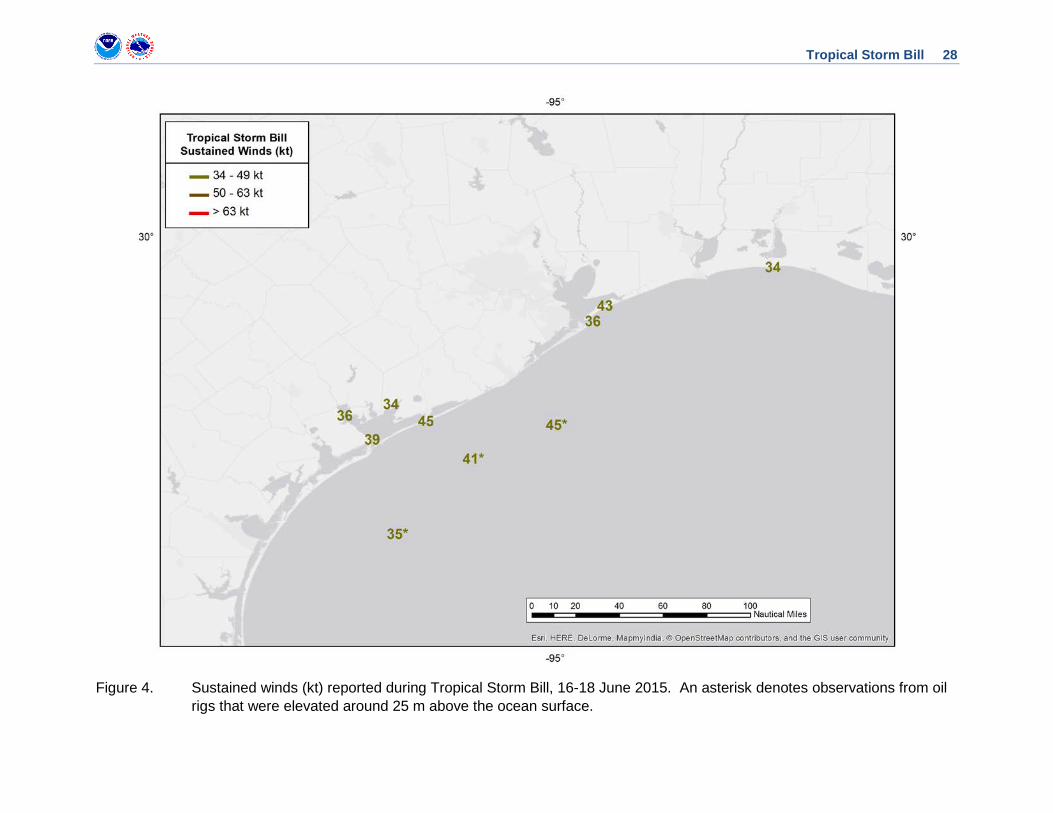
Selected surface observations from land stations, data buoys, and offshore oil platforms are given in Table 2. Sustained tropical-storm-force winds were limited to coastal areas between the landfall location on Matagorda Island, Texas, and extreme southwestern Louisiana. The highest sustained winds measured on land were 45 kt from a Weatherflow station located on the barrier island across from Matagorda, Texas, at 2322 UTC 16 June, and 43 kt from another Weatherflow station located at Crab Lake on the Bolivar Peninsula at 1739 UTC. These stations also had the highest measured wind gusts of 52 kt and 54 kt, respectively. Figures 4 and 5 show sustained winds and wind gusts of at least tropical storm force associated with Bill.
The only ship that provided reliable wind and pressure data was the Maersk Memphis (WMMK), which reported sustained winds of 36 kt at 1800 UTC 16 June and 35 kt at 2300 UTC.

Tropical Storm Bill 4
Storm Surge2 The highest measured storm surge was 3.50 ft at a Texas Coastal Ocean Observing Network (TCOON) gauge in Port Lavaca. A storm surge of 3.42 ft was measured by a TCOON gauge at the Galveston Bay entrance, while National Ocean Service (NOS) gauges measured 3.22 ft and 3.04 ft at Eagle Point and United States Coast Guard (USCG) Freeport, respectively. Storm surge occurred as far north as southwestern Louisiana, where 2.79 ft was measured by an NOS gauge at the Freshwater Canal Locks.
Bill produced moderate storm surge flooding along portions of the Texas coast north of its landfall. Combined with the normal tide, Bill’s surge produced inundation of 1 to 3 ft above ground level for parts of the Texas and southwestern Louisiana coasts. The TCOON gauge at Port Lavaca measured a storm tide of 3.7 ft above Mean Higher High Water (MHHW), suggesting that localized inundation of up to 4 ft may have occurred along parts of Matagorda Bay and Lavaca Bay just north of Bill’s landfall. Elsewhere, measurements around 3.0 ft above MHHW were reported at the entrance to Galveston Bay, Eagle Point, and USCG Freeport. Figure 6 shows inundation estimates along the Texas and Louisiana coasts in terms of storm tide above MHHW.
Rainfall and Flooding Bill produced a swath of heavy rainfall extending from the central Texas coast northward across eastern Texas, western Louisiana, and southern and eastern Oklahoma. Many locations reported storm-total amounts in excess of 10 inches. The highest rainfall report available from the storm was 13.78 inches in Ganado, Texas, located north of Port Lavaca in Jackson County. A report of 13.50 inches was also received near El Campo, Texas, not too far to the northeast of Ganado. In Oklahoma, the highest rainfall report received was 9.72 inches in Lone Grove in the southern part of the state just west of Ardmore. The maximum reported rainfall in western Louisiana was 7.88 inches at Bayou Toro. Figure 7 shows daily rainfall amounts from 1200 UTC 16 June through 1200 UTC 19 June.
The heavy rainfall from Bill caused flash flooding and major river flooding across portions of Texas and Oklahoma. In many areas, the flooding was exacerbated by already-saturated grounds resulting from heavy rainfall and flooding which had occurred in May. The Red River at Interstate 35 along the Texas/Oklahoma border reached a record crest of 42.05 ft, 17 ft above flood stage and about 2 ft above the previous record crest set in 1987. West Mustang Creek near Ganado, Texas, reached a record crest of 27.45 ft, which was over 7 ft above flood stage.
2 Several terms are used to describe water levels due to a storm. Storm surge is defined as the abnormal rise of water generated by a storm, over and above the predicted astronomical tide, and is expressed in terms of height above normal tide levels. Because storm surge represents the deviation from normal water levels, it is not referenced to a vertical datum. Storm tide is defined as the water level due to the combination of storm surge and the astronomical tide, and is expressed in terms of height above a vertical datum, i.e. the North American Vertical Datum of 1988 (NAVD88) or Mean Lower Low Water (MLLW). Inundation is the total water level that occurs on normally dry ground as a result of the storm tide, and is expressed in terms of height above ground level. At the coast, normally dry land is roughly defined as areas higher than the normal high tide line, or Mean Higher High Water (MHHW).

Tropical Storm Bill 5
The Lavaca River near Edna, Texas, reached 29.72 ft, its fourth-highest crest and more than 8 ft above flood stage. Farther north, the Washita River near Dickson, Oklahoma, reached a record crest of 48.70 ft, which was more than 21 ft above flood stage. Flash flooding was reported in the Austin and San Antonio metro areas.
Tornadoes Bill produced four tornadoes while it was a tropical cyclone. On 17 June, an EF-0 (on the Enhanced Fujita Scale) tornado occurred near Haworth in extreme southeastern Oklahoma, damaging or destroying ten chicken houses. That same day, another tornado of unknown intensity touched down near Ben Bolt in southern Texas, causing some tree damage and moving a propane tank from one property to another. In the early morning of 18 June, two EF-1 tornadoes touched down in De Soto Parish in northwestern Louisiana near Mansfield and Keachi.
After Bill became post-tropical, numerous tornadoes occurred in southern Illinois and southern Indiana on 19 June. A few others touched down in Ohio, Maryland, and northern Virginia on 20 June.
CASUALTY AND DAMAGE STATISTICS By far, Bill’s most significant impacts resulted from heavy rainfall. Bill caused two direct deaths3 as a result of heavy rain and flooding in Oklahoma during its tropical depression stage. An 80-year-old woman died near Macomb in Pottawatomie County after she reportedly ignored barricades and drove through a flooded roadway. A 2-year-old boy drowned in Ardmore, Oklahoma, after he was swept from his father’s arms while the two were trying to escape floodwaters. Flooding caused by Bill in Texas and Oklahoma was exacerbated by record rainfall and widespread flooding that occurred in the two states in late May. Numerous roads were closed due to flooding, and high water rescues were conducted in cities such as San Antonio and Alice, Texas. A rockslide in the Arbuckle Mountains near Turner Falls, Oklahoma, forced the closure of Interstate 35, the major route between Dallas/Ft. Worth and Oklahoma City. The interstate was also closed near Ardmore, Oklahoma, due to high water. Closed roads snarled traffic in the Houston and Dallas metro areas, and about 500 flights were canceled at both cities’ airports.
Some coastal flooding occurred along portions of the Texas coast due to storm surge, but there was little to no significant damage. On Matagorda Bay, the pier in Port Lavaca suffered moderate damage, and residents in Indianola were cut off from their homes due to the
3 Deaths occurring as a direct result of the forces of the tropical cyclone are referred to as “direct” deaths. These would include those persons who drowned in storm surge, rough seas, rip currents, and freshwater floods. Direct deaths also include casualties resulting from lightning and wind-related events (e.g., collapsing structures). Deaths occurring from such factors as heart attacks, house fires, electrocutions from downed power lines, vehicle accidents on wet roads, etc., are considered indirect” deaths.

Tropical Storm Bill 6
rising water. Farther north, the road from Sargeant to the beach was flooded and closed, and rising water surrounded homes in the city of Matagorda. In Galveston County, minor coastal flooding occurred on the Bolivar Peninsula with some debris removal required off of State Highway 87. A few homes had minor damage in their downstairs garage areas, and surf caused beach erosion on Galveston beaches.
No major wind damage was reported from Bill. In Lavaca County, Texas, powerlines were blown down in several locations in the county, and a roof was blown off a barn. Most damage was limited to limbs breaking off trees across southeastern Texas.
The majority of the damage caused by Bill resulted from freshwater and storm surge flooding, but an insured loss total from the National Flood Insurance Program is not available at this time.
Moisture associated with Bill’s precursor disturbance and Hurricane Carlos over the eastern North Pacific Ocean produced heavy rains, flooding, and landslides over portions of Central America and the Yucatan Peninsula of Mexico. In Honduras, two people died in floodwaters near Tegucigalpa, while two other people were reported missing. The Permanent Contingency Commission of Honduras (COPECO) reported that more than 500 people were affected by floods and landslides in Honduras. Two people died in a landslides in Guatemala, and the National Coordination for Disaster Reduction (CONRED) reported that 516,000 people across the country were affected by flooding and landslides. Flooding and damage to trees and vehicles occurred in Cancun, Mexico, with about 13 inches of rain occurring in the city over a 48-h period.
FORECAST AND WARNING CRITIQUE
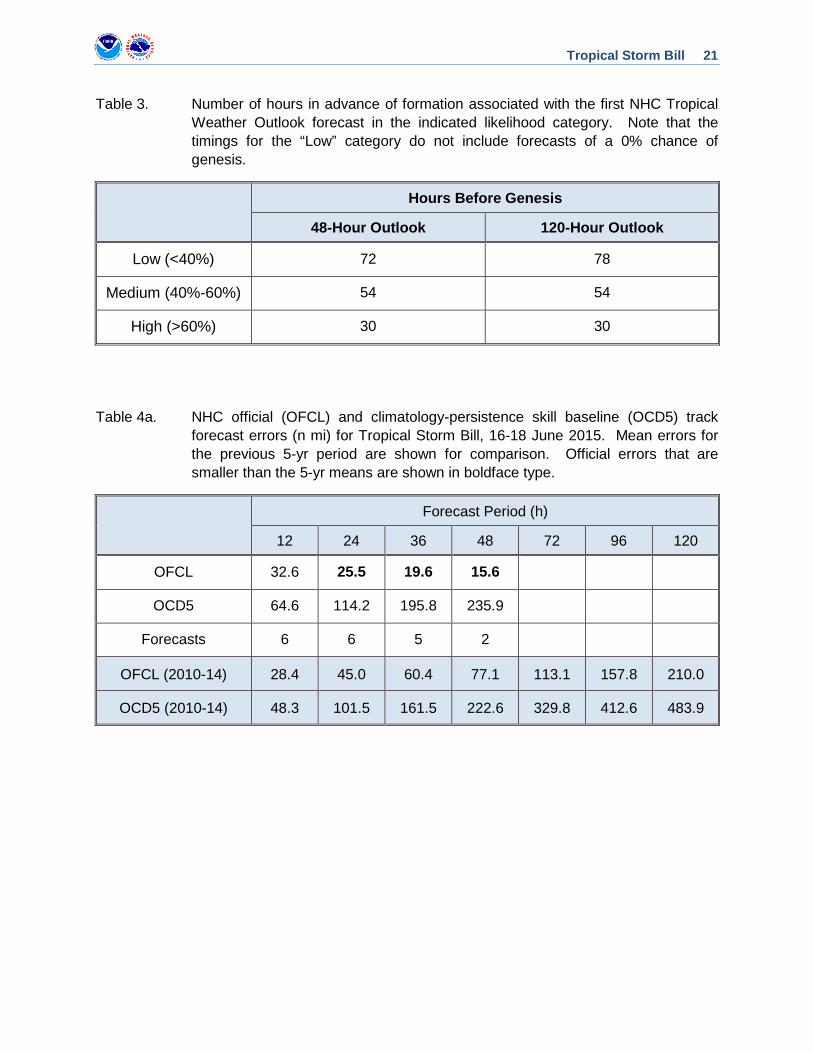
Bill’s genesis was well forecast in the short term, but not particularly well forecast in NHC’s five-day Tropical Weather Outlook (TWO). The possibility of formation was first noted in the TWO 78 h before genesis occurred, when the incipient disturbance was located over the northwestern Caribbean Sea and the Yucatan Peninsula. Soon thereafter, the disturbance was given a low (<40%) chance of genesis over the next two days 72 h before formation. The two-day probability was raised to a medium (40-60%) chance 54 h before genesis and to a high (>60%) chance 30 h before genesis. Table 3 provides the number of hours in advance of formation associated with the first NHC TWO forecast in each likelihood category.
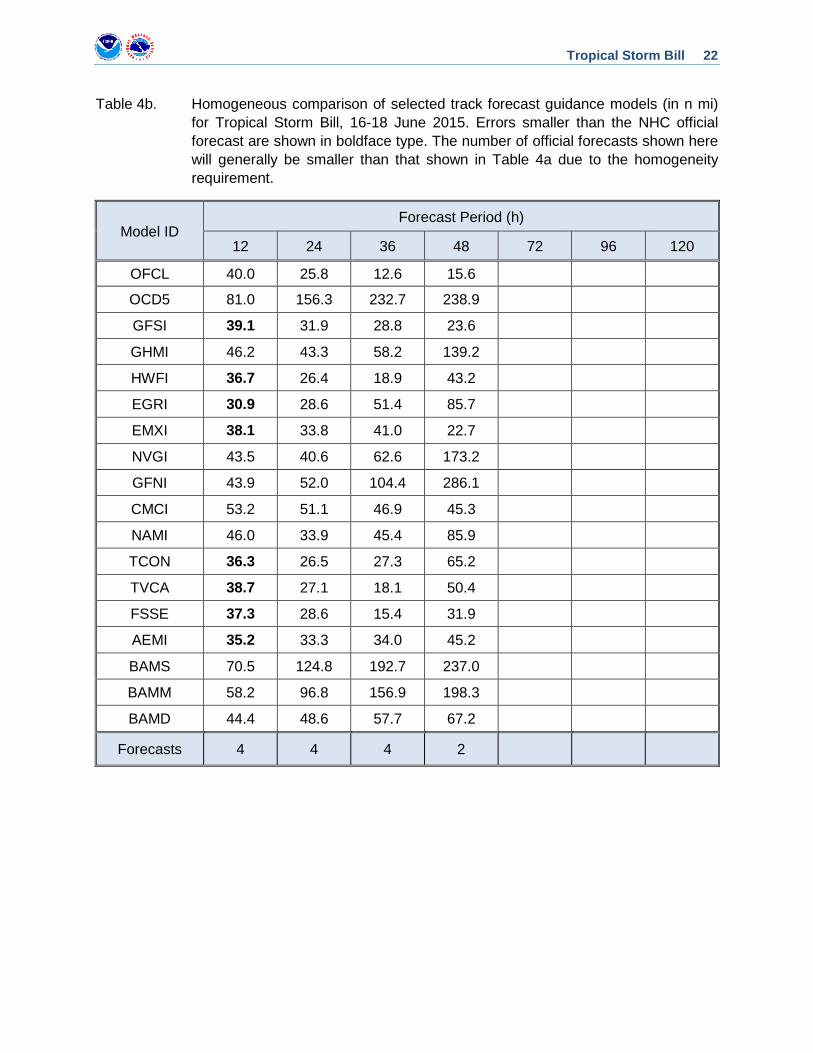
A verification of NHC official track forecasts for Bill is given in Table 4a. Since Bill moved inland and weakened within a day of its formation, NHC did not make many forecasts for the cyclone. Still, official forecast track errors were lower than the mean official errors for the previous 5-yr period between 24 and 48 h. A homogeneous comparison of the official track errors with selected guidance models is given in Table 4b. The official forecasts had lower errors than all of the track models between 24 and 48 h.
A verification of NHC official intensity forecasts for Bill is given in Table 5a. Official forecast intensity errors were lower than the mean official errors for the previous 5-yr period at all forecast times. A homogeneous comparison of the official intensity errors with selected

Tropical Storm Bill 7
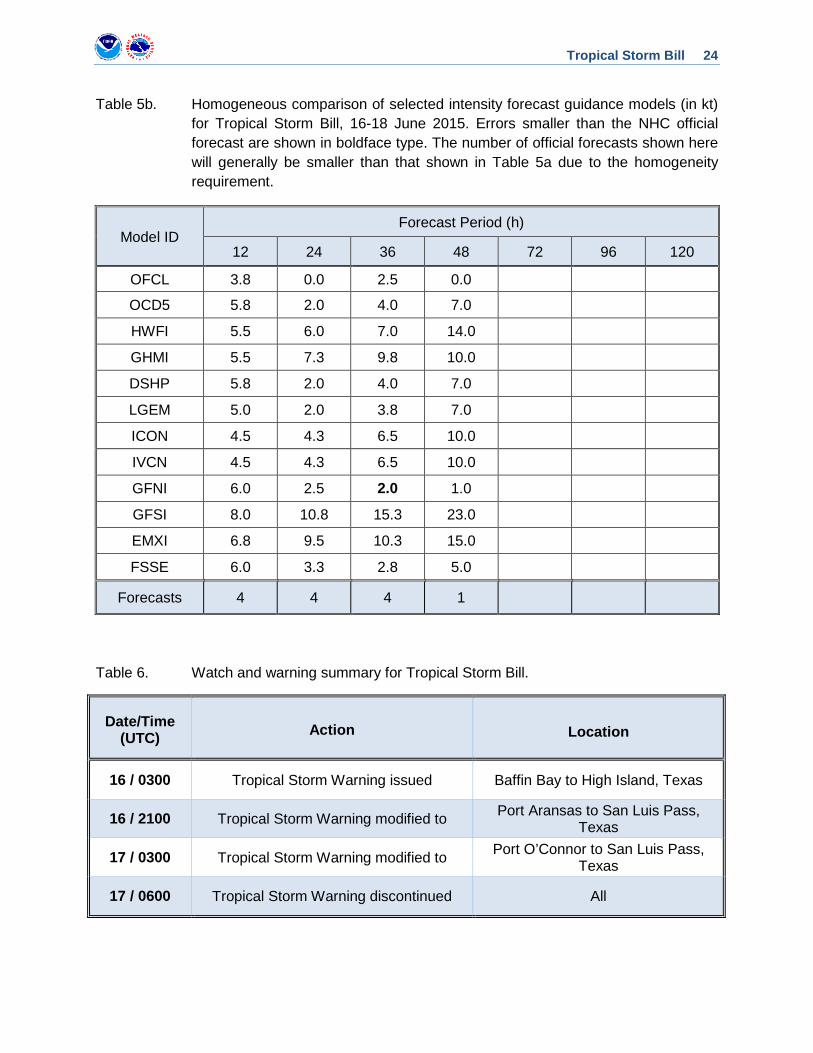
guidance models is given in Table 5b. With one minor exception (GFNI at 36 h), the official forecasts had lower errors than all of the intensity models at all forecast times.
Tropical storm warnings associated with Bill are given in Table 6. Because Bill formed so close to land, tropical-storm-force winds first reached the coast within about 12 h of the issuance of the initial tropical storm warning. The NHC’s Tropical Weather Outlook did, however, state that tropical storm conditions were possible along portions of the middle and upper Texas coasts and the western Louisiana coast about 36 h before tropical-storm-force winds first reached the coast.
NHC issued a storm surge forecast of 2 to 4 ft above ground level along the upper Texas coast and 1 to 2 ft above ground level along the western Louisiana coast with the first advisory at 0300 UTC 16 June. These forecasts verified well, with a maximum of 3.7 ft above MHHW observed along the Texas coast at Port Lavaca, and a maximum of 2.1 ft above MHHW observed in Louisiana at the Freshwater Canal Locks.
ACKNOWLEDGMENTS National Weather Service Forecast Offices (WFOs) in Corpus Christi, TX; Houston/Galveston, TX; and Austin/San Antonio, TX, Dallas/Ft. Worth, TX; Norman, OK; and Tulsa, OK; as well as the Weather Prediction Center, National Data Buoy Center, and the National Ocean Service Center for Operational Oceanographic Products and Services, provided extensive post-storm reports that were included as observations in Table 2. Data were also provided by Weatherflow and the Texas Tech University Hurricane Research Team (TTUHRT).

Tropical Storm Bill 8
Table 1. Best track for Tropical Storm Bill, 16-18 June 2015.
Date/Time (UTC)
Latitude (°N)
Longitude (°W)
Pressure (mb)
Wind Speed (kt) Stage
16 / 0000 27.0 94.3 1005 45 tropical storm
16 / 0600 27.6 95.2 1001 45 "
16 / 1200 28.0 96.0 997 50 "
16 / 1645 28.2 96.7 997 50 "
16 / 1800 28.2 96.7 997 50 "
17 / 0000 29.1 96.9 998 40 "
17 / 0600 30.3 97.1 999 30 tropical depression
17 / 1200 31.7 97.4 999 30 "
17 / 1800 32.6 97.5 999 25 "
18 / 0000 33.5 97.3 1000 25 "
18 / 0600 34.2 96.9 1002 25 "
18 / 1200 34.8 96.3 1003 20 "
18 / 1800 35.2 95.5 1004 15 low
19 / 0000 35.6 94.5 1005 15 "
19 / 0600 35.9 93.5 1006 15 "
19 / 1200 36.3 92.3 1006 15 "
19 / 1800 36.9 90.9 1005 20 "
20 / 0000 37.4 89.4 1004 20 "
20 / 0600 37.8 87.8 1002 15 "
20 / 1200 38.2 85.8 1001 15 "
20 / 1800 38.5 83.7 1003 15 "
21 / 0000 38.9 81.3 1006 15 "
21 / 0600 dissipated
16 / 1200 28.0 96.0 997 50 maximum winds and minimum pressure
16 / 1645 28.2 96.7 997 50 landfall on
Matagorda Island, Texas

Tropical Storm Bill 9
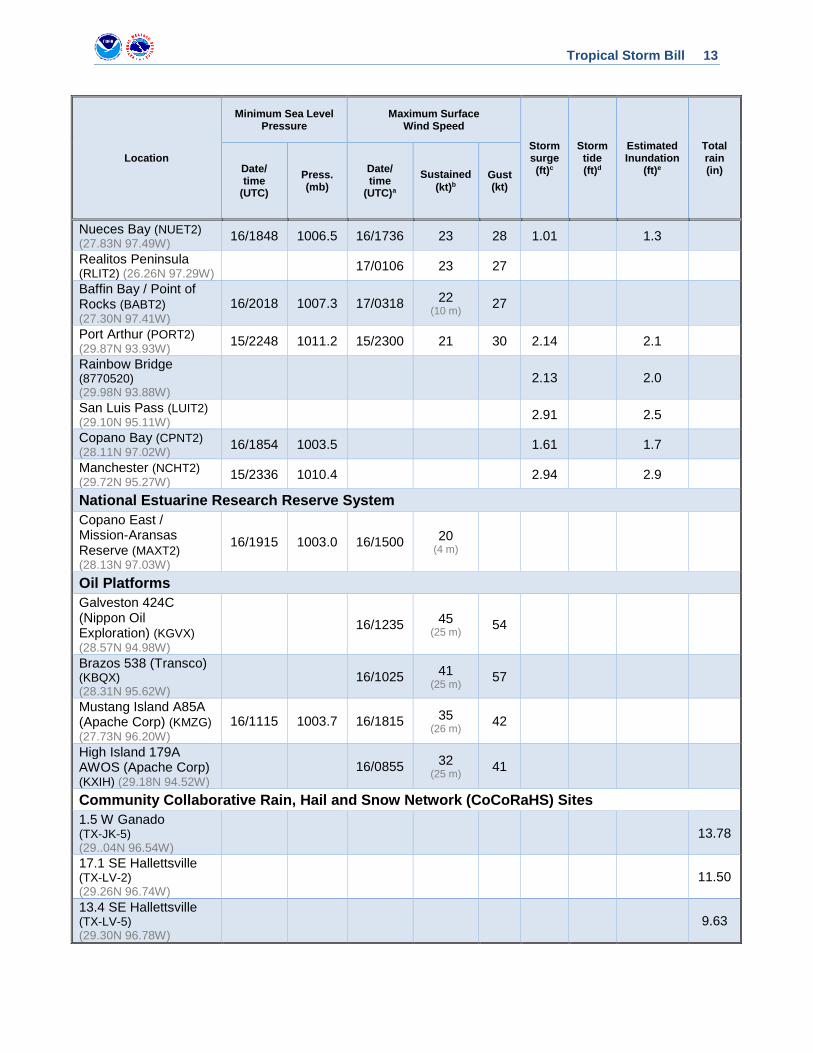
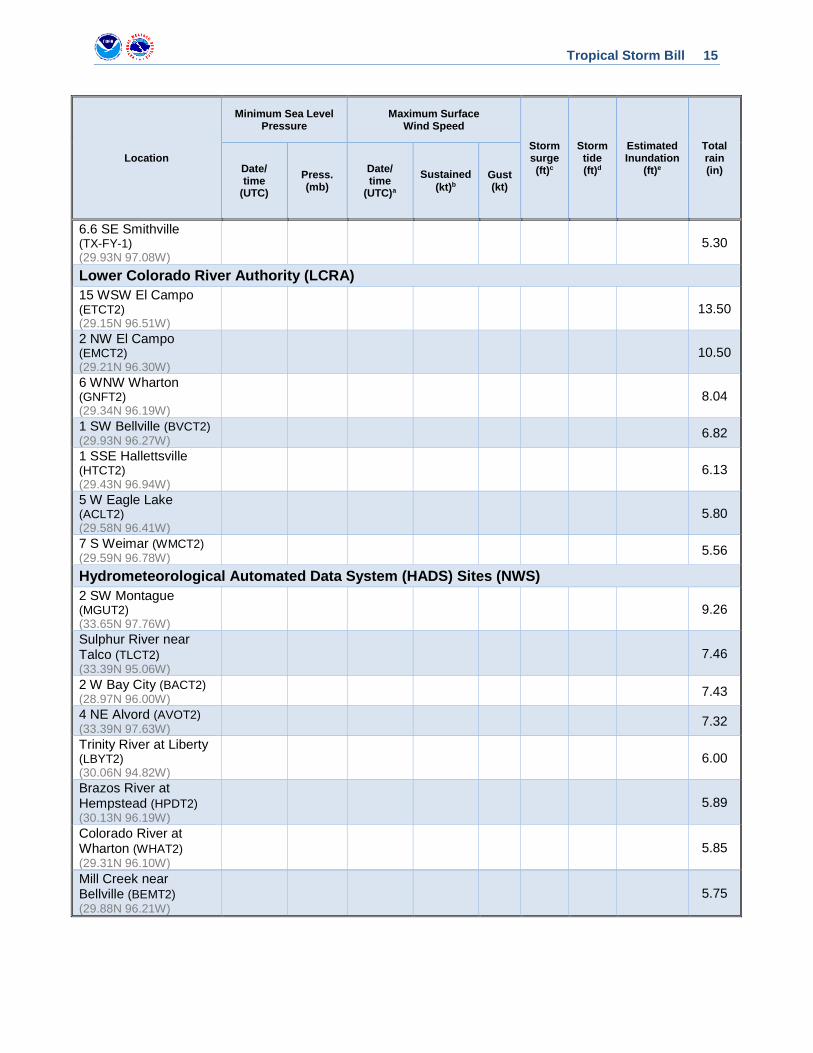
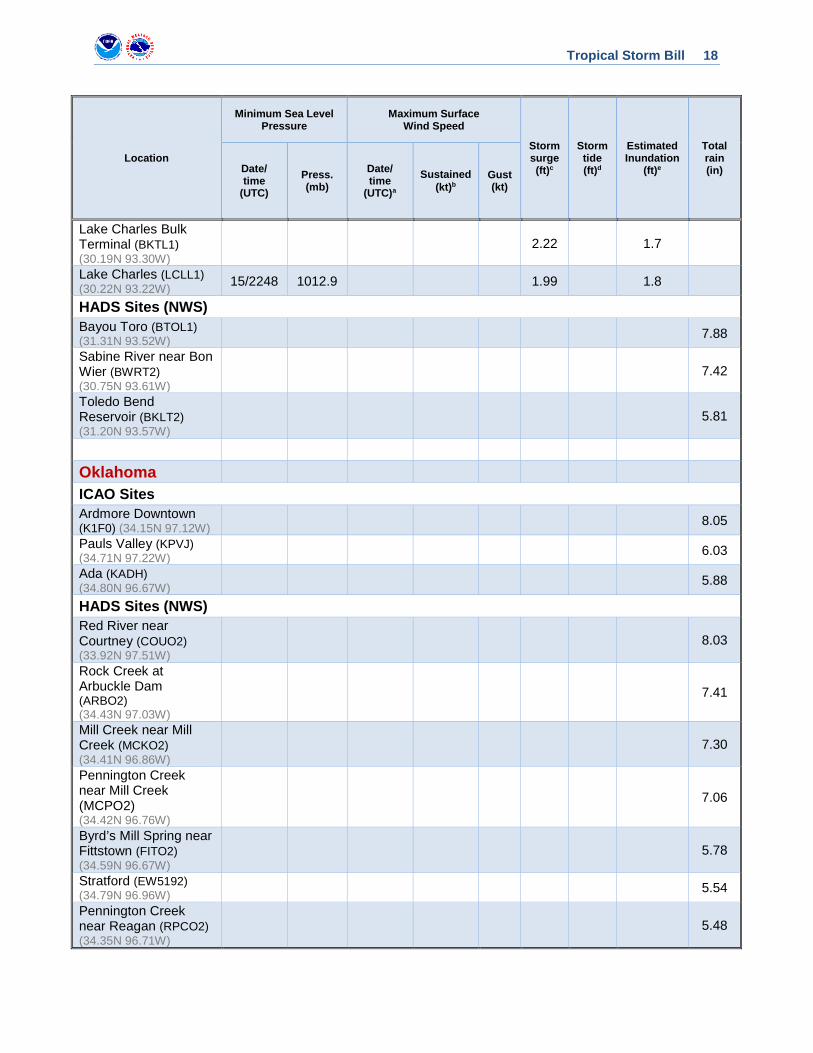
Table 2. Selected surface observations for Tropical Storm Bill, 16-18 June 2015.
Location
Minimum Sea Level Pressure
Maximum Surface Wind Speed
Storm surge (ft)c
Storm tide (ft)d
Estimated Inundation
(ft)e
Total rain (in) Date/
time (UTC)
Press. (mb)
Date/ time
(UTC)a
Sustained (kt)b
Gust (kt)
Texas International Civil Aviation Organization (ICAO) Sites Palacios (KPSX) (28.72N 96.25W) 16/2253 1004.1 16/2251 34 50 2.05
Rockport / Aransas County Airport (KRKP) (28.09N 97.04W)
16/1938 1003.0 16/1449 31 39 4.40
Angleton / Brazoria County Airport (KLBX) (29.12N 95.47W)
16/1053 1009.3 16/2027 28 40 1.69
Galveston (KGLS) (29.27N 94.87W) 15/2352 1009.9 17/0152 27 40 1.66
Wharton (KARM) (29.25N 96.15W) 17/0055 1005.8 16/2355 27 37 6.26
Port Lavaca / Calhoun County Airport (KPKV) (28.65N 96.68W)
16/2304 1001.7 16/1750 26 37 2.59
Eagle Lake (KELA) (29.60N 96.32W) 17/0115 1005.4 17/0115 25 41 4.06
Victoria (KVCT) (28.85N 96.92W) 16/2304 999.3 16/2152 25 34 4.65
Naval Air Station Corpus Christi (KNGP) (27.69N 97.29W)
16/1927 1006.1 16/1722 25 30 4.62
Corpus Christi (KCRP) (27.77N 97.50W) 16/2253 1006.8 16/1937 24 31 0.67
Bay City (KBYY) (28.97N 95.86W) 16/2315 1007.1 16/2315 23 35 2.53
Houston Executive Airport (KTME) (29.81N 95.90W)
17/0115 1009.5 17/0315 23 34
Port Aransas / Mustang Beach Airport (KRAS) (27.81N 97.09W)
16/1915 1005.4 16/1455 23 33 2.60
Houston / Pearland – Clover Field (KLVJ) (29.52N 95.24W)
15/2353 1010.5 16/2028 22 38 3.41
Brenham (K11R) (30.21N 96.37W) 17/0355 1007.5 17/0355 22 32 0.42
Gonzalez (KT20) (29.52N 97.46W) 17/0255 1004.4 17/0335 21 30 0.16
Austin / Bergstrom International Airport (KAUS) (30.18N 97.68W)
17/0553 1006.1 17/0408 21 28 0.81

Tropical Storm Bill 10
Location
Minimum Sea Level Pressure
Maximum Surface Wind Speed
Storm surge (ft)c
Storm tide (ft)d
Estimated Inundation
(ft)e
Total rain (in) Date/
time (UTC)
Press. (mb)
Date/ time
(UTC)a
Sustained (kt)b
Gust (kt)
Giddings / Lee County Airport (KGYB) (30.16N 96.98W)
17/0355 1006.1 17/0355 20 26 1.40
Houston Hobby Airport (KHOU) (29.65N 95.28W)
15/2353 1010.8 17/1415 19 31 2.09
La Grange / Fayette Regional Airport (K3T5) (29.90N 96.95W)
17/0355 1000.7 17/0215 19 31 3.10
Houston Ellington Field (KEFD) (29.62N 95.17W)
16/2250 1011.5 17/1230 19 26
Naval Air Station Kingsville (KNQI) (27.51N 97.81W)
17/0044 1007.1 16/1937 19 24 1.59
Houston / Bush Intercontinental Airport (KIAH) (29.97N 95.35W)
15/2353 1011.1 17/0353 18 29 3.30
College Station (KCLL) (30.58N 96.37W) 17/1053 1009.9 17/1018 18 29 1.09
Houston / D.W. Hooks Airport (KDWH) (30.07N 95.55W)
17/0153 1010.8 17/1335 18 27 2.11
Bryan (KCFD) (30.71N 96.33W) 17/0915 1009.1 17/0915 17 27 2.24
Caldwell (KRWV) (30.52N 96.70W) 17/0930 1009.4 17/0930 16 27 0.55
Houston Southwest Airport (KAXH) (29.51N 95.48W)
16/2255 1010.5 17/0055 15 27 1.78
Alice (KALI) (27.74N 98.02W) 9.06
Bowie (K0F2) (33.60N 97.78W) 6.86
Orange Grove Naval Auxiliary Landing Field (KNOG) (27.89N 98.04W)
5.46
Weatherflow Matagorda (XMGB) (28.59N 95.98W) 16/2322 45
(6 m, 1 min) 52
Bolivar Peninsula / Crab Lake (XCRB) (29.47N 94.62W)
16/1739 43 (20 m, 1 min) 54
Surfside Beach (XSRF) (28.93N 95.29W) 16/2249 32
(8 m, 5 min) 42
Kemah (XGAL) (29.54N 94.91W) 16/2101 30
(5 m, 1 min) 34

Tropical Storm Bill 11
Location
Minimum Sea Level Pressure
Maximum Surface Wind Speed
Storm surge (ft)c
Storm tide (ft)d
Estimated Inundation
(ft)e
Total rain (in) Date/
time (UTC)
Press. (mb)
Date/ time
(UTC)a
Sustained (kt)b
Gust (kt)
Seabrook (XSBK) (29.56N 95.02W) 16/1330 27
(9 m, 5 min) 36
La Marque (XTEX) (29.37N 94.95W) 15/2104 27
(20 m, 1 min) 34
Texas City (KLEV) (29.42N 94.89W) 16/1210 27
(8 m, 5 min) 33
Corpus Christi / Poenisch Park (XPOE) (27.72N 97.34W)
16/1645 24 (5 m, 5 min) 29
South Padre Island (XPAD) (26.08N 97.17W) 17/0315 23
(12 m, 5 min) 27
Corpus Christi (XCRP) (27.60N 97.30W) 16/1709 21
(10 m, 1 min) 26
South Padre Island (XSPP) (26.16N 97.18W) 17/0055 20
(5 m, 5 min) 26
Portland / Wildcat (XWLD) (27.87N 97.32W)
17/0845 20 (5 m, 5 min) 29
Corpus Christi / Laguna Shores (XLAG) (27.64N 97.29W)
16/0239 19 (10 m, 5 min) 24
Texas Tech University Hurricane Research Team (TTUHRT) Bay City (TT0221A) (28.73N 95.95W) 16/2301 30
(2 m) 41
Palacios (TT0222A) (28.72N 96.24W) 16/2321 28
(2 m) 39
Freeport (TT0215A) (29.06N 95.13W) 16/2209 28
(2 m) 33
Bay City (TT0218A) (28.82N 95.66W) 16/2312 26
(2 m) 34
Quintana (TT0220A) (28.91N 95.34W) 16/1400 25
(2 m) 33
Freeport (TT0216A) (29.00N 95.22W) 16/2207 25
(2 m) 33
Danbury (TT0214A) (29.16N 95.26W) 16/2206 25
(2 m) 32
Brazoria (TT0217A) (28.92N 95.56W) 16/2303 24
(2 m) 32
Port Lavaca (TT0224A) (28.73N 96.55W) 16/2250 24
(2 m) 31
Angleton (TT0213A) (29.12N 95.40W) 16/1934 20
(2 m) 28
Coastal-Marine Automated Network (C-MAN) Sites Port Aransas (PTAT2) (27.82N 97.05W) 16/1900 1005.8 17/1750 29
(15 m) 48
Sabine Pass (SRST2) (29.68N 94.03W) 15/2300 1111.6 16/2040 23
(9 m) 38

Tropical Storm Bill 12
Location
Minimum Sea Level Pressure
Maximum Surface Wind Speed
Storm surge (ft)c
Storm tide (ft)d
Estimated Inundation
(ft)e
Total rain (in) Date/
time (UTC)
Press. (mb)
Date/ time
(UTC)a
Sustained (kt)b
Gust (kt)
National Ocean Service (NOS) Sites Galveston Bay (North Jetty) (GNJT2) (29.35N 94.72W)
15/2306 1008.3 16/1142 35 (10 m) 44
USCG Freeport (FCGT2) (28.94N 95.30W)
16/0954 1009.1 16/2254 32 (10 m) 39 3.04 2.9
Rockport (RCPT2) (28.02N 97.05W) 16/1900 1003.3 17/1806 29
(6 m) 39 2.05 3.31 2.0
Sabine Pass North (SBPT2) (29.73N 93.87W)
15/2248 1011.0 15/2230 29 (6 m) 2.63 2.2
Eagle Point (EPTT2) (29.48N 94.92W) 15/2330 1010.0 17/2200 28
(10 m) 34 3.22 3.0
Bob Hall Pier / Corpus Christi (MQTT2) (27.58N 97.22W)
16/1906 1006.7 17/1942 26 (8 m) 31 2.05 3.23 2.0
Morgans Point (MGPT2) (29.68N 94.98W)
15/2330 1010.4 15/2212 24 (10 m) 31 2.89 4.10 2.9
Port Isabel (PTIT2) (26.06N 97.22W) 16/0012 1008.4 17/0054 22
(8 m) 28 1.34 1.55 1.0
Galveston Pier 21 (GTOT2) (29.31N 94.79W)
15/2242 1010.5 2.87 3.75 2.5
Texas Coastal Ocean Observing Network (TCOON) Matagorda Bay / Port O’Connor (PCNT2) (28.45N 96.40W)
16/1554 39 (9 m) 48 2.34 2.3
Galveston Bay Entrance, North Jetty (8771341) (29.36N 94.72W)
15/2236 1008.3 16/1212 36 (12 m) 45 3.42 3.0
Port Lavaca (VCAT2) (28.64N 96.61W) 16/2212 1000.3 16/1530 36 44 3.50 3.7
Rollover Pass (RLOT2) (29.51N 94.51W) 15/2236 1010.1 15/2236 29
(10 m) 38 2.09 2.2
Port Aransas (RTAT2) (27.84N 97.07W) 16/1806 1004.9 16/1900 26 31 1.75 1.7
Lynchburg Landing (LYBT2) (29.76N 95.08W)
15/2318 1009.8 16/2124 25 (10 m) 32 3.00 2.9
Packery Channel (PACT2) (27.63N 97.24W)
16/1936 1006.5 16/1648 25 (11 m) 30 1.48 1.5
High Island (HIST2) (29.59N 94.39W) 15/2300 1010.6 15/2154 23
(10 m) 30 2.28 2.0
Tropical Storm Bill 13
Location
Minimum Sea Level Pressure
Maximum Surface Wind Speed
Storm surge (ft)c
Storm tide (ft)d
Estimated Inundation
(ft)e
Total rain (in) Date/
time (UTC)
Press. (mb)
Date/ time
(UTC)a
Sustained (kt)b
Gust (kt)
Nueces Bay (NUET2) (27.83N 97.49W) 16/1848 1006.5 16/1736 23 28 1.01 1.3
Realitos Peninsula (RLIT2) (26.26N 97.29W) 17/0106 23 27
Baffin Bay / Point of Rocks (BABT2) (27.30N 97.41W)
16/2018 1007.3 17/0318 22 (10 m) 27
Port Arthur (PORT2) (29.87N 93.93W) 15/2248 1011.2 15/2300 21 30 2.14 2.1
Rainbow Bridge (8770520) (29.98N 93.88W)
2.13 2.0
San Luis Pass (LUIT2) (29.10N 95.11W) 2.91 2.5
Copano Bay (CPNT2) (28.11N 97.02W) 16/1854 1003.5 1.61 1.7
Manchester (NCHT2) (29.72N 95.27W) 15/2336 1010.4 2.94 2.9
National Estuarine Research Reserve System Copano East / Mission-Aransas Reserve (MAXT2) (28.13N 97.03W)
16/1915 1003.0 16/1500 20 (4 m)
Oil Platforms Galveston 424C (Nippon Oil Exploration) (KGVX) (28.57N 94.98W)
16/1235 45 (25 m) 54
Brazos 538 (Transco) (KBQX) (28.31N 95.62W)
16/1025 41 (25 m) 57
Mustang Island A85A (Apache Corp) (KMZG) (27.73N 96.20W)
16/1115 1003.7 16/1815 35 (26 m) 42
High Island 179A AWOS (Apache Corp) (KXIH) (29.18N 94.52W)
16/0855 32 (25 m) 41
Community Collaborative Rain, Hail and Snow Network (CoCoRaHS) Sites 1.5 W Ganado (TX-JK-5) (29..04N 96.54W)
13.78
17.1 SE Hallettsville (TX-LV-2) (29.26N 96.74W)
11.50
13.4 SE Hallettsville (TX-LV-5) (29.30N 96.78W)
9.63

Tropical Storm Bill 14
Location
Minimum Sea Level Pressure
Maximum Surface Wind Speed
Storm surge (ft)c
Storm tide (ft)d
Estimated Inundation
(ft)e
Total rain (in) Date/
time (UTC)
Press. (mb)
Date/ time
(UTC)a
Sustained (kt)b
Gust (kt)
4.7 WSW Manor (TX-TV-221) (30.27N 97.75W)
9.35
9.7 ESE Victoria (TX-VC-20) (28.76N 96.83W)
9.23
0.3 NNW Sealy (TX-AS-5) (29.77N 96.15W)
9.17
4.9 E Hallettsville (TX-LV-25) (29.44N 96.86W)
8.76
1.1 SSE Inez (TX-VC-37) (28.86N 96.78W)
8.06
4.2 ESE Austin (TX-TV-201) (30.28N 97.69W)
8.05
2.6 ENE Austin (TX-TV-241) (30.31N 97.71W)
7.97
1.6 SSE Hallettsville (TX-LV-23) (29.42N 96.93W)
7.26
1.6 WNW Selma (TX-BXR-297) (29.60N 98.37W)
6.94
2.0 ESE Hallettsville (TX-LV-29) (29.43N 96.91W)
6.92
1 WNW San Felipe (TX-AS-6) (29.79N 96.11W)
6.84
3.4 SW Pipe Creek (TX-BND-38) (29.68N 98.97W)
6.15
1.2 SE Hill Country Village (TX-BXR-11) (29.57N 98.48W)
6.10
3.9 WNW Selma (TX-BXR-221) (29.60N 98.38W)
5.97
4.6 ESE Hollywood Park (TX-BXR-281) (29.57N 98.41W)
5.70
7 S New Ulm (TX-CLR-6) (29.78N 96.49W)
5.44
Tropical Storm Bill 15
Location
Minimum Sea Level Pressure
Maximum Surface Wind Speed
Storm surge (ft)c
Storm tide (ft)d
Estimated Inundation
(ft)e
Total rain (in) Date/
time (UTC)
Press. (mb)
Date/ time
(UTC)a
Sustained (kt)b
Gust (kt)
6.6 SE Smithville (TX-FY-1) (29.93N 97.08W)
5.30
Lower Colorado River Authority (LCRA) 15 WSW El Campo (ETCT2) (29.15N 96.51W)
13.50
2 NW El Campo (EMCT2) (29.21N 96.30W)
10.50
6 WNW Wharton (GNFT2) (29.34N 96.19W)
8.04
1 SW Bellville (BVCT2) (29.93N 96.27W) 6.82
1 SSE Hallettsville (HTCT2) (29.43N 96.94W)
6.13
5 W Eagle Lake (ACLT2) (29.58N 96.41W)
5.80
7 S Weimar (WMCT2) (29.59N 96.78W) 5.56
Hydrometeorological Automated Data System (HADS) Sites (NWS) 2 SW Montague (MGUT2) (33.65N 97.76W)
9.26
Sulphur River near Talco (TLCT2) (33.39N 95.06W)
7.46
2 W Bay City (BACT2) (28.97N 96.00W) 7.43
4 NE Alvord (AVOT2) (33.39N 97.63W) 7.32
Trinity River at Liberty (LBYT2) (30.06N 94.82W)
6.00
Brazos River at Hempstead (HPDT2) (30.13N 96.19W)
5.89
Colorado River at Wharton (WHAT2) (29.31N 96.10W)
5.85
Mill Creek near Bellville (BEMT2) (29.88N 96.21W)
5.75

Tropical Storm Bill 16
Location
Minimum Sea Level Pressure
Maximum Surface Wind Speed
Storm surge (ft)c
Storm tide (ft)d
Estimated Inundation
(ft)e
Total rain (in) Date/
time (UTC)
Press. (mb)
Date/ time
(UTC)a
Sustained (kt)b
Gust (kt)
Neches River near Evadale (EVDT2) (30.36N 94.09W)
5.66
Big Sandy Creek (BRPT2) (33.23N 97.69W)
5.43
Pine Island Bayou near Sour Lake (SOLT2) (30.11N 94.33W)
5.42
Village Creek near Kountze (KOUT2) (30.40N 94.26W)
5.25
Bridgeport Reservoir (BPRT2) (33.22N 97.83W)
5.15
Lake Mexia (BSAT2) (31.64N 96.58W) 5.12
Remote Automated Weather Stations (RAWS) Kirbyville (KRBT2) (30.43N 93.88W) 7.95
LBJ Grasslands (LBJT2) (33.28N 97.63W)
6.98
Lufkin (LRWT2) (31.31N 94.83W) 6.83
Citizen Weather Observer Program (CWOP) Montague (AT944) (33.39N 97.77W) 9.66
K5SOI Victoria (AT358) (28.78N 96.83W) 9.01
KE5HAM Edna (AU889) (28.91N 96.63W)
7.83
Navasota (EW4261) (30.29N 96.00W) 7.69
Conroe (EW2089) (30.32N 95.49W) 7.64
La Ward (E6228) (28.84N 96.47W) 7.32
Huntington (DW5861) (31.29N 94.61W) 6.97
8 SE Navasota (E4261) (30.30N 95.99W) 6.73
Decatur (CW0062) (33.326N 97.67W) 6.69

Tropical Storm Bill 17
Location
Minimum Sea Level Pressure
Maximum Surface Wind Speed
Storm surge (ft)c
Storm tide (ft)d
Estimated Inundation
(ft)e
Total rain (in) Date/
time (UTC)
Press. (mb)
Date/ time
(UTC)a
Sustained (kt)b
Gust (kt)
KI5LU Washington (AU881) (30.34N 96.18W)
6.62
K5BV Aransas Pass (AR105) (27.90N 97.14W)
6.61
Vanderbilt (EW4090) (28.82N 96.62W) 6.32
Lolita (EW3902) (28.79N 96.55W) 6.24
WD5M Rhome (AT109) (33.08N 97.42W) 6.23
Azle (EW2026) (32.91N 97.59W) 6.19
Greenwood (CW7364) (33.39N 97.49W) 6.02
Inez (EW5736) (28.90N 96.78W) 5.84
3 SSW Mont Belvieu (E0401) (29.81N 94.90W)
5.82
K5HAS Edna (AU281) (28.94N 96.52W) 5.78
KB5PRZ Austin (AU323) (30.32N 97.72W)
5.59
Cat Spring (EW4739) (29.50N 96.22W) 5.10
Baytown (EW0401) (29.80N 94.91W) 5.08
NWS Cooperative Observer Program (COOP) Sites Madisonville (MSVT2) (30.95N 95.91W) 5.43
Louisiana Weatherflow Cameron (XCAM) (29.78N 93.29W) 16/1935 32
(10 m, 1 min) 45
NOS Sites Calcasieu Pass (CAPL1) (29.77N 93.34W)
15/2330 1010.7 16/1936 34 (12 m) 42 2.45 1.9
Freshwater Canal Locks (FRWL1) (29.56N 92.31W)
15/2318 1012.6 15/2118 22 (17 m) 33 2.79 2.1
Tropical Storm Bill 18
Location
Minimum Sea Level Pressure
Maximum Surface Wind Speed
Storm surge (ft)c
Storm tide (ft)d
Estimated Inundation
(ft)e
Total rain (in) Date/
time (UTC)
Press. (mb)
Date/ time
(UTC)a
Sustained (kt)b
Gust (kt)
Lake Charles Bulk Terminal (BKTL1) (30.19N 93.30W)
2.22 1.7
Lake Charles (LCLL1) (30.22N 93.22W) 15/2248 1012.9 1.99 1.8
HADS Sites (NWS) Bayou Toro (BTOL1) (31.31N 93.52W) 7.88
Sabine River near Bon Wier (BWRT2) (30.75N 93.61W)
7.42
Toledo Bend Reservoir (BKLT2) (31.20N 93.57W)
5.81
Oklahoma
ICAO Sites Ardmore Downtown (K1F0) (34.15N 97.12W) 8.05
Pauls Valley (KPVJ) (34.71N 97.22W) 6.03
Ada (KADH) (34.80N 96.67W) 5.88
HADS Sites (NWS) Red River near Courtney (COUO2) (33.92N 97.51W)
8.03
Rock Creek at Arbuckle Dam (ARBO2) (34.43N 97.03W)
7.41
Mill Creek near Mill Creek (MCKO2) (34.41N 96.86W)
7.30
Pennington Creek near Mill Creek (MCPO2) (34.42N 96.76W)
7.06
Byrd’s Mill Spring near Fittstown (FITO2) (34.59N 96.67W)
5.78
Stratford (EW5192) (34.79N 96.96W) 5.54
Pennington Creek near Reagan (RPCO2) (34.35N 96.71W)
5.48
Tropical Storm Bill 19
Location
Minimum Sea Level Pressure
Maximum Surface Wind Speed
Storm surge (ft)c
Storm tide (ft)d
Estimated Inundation
(ft)e
Total rain (in) Date/
time (UTC)
Press. (mb)
Date/ time
(UTC)a
Sustained (kt)b
Gust (kt)
Washita River near Pauls Valley (PLVO2) (34.75N 95.25W)
5.15
Red River at I-35 Bridge near Gainesville (GSVT2) (33.73N 97.16W)
5.02
RAWS Sites Clearview (CVWO2) (35.43N 96.20W) 5.23
CWOP Sites Lone Grove (EW0547) (34.17N 97.28W) 9.72
Ardmore (DW8325) (34.17N 97.13W) 7.96
Ardmore (DW6599) (34.15N 97.11W) 7.58
Haskell (EW7382) (35.78N 95.72W) 7.09
Lone Grove (EW7376) (34.27N 97.32W) 7.03
Gene Autry (EW6954) (34.30N 97.03W) 7.00
Ratliff City (EW0548) (34.45N 97.51W) 6.11
Springer (EW0546) (34.30N 97.14W) 5.16
Offshore NOAA Buoys Freeport, TX (42019) (27.91N 95.35W) 16/0850 1003.7 16/0750 33I
(5 m, 10 min) 37
Mid Gulf (42001) (25.89N 89.66W) 15/0850 1010.4 14/1540 29
(5 m) 39
Galveston (42035) (29.23N 94.41W) 15/2250 1009.0 16/1720 28
(5 m, 10 min) 37
Corpus Christi (42020) (26.97N 96.69W) 16/0950 1006.5 17/0140 27
(5 m, 10 min) 35
West Gulf (42002) (26.09N 93.76W) 15/2150 1006.9 16/0640 27
(5 m) 35
Texas Automated Buoy System (TABS) HI-A389 TABS V (42047) (27.90N 93.60W)
15/2300 1007.2 16/1730 30 (3 m) 38

Tropical Storm Bill 20
Location
Minimum Sea Level Pressure
Maximum Surface Wind Speed
Storm surge (ft)c
Storm tide (ft)d
Estimated Inundation
(ft)e
Total rain (in) Date/
time (UTC)
Press. (mb)
Date/ time
(UTC)a
Sustained (kt)b
Gust (kt)
GA-252 TABS B (42043) (28.98N 94.90W)
16/0000 1008.9 16/2200 26 (3 m) 36
PI-745 TABS K (42045) (26.22N 96.50W) 16/0830 1008.1 17/0130 21
(3 m) 26
PS-1126 TABS J (42044) (26.19N 97.05W)
16/0030 1008.2 17/0300 19 (3 m) 24
Oil Platforms Auger – Garden Banks 426 (42361) (27.55N 92.44W)
16/0030 1010.5 16/0030 39 (122 m)
a Date/time is for sustained wind when both sustained and gust are listed. b Except as noted, sustained wind averaging periods for C-MAN and land-based reports are 2 min; buoy averaging
periods are 8 min. c Storm surge is water height above normal astronomical tide level. d For most locations, storm tide is water height above the North American Vertical Datum of 1988 (NAVD88). e Estimated inundation is the maximum height of water above ground. For NOS tide gauges, the height of the water
above Mean Higher High Water (MHHW) is used as a proxy for inundation. I Incomplete data
Tropical Storm Bill 21
Table 3. Number of hours in advance of formation associated with the first NHC Tropical Weather Outlook forecast in the indicated likelihood category. Note that the timings for the “Low” category do not include forecasts of a 0% chance of genesis.
Hours Before Genesis
48-Hour Outlook 120-Hour Outlook
Low (<40%) 72 78
Medium (40%-60%) 54 54
High (>60%) 30 30
Table 4a. NHC official (OFCL) and climatology-persistence skill baseline (OCD5) track forecast errors (n mi) for Tropical Storm Bill, 16-18 June 2015. Mean errors for the previous 5-yr period are shown for comparison. Official errors that are smaller than the 5-yr means are shown in boldface type.
Forecast Period (h)
12 24 36 48 72 96 120
OFCL 32.6 25.5 19.6 15.6
OCD5 64.6 114.2 195.8 235.9
Forecasts 6 6 5 2
OFCL (2010-14) 28.4 45.0 60.4 77.1 113.1 157.8 210.0
OCD5 (2010-14) 48.3 101.5 161.5 222.6 329.8 412.6 483.9
Tropical Storm Bill 22
Table 4b. Homogeneous comparison of selected track forecast guidance models (in n mi) for Tropical Storm Bill, 16-18 June 2015. Errors smaller than the NHC official forecast are shown in boldface type. The number of official forecasts shown here will generally be smaller than that shown in Table 4a due to the homogeneity requirement.
Model ID Forecast Period (h)
12 24 36 48 72 96 120
OFCL 40.0 25.8 12.6 15.6
OCD5 81.0 156.3 232.7 238.9
GFSI 39.1 31.9 28.8 23.6
GHMI 46.2 43.3 58.2 139.2
HWFI 36.7 26.4 18.9 43.2
EGRI 30.9 28.6 51.4 85.7
EMXI 38.1 33.8 41.0 22.7
NVGI 43.5 40.6 62.6 173.2
GFNI 43.9 52.0 104.4 286.1
CMCI 53.2 51.1 46.9 45.3
NAMI 46.0 33.9 45.4 85.9
TCON 36.3 26.5 27.3 65.2
TVCA 38.7 27.1 18.1 50.4
FSSE 37.3 28.6 15.4 31.9
AEMI 35.2 33.3 34.0 45.2
BAMS 70.5 124.8 192.7 237.0
BAMM 58.2 96.8 156.9 198.3
BAMD 44.4 48.6 57.7 67.2
Forecasts 4 4 4 2

Tropical Storm Bill 23
Table 5a. NHC official (OFCL) and climatology-persistence skill baseline (OCD5) intensity forecast errors (kt) for Tropical Storm Bill, 16-18 June 2015. Mean errors for the previous 5-yr period are shown for comparison. Official errors that are smaller than the 5-yr means are shown in boldface type.
Forecast Period (h)
12 24 36 48 72 96 120
OFCL 3.3 0.8 3.0 5.0
OCD5 4.3 2.3 3.2 4.5
Forecasts 6 6 5 2
OFCL (2010-14) 6.2 9.4 11.5 13.3 14.6 14.6 15.8
OCD5 (2010-14) 7.3 10.8 13.3 15.3 17.7 17.8 17.6
Tropical Storm Bill 24
Table 5b. Homogeneous comparison of selected intensity forecast guidance models (in kt) for Tropical Storm Bill, 16-18 June 2015. Errors smaller than the NHC official forecast are shown in boldface type. The number of official forecasts shown here will generally be smaller than that shown in Table 5a due to the homogeneity requirement.
Model ID Forecast Period (h)
12 24 36 48 72 96 120
OFCL 3.8 0.0 2.5 0.0
OCD5 5.8 2.0 4.0 7.0
HWFI 5.5 6.0 7.0 14.0
GHMI 5.5 7.3 9.8 10.0
DSHP 5.8 2.0 4.0 7.0
LGEM 5.0 2.0 3.8 7.0
ICON 4.5 4.3 6.5 10.0
IVCN 4.5 4.3 6.5 10.0
GFNI 6.0 2.5 2.0 1.0
GFSI 8.0 10.8 15.3 23.0
EMXI 6.8 9.5 10.3 15.0
FSSE 6.0 3.3 2.8 5.0
Forecasts 4 4 4 1
Table 6. Watch and warning summary for Tropical Storm Bill.
Date/Time (UTC) Action Location
16 / 0300 Tropical Storm Warning issued Baffin Bay to High Island, Texas
16 / 2100 Tropical Storm Warning modified to Port Aransas to San Luis Pass, Texas
17 / 0300 Tropical Storm Warning modified to Port O’Connor to San Luis Pass, Texas
17 / 0600 Tropical Storm Warning discontinued All
Tropical Storm Bill 25
Figure 1. Best track positions for Tropical Storm Bill, 16-18 June 2015. Tracks over the United States and during the remnant low stage are partially based on analyses from the NOAA Weather Prediction Center.
Tropical Storm Bill 26
Figure 2. Selected wind observations and best track maximum sustained surface wind speed curve for Tropical Storm Bill, 16-18 June 2015. Aircraft observations have been adjusted for elevation using an 80% adjustment factor for observations from 850 mb and 1500 ft. Dropwindsonde observations include actual 10 m winds (sfc), as well as surface estimates derived from the mean wind over the lowest 150 m of the wind sounding (LLM). Advanced Dvorak Technique estimates represent the Current Intensity at the nominal observation time. AMSU intensity estimates are from the Cooperative Institute for Meteorological Satellite Studies technique. Dashed vertical lines correspond to 0000 UTC, and solid vertical lines correspond to landfalls.
10
20
30
40
50
60
6/15 6/16 6/17 6/18 6/19 6/20 6/21
BEST TRACKSat (TAFB)Sat (SAB)ADTAC (sfc)AC (flt->sfc)AC (DVK P->W)ScatterometerSurfaceDrop (sfc)Drop (LLM xtrp)AMSU
Win
d Sp
eed
(kt)
Date (Month/Day)
Tropical Storm Bill16 - 18 June 2015

Tropical Storm Bill 27
Figure 3. Selected pressure observations and best track minimum central pressure curve for Tropical Storm Bill, 16-18 June 2015. Advanced Dvorak Technique estimates represent the Current Intensity at the nominal observation time. AMSU intensity estimates are from the Cooperative Institute for Meteorological Satellite Studies technique. KZC P-W refers to pressure estimates derived using the Knaff-Zehr-Courtney pressure-wind relationship. Dashed vertical lines correspond to 0000 UTC, and solid vertical lines correspond to landfalls.
990
1000
1010
6/15 6/16 6/17 6/18 6/19 6/20 6/21
BEST TRACKKZC P-WSat (TAFB)Sat (SAB)ADTAMSUAC (sfc)SurfaceAnalysis
Pres
sure
(mb)
Date (Month/Day)
Tropical Storm Bill16-18 June 2015
Tropical Storm Bill 28
Figure 4. Sustained winds (kt) reported during Tropical Storm Bill, 16-18 June 2015. An asterisk denotes observations from oil rigs that were elevated around 25 m above the ocean surface.

Tropical Storm Bill 29
Figure 5. Wind gusts (kt) reported during Tropical Storm Bill, 16-18 June 2015. An asterisk denotes observations from oil rigs that were elevated around 25 m above the ocean surface.

Tropical Storm Bill 30
Figure 6. Storm tide measurements above Mean Higher High Water (MHHW) from NOS and TCOON gauges along the Texas and Louisiana coasts. MHHW is used as a proxy for inundation, or storm surge covering normally dry ground.

Tropical Storm Bill 31
Figure 7. NWS daily precipitation analyses using WSR-88D radar data and gauge reports for the 24-h period ending at (a) 1200 UTC 17 June 2015, (b) 1200 UTC 18 June 2015, and (c) 1200 UTC 19 June 2015.