Embed Size (px)
Citation preview

Proceedings of the 3rd GBIF Science Symposium
Brussels, 18-19 April 2005
Tropical Biodiversity:
Science, Data, Conservation
Edited by H. Segers, P. Desmet & E. Baus


Proceedings of the 3rd GBIF Science Symposium
Brussels, 18-19 April 2005
Tropical Biodiversity:
Science, Data, Conservation
Edited by H. Segers, P. Desmet & E. Baus

Recommended form of citation
Segers, H., P. Desmet & E. Baus, 2006. ‘Tropical Biodiversity: Science, Data, Conservation’. Proceedings of the 3rd GBIF Science Symposium, Brussels, 18-19 April 2005.
Organisation
- Belgian Biodiversity Platform
- Belgian Science Policy
In cooperation with:
- Belgian Clearing House Mechanism of the CBD
- Royal Belgian Institute of Natural Sciences
- Global Biodiversity Information Facility
Conference sponsors
- Belgian Science Policy

1
Table of contents
Research, collections and capacity building on tropical biological diversity at the Royal Belgian Institute of Natural Sciences .........................................................................................5
Van Goethem, J.L.
Research, Collection Management, Training and Information Dissemination on Biodiversity at the Royal Museum for Central Africa .......................................................................................26
Gryseels, G.
The collections of the National Botanic Garden of Belgium ....................................................30 Rammeloo, J., D. Diagre, D. Aplin & R. Fabri
The World Federation for Culture Collections’ role in managing tropical diversity..................44 Smith, D.
Conserving inland aquatic biodiversity in the tropics: the needs for a strong foundation with databases and information network .........................................................................................46
Gopal, B.
Online access to conservation data: challenges and opportunities.........................................47 Olivieri, S.
What should we try to learn about tropical biodiversity, and how can we use that knowledge for conservation? ......................................................................................................................49
Raven, P.
GBIF as a resource for biodiversity research...........................................................................50 Lane, M.A.
An assessment of animal species diversity in continental waters...........................................55 Balian, E.V., K. Martens, H. Segers & C. Lévêque
Changes in phytoplankton and bacterial biodiversity linked to hydrodynamics in Lake Tanganyika ...............................................................................................................................58
Cocquyt, C., A. De Wever, M. Stoyneva, P.-D. Plisnier & W. Vyverman
IBISCA: a large-scale study of arthropod mega-diversity in a neotropical rainforest..............61 Corbara, B., Y. Basset & H. Barrios
Digitization of the type specimens of Lepidoptera (butterflies and moths) from the Royal Museum for Central Africa: before long the pictures on the web ............................................65
Dall’Asta, U. & F. Desmet
Mitigation strategy for the Human-Elephant Conflict on Mount Kenya (Kenya): The scope of electric fencing as a plausible solution.....................................................................................72
Hirani, P.
The tropical collections of the University of Liège Museum of Zoology: diversity, database and access................................................................................................................................80
Loneux, M.
The tropical birds preserved at the University of Liège Museum of Zoology ..........................84 Loneux, M.
The Castelnau's fish collection and watercolour notebooks....................................................91 Loneux, M.
Tropical insects in collection at the University of Liège Museum of Zoology: a first approach..................................................................................................................................................95
Loneux, M., P. Grogna, A. Govers, & N. Lizzaraga

2
Albertine Rift zoodiversity: exploitation of the historical data in the Royal Museum for Central Africa, Tervuren.......................................................................................................................101
Louette, M.
Intensification of slash-and-burn agriculture in the rural village of Pokola (Republic of Congo): socio-economic context and ecological implications..............................................................105
Maniatis, D.
Configuration problem and description logic: towards automated species distribution mapping.................................................................................................................................................122
Pérez Lapeña, B., R.A. de By & F. Corsi
One year of taxonomic capacity building by the Belgian Focal Point to the Global Taxonomy Initiative ...................................................................................................................................132
Samyn, Y., A. Réveillon, A. Franklin & J.L. Van Goethem
The management of banana (Musa spp.) genetic resources at the IPGRI/INIBAP gene bank: the conservation and documentation status...........................................................................141
Van den houwe, I., B. Panis, E. Arnaud, R. Markham & R. Swennen
Biodiversity at the Ghent University Zoology Museum: potential and implementation .........151 Verschelde, D. & D. Adriaens
Biodiversity of cucurbits consumed as sauce thickener in Ivory Coast: a capital resource for the economic prosperity of rural women ................................................................................156
Zoro Bi, I A., K K. Koffi, Y. Djè, M. Malice & J.-P. Baudoin
EPBRS workshop ‘Innovative research for data acquisition and assessment’, Brussels, Belgium, 18 April 2005............................................................................................................166
Tack, J.
Recommendations of the workshop of the European Platform for Biodiversity Research Strategy...................................................................................................................................167

Invited Contributions


5
Research, collections and capacity building on tropical biological diversity at the Royal Belgian Institute of Natural Sciences
Van Goethem, J.L.
Head of the Department of Invertebrates, Royal Belgian Institute of Natural Sciences, Vautierstraat 29, B-1000 Brussels, Belgium.
Keywords: biodiversity research, collections, capacity building, tropical biodiversity
Abstract
The Royal Belgian Institute of Natural Sciences is a natural history research institution and museum financed by the Belgian federal government.
Its missions in the field of biological diversity are: (i) zoological research, (ii) monitoring and modelling of the Southern North Sea ecosystem, (iii) curation and management of natural history collections, (iv) public education, and (v) policy advice to the government.
Zoological research targets the three levels of biodiversity: (i) ecological diversity dealing with populations up to ecosystems, (ii) organismal diversity from individuals upwards species, and (iii) genetic diversity dealing with the variation between individuals within a population and between populations.
Taxonomic expertise is present for many groups of invertebrates and vertebrates worldwide. Focus ecosystems are terrestrial, inland water, coastal and marine. Geographical areas of taxonomic expertise embrace Europe and many other regions of the world in particular sub-Saharan Africa, South East Asia, Papua New Guinea, Indian Ocean, South America, Antarctica and Lake Baïkal in Russia.
In the past, research in tropical areas focused on three national parks in the former Belgian Congo and one in Rwanda (1933-61), on Central African great lakes (1946-1954), and on the West African coast of the Southern Atlantic (1948-49).
Since the eighties, speciation and phylogeny are studied on a long-term basis in ancient tropical lakes such as Tanganyika and Malawi (cichlid fishes, ostracods), on archipelagos such as the Galápagos Islands (spiders, carabid beetles) and Macaronesia (selected land and marine snail species), and in Central and East Africa (rodents). Besides this area-based research, scientists study the systematics, ecology and host-parasitic relationships of selected taxa in a worldwide perspective.
The collections of the Institute, parts of which go back to more than 220 years ago, total 37 million items, and cover virtually all tropical areas. They are complemented by extensive bird ringing data on Belgian breeding birds and migrants with a wintering area in tropical Africa.
The RBINS acts as the Belgian National Focal Point to the Convention on Biological Diversity and to the Global Taxonomy Initiative. As such the Institute has developed an international research and training programme in the field of taxonomy and curation of collections. The Institute also participates in data sharing activities, with the aim to make its non-European biodiversity data globally available. An upcoming project will involve the

6
valorisation of iconographic archives and publications on the national parks of the D.R. Congo.
Introduction
Established in 1846 under the name ‘Musée royal d’Histoire naturelle’ by King Leopold I, the Royal Belgian Institute of Natural Sciences (RBINS) is a natural history research institution and museum financed by the Belgian federal government. It is one of the ten federal institutions under the auspices of the Federal Minister of Economy, Energy, External Trade and Science Policy.
The Institute houses seven departments encompassing 17 sections. Its missions are:
(i) research, on present and past biological diversity including nature conservation issues, on geology, mineralogy, physical anthropology and prehistory,
(ii) monitoring and modelling of the Southern North Sea ecosystem,
(iii) curation and management of natural history collections,
(iv) public education in particular through permanent and temporary exhibits, conferences, guided tours,
(v) policy advice to the government in particular with respect to the implementation of international and European conventions.
The collections total some 37 million items and go back to more than 220 years. Permanent and hired staff make up a personnel of about 450 people.
Public galleries have a surface of 12,000m2 of which roughly 50% is at present under major renovation. Museum visitors number between 250 and 300,000 a year, 50% of which come under the guidance of schoolmasters and teachers.
The Institute is a member of several European biodiversity related initiatives such as CETAF, ENBI, Fauna Europeaea and SYNTHESYS with the aim to improve and facilitate access to its collections data.
The Institute is co-ordinating the European CASTEX (Common Approach for Scientific Touring Exhibition) network supported by the raising public awareness programme of the European Commission. The Institute is one of 12 partners of the ‘Thematic Network Oceanics’ aiming to bring research closer to the general public in using the topic ‘conservation of marine ecosystems’.
The activities of the education and museum staff, to which many scientists contribute, offer a large variety of services to the public. Hence the RBINS can be considered to be one of the main Belgian actors in communicating science to the public. Education in the several spheres of biology will help the public to assess the significance of biological diversity to their lives. (Communication Service & Publications Cell, 2003)
A major role in biodiversity research
Three levels of biodiversity
Zoological research at the RBINS targets the three levels of biodiversity:
(i) ecological diversity dealing with populations, through niches and habitats, up to ecosystems,

7
(ii) organismal diversity encompassing the taxonomic hierarchy from individuals upwards species, genera and beyond,
(iii) genetic diversity dealing with the components of the genetic coding that structure organisms and variation between individuals within a population and between populations.
Taxonomic expertise is present through time for many groups of invertebrates and vertebrates worldwide. Focus ecosystems are terrestrial, inland water, coastal and marine. Geographical areas of taxonomic expertise embrace Europe and many other regions of the world in particular sub-Saharan Africa, South East Asia, Papua New Guinea, Indian Ocean, South America, Caribbean, Antarctica and Lake Baïkal in Russia.
At ecosystem level
Victor Van Straelen, director from 1925 to 1954, has directed research towards the tropics through major expeditions.
He was the scientific director of an expedition to the Netherland’s East-Indies, from December 1928 till April 1929, conducted by HH.RR.HH. Prince and Princess Leopold of Belgium. Research on the collected fauna was published in a six volumes special series of treatises, encompassing 126 papers of which impressive monographs and revisions. (Van Straelen, 1933)
In 1925 Victor Van Straelen established the Virunga National Park (formerly named Albert National Park, honouring King Albert I) and became President of the Institute of the National Parks in Belgian Congo. He initiated the founding of three more national parks and organised a vast programme of expeditions starting in 1933.
The diverse terrestrial ecosystems within the immense Virunga, Upemba, Garamba and Kagera National Parks were observed and massively sampled:
- Nine expeditions to the Virunga National Park were organised between the period 1933-1961, and the park was also visited as part of broader surveys. Over 300 scientific papers resulted from this field work covering vertebrates, insects, molluscs, crustaceans and other invertebrate groups, even fresh water diatoms. (de Witte, 1937)
- The results of the exploration of the Garamba National Park during 1949-52 were published in more than 100 papers. (De Saeger, 1954)
- Upemba National Park was intensely explored during 1946-49 resulting in more than 150 scientific papers. (de Witte et al., 1966)
- During 1936-38, the flora, birds and mammals of the Kagera National Park were surveyed (at least four publications).
Other renowned expeditions focused on aquatic ecosystems, such as the African coastal waters in the Southern Atlantic (1948-49), Lake Tanganyika (1946-47), and Lakes Kivu, Edward and Albert (1952-54).
More than 200 biologists, the majority being taxonomists, contributed to a variety of more than 800 scientific publications on tropical Africa biological diversity, amongst them famous monographs on fishes (including cichlids), gastropods, bivalves, ostracods, many insect taxa, etc. Besides this gigantic taxonomic production, ecologically oriented monographs were also produced, e.g. the phytoplankton of Lake Tanganyika (1957), the vegetation of the shores of the Lakes Kivu, Edward and Albert (1959), the food regime of fishes in these lakes (1957-59), the ecology of ungulates of the Virunga National Park (1969).

8
The founding in 1959 of the ‘Charles Darwin Foundation’ for the conservation of fauna and flora on the Galápagos Archipelago was another initiative of Victor Van Straelen. He was also the initiator of a zoological expedition to the Galápagos Islands and the continental part of Ecuador (1964-65), the results of which have been published in a co-edited series by the Royal Museum for Central Africa and the Royal Belgian Institute of Natural Sciences. (Anonymous, 1976)
The four volumes of a ‘Check- list of the Freshwater Fishes of Africa’ (1986-91) are another example of a scientific cooperation between these sister institutions. (Daget et al., 1991)
One scientist of the RBINS can be considered as a pioneer of African wildlife conservation. In 1948, at the age of 22, he started surveying the national parks of the former Belgian Congo and of Rwanda. This included around 4,000 nights of isolated camping. President Mobutu appointed him the ‘Directeur général des parcs nationaux du Congo’ (1969-1974). (Verschuren, 2005)
Afterwards, he oriented his nature conservation efforts towards Tanzania, Liberia, Indonesia, Senegal, Burundi, Paraguay, and other countries. His approach to nature conservation is genuine, and not based on theoretical considerations, data gathered by remote sensing, or mammoth meetings that characterise too often present day nature conservation approach.
Some twenty years ago research has started towards the assessment of habitats and ecosystems and the dynamics of protected sites including typology of habitats of South America, Africa and South East Asia. Recent research on the Galápagos Islands targets ecological assemblages of terrestrial arthropods. A synecological analysis of the spider fauna of the different vegetation zones of the islands Santa Cruz and Isabela shows an important variation in these communities coinciding mainly with altitudinal variation.
Other projects focus mainly on the study of areas of biological interest, on the definition of selection criteria for protected areas and on the design of habitat typologies and catalogues. They include the identification of constraints and threats, the principles of habitat management and methodologies of trend evaluation, biological indicators and environmental impact studies.
In recent years, emphasis has been put on the development of methodologies regarding assessment of biodiversity richness of habitats and ecosystems. One example is the study of community ecology and species turnover of ants and termites in the Chaco region (Argentina and Paraguay). Another striking example is the tropical forest canopy research undertaken during the 90’s in Papua New Guinea. 118 canopies of trees in a single 1km2 plot in a lowland rain forest on the northern coast of Papua New Guinea were fogged. Various guilds such as herbivorous weevils (1,200 species found, 1,800 estimated to occur), predatory long- legged flies (152 species found, 300 estimated to occur) and spiders (768 species found, 1,400 estimated to be present) were investigated. (De Bakker et al., 2004)
All three groups are characterised by the presence of numerous species in low quantities (singletons and doubletons make up 45 to 50% of the collected species). These findings are in support of Erwin’s very high estimates of global biodiversity, which were often contested.
One research associate of the Institute is from 1996 onwards involved in herpetological research in the Guyana Shield Ecoregion, in collaboration with local scientists and a local biological centre (Guyana). His field work and taxonomic studies provide information on the distribution, abundance and habitat requirements of species aiming effective conservation planning and management in the Kaieteur National Park. Local people are provided with hands on training in field herpetology, and teachers have been given demonstrations on the critical importance of protected areas and their potential benefits for local people. (Kok, 2005)

9
A research unit of the Institute participates in the social insect programme of the IBISCA-project (Investigation of the Biodiversity of Soil and Canopy Arthropods), launched end 2003, the most ambitious research program ever attempted to study the spatio-temporal distribution of arthropod biodiversity in a tropical rainforest.
At species and species-group level
Scientists at the Institute have traditionally a large freedom in choosing their research topics. This results in a wide variety of expertise covering many zoological taxa, a diversity of thematic work, as well as expertise in many geographical areas worldwide. Hereafter I will present selected examples of long standing research.
Threatened wildlife
Since the early 80’s research has been carried out on threatened wildlife among them tropical fauna such as savannah, steppe and desert ungulates, forest and migratory birds, amphibians, and various invertebrate groups. This research focuses on assessment of population status, identification of risk factors and conservation measures.
Research on threatened vertebrates relates essentially to the detection of species and populations at risk taking into account their zoogeography and eco-ethology, to the development of data collection methodologies adapted to vulnerable species, and to the implementation of restoration programmes. This includes individual marking and monitoring techniques. www.naturalsciences.be/cb/projects/cb_projects.htm
Since 1997, a research associate of the Institute studies and inventories the herpetofauna of Southeast Asia, focusing on Thailand, Malaysia and Vietnam. This work relies on a wide international cooperation and fits in official projects of the Royal Forest Department of Thailand, the Thai Fisheries Department, Thailand's Red Cross and Chulalongkorn University. Recently one new genus and 15 new species of reptiles have been described, of which five deadly bamboo pit vipers (Crotalidae). At present more than 50 scientific papers have been published, of which a complete list of the snakes of Thailand, a detailed zoogeographical study of the Thai-Malaysian peninsula and many herpetological inventories of national parks and other crucial areas for conservation issues. (David et al., 2004)
Adaptive radiations became a focus for studies in conservation biology since they are often associated with high frequencies of endemism. On islands in particular, this endemism faces very high extinction rates, e.g. for terrestrial gastropods up to 80%. One Institute’s scientist studies camaenid tree snails (Gastropoda, Camaenidae) living on the islands north and east of the Papua New Guinea mainland. Many of these islands have one or several endemic tree snail species, some restricted to an area of around 40km2. Camaenid tree snails are a substantial part of world-wide shell trade. Logging and over-collecting are the main threats to survival. Given the very high level of endemism, it would help to set aside a large number of reserves, even of small size, to conserve many species and infraspecific taxa of arborical snails.
Interstitial habitats
Interstitial habitats, water-filled cavities between sediment particles, present an astonishing wealth of micro- invertebrates. They show their highest diversity of organisms in the subtidal and intertidal zones of tropical coasts. Ostracods and copepods, as well as marine nematodes are studied by the Institute’s scientists.

10
Figure 1. Prochaetosoma martensi Decraemer, 1989 (Nematoda, Draconematidae), coral sand, Papua New Guinea. Body length: 550-800 µm; a, holotype male in toto; b, head; c, dorso-ventral view of region posterior adhesion tubes, > paratype; d, male copulatory apparatus; e, detail ambulatory seta; f, habitus female paratype; g, part of female reproductive system (drawings in Indian ink by Wilfrida Decraemer).

11
Figure 2. Actinocletodes woutersi Fiers, 1986 (Crustacea, Copepoda), temporary brackish water pool on Laing Island, Hansa Bay, Papua New Guinea. Body length: 1,300 µm; a, habitus of the female in dorsal view; b, pereopod 1; c, pereopod 4 (drawings in Indian ink by Frank Fiers).

12
More than 3,000 species of Harpacticoida (Crustacea, Copepoda) are known today. They are attributed to 34 families. The body shape of these animals is strongly correlated with their habitat preferences. We recognise nine habitus-types, each type confined to one of more families. The Laophontidae, a particular successful harpacticoid family, has invaded every habitat in marine and brackish water environments. As such they display a remarkable diversity of habitus-shapes: thus far eight out of the nine different habitus-types have been observed in this family. Remarkable adaptations are the vermiform and cylindrical types who penetrate the interstitial of sandy beaches to depths of more than a meter. Another remarkable adaptation is that of the fusiform depressed types which cultivate bacterial colonies that decompose organic material deposited on the back of the copepod. The decomposed material serves as additional food for the copepod. (Fiers, 1993)
The study of marine nematodes at the Institute focuses on the systematics of two families: Epsilonematidae, Draconematidae, and one order: Desmoscolecida. Contamination and urban impacts can cause severe damage to this fragile world resulting in the disappearances of a unique fauna which often represents the basic step in aquatic trophic webs. Nematode communities have a large potential as bio- indicators. At the Institute, their use as bio-indicators in recovering long-term pollutes terrestrial sites is investigated.
Several scientists of the Institute are really masters in fine art since they make themselves such drawings in Indian ink (see Figures 1-2).
Host-parasite relationships
Marine snails of the family Coralliophilidae (Mollusca, Gastropoda) are living on or in stony corals (Scleractinia). The endoparasitic species, represented by three genera (Magilus, Leptoconchus, Reliquiaecava) are cryptic animals, seldom observed and believed to present a low diversity.
Studies by an Institute scientist all over the Indian Ocean and the West Pacific reveal that they infest at least six different coral families, in particular Faviidae (knob corals and their allies) and Fungiidae (mushroom corals). In this last family 37 among the 43 known species are infested by Leptoconchus species. Adult shells present few discriminant characters. Larval shells present very interesting microsculptures which, however are only discriminant at supra specific level.
A study of the Leptoconchus infesting mushroom corals, based on shell characters and coral/host relationships, reveals at least nine different species. These species are very close to each other and can only be separated by multivariate analysis. DNA sequencing indicates an even higher number of species. (Massin & Dupont, 2003)
Plant-parasitic nematodes
Although currently only about 4,100 species of plant-parasitic nematodes have been described (i.e. 15% of the total number of nematode species known), their impact on humans by inflicting heavy losses in agriculture in substantial.
It has been estimated that a single acre of soil from arable land may contain as many as 3,000,000,000 nematodes. The most important pathogen associated with ectoparasitic nematodes are plant viruses. These are transmitted by members of two families, i.e. Longidoridae and Trichodoridae.
At present only 5% of the 470 species of Longidoridae, and 10% of the 100 known Trichodoridae species are virus vectors. In order to constrain, or even banish this limiting factor in agricultural production, it is crucial to identify accurately the nematode pests and to

13
understand their biology. The taxonomy, morphology and phylogenetic relationships of both families of virus vector nematodes are extensively studied at the Institute since more than 25 years. (Decraemer, 1995)
All taxa inventory in a biodiversity hotspot region
In 1976 the King Leopold III Biological Station was founded by the ‘Université Libre de Bruxelles’ on Laing Island, situated in Hansa Bay, some two nautical miles off the north coast of Papua New Guinea. The island is only 800m long and in average some 50m width. At its East side it is protected by a vast fringing reef, while at the West side it has an open lagoon complemented by a sandy beach.
Although equipped with modest accommodation and lab facilities, field work in Papua New Guinea was greatly facilitated since the station served as a logistic basis for excursions on the mainland. Moreover, the station was fully equipped for scuba diving. During its 20 operational years the station has welcomed some 150 research visitors of which 30% from the Institute. Research dealt with marine, freshwater and terrestrial faunas. Extensive surveys have been carried out on the coral reefs in Hansa Bay, resulting in the discovery that the scleractinean species richness reflects more than 90% of the stony corals recorded from the Great Barrier reef.
Long term in situ growth studies on four species of giant clams (Tridacnidae) were conducted over a period of 15 years. Marine gastropods, ostracods, copepods, nematodes and many other taxa have been studied at length.
Terrestrial ecosystems have been explored using Malaise traps, pitfalls and UV light. The fumigation technique with pyrithrine was used for canopy research. Collection material has been dispatched for study to many experts in Belgium and abroad.
To date the Institute researchers have published more than one hundred scientific papers on Papua New Guinea fauna in internationally refereed journals. Zoological research in Papua New Guinea revealed impressive numbers of new taxa at species and genus level, and some even at family level, such as a new family for a collembolan species commensal on hermit crabs (Coenaletidae Bellinger, 1985) and a new family of harpacticoid copepods living on the gills of terrestrial decapods (Cancrincolidae Fiers, 1990).
These contributions definitely advanced taxonomy. They were complemented by other amazing discoveries of which I mention one example.
A mite that jumps and curls up
When sieving soil litter on that tiny Laing Island, a species of a box moss mite, 0.8mm in length, belonging to the genus Indotritia (Acari, Oribotritiidae) was collected. Although the animal has neither specialised legs nor extensor muscles in its knee, it turned out that it could jump very powerfully. The backward leap is characterized by a short take-off time, i.e. ca. 0.5ms, which corresponds to an acceleration of 120 g. This is facilitated by a catch mechanism made up of little hooks on the upper portions of the first pair of legs that hitch on the rim of the anterior shield of the body.
This box moss mite uses all its legs to jump. The jump invariably generates an unusual behaviour during the backward flight, i.e. the performance of 12 to 18 forward somersaults. The jump is not the only anti-predator defence, since the mite is also able to curl up. As the mite is unable to leap more than 2-3 times successively, curling up appears to be a defence that complements the jump. The ability to leap has been reported in another species of box

14
moss mite living on Laing Island and belonging to the genus Austrotritia (same family). (Wauthy et al., 1998)
In search for ancestral groups in Southeast Asia
Pursuant to the intensive studies on insects from Papua New Guinea, one research team extended its activities to Southeast Asia (Cambodia, Indonesia, Malaysia, Singapore, South China, Thailand and Vietnam), and organised in cooperation with local scientists massive sampling.
Research focused on empidoid flies (Diptera, Empididae) of which to date 350 species have been recorded -the majority new to science- as well as 15 new genera. The working hypothesis set that Southeast Asia reflects an intermingling of Palaearctic and Oriental faunas and is at the origin of part of the Australasian fauna. Many ancestral groups are present, their detailed analysis may lead to understand evolution and phylogeny of insects at a global scale. (Grootaert et al., 2003)
Linking extant species with the fossil record
The comparison of extant species with the fossil record may give valuable information on the origin of lineages. This was particularly the case when in 2004 the new ostracod species Microceratina martensi Namiotko, Wouters et al., (Ostracoda, Cytheruridae) was described from a submarine cave on Christmas Island in the Indian Ocean.
Comparison with fossil occurrences of the genus Microceratina illustrates that it is a very ancient, low diversity lineage. The oldest record of the genus dates from the Kimmeridgian, Upper Jurassic, about 150 million years, Lebanon. The second oldest record is from the Upper Cretaceous, about 70 million years, N. Germany.
Before the discovery of M. martensi on Christmas Island, the three fossil and seven recent species of the genus Microceratina presented a disjunct distribution, on the one hand Europe and the Mediterranean region and on the other hand South Australia and the south of New Zealand. The discovery on Christmas Island is the first record in the tropical zone. The transposition of fossil and recent records of Microceratina species on an Upper Cretaceous paleocoastline map clearly points towards a Tethyan origin and subsequent dispersion of the genus. (Namiotko et al., 2004)
Freshwater cyclopine copepods from Yucatan peninsula
One Institute’s scientist contributed to a vast zooplankton sampling programme in the karstic plain all over the Yucatan peninsula (Mexico). Analysis of the current species distribution of seven genera of freshwater cyclopine copepods, and of local geological and climatic history, suggest relatively recent, post-Pliocene biogeographical patterns. The eastern coast of Yucatan is the most recently colonised by cyclopine copepods. Most of the genera are linked with South American species, while Nearctic influence is hardly represented. This group has no marine relatives, and there is evidence of vicariant events resulting in cave-dwelling forms.
Abyssal depths
The Institute is also participating in international research programmes in the Caribbean, where coralline or hypercalcified sponges (Porifera, Sclerospongiae) are found in underwater caves or at depths unreachable by scuba divers. These organisms contribute to build up the deep fore reef framework by laying down a massive calcareous skeleton.

15
These ‘living fossils’ have recently attracted interest because of their potential use as paleo-environmental recorders. Specimens are being monitored in situ in Jamaica since almost 20 years to calibrate geochemical analysis on their skeleton. Their growth rate, ranging from 100 to 300µm/yr depending on the species, implies that even relatively small specimens can be several centuries old.
Exploration of abyssal depths with submersibles lead recently to the discovery of a new genus and species of hypercalcified sponge: Willardia caicosensis Willenz & Pomponi, 1996 (Hadromerida, Acanthochaetetidae). Abyssal depths are also explored for new sponges containing bioactive compounds investigated by the pharmaceutical industry for their antibacterial, antiviral, antifungal, or antiparasitic therapeutic properties. (Willenz & Pomponi, 1996)
Speciation on island archipelagos
In 1982 a study of the spider fauna of the Galápagos archipelago was started, based on one month field work every two years. Before this project, 76 spider species were known; nowadays the number is nearly 160 representing 32 families. Phyletic radiation has been identified in the families Lycosidae and Gnaphosidae (Araneae). On the island of Santa Cruz closely related species of these families occur parapatrically. An example of sibling species is represented by Camillina galapagoensis and C. cruz (Gnaphosidae). They sometimes occur sympatrically. Where present, C. galapagoensis is widespread in all vegetation types from supralittoral up to the pampa zone at the top of the islands. However, the distribution of C. cruz is limited to the arid zones of the islands where it occurs. (Baert, 1994)
Since 1986, carabid beetles (Coleoptera, Carabidae) are also investigated. Ground and tiger beetles are now known from all major and most small Galápagos Islands. Only two of the 43 species are known to also occur on the South American mainland, while some are probably recent introductions by man. More important, about 90% of the species appear to be endemic to the archipelago. Many of these are wingless, thus strongly limited in their dispersal power. These carabids show a multitude of geographic patterns and evolutionary processes responsible for their origin. Hypotheses generated in this context (mainly based on morphology and biogeography) are recently also tested by means of molecular techniques. A number of cases strongly suggest incipient speciation and these especially yield interesting information on speciation processes, once more underlining the importance of the Galápagos archipelago for evolutionary research. (Dhuyvetter et al., 2002)
Since 1996, studies on chrysomelids or leaf beetles (Coleoptera, Chrysomelidae) and other phytophagous beetles have also been incorporated.
Results from these studies on spiders and beetles are increasingly of importance for conservation biology, especially within the context of human-induced introductions, their influence on Galápagos biota, and the conservation of its unique genetic diversity. (Desender et al., 1999)
Speciation in ancient lakes
Ancient lakes are hot spots of biological diversity. Two of the East African Rift valley lakes are amongst the oldest on Earth: Lake Tanganyika is between 9 and 12 million years old and Lake Nyasa/Malawi between 4 and 8 million years. Both lakes are also large (roughly the surface of Belgium) and deep, ca. 1,400m and ca. 800m respectively.
From a biologist’s point of view, the most interesting aspect is that most of the species in these lakes are endemics, especially with regard to animals. When so many species occur in
16
one lake only, it is mostly assumed that they presently live in the cradle where they originated (neo-endemics). Such a situation allows for unique opportunities to link patterns of species occurrence with processes of speciation. An Institute’s research team studies speciation in a whole range of lacustrine taxa, such as cichlid fish (Osteichthyes, Cichlidae), mussel shrimps (Crustacea, Ostracoda) (Martens, 1997), midges (Diptera, Chironomidae) and aquatic oligochaetes (Annelida, Oligochaeta).
At the genetic and molecular level
Molecular techniques were introduced in the Institute at the end of the ‘80s. At that time protein electrophoresis was used as an excellent tool to distinguish (sub)populations belonging to a same species, as well as morphologically indistinguishable, but genetically clearly distinct species, the so-called cryptic species. Such information is highly relevant to recognize ‘Evolutionary Significant Units’ and to predict possible problems of outbreeding depression during species reintroduction programmes.
The possibility to amplify DNA from museum specimens has recently stimulated our researchers to develop the use of DNA sequence data in systematic research. This technique validates the existing major reference collections in musea. Hence scientists of the Institute aim to establish an integrated collaborative research structure between the Institute and the Royal Museum for Central Africa for a joint DNA barcode task force and research programme.
Mitochondrial DNA and micro-satellites are the most widely used molecular markers for phylogenetic and population level studies. At the Institute the technique is intensely used in studies on invertebrates (molluscs, insects, crustaceans, worms), on mammals (African shrews and rodents) and on cichlid fishes from the major east African Rift lakes. Cichlid fishes present a spectacular example of adaptative radiation and speciation within the confines of a single lacustrine system. Extensive fieldwork is as always required, so over the past few years cichlids have been collected over more than 1,000km Lake Tanganyika shoreline in Burundi, Tanzania and Zambia. (Salzburger et al., 2005)
Many of these studies intend to infer the evolutionary histories of these faunas and attempt to reconstruct evolutionary processes of colonization, diversification and speciation in the context of well-documented paleoclimatic and tectonic events.
Such phylogeographic studies are made possible thanks to the extensive specimen and tissue collections that have been (and continue to be) collected throughout Central and East Africa, resulting from a long standing collaboration with the Royal Museum for Central Africa and the University of Antwerp.
A recent development in the use of molecular tools is the implementation of a short, but sufficiently long, DNA sequence, from an agreed nucleotide part, to characterise animal (mostly vertebrate) taxa. This so-called DNA barcode method gives researchers a tool that allows to reliably identify known taxa. This approach has already facilitated the discovery of new, so called cryptic species.
Various biodiversity services
Scientific expertise
The large variety of research topics coupled with a worldwide covering of zoological research results in a great potential of expertise that can assist other scientific teams inside or outside the country, and be helpful for decision making. Moreover the Institute’s well known capacity

17
towards public services rely on that broad field of current expertise as well as on the potentialities of collections and other archives.
Researchers at the Institute are constantly solicited to offer their expertise in the framework of implementing international conventions such as CITES, CBD, CMS, etc. Some participate in the work of the Belgian CITES Scientific Committee and of the CMS Scientific Council.
Many have been designated by ministerial decision as a CITES expert. They assist the customs departments at international airports and seaports with the identification of suspected CITES species. They are also asked to teach customs officials in basic taxon-specific knowledge, in order to help them carry out routine identification work.
Some of the Institute’s taxonomists are solicited by foreign institutions and organisations for identification of critical collection material and for unravelling taxonomic knots. A very recent example: last year, the Smithsonian Institution in Washington D.C., invited one of the Institute’s marine invertebrates experts to revise its collection of sessile barnacles (Cirripedia, Balanomorpha).
Another example concerns the recent development in Laos of farming of calanoid copepods (crustaceans with an adult length of 1.5mm) as protein supplement for human consumption. However a complete lack of taxonomic knowledge resulted in the fact that nobody knew what they were farming, and nobody knew what people consumed. A detailed study by an Institute expert revealed that the cultures consisted of one single species new to science: Allodiaptomus esculentus (Copepoda, Diaptomidae). By the way, it is rather exceptional that the specific epithet in the name of a micro-crustacean refers to edibility. Scientists in Laos are now conducting studies on the development and farming of this remarkable species.
The ratification by Belgium of the Convention on Biological Diversity (CBD) opened new perspectives for the Institute. It was designated in 1995 as the National Focal Point (NFP) for the follow-up of the CBD, and in 2001, as the NFP for the Global Taxonomy Initiative (GTI). Scientific work in this context involves support to federal and sub-national administrations in the follow-up of the Convention, the coordination of national reporting to the CBD and the provision of assistance in the establishment of official Belgian positions to be defended in an array of European and international meetings.
The Institute is also involved in the Belgian Biodiversity Platform. This Platform is the federal science policy office's information and communication initiative linking biodiversity science and policy. It also represents Belgian researchers in international forums like DIVERSITAS and the European Platform on Biodiversity Research Strategy (EPBRS), and it acts as the Belgian node to the Global Biodiversity Information Facility (GBIF). (Segers, 2005)
Communication, education and public awareness
Communication, education and public awareness raising has been developed in the RBINS as off 1931 by the set up of an Educational Service. This Service has produced many booklets, mainly on faunal groups, and has organised numerous public presentations and guided tours, in particular for children.
With respect to tropical biodiversity the Educational Service has edited postcards on fauna present in the National Parks of the former Belgian Congo.
Communication, education and public awareness are essential elements for a successful and effective implementation of the Convention on Biological Diversity. (Franklin et al., 2003) Its 'Global Initiative on Communication, Education and Public Awareness' (CEPA) recommends

18
the building of capacities through the establishment of training programmes, the undertaking of professional exchanges and twinning programmes, the improvement of synergies between public awareness and practice, the development of tools for communicators on biodiversity, the establishment of partnerships with journalists and the building of capacity for fund-raising.
Adequate partnerships have been extremely complicated to identify, and most requests received from developing countries targeted financial support rather than the provision of expertise.
In 2004, two awareness projects targeting the wider public complemented taxonomic research and training activities in Guyana and Cambodia respectively. In 2005, the elaboration of taxonomic manuals was initiated to help the development of tools for improving scientific communication on biodiversity. In support to the Clearing-House Mechanism (CHM), a call for project proposals was launched to help CHM focal points in African countries contribute to the education and information of the general public and policy makers on the value of biodiversity and on the opportunities offered by the Convention on Biological Diversity.
Collections and other archives
Collections
From a grand total of 37 million items (> 1mm) in the Institute’s collections, one could reasonably expect that around 27 million represent extant zoological fauna. Maybe 50% or more could originate from tropical regions, but this is just a guess.
The importance of collections is not only based on their volume, but also on other parameters such as:
(i) preservation quality,
(ii) presence of soft parts,
(iii) species number coverage within taxa,
(iv) geographical span,
(v) historic value,
(vi) storage conditions and accessibility.
In general, the Institute’s collections meet all of these parameters. The preservation quality is quite good, although parts of the collections suffer from dust, Byne’s disease, and acidification of preservation liquids. This is particularly harmful for specimens having fine calcareous structures. Presence of soft parts is crucial for invertebrates such as molluscs. Hence liquid storage of molluscs started in the 30’s, while small insects and spiders have been kept in alcohol from some 50 years onwards.
Subgroups of four classes of Mollusca, and of Acari, Cnidaria, Crustacea, Insecta and Holothuroidea are remarkably well represented by species numbers, reflecting 60 up to 80% of the known species. Whenever possible, our taxonomists tend to gather as much as possible voucher material which results in an utmost reference collection of a taxon. Geographical span is worldwide. Sampling and exchange is sometimes organised to collect taxa all over their geographical range. Moreover, European migrant taxa are collected in exotic areas.
Parts of the collections go back to more than 220 years ago. Belgian fauna is represented as off mid 19th century, presenting a high historic value. Storage facilities are adequate,

19
especially for liquid preservation. Physical access to the collections is very good, and many efforts are being done for electronic cataloguing rapid digitising the collection records.
Key collections from tropical areas are:
- the famous collection of Baron Edmond de Sélys Longchamps (1813-1900),
- voucher specimens of more than 1,000 new species described as a result of the famous 1928-29 expedition to the Netherlands’ East Indies, now Indonesia,
- insects, molluscs, worms, crustaceans, reptiles, and other groups from the national parks of D.R. Congo,
- hydromedusa, soft and stony corals, crustaceans, molluscs, sea cucumbers, spiders and many insect taxa from Papua New Guinea,
- carabids and spiders from the Galápagos Islands,
- various insect groups, in particular flies from South-East Asia,
- neotropical ants and termites,
- cichlid fishes from the great African lakes,
- Amazone and Central African fishes.
Frozen tissue collections from tropical areas are being developed for beetles and spiders from Galápagos, for cichlid fishes from the African great lakes, and for East and Central African rodents and shrews. At present they include:
- 5,000 beetles belonging to four families (Carabidae, Curculionidae, Chrysomelidae, Oedemeridae) and 1,200 spiders from the Galápagos Islands,
- 8,000 cichlid fishes representing 250 species belonging to 56 genera,
- 7,000 African small mammals representing 250 rodent and shrew species.
Databases
Since 1927 the Institute organises and coordinates bird ringing in Belgium. Fieldwork is mainly done by volunteers. They become bird ringer after a long training period and after having successfully passed two exams at the Institute.
All recoveries from the start of ringing operations are stored in a database, together with more than 4 millions of ringing data from the past seven years.
Since Africa is an important wintering area for many species breeding in Belgium, or migrating through our country, quite a lot of recoveries are related to this continent. Apart from their interest for migration studies, they reflect the spatial and temporal occurrence of the species throughout the continent.
Some examples will illustrate the variety of migrant routes. The well-known European barn swallow, Hirundo rustica has winter distribution in Central and West Africa. The flyways of the species are spread over the western half of the African as well as the European continent.
The wintering area of reed warblers, Acrocephalus scirpaceus, lies mainly in western Africa. The closely related marsh warbler, Acrocephalus palustris, on the contrary, has a clearly eastern distribution in winter. Of all European ringing schemes, the Institute keeps by far most of the recoveries for this species, documenting its flyway and winter quarters.

20
Finally, the Sandwich tern, Sterna sandvicensis, is a marine piscivorous species with a very important breeding colony at the Belgian coast and winter areas along the West and South African coasts.
Careful analysis of the bird ringing data combined with meteorological data over time could offer insight in the ways migratory birds react on climat changes. (Roggeman et al., 1995)
Databases are being developed by every Section of the Institute. Some are available on- line in complete form, others in a more restricted content. To cite just one example: PHYSIS, a catalogue of habitat types of the world organised according to the CORINE methodology. Hierarchic classification is based on similarities in physiognomy, plant and animal communities. Parallel lists are prepared for each biogeographical realm. Complete frameworks, partial developments and local extracts are provided on- line for the Palaearctic region and South America. Local extracts are provided for Africa. www.naturalsciences.be/cb/databases/cb_databases_eng.htm
Library, iconographic archives and publications
The RBINS holds the largest natural history library in Belgium, totalling more than 700,000 volumes, and around 10,000 titles of periodicals of which some 3,000 are currently running, 60,000 geographical, geological and nautical maps, etc. Total length of shelves is in the order of 15 km. Prestigious and antiquarian items are numerous. Parts of this library cover nearly complete bibliography on various taxa. In general, scientists of the Institute can find up to 85% (and more) of the existing literature with respect to their study objects. Some of them invest considerable free time to make this invaluable information accessible through databases. Recently, a thematic library has been set up focusing on biological diversity issues and sustainable development. This rapidly growing library, of about 4,200 book and booklet titles is part of over 166,000 book titles which are presently electronic catalogued (numbers from April 2005), the references being accessible through the Institute's website.
The RBINS possesses extensive archives that consist of specimen collections, iconography, maps and a vast amount of scientific publications. Examples from the tropics include: the National Parks of D.R. Congo (Virunga, Upemba and Garamba, years 1930-1960s), the ancient lakes of Central Africa (Tanganyika, Kivu, Edward and Albert), the Kagera National Park in Rwanda, and more recently the Galápagos Islands, Argentina, Papua New Guinea and Southeast Asia.
These archives are a potential extraordinary source of information. In some cases, such as the colonial period in Central Africa, this information is mainly available in Belgium. These historical data can be used as baseline information for monitoring studies, restoration of landscapes and ecosystems, and the sustainable use of biological resources.
The RBINS is carrying out a feasibility study to evaluate how its archives can be valorised. Specific attention will be given to the archives of the National Parks of D.R. Congo. The ‘Institut Congolais pour la Conservation de la Nature’, the institution in charge of the management of the National Parks in D.R. Congo, has been contacted to prioritise and streamline our activities. Since other Belgian teams also work in Central Africa (e.g. Royal Museum for Central Africa, National Botanic Garden of Belgium, Catholic University of Louvain- la-Neuve, Ghent University), synergies will be developed with these key actors. After the feasibility study, a full project will be started with the aim of providing the information in digital form and of making it widely available for spatial and temporal conservation action.

21
The publications of the Institute are various. Well known are the 14 volumes of prestigious Annals from the 19th century (1877-1887) devoted mainly to the fossil fauna of Belgium. Besides, two monographs on Belgian spiders were also edited (1882, 1886). Treatises in several series, bulletins, distribution atlases, proceedings, postal cards, etc. number over 10,000. A complete inventory exists, also in electronic form. The references of our publications are available online on the Institute’s website. www.naturalsciences.be/common/pdf/science/publications/Cata.pdf
Training and capacity building
It is a long tradition that researchers at the Institute have agreements with Belgian universities to teach in their field of expertise. Researchers accept co-promotership of doctoral and graduate theses. Many researchers are invited by universities to give guest lectures in their specific field of expertise. This was particularly true during the five years (1999-2003) that Ghent University organised, on behalf of the United Nations University, a six month training course on biological diversity for graduates and postdocs of developing countries. A dozen scientists of the Institute participated in the training programme.
The expertise of the Institute in bird ringing is used by the Senegal government to illustrate the importance of the Saloum delta, a biosphere reserve for wintering and migrating waterfowl. The Institute was asked to set up ringing expeditions and to train local wardens for counting and ringing tern colonies. An ‘All Species Map Senegal’ with all the ringing and recovery localities for all specimens ringed or controlled at the Saloum delta, illustrates the importance of this wetland ecosystem for bird populations coming from northern- and western Europe.
The first capacity building activities under the CBD framework started in 1998, with a project called ‘Partnering role for the clearing-house mechanism’. This project was financed annually by the Belgian Development Cooperation (DGDC) from 1999 till 2002, and provided training for national webmasters in charge of making biodiversity information available via specialised websites.
Following the success and popularity of the project towards African tropical countries, a specific agreement for a period of five years (2003-2007) was signed in 2003 between the DGDC and the RBINS. The objectives of this agreement are to improve knowledge on biodiversity and reach a better implementation of the Convention on Biological Diversity in developing countries. The agreement comprises five main areas of activities. In addition to the ‘Partnering role for the clearing-house mechanism’, four other activities are now being undertaken: capacity building in taxonomic research (including the management of natural history collections), valorisation of the archives and collections of RBINS, public awareness activities and scientific consultancy upon request by DGDC.
The Institute has thus far coordinated several individual Marie Curie postdoc grants, and also larger Marie Curie Training and Research Networks. At present, a large network trains six PhD students and four postdocs in nine different European countries around the subject: ‘From Sex to Asex: a case study on interactions between sexual and asexual reproduction’. The paradox of sex remains indeed the queen of problems in evolutionary biology. Sexual reproduction is widespread throughout the animal and plant kingdoms, but under certain conditions remains costly compared to asexual reproduction. The present project investigates the 'paradox of sex' from various scientific angles: genetics and genomics, taxonomy and phylogeny, ecology, mathematical modelling, etc. In training ten young European scientists in all of these techniques, the project contributes to strengthening the European Research Area. (Martens, 2005)
22
Partnership for the ‘Clearing-House Mechanism’
All parties to the Convention on Biological Diversity have the legal obligation to develop national activities for ‘clearing house mechanism’ (CHM, see Article 18.3 of the Convention). This mechanism aims at spreading national information on biodiversity and at favouring scientific and technical cooperation between countries, via the transfer of technologies and more generally by facilitating access to information. The latter includes access to collection data, publications, and other sources of information in particular for citizens of the countries of origin.
The Cartagena Protocol for Biosafety seeks to protect biological diversity from the potential risks posed by living modified organisms resulting from modern biotechnology. All Parties to the CBD have the obligation to develop a national biosafety clearing-house (BCH) to facilitate the exchange of information on living modified organisms and to assist countries in the implementation of the Protocol. So far, the RBINS, in cooperation with the Scientific Institute of Public Health, has organised four training sessions on the implementation of national biosafety clearing-houses to which representatives of 12 African countries participated.
The Institute has developed bilateral and regional CHM partnerships with developing countries. At present more than 20 African countries, the majority of them in the tropics, benefit from our support. This support includes: (i) setting up, developing and hosting of CHM websites, (ii) CHM webmaster training in Belgium, (iii) in-country CHM follow-up visits, (iv) regional and sub-regional CHM training, and (v) CHM work with regional and sub-regional organisations. (Franklin, 2001)
A striking prove of the usefulness of these activities is the fact that CHM web pages with concrete biodiversity information, such as monographs, biodiversity strategies and action plans, from these countries are intensively consulted by web visitors from all over the world.
Capacity building activities for the ‘Global Taxonomy Initiative’
The ‘Global Taxonomy Initiative’ (GTI) has been established by the CBD to address the lack of taxonomic information and expertise available in many parts of the world, and thereby to improve decision-making in conservation, sustainable use and equitable sharing of the benefits derived from genetic resources. The GTI is specifically intended to support implementation of the work programmes of the Convention on thematic and cross cutting issues such as alien invasive species and environmental assessments.
The aim of the RBINS taxonomic capacity building programme is to build synergies that not only promote scientific partnerships, collection valuations and optimise resource utilisation, but also envisages maximal supply of information and tuition. For these activities, the Institute cooperates with other Belgian institutions such as the Royal Museum for Central Africa and the National Botanic Garden.
The building of capacities to which many Institute researchers contribute targets both individual and institutional capacity building. The operational approach is twofold:
- a top-down tactic: an Institute taxonomist identifies important taxonomic impediments and tackles these by carrying out in situ research projects that incorporate explicit human and/or institutional capacity building in a partner country,
- a demand-driven bottom-up approach: interested parties from partner countries identify key taxonomic and/or collection management needs. Through an external call for

23
proposals, the GTI focal point and other Belgian institutes offer access to their expertise, collections and collection-based information to meet the needs.
As for the top-down tactic, three projects are currently running: (i) herpetological species richness and community structure on the Kaieteur National Park Tepui in Guyana, (ii) biodiversity assessment at three protected areas in Northwest Cambodia, and (iii) biodiversity and management of rodents and shrews in Eastern D.R. Congo.
With respect to the bottom-up approach, three calls have been launched so far and 23 proposals were granted (out of 90 received) for training visits in Belgium. These visits involved trainees from 15 developing countries, covering zoological and botanical groups such as insects, mites, sea cucumbers, snails, nematodes, reptiles, rodents, shrews, seed plants, true fungi, etc. In addition, a two-week sub-regional workshop, held in September 2005, in Thailand provided both theoretical and practical training on sea cucumber and rotifer taxonomy to 30 researchers and students from Thailand, Laos, Cambodia and Vietnam. (Samyn et al., 2006)
Conclusion
Many disciplines of biological science have a major role to play in the analysis and understanding of biodiversity and in the assessment of its importance to human society.
Taxonomy is the baseline biological discipline that underpins all others. The RBINS is in an excellent position to contribute to removing the ‘taxonomic impediment’. Some countries like Sweden did decide on a vast, long term taxonomic programme: the ‘Swedish Taxonomic Initiative’.
Why not in Belgium? Mobilising forces and injecting a specific budget could establish a Belgian taxonomic information backbone, that develops (i) training, (ii) an all species inventory, (iii) web based taxonomy, (iv) DNA barcoding, and (v) data modelling.
The 2010 biodiversity target will never be achieved if countries in the North don’t take up full responsibility in giving taxonomy the highly necessary human and financial resources.
References
Anonymous, 1976. Mission zoologique belge aux îles Galapagos et en Ecuador (N. et J. Leleup, 1964-1965). Résultats scientifiques. Troisième partie. Fondation Charles Darwin pour les Galapagos, Bruxelles, Contribution 201: 355 pp.
Baert, L., 1994. The Gnaphosidae of the Galápagos archipelago, their distribution and the description of the Galapagoan representatives of the genus Camillina Berland. Bulletin van het Koninklijk Belgisch Instituut voor Natuurwetenschappen, Entomologie 64: 9-24.
Communication Service & Publications Cell, 2003. RBINS. A natural history. Royal Belgian Institute of Natural Sciences, Brussels, 32 pp., col. ills.
Daget, J., J.-P. Gosse, G.G. Teugels & D.F.E. Thys Van Den Audenaerde, 1991. Check-list of the freshwater fishes of Africa. Cloffa 4. ISNB, Bruxelles, MRAC, Tervuren, ORSTOM, Paris, 740 pp.
David, P., M.J. Cox, O.S.G. Pauwels, L. Chanhome & K. Thirakhupt, 2004. When a bookreview is not sufficient to say all: an in-depth analysis of a recent book on the snakes

24
of Thailand, with an updated checklist of the snakes of the Kingdom. Natural History Journal of Chulalongkorn University 4 (1): 47-80.
De Bakker, D., L. Baert & P. Grootaert, 2004. Papua New Guinea: a biodiversity hot spot after all? Preliminary results on spider biodiversity in canopies of a tropical rain forest. Abstracts of the 16th International Congress of Arachnology, Gent, p. 53.
Decraemer, W., 1995. The Family Trichodoridae: Stubby Root and Virus Vector Nematodes. In: Developments in Plant Pathology, 6, Kluwer Academic Publishers, Dordrecht, Boston, London, 360 pp., 7 figs.
De Saeger, H., 1954. Exploration du Parc National de la Garamba, Mission H. De Saeger, Fasc. 1. Introduction. Institut des Parcs Nationaux du Congo belge, Bruxelles, 107 pp., 61 pls, 3 cartes.
Desender, K., J.P. Maelfait, L. Baert & P. Verdyck, 1999. Conservation on Volcan Alcedo (Galapagos): terrestrial invertebrates and the impact of introduced feral goats. Biological Conservation 87: 303-310.
de Witte, G.F., 1937. Exploration du Parc National Albert, Mission G.F. de Witte (1933-1935), Fasc. 1. Introduction. Institut des Parcs Nationaux du Congo belge, Bruxelles, 39 pp., 32 pls, 1 carte.
de Witte, G.F., W. Adam, A. Janssens, L. Van Meel & R. Verheyen, 1966. Exploration du Parc National de l’Upemba, Mission G.F. de Witte (1946-1949), Fasc. 1. Introduction. Institut des Parcs Nationaux du Congo, Bruxelles, 122 pp., 32 pls, 1 carte.
Dhuyvetter, H., E. Gaublomme, P. Verdyck, K. Desender, G. Mondor-Genson & J.-Y. Rasplus, 2002. Isolation and characterization of microsatellite loci in Galapagos caterpillar hunters (Coleoptera, Carabidae, Calosoma). Molecular Ecology Notes 2: 284-286.
Fiers, F., 1993. The laophontid genus Loureirophonte Jakobi, 1953 (Copepoda, Harpacticoida). Leopold III Biological Station, Laing Island, Contribution n° 256. Zoologische Mededelingen 67: 207-238, figs 1-13.
Franklin, A., 2001. Convention sur la diversité biologique: le rôle de l’Institut royal des Sciences naturelles dans le Centre d’échange belge et le partenariat. Ambassades et Consulats 2: 10-12, ills.
Franklin, A., M. Peeters & J.L. Van Goethem (eds), 2003. Ten years after Rio. What future for biodiversity in Belgium? Bulletin van het Koninklijk Belgisch Instituut voor Natuurwetenschappen, Biologie, 73 suppl.: 1-139, ills.
Grootaert, P., H. Meuffels, C. Daugeron, & Verapong Kiatsoonthorn, 2003. The intermingling of the Palaearctic with the Oriental fauna in Northeast Thailand: species radiation in empidoid flies. 20th Pacific Science Congress, Bangkok, 17-21 March 2003. Poster.
Kok, P.J.R., 2005. A New Genus and Species of Gymnophthalmid Lizard (Squamata: Gymnophthalmidae) from Kaieteur National Park, Guyana. Bulletin de l’Institut royal des Sciences naturelles de Belgique, Biologie 75: 35-45, figs 1-9.
Martens, K., 1997. Review: Speciation in Ancient Lakes. Trends in Ecology and Evolution 12: 177-182.
Martens, K., 2005. De paradox van seksuele voortplanting, of: waarom seks? Science Connection 9: 40-43.

25
Massin, Cl. & S. Dupont, 2003. Study on Leptoconchus species (Gastropoda, Coralliophilidae) infesting Fungiidae (Anthozoa: Scleractinia). 1. Presence of nine Operational Taxonomic Units (OTUs) based on anatomical and ecological characters. Belgian Journal of Zoology 133 (2): 121-126, figs 1-4.
Namiotko, T., K. Wouters, D.L. Danielopol & W.F. Humphreys, 2004. On the origin and evolution of a new anchialine stygobitic Microceratina species (Crustacea, Ostracoda) from Christmas Island (Indian Ocean). Journal of Micropalaeontology 23: 49-59, figs 1-5.
Roggeman, W., D. Huisseune, D. Vangeluwe, P. Vandenbulck & P. Vandousselare, 1995. Belgian Ringing Scheme Databank / Databank Belgisch Ringwerk / Banque de Données du Centre Belge de Baguage. Gaviidae to Anatidae. Studiedocumenten van het Koninklijk Belgisch Instituut voor Natuurwetenschappen 79: 1-222.
Salzburger, W., T. Mack, E. Verheyen & A. Meyer, 2005. Out of Tanganyika: Genesis, explosive speciation and phylogeography of the haplochromine cichlids in Africa. BioMed Central Evolutionary Biology 5: 17.
Samyn, Y., A. Réveillon, A. Franklin & J.L. Van Goethem, 2006. One year of taxonomic capacity building by the Belgian Focal Point to the Global Taxonomy Initiative. In Segers, H., P. Desmet & E. Baus (eds). ‘Tropical Biodiversity: Science, Data, Conservation’ Proceedings of the 3rd GBIF Science Symposium, Brussels, 18-19 April 2005 (this volume).
Segers, H., 2005. Geen beleid zonder informatie. In: Science connection. Speciale editie Dossier biodiversiteit. Brussel, pp. 7-9. / Segers, H., 2005. Pas de politique sans information. In: Science connection. Edition spéciale. Dossier biodiversité. Bruxelles, pp. 7-9.
Van Straelen, V., 1933. Résultats Scientifiques du Voyage aux Indes Orientales Néerlandaises de LL. AA. RR. le Prince et la Princesse Léopold de Belgique. Volume I. Introduction. Mémoires du Musée Royal d’Histoire Naturelle de Belgique. Hors Série, 222 pp., 181 figs, 91 pls.
Verschuren, J., 2005. Les parcs nationaux congolais depuis l’indépendance à maintenant 1960-2005. Parcs et Réserves 60 (4): 4-21, ills.
Wauthy, G., M. Leponce, N. Banaï, G. Sylin & J.-C. Lions, 1998. The backward jump of a box moss mite. Proceedings of the Royal Society of London 265: 2235-2242, figs 1-5.
Willenz, P. & S.A. Pomponi, 1996. A new deep sea coralline sponge from Turks & Caicos Islands: Willardia caicosensis gen. et sp. nov. (Demospongiae: Hadromerida). pp. 205-218, figs 1-22. In: Willenz, Ph. (ed.), Recent Advances in Sponge Biodiversity Inventory and Documentation. Bulletin de l'Institut royal des Sciences naturelles de Belgique. Biologie, 66 suppl.: 1-242.

26
Research, Collection Management, Training and Information Dissemination on Biodiversity at the Royal Museum for Central Africa
Gryseels, G.
Director of the Royal Museum for Central Africa, B-3080 Tervuren, Belgium
Introduction
The Royal Museum for Central Africa (RMCA), founded in 1898, has a triple function as a Museum, as a multidisciplinary Research Institute, and as a Centre of Information dissemination about Africa.
The Mission Statement of the RMCA reads as follows: “The Museum must be a world centre in research and knowledge dissemination on past and present societies and natural environments of Africa, and in particular Central Africa, to foster – to the public at large and the scientific community – a better understanding and interest in this area and, through partnerships, to substantially contribute to its sustainable development.”
The RMCA has four major scientific departments: geology and mineralogy, African zoology, history and agriculture & forest economy, and cultural anthropology. In addition to these scientific departments, there are also public services in the field of museology, education, publication, communication, information collation and dissemination, and METAFRO, a user friendly metadatabank on Central Africa. The RMCA has approximately 300 staff of which 80 scientists.
The RMCA houses the world’s most important collections for Central Africa, both in number and in quality, and is the custodian of this exceptionally rich and diverse cultural and natural heritage. The RMCA has a long tradition of quality research in the fields of social and natural sciences, and maintains close ties and partnerships with research institutes and government agencies throughout Africa and the world.
Through its educational and cultural activities as well as its exhibitions, the RMCA encourages the interest of the public at large and the youth in the cultural and natural diversity of Africa, its people, its societies and its environments. The RMCA also provides a large number of services to the public, government administrations and policy makers.
Contribution to knowledge on biodiversity
Collections
The RMCA has some of the largest and richest collections in the world on zoological species from Africa and especially Central Africa. They contain specimens of 950,000 fish, 240,000 reptiles and amphibians, 150,000 birds, 90,000 mammals, 6,000,000 insects and 1,000,000 other invertebrates such as worms, molluscs, spiders, mites and millipedes.

27
The curation of this collection is taken very seriously and its metadata are progressively made available as a routine activity by the staff. Recently, a type list of our bird collection and a type list of part of our butterfly collection appeared in print, and electronic versions were produced for our mite, reptile and amphibian types.
In addition, the RMCA has more than 58,000 samples of wood, making it the second largest collection in the world and by far the largest reference collection for tropical Africa.
These collections are valorised not only through scientific research, but also through their display at exhibitions both at the RMCA as well as at museums outside.
Research
Research in zoology focuses particularly on taxonomic, systematic and phylogenetic work on selected groups of vertebrates, insects and non- insect invertebrates. In addition, staff members are also involved in studies on biodiversity assessment, habitat fragmentation and deterioration, and nature conservation.
A large number of publications are issued every year: here follow some examples from recent years. A multidisciplinary publication on the terrestrial fauna of the Comoro islands, as well as an important book on the fishes of Lake Malawi. Also on lacustrine fishes, a paper demonstrating ichthyological relationships between Lakes Kivu and Victoria appeared in the journal ‘Science’.
Concerning scientific information for conservation, the RMCA is particularly renowned for its datasharing activities and expertise. Within the development of bio- indicators we developed expertise for e.g. spiders, millipedes and birds. Among applications, it can be said that we are famous for our expertise in fruit fly identification.
We participate actively and are a stakeholder in the world database FISHBASE, which proves daily to be a success story.
Departmental staff is also participating in scientific collaboration with national institutes and field work in several countries of Africa, such as Tanzania, Comoro Islands, Senegal, Kenya, Cameroon, South Africa, Malawi and DR Congo but also with international organisations or societies active on the African continent. RMCA scientists collaborate with colleagues nationally and internationally through formal and informal partnerships, participation in research networks and initiatives for sharing and standardizing information such as the two following, both EU funded: SYNTHESYS (a project of the ‘Consortium of European Taxonomical Facilities’, of which the RMCA is a member) and the European Network for Biodiversity Information (ENBI). The latter is considered as an important European contribution towards the worldwide GBIF initiative.
In the field of wood anatomy, the RMCA has considerable field experience in Senegal, Congo, Kenya, Zambia and Ivory Coast. The Laboratory for Wood Biology develops research projects in the field of ecology and physiology of African forests and the environmental information that is being stored in the pattern of tree rings. It is involved in research projects in the domain of art history, wood technology, plant systematics and ecology. It is the Belgian scientific authority for the identification of wood.
In addition, RMCA research in linguistics contributes importantly to our knowledge about biodiversity and about languages as a vehicle for transmission of knowledge on the environment. Local names for animals and plants indicate a detailed knowledge of ecology

28
and biology and of the use of animal and plant materials. Knowledge is often transmitted orally.
Our department of history conducts research on the history of national parks in DRC.
RMCA activities in Geographical Information System and cartography allow for the production of maps and integrated information systems on biodiversity especially in national parks.
Training
Every year, the RMCA contributes to the training of 50 to 60 scientists, more than half of them Africans, at postgraduate, specialised level in the broad fields of biodiversity research. The RMCA also operates the African Biodiversity Information Centre which provides fellowships to African scientists to study our collections and to receive training in our various domains of zoological expertise.
Information dissemination
Through its publications, websites, search engines and metadatabanks, the RMCA disseminates information to a wide audience of scientists, administrations and the public at large.
The RMCA also has a large number of educational and cultural activities. Every year, nearly 30,000 children participate in RMCA workshops on specific topics including conservation and biodiversity issues.
The RMCA has an active policy for the repatriation of information and data to countries of origin, especially Africa. A major priority of the Museum is the digitization of its collections and the computerization of databanks so as to ensure easier access to scientists worldwide, and to enable the development of ‘virtual museums’.
The GNOSIS Project (Generalized Natural Sciences online Spatial Information System), a joint project of RMCA, RBINS, the Royal Meteorological Institute and GIM, a private partner, and supported by the Belgian Federal Science Policy, allows for the integration of geological and biodiversity data in GIS-systems.
Scientific Services
The RMCA provides scientific support to CITES (for birds, reptiles, amphibians and, not to forget, for timber that becomes more and more an important issue for CITES), conducts various types of analysis for Belgian Government Agencies, participates in strengthening of research capacities through training and backstopping activities and provides a large number of scientific services. Its specialised library and documentation centres are open to scientists, students and the public at large.
At this symposium, RMCA scientists will present several papers that illustrate different aspects of this research, collection management, training and information dissemination on biodiversity issues.
A particular strength of the RMCA is its multidisciplinary organisation, allowing for close interaction between natural and social sciences, and between different types of natural sciences. In the field of social sciences, particularly good collaboration exists with the linguistics, archaeology, history and ethnographical divisions. In the context of sustainable

29
development, biodiversity is not only about plants and animals, but also about people. Good collaboration between social and natural sciences is therefore essential to have impact.
Outputs of biodiversity research
All too often, research on biodiversity is seen by outsiders as ‘ivory tower research’: conservation and collections should not be an aim in itself. Many practical applications can be derived from biodiversity research in very diverse areas such as medical application (search for vaccines), development of sustainable fish management approaches, pest management, legal and monitoring frameworks (e.g. CITES) or overexploitation issues.
Congo. Nature and culture
At the initiative of UNESCO, the RMCA organised during 2004 an exhibition “Congo. Nature and Culture” about the diversity of nature and culture in the DRC and the various dynamic relationships between man and nature. The exhibition went in avant-première to UNESCO HQ in Paris to coincide with an international donor conference to raise funds for the continuing protection of the Congolese world Heritage Sites. The exhibition is based mostly on RMCA collections and scientific expertise and runs from 23 November 2004 to 9 October 2005 at the RMCA in Tervuren. The exhibition focuses on the links between man and his environment. There are five main themes: the protection of natural diversity through national parks, the economic use of natural diversity, nature as a source of food and medicines, nature as a source of inspiration in immaterial culture, and the symbolic use of natural diversity.
In association with the exhibition, a catalogue was published with mainly contributions of Congolese scientists.
Final remarks
Research on biodiversity will remain a high priority at the RMCA. The research is well focused, of high quality and responds to demands of African institutes. In the future much greater attention will be given to the use of biochemistry tools and DNA-analysis, both through the development of in-house capacity and collaboration with other research institutes. Increased emphasis will also be given to multidisciplinary research to ensure its relevance for people and impact.

30
The collections of the National Botanic Garden of Belgium
Rammeloo, J., D. Diagre, D. Aplin & R. Fabri
National Botanic Garden of Belgium, Domein van Bouchout, B-1860 Meise, Belgium.
For almost two hundred years, the National Botanic Garden of Belgium has been active in botanical and latterly mycological research. The institute comprises a number of globally important holdings including an extensive herbarium collection with over 3,000,000 specimens, a living collection of over 16,000 taxa and a library with 200,000 volumes. Over the last century, research has focused on tropical ecosystems, especially the palaeotropics of Central Africa, although extensive collections from all biogeographical areas are maintained.
Collections have a pivotal role for the three main mission criteria of the garden, namely: research, education and conservation. Limited space in this paper dictates that we can only describe briefly the main attributes of our collections and not the way they fulfil their role in these criteria. More details, however, can be found on these areas by consulting our website: www.botanicgarden.be.
This paper provides a historical account of our collections, but also describes how the Institute is using recent advances in technology.
The herbarium collections
The history of the herbarium of the National Botanic Garden of Belgium (formerly, Jardin botanique de l’Etat) is best divided into two main periods. This is because the institute underwent a number of contrasting organisational stages, evolving from a joint-stock company to a national research institute. Consequently, the account outlined below is set in chronological order for the reader to appreciate the changing times of the state, institution and key staff members.
The Joint-Stock company (1826 - 1870)
The early history of the garden and its collections have been studied in detail by Diagre, D. (2002a, b, 2002-2003 & Diagre-Vanderpelen, 2006) when preparing his Ph.D. in History.

31
As strange as it may sound in modern Europe, the Brussels Botanic Garden was first created, ruled and sponsored, by a handful of ‘Belgian’ bourgeois in 1826. The term ‘Belgian’ has been placed in inverted comas since it refers to the modern-day country but, when the garden was founded, Belgium was (and for a further four years) a part of the Netherlands ruled by King Wilhelm of Orange.
In the 19th century, most modern cities had a botanic garden. Sciences were extremely fashionable, especially botany, amongst the enlightened bourgeoisie. The Ecole Centrale created by the French revolutionary government in Brussels at the end of the 18th century had formerly established such a garden with a couple of s dedicated to teaching. However, less than a decade after opening, it closed by orders from Emperor Napoleon. After which the local administration of Brussels maintained the so-called “botanical garden”. As time passed, the city of Brussels had to face more important demands such as overcrowding and lack of space. This along with ever burdening maintenance costs of the garden meant that the garden in this incarnation was doomed.
Fortunately for the garden, bourgeois P.A. Drapiez, a French chemist and former officer of the Grande Armée, became interested in the plight of the garden. Drapiez was no doubt inspired by the botanical model set by the famous Jardin des Plantes in Paris, a botanical science and horticultural research centre for new and useful plants. At this juncture in history, the bourgeoisie, like Drapiez, were the leading class and, therefore, had to secure the future of the nation by supplying new products and food and create industrial opportunities. In the process, the bourgeoisie would also demonstrate its deep interest in ‘God’s Creation embodied in Nature’.
Consequently, a small team of bourgeoisie chose a ‘Joint-Stock Company’ solution, considered the modern way for an emerging leading class. King Wilhelm approved the creation of the company, and decided the Royal Herbarium (the “Rijksherbarium”) would be settled in Brussels (Smit, 1979). This capital city of the Southern part of the then Netherlands Kingdom was now on route to become a real centre of gravity for botanical study.
In 1829 and 1830, the will of national independence for this part of the Netherlands was growing fast. In September 1830, revolution broke out, culminating in Leopold I being crowned the first King of Belgium. Unfortunately for the garden, however, a year previously, C.L. Blume, Director of the Royal Herbarium in Brussels moved to Leiden (the Netherlands) with precious Asian plant collections. As a result, the new European state emerged without a national herbarium.
During the struggles of independence, the site of Brussels Botanical Garden became a battlefield and, as a result, looked miserable. It never fully recovered until 1870, with most of this intervening period consumed with desperate efforts to find finances for the new nation. In such a situation, creating a new herbarium was definitely not a priority.
The Garden dedicated itself to ‘naturalist entertainment’ for the Belgian bourgeoisie, in order to earn some money. Where possible, it tried to show its scientific side and consequently these efforts were rewarded when it bought, inherited or was given some dried herbarium collections. The collections represented the General Herbarium of Nyst, Mexican Herbarium of Galeotti, Brazilian Herbarium of Claussen, some plants collected by Dr. Fifechet in Africa and others collected in Japan by C.-L. Blume. The most impressive collection was purchased by the board of the company to the widow of H. Galeotti (1814-1858). Born in France, Henri Galeotti moved to Brussels after the Belgian revolution. There, he soon revealed himself as a talented geologist and was hired to extensively explore Mexico by the Vandermaelen brothers, who were not only rich but fanatic amateur scientists. Between 1835 and 1840, Galeotti travelled through Mexico. During this period, he collected 7,297 specimens of which

32
4,620 were deposited in the Brussels herbarium in 1875. The remainder of the collection was alleged to be elsewhere in Paris, Kew and Vienna. However, we can account for 2,000 specimens that were exchanged with Reichenbach for African dried specimens in 1865.
Back in Belgium, Galeotti alone, or in collaboration with other botanists, undertook the task of editing a multitude of plants that he brought to Europe: Ferns (with M. Martens), Orchids (with A. Richard), and various other groups, while Cacti were studied by M. Scheidweiler between 1838 and 1839.
State Institute (1870 - 1895)
Despite the acquisition of important collections, the Botanic Garden in Brussels never received great credit for its scientific abilities, nor achieved commercial success. Despite this, and despite the fact that large amounts of money could have been made through its development as real estate, the bourgeois of Brussels chose to sell it to the Belgian state in order to protect the superb landscape. As part of the deal, the shareholders demanded that botanical activities had to be maintained and expanded on the site. Belgian botanist and politician, B. Dumortier battled in government Chambers to secure the future of the institution. Dumortier once described the future he wanted for the newborn “Jardin botanique de l’Etat” as a garden to emulate that of the world famous Royal Botanic Gardens, Kew, in England.
At this period in history, the Garden needed a strong leader who would take the Institute forward. This occurred in 1876, when François Crépin became director. At that time, the herbarium collections were divided in three sections with each section divided in two parts, one for phanerogams and the other for cryptogams. The herbariums were: “Herbier Général”, “Herbier d’Europe” and “Herbier Belge”.
[a] “Herbier Général” (general herbarium) had very good credentials; it comprised the famous Brazilian Herbarium created by von Martius. This magnificent collection had been bought by the Belgian government in 1870, thanks to B. Dumortier. In 1885, Herbier general comprised of 75,000 species and 400,000 specimens representing phanerogams and cryptogams. The phanerogams mostly originated from the von Martius collection (25,000), Asia (20,000) and Mexico. The Cryptogamic element of the collection was highly prized with an abundance of European Mosses represented. Libert, de Limminghe, Coemans and Westendorp, from Belgium and Rabenhorst, Schaerer, Hepp, amongst others, were major sources of material for the Botanic Garden. Other collections were given, bought or exchanged to the institution. Crépin donated 17,821 vouchers of his personal collection and commented that the “Herbier général” in Brussels had to be regarded as one of “les plus considérables”. Visits by the most famous European botanists at the end of the Century were testament to the quality of the collection. The Brazilian plants of von Martius collections, for example, were essential for the authors of Flora Brasiliensis (von Martius 1840-1876), who visited Brussels on numerous occasions and loaned specimens. Furthermore, thanks to that acquisition, two Belgian botanists, A. Cogniaux and E. Marchal, were able to collaborate with the team of specialists dedicated to that huge and painstaking work.
[b] “Herbier d’Europe” (European herbarium) followed the same path as the “Herbier Général”, expanding into a very rich collection. The early death of the Baron O. de Dieudonné of Leuven, and the subsequent gift of his superb European collection by his widow, gave an extra opportunity to develop a European herbarium in Brussels. The dried specimens of de Dieudonné were reputed to cover 8,685 species out of the 10,557 mentioned by Nyman. During his short life, the amateur botanist from Leuven had a huge project in mind, an exhaustive European Flora, and had thus created a net of contacts throughout the

33
continent. Soon, parts of the “Herbier Crépin” were added, as well as others from the “Herbier Dumortier”, who died in 1878. In 1885, Th. Durand was confident enough to claim it was “l’un des plus riches connus (…) presque complet”.
[c] “Herbier belge” (Belgian herbarium) is particularly important for a national institution. Furthermore, the Belgian flora was actively studied by flocks of amateurs and university students. Once again, François Crépin, who wrote the “Flore de Belgique”, gave a helping hand to the growing herbarium by donating the specimens used for preparing his flora. This was followed by herbaria donated by specialists of the national flora, such as, Dumortier, Lejeune, Nyst, Libert, Coemans, Westendorp, De Cloedt and Martinis.
Numerous additions were made during the years that Crépin was director of the garden. Most were minor gifts, some were bought by the garden. A few deserve mention: the collection of Decaisne (Paris), plants from Costa Rica sent by H. Pittier, and the entire dried collection of A. Cogniaux, a well-known taxonomist who was a major contributor to Flora Brasiliensis.
The Congo era (1896 - )
Some historical landmarks have to be outlined to give an understanding of the very strange situation the “Jardin botanique de l’Etat” was to face at the end of the 19th century. As strange as it may sound, Belgium had no real colonial possessions prior to 1908. From 1886, King Léopold II ruled, independently, huge territories in Central Africa (“Etat Indépendant du Congo”). The African state had no parliament and was managed by a handful of secretaries of state directly under the personal authority of King Léopold. This proved an extremely expensive enterprise depleting Léopold’s personal fortune. Administrators exploited rubber producing plants and the ivory trade in an attempt to stem the losses, while an urgent need for money and new ideas about colonial aims made the search for new products essential. Foods, seeds, fruits, oil, bark, fibres, wood, etc were identified and scrutinized by experts.
Fortunately for King Leopold, Belgium had experts at hand, the scientists of the State Botanic Garden in Brussels. Although, interestingly, any benefits that resulted from their efforts would go to a state other than Belgium, the “Etat Indépendant du Congo”. In reality, this benefited the garden enormously, researchers enjoyed the huge amount of dried specimens sent from Africa while Congo received data about which plants to grow. Despite this provision of knowledge by the scientists, the herbaria collected in the Congo were only on loan to the garden. Despite this, they were deposited in a special section known as the “Herbier du Congo”.
Although the first dried plants arrived from the Congo state in Brussels in 1889, it was not until 1895 that a formal agreement was made with the garden. Although the text of the agreement has never been found, various archives provide outstanding clues about it. Collections were carried out by professionals hired by the administration, enthusiastic settlers, or even soldiers and administrators. The samples were sent to Brussels, where they were deposited in the “Herbier du Congo”. There, Théophile Durand and Emile De Wildeman, both scientists in the Botanic Garden, would identify and describe the plants when necessary. In the mean time, administrators of the Congo state remained curious about how results of such studies would launch a new era of prosperity for the Congo state.
In 1896, dried specimens from Congo totalled 12 sets of sheets. Twelve years later, this value had grown to around 1,200 and, by 1930, botanist W. Robyns claimed that an astonishing 100,000 vouchers had been deposited in the herbarium.
In 1908, the most active collectors were J. Gillet (6,000 sheets), E. and M. Laurent (3,500), L. Pynaert (3,000), A. Dewèvre (2,000) and F. Seret (2,000). Consequently, knowledge of
34
Congolese plants increased dramatically, thanks to identification and description skills of T. Durand and De Wildeman.
This is demonstrated by the publication of “Etudes sur la Flore du Congo” (1896) by Durand and H. Schinz (Zurich), which described 957 species, whereas 12 years later, 3,546 species were known to exist (T. Durand and H. Durand). The activities of De Wildeman and T. Durand were not only confined to plants since, between 1899 and 1914, important work describing African mycology were also published based on material of A. Dewèvre and H. Vanderyst. These studies looked at more than 450 taxa of which approximately 400 were new for science. Further, on the advice of Maurice Beeli, who made many systematic studies of African fungi, Mrs. Goossens-Fontana started collecting African fungi in 1919, adding notes and over 900 water-colours. This remains one of our most important collections of macro-fungi from tropical Africa and is deposited in the garden’s herbarium.
To complement the expanding knowledge of African plants and fungi, a large number of publications were produced. In fact, African-centred activities almost overshadowed all other activities of the State Botanic Garden until the outbreak of the First World War.
In 1916, the private herbarium of Alfred Cogniaux, comprising 5,251 specimens and containing 1,263 Cucurbitaceae, 3,997 Melastomataceae and 11 Orchidaceae was donated. The number of recorded Orchidaceae specimens from his private collection did not correspond to the actual number in the herbarium; therefore, the remainder were either not recorded at the time or acquired at a later date.
The Martin Martens collection (Catholic University of Leuven) was given by Pierre Martens in 1932 (it contains inter alia many Galeotti specimens).
The herbarium of the Congo was transferred to the Garden in 1934 from the now African Museum in Tervuren. The collections including inter alia collections from Corbisier-Baland. Today, only wood samples were conserved at Tervuren, in the ‘Xylotheca’, now one of the most important Xylothecas in the world.
The most intensive period for botanical exploration of the Congo occurred between 1935 and 1970 as a result of two institutes, the “Institut National pour l'Etude Agronomique du Congo” (INEAC) and the “Institut des Parcs Nationaux du Congo”. INEAC’s botany department undertook a global botanical inventory, along with several research stations (Luki, Mulungu and Yangambi). It was carried out by numerous collectors, such as Gilbert, A. Léonard, J. Léonard, Pierlot and Jean Louis. The latter assembled what is considered the best collection from the Congo Basin between 1935 and 1939, comprising 7,000 specimens represented by two sheets each with very complete labels. The “Institut des Parcs Nationaux du Congo”, on the other hand, made systematic explorations of the National Parks (collectors: inter alia de Witte, de Saeger, Lebrun).
In the 1990s, a number of significant acquisitions were added to the herbarium. The late Mrs. N.E. Nannenga-Bremekamp bequeathed a collection of 14,296 specimens of Myxomycetes in 1996. The bryophyte herbaria of J.L. De Sloover (50,000 specimens) and brother Onraedt (20,000) were acquired in 1998. Both collections were mainly from tropical origin, mostly Africa. In 1999, ca. 90,000 specimens from the Carnoy Institute (herbarium LV) were donated by the Catholic University of Leuven, with inter alia Schimper collections from Ethiopia, the original herbarium of Charles Baguet (historical specimens from Belgium) and the mainly American collection of the rev. J. Wibbe.
In 2000, the bryological herbarium of T. Arts (more than 35,000 specimens) and the personal bryological herbarium of I. Douin (about 50, 000 specimens) were acquired.

35
The total number of herbarium specimens deposited at the National Botanic Garden of Belgium is currently estimated at 3,000,000, of which about one third is from Central Africa. Although an accurate estimate of nomenclaturial type specimens is not available for the Central African flora, it is estimated to surpass 20,000. The General Herbarium is also thought to contain as many types, especially from the Neotropics. As a conservative estimate, a total of 50,000 nomenclaturial types probably exist for the phanerogam herbarium. The collections at Meise also include 500,000 specimens of bryophytes and 140,000 mycological vouchers including the largest documented collection of African macromycetes in Europe.
Besides the herbarium specimens, wood samples, fruits, seeds, slides, water colours, black and white drawings make up one of the most important botanical and mycological collections in the world.
The living collections
The extensive collections of herbarium records at the National Botanic Garden of Belgium are matched by an incredibly diverse ex-situ collection of living plants. Worldwide, botanical gardens house an estimated 80,000 species (Wyse Jackson et al. 2001), between 18-34% of the world’s total vascular plant flora according to current estimates. The National Botanic Garden of Belgium holds one of the largest living plant collections in Europe, with over 13,500 species (16,800 taxa), contributing an important role in education, conservation and scientific discovery. This collection has grown tremendously over recent decades.
With such an influx of botanical wealth, it is important that curators know how a collection is developing. An important aspect of this is tracking the annual number of total species, new accessions and deaths, both in the collection as a whole and for certain key groups. Despite these holding statistics being of great importance for collection development, data of this nature is rarely made available (Rae, 2004). At Meise, the annual turnover of incoming and dying plants is high. A rare documented case study of plant turnover at the Royal Botanic Gardens, Edinburgh, shows an average annual loss of 1,738 accessions (600-700 taxa) over a 13 year period, compared with average annual recruitment of 1,000 accessions. Therefore, on the face of it, the Edinburgh collection was in decline (Rae, 2004).
A good percentage of this apparent decline may be attributed to curation protocols. Standard practice in many gardens is to record incoming seeds with a number. Therefore, if seeds fail to germinate, death is recorded. Observations at Meise have shown that seed quality can be extremely variable. This is none more so than with those obtained through Index Semina, where seeds rarely undergo viability testing prior to dispatch. On average, 50% of all seeds exchanged in this way fail to germinate (De Meyer, pers. comm.). Therefore, germination studies comparing randomly selected taxa from a range of Index Semina would be a valuable area for future research.
At Meise, collection statistics are increasingly an important tool of curation. Over the 200 year history of the garden, the recording of information (and its retention) has been variable. As a result, it is not possible to construct an overview of the evolution of collections since the establishment of the garden. Fortunately, over the last few decades, the use of information technology has provided a much easier platform for curators to analyse their collections and evaluate areas like plant death. Furthermore, modern databases not only provide fields for plant death but also allow input of information about the cause of death: the database ‘BG-Base’, for example, provides 3 fields for the actual plant death and 19 fields on the causes of death (?). Feedback of this nature to horticultural staff can be extremely useful for improving growing techniques.

36
The history of the living collections at the National Botanic Garden of Belgium, between 1826 and 1912, has been documented in a doctoral thesis by the second author of this paper (Diagre-Vanderpelen, 2006). His study showed that the classical ways of enriching the living collections of the garden (then situated in Brussels) was the same as for other European botanic gardens, namely: collecting from the wild (especially the tropics) and exchanges. Plant material from exchanges arrived via Index Semina from other gardens, or as gifts or purchases from amateur and professional growers.
Despite constant plant recruitment at the former Brussels location, collection development was hampered by lack of space. Development and size of any living collection is restricted by the availability of resources. However, things changed with the garden’s transfer to the Meise estate (from 1938), providing a fantastic opportunity of new infrastructure to increase the collections. Spacious glasshouses and parkland totalling almost 92ha were suddenly at the curators’ disposal.
The first glasshouses at the Meise site were built just before World War II and, in that period, the conifer collection was established (although, in general, the outdoor collections developed much later than those indoors). The war halted the development of the Garden and its collections since the estate was utilised as an exercise camp for military vehicles, the activities of which lead to soil compaction (still evident today). Other areas of the garden became potato fields.
Due to the war, the completion of vital glasshouses, like the monumental Plant Palace complex, had to wait until 1958, but, since this time, the botanical collections have flourished in a range of specifically designated areas.
The indoor collections are divided into four main areas. The focus for the public is the Plant Palace containing both tropical and sub-tropical glasshouses. They comprise over 6,700m² of floor space, divided into 13 inter-connecting glasshouses maintained at different climates so that the major biomes of the world can be represented. Located in the centre of the Plant Palace and at a nearby location are collection houses totalling 4442m². These house the majority of the indoor species, which are largely grouped according to systematic groups and contain internationally important research and conservation accessions. The propagation glasshouses cover an area of 300m² and, finally, the orangery houses used for over-wintering sub-tropical specimen plants covers 500m².
The outdoor collections have a number of important areas; the Herbetum is a garden of herbaceous perennials and annuals arranged in systematic beds. It provides the public with an awareness of the relatedness of plants with one another. It contains 111 families comprising 1,263 species. The Fruticetum is laid out in a similar way, but contains the woody members of the plant kingdom. It has 1,240 species divided into 91 plant families. The earliest botanical gardens in history were established for medicinal purposes. In recognition of this, Meise has its own medicinal garden with 285 species and 85 families. Staff is in the initial stages of developing our large 18th century walled garden. It is anticipated that this will provide an area to grow plants that can not be grown elsewhere in the garden, such as those that are not fully hardy without protection and others that enjoy well-drained soil.
There are a number of important collections to be seen in the garden. The Quercus collection has grown recently to 50 species, whereas the Acer collection boasts 36 species and 50 different cultivars. Magnolias do well in our Garden and we have 40 different species, whereas the contrasting growth form of Sempervivum are represented by 70 species and over 200 taxa, including Belgium’s own endemic variety of S. funckii.

37
The entire living plant collection at Meise is databased in an in-house program called LIVCOL, a Progress based database that is extremely flexible, allowing the retrieval of data to great number of specific requests. For the time being, this database contains 16,800 currently living plant taxa, but over 33,800 taxa in total. It is in daily use and updated to track collection and taxonomic changes. An extract of this database can be consulted on internet, permitting access to our holdings to scientists from around the world. The number of fields that can be consulted online is limited, but important data such as origin of material can be viewed.
One of our most important conservation collections are wild beans (Phaseolineae). This collection has been recognised by the International Plant Genetic Resources Institute (IPGRI) as a base collection. The collection covers a very wide genetic diversity. It currently includes 1,687 accessions representing 205 taxa. The collection can now be searched on the Internet via the garden’s website ( www.botanicgarden.be).
Besides living plants, the garden holds an extensive seed bank collection. Three types of conservation protocols are in use: a protocol for short-, middle- and long-term conservation, the latter being used for wild-collected native species and the Phaseolineae. Until 2004, a printed seed catalogue was sent to over 500 correspondents each year. In 2005, the catalogue became available in electronic format and hard copies are sent only if specifically requested. On average, around 600 seed samples are requested and dispatched every year.
The Garden is also a collaborator in the European Native Seed Conservation Network (ENSCONET), an action funded by the EU. The project aims to protect the continent's most endangered plant species. Nineteen botanical institutes from twelve EU member states, covering five of Europe’s six biogeographical regions, have joined the network to coordinate and enhance their activities.
The network is organised into five activity areas, of which Meise contributes to three: seed collection, curation and data management. The main priorities for the network are the completion of a baseline inventory of species represented in European seed banks, and their conservation status in the wild. A 'gap analysis' of this inventory will serve to identify the priorities for future seed collecting programmes. The material in storage will be distributed among the members in a coordinated fashion. Within five years, the network expects to have shared and spread good practice, developed common databases and undertaken foresight studies. Affiliation to the Network aids the gardens fulfilment of Targets 8 &16 of the Global Strategy for Plant Conservation (GSPC). Opportunities are available for staff exchanges, in order to increase their skills in seed collection and curation.
The living collections have been documented in a number of cases by herbarium material (about 7,000 vouchers) and by photographs. Photographs have been digitised and will become available as a link when consulting our holdings on the internet.
One of the most important elements of any living collection in botanic gardens is the correct identification of material. One of our botanists, F. Billiet, spent nearly her entire career on controlling the identifications and documenting the indoor living collections. Currently, around 38% of the collection has been verified.
Until 2005, the garden made use of an in vitro facility. Late in 2005, the facility was closed due to staff shortages and a poor success rate in transferring plants to in vivo conditions. Therefore, human resources were transferred to more beneficial work.
Good plant labellings that carry all vital information (including Dutch and French vernacular names, when available) are imperative for any botanical garden. Our engraved labels at Meise

38
contain bar-codes that allows electronic recording of data. This technology permits the easy control of holdings avoiding tedious typographical mistakes.
In 2006, the living collections will also be consultable via the Plantcol website ( www.plantcol.be). The Plantcol project aims at making the holdings of the most important Belgian plant collections available on the web. As a result of the project, an e-kiosk will be available in a number of gardens permitting the visitor to print a map with the location of the plants they are looking for highlighted. The collections at Meise will be one of these.
Plant collections at botanical gardens are often extremely varied, representing decades of plant acquisitions and can contribute enormously to conservation. The analysis of plant holdings, in order to find out which groups are important on an international level, is very important. Our curation staff receives increasing demands for material for DNA analysis from around the world. One reason for this is that our accessions comprise many species that are not, or are rarely, obtainable elsewhere.
The Garden comprises two plant families that deserved special attention: the Rubiaceae and Acanthaceae. The Rubiaceae research collection of living plants is worthy of special note: it contains 370 accessions composed of 238 different taxa, of which 65% have been collected from the wild, making our garden one of the leading institutes studying this important family.
The Meise garden is a member of Botanic Garden Conservation International (BGCI). As such, the plant holdings are communicated to this organisation and injected in the global plant database. This and other activities of the garden insure its commitment to the Global Partnership of Plant Conservation (GPPC), specifically to targets 1, 3, 7, 8, 10, 14 and 16 of the GSPC.
In 1995, the section Museology and Education was created. In addition to it roles in increasing the educational experience of visitors to the garden, it has also played a crucial role in organising the renovations of the glasshouses. This provided the opportunity to present the living plant collections in new and innovative ways. The glasshouses have been divided into the major biogeographical regions of the world, including desert, Mediterranean, subtropical, tropical, tropical montane and tropical monsoon, of which some are still under development.
With almost 17,000 taxa, the collection of the garden is one of the major resources for plant biodiversity in the world, therefore hosting a wealth of research, conservation and educational opportunities. The garden is still evolving and, fortunately, with such a large site, space is currently not a limiting factor.
The Library
In order to research and accurately maintain both herbarium and living collections, an excellent library facility is essential. Fortunately, the National Botanical Garden of Belgium excels in this area as well, with over 200,000 volumes. The library holds a varied collection of books, manuscripts and volumes of antiquity.
The ‘precious reserve’ contains ca. 2,500 volumes (2,000 titles) and includes one incunabula, a treatise on agriculture by Pietro de Crescenzi, dating from 1486. Other notable works include around 100 titles from the 16th century, 200 from the 17th, and 1,500 from the 18th. The library has the majority of the works by Pierre-Joseph Redouté, and many ‘nature printed’ iconographic works. Within a Belgian context, this valuable collection is complementary to the precious plant books kept in the Royal Library in Brussels.
The basic works, such as systematics and taxonomy, horticulture, general botany, the history of botany and floras from all regions of the world, amount to 45,000 monographs.

39
Furthermore, 1,300 theses, 30,000 reprints and 4,000 leaflets contribute to the collections. Every year, the library acquires about 800 tones/tomes? As well in the herbarium as in living collections, Central Africa is well represented.
The number of journals totals 4,000 and consists of over 8,000 titles. This means that, on average, each journal has changed name once during its life span. The library currently subscribes, or has on exchange with other scientific institutes, around 1,300 titles. Besides holding the major international botanical journals, the library is also well supplied with ‘grey literature’ for the Belgian territory: newsletters from local associations or regional journals edited by plant lovers. The oldest serials stem from the late 18th century. Every year, 3,000 serial issues are received.
The library also holds a collection of 60,000 iconographic plates and many manuscripts, of which only 200 are currently catalogued.
Among the world's most important botanical libraries are those of New York and Missouri. However, at European level, the botanical library at Meise is almost as important as the collections in Geneva, Berlin and Kew and as important as Leiden’s.
The library operates a ‘closed’ storage system. Visitors have to order books in the reading room and, therefore, do not have free access to the physical book collections. A few exceptions to this rule occur and some books can be found in the reading room; these include a number of reference books, current serial issues, books acquired during the previous month, and publications of the garden.
One of the strong points of the library is that all titles prior to 1988, including the titles of journal articles, have been card indexed (representing 3,500,000 cards). These excerpts are extremely useful, especially for grey literature and the lesser known journals. The library has been a valuable resource for the taxonomic standard works of Stafleu and Cowan, “Taxonomic literature” (1976 - 1988).
In 1993, the library switched from a manual system to an automated library catalogue, using the VUBIS Original database system. Since this date, all books have been re-catalogued, bar-coded, and re-grouped into the present system of 80 categories. All books with spines in bad condition were restored. Similar work continues for the scientific journals. The alphabetical order system, once adopted for journals, has been discontinued; title changes have been chronologically assembled, while journals which are no longer current have been re-grouped to increase space for the ongoing titles.
In 2006, the library will undergo a significant development when the catalogue will switch from VUBIS Original to the VUBIS Sm@rt system. VUBIS Sm@rt is a ‘next generation’ platform that will increase library automation and make work easier. It has an intuitive Windows interface, flexible data management, extensive range of functionalities, and a Web OPAC (Online Public Access Catalogue) system. After the transfer to VUBIS Sm@rt, our complete catalogue will become available for consultation via our website and the common website of the Belgian Federal Libraries.
The Botanical Museum
Over the two hundred years history of the garden, a great deal of material has been amassed with great historical importance. The garden has a large quantity of items originating from the former Brussels garden, where a museum once existed. Unfortunately, the Meise site currently lacks an adequate exhibition space for this material. The museum collections are conserved as a reserve, in the hope that a suitable exhibition hall will be situated in the Meise

40
estate. The material contains extremely important items including a high number belonging to the highly important von Martius collection. In addition, there are important collections of wood. Almost one hundred years ago, the Brussels museum exhibit, made by C. Bommer, was considered a model museum of its kind in Europe. We hope that this acclaim will be reached again in the near future.
Research on the collections
One of the major purposes of the collections described above is research. The herbarium and living collections provide material, while the library provides us with the information for scientific study. Meise is extremely fortunate to have extensive collections of both cryptogams and phanerogams. Collections are well represented by local Belgian, and Western European flora. Internationally, we house a wide-range of specimens from all regions of the world with an emphasis on tropical Africa. Research on these collections is undertaken by our own staff, visiting scientists and by ca. 30.000 specimen loans per annum.
Modern information technology is aiding the transfer of knowledge around the globe. Digitisation of specimens allows researchers to access specimens before seeing them de vivo and, as a result, the requests for vouchers have reduced, while transfer of research information has increased. For further details of our research program, please refer to our website that has details in English.
Publications
The garden has a long standing tradition in publication. Two journals are currently published: “Systematics and Geography of Plants” (formerly “Bulletin du Jardin botanique national de Belgique”), which has a strong emphasis on tropical floras, especially from Africa, and “Dumortiera”, a journal devoted to Belgian floristics.
Besides these journals, the garden edits two series, “Scripta Botanica Belgica”, publishing miscellaneous botanical information, and “Opera Botanica Belgica”, printing monographic work and results from deep scientific research.
The garden publishes several floras. The “Flora of Belgium” (Lambinon et al. 2004) is distributed in French and Dutch. This flora is regularly updated, and has gone through eight editions in 33 years. The “Flore d’Afrique centrale” is a phanerogamic flora. Currently, 60% of the known flora of Central Africa has been published. Currently, our researchers are concentrating their efforts on monographic work. However, it is hoped that the flora will again increase dramatically, with the encouragement of counterparts from Central Africa, aided by our research team.
Collaboration with other institutes is extremely important. Recently the Garden, aided by the British Bryological Society, re-edited the revised E.W. Jone’s “Liverwort and Hornwort Flora of West Africa”. While not confined to plants, the “Mushroom Flora of Tropical Africa” (formerly “Flore illustrée des champignons d’Afrique centrale”) will have a wider scope than the former flora. It remains the only initiative of this kind for Africa.
A constant role of our research staff is the production of distribution maps of plants and fungi. The Belgian flora has been mapped in detail and the progress and regress of species documented over various Atlas editions. Maps of African flora (Bamps, 1994) have also been produced with 1,500 species published to date. Three series of maps for fungi have been produced, with the selection of the species determined through European collaboration, in order that results could be immediately used in a wider context.

41
The garden has a very rich list of publications, more than could possibly be cited here; therefore, the reader is encouraged to visit our website for a complete list of publications ( www.botanicgarden.be/SCIENCE/EDITION/index).
The electronic era
The developments of the internet have changed dramatically the way we communicate and access knowledge. Our institute exploits the possibilities of this fast evolving medium. The Garden is involved in a range of projects, the results of which can be, or will be, found via our website.
Digitisation has given access to our living collection and wild Phaseolineae databases to the public via the Internet (as described earlier in this paper). Currently this is only accessible through our website; however, from late 2006 on, it will also be available on the PLANTCOL website linking all important ex-situ collections in Belgium. This will increase communication with other scientists around the world and, indubitably, the number of requests for material for molecular analysis.
The entire mycological herbarium has been databased (with the exception of the lichens) and key fields displayed on the Internet. For other collections, digitisation is in progress, using BG-Base modules for conserved collections. Using a single herbarium software program for all groups has obvious advantages, despite initially requiring many adaptations to the software package.
The herbarium is participating in a major international project, the African Plant Initiative ( www.ithaka.org/aluka), funded by the Andrew Mellon foundation. The aim is to digitise all nomenclaturial type specimens of the African phanerogamic flora. Our institute houses over 20,000 type sheets, which need digitising alongside the ongoing databasing of collections. The herbarium also serves other Belgian herbaria keeping nomenclaturial types of African origin that will also be incorporated in the API project.
Within the API project, other areas are being researched, such as the collection of ethnobotanical knowledge from herbarium labels of (initially) two families, the Cucurbitaceae and Caesalpiniaceae, and the scanning of African mycoflora watercolour drawings and colour slides of all published specimens which have also been databased.
The garden is also collaborating with the Global Biodviversity Information Facility (GBIF) in a seed money project making a virtual worldwide herbarium of myxomycetes. Indeed, the garden holds one of the most important collections of this group in its herbarium.
In collaboration with the herbaria of Munich, Leiden, Missouri Botanical Garden, University of Wisconsin, Reference Centre on Environmental Information (CRIA), State University of Campinas, Brazil and BeBif (Belgian Biodiversiy Information Facility), the garden made a prototype image server for the von Martius collection and Flora Brasiliensis. The demand to continue this European Network for Biodiversity Information (ENBI) funded project (WP 13) is very high especially from South American researchers.
Information on the flora of Shaba (Democratic Republic of Congo) is available via our website.
A searchable website on taxa and specimen information for selected Albertine Rift species namely: Birds, butterflies (Papilionidae (Papilio, Graphium); Nymphalidae (Charaxes), flowering plants (Rubiaceae) and lacustrine fishes (Cichlidae) has been created. This was a collaborative project between our institute, The Royal Museum for Central Africa and Royal Belgian Institute for Natural Sciences, with financial support from ENBI-WP13 and technical
42
support from the Belgian Biodiversity Information Facility (‘BeBIF’, now integrated in the Belgian Biodiversity Platform).
One of the gardens’ journals, “Systematics and Geography of Plants”, will be completely digitised in 2006 and placed on the internet, where it will be globally searchable more than one hundred years after its first edition. As this journal has a strong African (especially central African) theme, researchers from one of the hotspots of tropical biodiversity will finally be able to access information on their own flora.
The Meise garden is also leading a project to restore a botanic garden in the Democratic Republic of Congo, south of Kinshasa. One of the aims of the project is to encourage local staff to exploit the internet and increase their knowledge of their flora. Furthermore, we encourage the staff at the herbarium in Kinshasa to become involved in the digitisation project of type specimens, hoping to contribute to their knowledge on biodiversity in one of the most difficult and needed places in the world.
The National Botanic Garden of Belgium holds a vast array of different collections that makes it one of the leading academic institutes in its field. It has been quick to adopt new technologies in order to help expand the knowledge of botanical and mycological diversity, especially in Central Africa where limiting resources hampers academic progress.
References
Bamps, P. secrétaire de rédaction, 1994. Distributiones Plantarum Africanarum: Index des fascicules 1 à 40 - Meise - [16 p.], 2 p.: 1 overlay. - with transparent overlay to be placed over the distribution maps in order to show the boundaries of the African regional phytochoria according to F. White (1983): the vegetation of Africa.
Crépin, F. Manuel de la flore de Belgique ou description des familles et des genres accompagnée de tableaux analytiques destinés à faire parvenir aisément aux noms des espèces suivis du catalogue raisonné des plantes qui croissent spontanément en Belgique, et de celles qui y sont généralement cultivées. - 1ère éd. 1860; 2ème éd. 1866; 3ème éd. 1874; 4ème éd. 1882; 5ème éd. 1884; 10ème éd.
De Wildeman, E. & T. Durand, 1901. Reliquiae Dewevreanae ou énumération systématique des plantes récoltées par Alfr. Dewèvre en 1895-96 dans l'Etat Indépendant du Congo [Bruxelles], 291 p. (Fasc. I-II) (Annales du Musée du Congo. Série in-4°, Botanique. Série III,... ; Tome 1).
Diagre, D., 2002a. La naissance de la Société Royale d’Horticulture des Pays-Bas: attendue et placée sous les meilleurs auspices, in: Scientiarum Historia, Revue pour l’histoire des sciences et de la médecine, Bruxelles, 28, 1, p.63-94.
Diagre, D., 2002b. Histoire du jardin botanique de Bruxelles (1830-1837): des premiers soucis au désespoirs, de l’idéalisme au pragmatisme de survie. In Scientiarum Historia, 28, 2 (2002), Bruxelles, p. 17-58.
Diagre, D., 2002-2003. Les sources d’approvisionnement du Jardin botanique de Bruxelles 1826- 1870: Les us et coutumes des sciences naturelles au XIXe siècle. La Belgique à la manière de…, DEA, Ecole doctorale, ULB, 2002-2003.
Diagre-Vanderpelen, D., 2006. Le Jardin botanique de Bruxelles (1826-1912). Miroir d’une jeune nation. Doctoral thesis, Université libre de Bruxelles.
43
Durand, T., H . Schinz, 1896. Etudes sur la Flore de l'Etat indépendant du Congo - Tome LIII: 368 p. (Mémoires Couronnés et Autres Mémoires Collection in-8; 53)
Lambinon, J., L. Delvosalle, J Duvigneaud avec la collab. de D. Geerinck, J. Lebeau, R. Schumacker, et H. Vannerom, 2004. Nouvelle flore de la Belgique, du Grand-Duché de Luxembourg, du nord de la France et des régions voisines (Ptéridophytes et Spermatophytes); Jardin Botanique National de Belgique. - Cinquième édition. - Meise - CXXX, 1167 p.: fig., crt.; 20 cm. - Ed. 1: 1973.
Von Martius, C., 1840-1876. Flora Brasiliensis, 15 parts [see Stafleu and Cowan (1981) n° 5538]
Rae, D., 2004. Fit for a purpose? The value of checking collection statistics. Sibbaldia, 2, 61-73.
Smit, P., 1979. The Rijksherbarium and the scientific and social conditions which influenced its foundation, in: Blumea, 25 (1979), 5-11, p.4-11.
Wyse Jackson, P.S., B. Bridge, F. Dennis, E. Leadlay, C. Hobson, F. Holland, T. Pendry, J. Skilton, L. Suthereland, J. Willison, D. Wyse Jackson, 2001. An international review of ex situ plant collections of the botanic gardens of the world. Report prepared by Botanic Gardens Conservation International for the Secretariat of the Convention on Biological Diversity. BGCNews 3(6).

44
The World Federation for Culture Collections’ role in managing tropical diversity
Smith, D.
President of the WFCC, CABI Bioscience, Egham, Surrey TW20 9TY, UK. [email protected]
The World Federation for Culture Collections (WFCC) is the largest independent global organisation that represents professional individuals and culture collections, which preserve biodiversity and enable their proper use. These collections target living microorganisms, cell lines, viruses and parts and derivatives of them. Key values are authenticity and genetic integrity of the material and validity of the information provided. The WFCC was founded in 1968 and is a federation of the International Union of Microbiological Societies (IUMS) and a commission of the International Union of Biological Sciences (IUBS) with responsibility for the promotion and development of collections of cultures of micro-organisms and cultured cells ( www.wfcc.info). Member collections of the WFCC register with the World Data Centre on Microorganisms (WDCM; www.wdcm.org). There are currently 489 collections in 65 countries registered. Almost 200 of these collections are in the tropics and many of the 1 million plus strains held by the collections are from the tropics. Indeed the WFCC members do a lot to conserve and enable legitimate utilisation of tropical microbial diversity.
Culture collections:
- Conserve living organisms and cells
- Supply material and related information to teaching, research and industry
- Offer services related to their activities
- Apply quality management and biosecurity control
- Perform innovative research
The WFCC supports the professionals, organisations and individuals with interests in culture collection activities through:
- Networking, providing information and expertise and facilitating communication
- Facilitating access to the collection resources
- Providing training and promoting partnerships
- Encourage the development and implementations of quality and security procedures and the use of common standards and regulations
- Representing member interests in international organisations and fora
- Promoting the establishment of culture collections, their promotion and perpetuation
A key role of the WFCC is to promote capacity building in biodiversity management. The building of resources, facilities and human resources to conserve and sustainably utilise biodiversity has been neglected, although it is on the agenda of many national and international initiatives. The human resources, facilities, technologies and knowledge necessary need development to meet the demands to complete the world’s biodiversity inventory, to harness the world’s genetic resources for the benefit of humankind and to develop the bioeconomy. The WFCC has played a key role in this area in its three decades of

45
existence. The WFCC will continue to improve our ability to identify and understand the role of microbial diversity to harness its benefits for humankind.

46
Conserving inland aquatic biodiversity in the tropics: the needs for a strong foundation with databases and information network
Gopal, B.
School of Environmental Sciences, Jawaharlal Nehru University, New Delhi 110067, India. [email protected]
The inland aquatic ecosystems account for a very high proportion of the Earth’s total biodiversity, disproportionate to their total geographical area. The tropics lying within 35ºN and 35ºS are particularly rich in aquatic biodiversity despite the fact that a significantly large part of the tropics and subtropics are arid to semi-arid. The diversity of aquatic ecosystems ranges from billabongs to the mighty Amazon and the large Rift Valley lakes. The large expanse of northern peatlands and the numerous large lakes of the temperate and boreal regions are easily surpassed by the tropical seasonal water bodies in their biodiversity. The aquatic biodiversity in the tropics supports both the economics of these countries and livelihood of millions of people. Local communities throughout the tropics have traditionally used many aquatic organisms (other than fish) for health and nutrition, and there exists considerably large economic potential that is yet to be fully explored. However, not only the conservation has received least attention but the unique biodiversity is also the most threatened because the aquatic ecosystems are seriously impacted by large-scale regulation of rivers and growing levels of organic and toxic pollution. Alien invasive species both from within and outside the tropics are another major threat to the tropical aquatic biodiversity.
In most parts of the tropics, our understanding of the aquatic biodiversity is based largely on the expeditions and investigations by researchers from temperate Europe. Indigenous expertise is rare and very small. Interestingly, complete inventories of the entire range of aquatic biodiversity have probably never been attempted for any water body. For most of the taxonomic groups, the latitudinal gradients in the aquatic diversity are not clear but the identification of most organisms (other than fish and birds) remains a serious handicap in its assessment and monitoring. The genetic diversity within the species is also least investigated among the aquatic organisms.
The need for training and capacity building together with the creation of national or regional databases and networking among researchers within tropics and all those with experience in the tropics cannot be underestimated in the wake of all tropical countries having joined the Biodiversity Convention. In many countries there are no national collections of specimens of plants, animals or microorganisms that are essential to the correct identification of the taxa. In vast majority of cases, there is no expertise available to identify the organisms (particularly algae and benthic invertebrates) to the species level that is required for proper assessment of biodiversity and monitoring of the changes in aquatic ecosystems under anthropogenic impacts. The networking through online databases and publications will help the planners, policy makers and researchers alike and contribute to improved policies for conservation.

47
Online access to conservation data: challenges and opportunities
Olivieri, S.
Conservation International, 1919 M St NW, Suite 600, Washington DC 20036, USA. [email protected]
The emergence of online databases of different kinds relevant to conservation and their increased accessibility is changing the way we can improve access to data, develop better analytical capacities and effectively support decision processes. The new paradigms created by online access not only can bridge the gap between scientific data and action but also accelerate the knowledge process and the impact of new research on policy making.
At the World Conservation Congress in Bangkok, November 2004, IUCN launched the Conservation Commons initiative, an effort to define a framework for facilitating access and data and information sharing within the conservation community. The Conservation Commons Principles support free access to data and information, protection for author’s rights and recognition, and for the proper use of the data and information (safeguarding data integrity, etc). This effort, similar to the Science Commons, is already subscribed by more than 50 organizations from the non-governmental, governmental, intergovernmental, academic communities, and the private sector among others. Under this framework, we hope to develop the standards, methods and tools to leverage open access data and information for the benefit of the conservation of biodiversity.
IUCN in collaboration with other organizations has already been developing some of the core databases for such an effort. The Species Information System (SIS) developed by the IUCN Species Survival Commission, constitutes the basis for the development of the Red List on Endangered Species and is being released annually. The World Database of Protected Areas (WDPA), developed by the WDPA Consortium under an agreement between IUCN and UNEP, has been releasing annual versions of the World Database of Protected Areas on an annual basis since 2003, both in CD-ROMs and online. ECOLEX is a joint venture between IUCN, UNEP and FAO for on-line access to environmental law, treaties, court decisions and legal publications. PALNet, the Protected Areas Learning Network is a on- line collaboration network for knowledge management concerning Protected Areas issues. Each of these systems has their own organizational framework, constituency, policies and processes.
Many more non-IUCN systems important to conservation are now accessible on- line and are being developed and maintained by many organizations, either directly related to conservation or not. Many of them, like GBIF, already use a data sharing framework similar to the one proposed by the Conservation Commons.
Availability of these online data sources opens the way for new paradigms on how to facilitate the interoperability between these systems so new ways to visualize the data and information, perform analysis and synthesis and develop and maintain decision support tools can be developed by different actors. In effect, all of these systems have done the best job at visualizing the kind of analysis that a user can do with their data. If these systems are available in a way that facilitates interoperability it is very difficult for any particular organization or system to visualize the myriad of audiences and needs that can be addressed by these systems. A very simple demonstration was presented at the World Conservation

48
Congress exploring these possibilities. The prototype used online GIS interfaces to query and integrate data from SIS, WDPA, GBIF, Arkive and other systems.
The focus of this presentation will be on exploring ways in which we might be able to address interoperability from an end-user point of view (how the user would like to combine, analyze and present data and information) and discuss ongoing efforts to address these challenges.

49
What should we try to learn about tropical biodiversity, and how can we use that knowledge for conservation?
Raven, P.
Missouri Botanical Garden, P.O.Box 299, St. Louis, Missouri, USA. [email protected]
One of the most important steps to take in moving toward science-based conservation is gaining an understanding of what is already known, what data sets already exist, and sharing that information so that prioritized initiatives can be undertaken to fill in the most necessary gaps as quickly as possible because of the rapidity of the disappearance of undisturbed tropical ecosystems. Accomplishing this is of course fundamentally dependent on the open sharing of primary data so that if it is possible and they are applicable they can be used again and again for different studies leading to greater cost efficiency. As has been repeatedly noted, much data about the tropics resides in the temperate countries of the northern hemisphere, and so a global system for sharing the data is needed. To use the knowledge we have for conservation, that knowledge will need to become digital and be shared via a global network such as the Global Biodiversity Information Facility. Another important aspect of what we should try to learn about tropical biodiversity is that the studies should not be done without taking the human factors into account – much past research has focused on the organisms of the tropics as though there were no impending interactions with humans and yet we now know that there is virtually no place on Earth that is untouched by the activities of people, so it is important to include sociological elements in biological observations and experiments. The sociology of science itself needs to move toward more cooperative endeavors, which of course will be facilitated by today’s capacities for open data sharing.

50
GBIF as a resource for biodiversity research
Lane, M.A.
GBIF Secretariat, Universitetsparken 15, Copenhagen DK2100, Denmark. [email protected]
What is GBIF?
The Global Biodiversity Information Facility (GBIF) is a megascience facility aimed at:
- Making the world’s biodiversity data freely and universally available via the Internet;
- Sharing primary scientific biodiversity data to benefit society, science and a sustainable future.
To do this, GBIF emphasises that its portal makes available primary scientific data, which can be used and re-used in all sorts of analyses. Indeed, many of the datasets that data owners are sharing through GBIF cannot be re-created – perhaps because the sites in nature from which they were collected are no longer accessible or the environment has been disturbed. Yet, those data may be able to help answer questions about how best to protect or study other sites that support similar organisms. Even if a dataset could be re-created, it is a duplication of effort to do so. There is so much to do in biodiversity research that anything that can contribute to covering the most ground should be a welcome addition.
In addition, GBIF is working toward being able to support full interoperability of the species-occurrence and names data it currently concentrates on with other kinds of data (genetic, molecular, geographic, etc.). This will enable queries that require information from many disparate and different sources to answer – and it is exciting to think of the novel ways that researchers will be able to examine the data as these developments progress.
What does GBIF mean to the Belgian biodiversity researcher?
The government of Belgium has invested in GBIF, and in the Belgian node of GBIF, integrated in the Belgian Biodiversity Platform. Along with the governments of many other countries, Belgium will be increasingly suggesting that researchers make their data available in more easily accessible ways than ever before. One reason is so that they can be re-used, and another is so that the public , as well as other researchers, can have access to them. In many ways this is an opportunity for dissemination of the knowledge generated during research that far exceeds traditional publication.
The sharing of data is beneficial, not only to biodiversity itself, but also to the recognition of intellectual (taxonomic and other) work, the importance of natural history collections, to better management (informed by scientific opinion) of natural resources, and to public understanding of the contributions of scientists to society.
In short, GBIF is a distributed facility that, when mature, will provide:
- access to a persistent community data store (akin to GenBank) for specimen- and species- level data;

51
- easy online access to georeferenced specimen data from many providers via a single network portal;
- a complete, global, electronic index to scientific names and thus to the scientific literature and databases;
- a means to link together data from disparate sources (e.g. DNA, specimen, species observation and ecosystem) to answer complex questions;
- opportunities for within- and cross-disciplinary collaboration;
- a means to infuse biodiversity policy and management decisions with real, scientific data.
In addition, there are benefits to data providers in joining the GBIF network:
- higher visibility of the institution or research project as useful to society;
- global dissemination of the data;
- attribution of the data source when the data are used;
- the ability of everyone to share in the common store of humanity’s knowledge about biodiversity.
The GBIF informatics architecture
GBIF has built a web services based information architecture for the initial purpose of sharing specimen and observational primary biodiversity data (see www.gbif.net). What is needed is interoperability among databases maintained at multiple sites, and transparent means of querying those databases and representing the query results to users anywhere in the world. This requires an information infrastructure that has several component layers.
Important among these components are community-agreed standards for data and metadata, data schemas, transfer protocols, networked collection(s) of controlled vocabulary terms (thesauruses), and single (or few) access points from which users can retrieve data from a wide variety of sources (portals). If these are utilised together in an information architecture based on ‘web services’, or extensible markup language (XML), great benefit is perceived by both internal (researchers at the centers) and external (other researchers, the public) users.
An additional benefit of such an information architecture, constructed for use by one sort of network, is that the same construct can be accessed and used by other networks as well. Thus there is a great saving by avoiding duplication of effort. Such information architectures are also modular, so that each network, while utilising the main components in common, may add modules that suit its own specific needs. Likewise, this type of architecture is expandable, so that as new data and metadata standards are developed for various data types, the network(s) can present ever-richer arrays of data and information.
Who can be part of the GBIF network?
Everyone with something to contribute to the building of a worldwide facility that is dependent not only on informatics developments, but the accumulation of content (more datasets). So, curators and their institutions can share collections data, and researchers can share their datasets and experimental results. Soon, digital libraries of biodiversity information will be coming in to the system, which will increase the content greatly. ICT specialists can contribute by helping in the development of standards and software, and providing feedback to data providers on how to improve the quality of data and increase the

52
rate of digitization of legacy data, for examples. And, the users of the data can contribute by putting the data to use, discovering the gaps in data, helping to improve data quality through feedback to providers, suggesting other improvements in the system, and of course, giving credit to the data providers.
GBIF invites all scientists, and all their institutions, to become involved in GBIF, and here in Belgium to work together through the Belgian Biodiversity Platform. All of GBIF looks forward to the full participation of Belgian biodiversity scientists in furthering our common enterprise.

Regular Contributions


55
An assessment of animal species diversity in continental waters
Balian, E.V.1, K. Martens1, H. Segers1 & C. Lévêque2
1 Royal Belgian Institute of Natural Sciences, Vautierstraat 29, B-1000 Brussels, Belgium. 2 Institut de Recherches pour le Développement, MNHN-Laboratoire d’Ichtyologie, 43 rue Cuvier, 75005 Paris,
France.
Keywords: Freshwater, aquatic animals, biodiversity, global assessment, species diversity
The water crisis context
Since the beginning of the 21st century, evidence has been gathered that we are facing a critical water crisis likely to get worse in the next decades in view of human population growth (Jackson et al., 2001; Clark & King, 2004). The issues are multiple and intricate: from health and sanitation, to environment, food, industry, or energy related issues. The United Nations General Assembly, in December 2003, proclaimed the years 2005 to 2015 as the International Decade for Action ‘Water for Life’ in order to promote efforts to fulfil previous international commitments made on water and water-related issues: Agenda 21 and 2000 Millenium declaration that mainly aim to halve by 2015 the proportion of people lacking access to safe drinking water and basic sanitation.
The freshwater biodiversity status
Addressing water quantity, quality and availability for human uses is of critical importance but should not live down the major crisis faced by biodiversity and biological resources of inland waters that is directly correlated to water resource integrity (Postel & Richter, 2003). Indeed, biodiversity losses in terms of species and habitat have major consequences on the whole water cycle and lead to increased natural disasters and reduced natural processes of water attenuation and cleansing. In addition to their own intrinsic value, ecosystems also provide essential goods and services to humankind (Postel & Carpenter, 1997) especially in the poor communities traditionally dependent on their natural resources.
Threats to biodiversity of inland waters have long been identified without much success in mitigating their effects (Dudgeon et al., 2006). In the context of the international decade ‘Water for life’ freshwater biodiversity should be the over-riding conservation priority but much stand forth to mobilize medias and policy makers (Dudgeon et al., 2006). One of the critical issues is to provide a global picture of biodiversity in inland waters in order to help define conservation strategies.
Several projects have completed assessments of freshwater biodiversity but focused mainly on leading ‘better-known’ groups such as fish, or identified keystone species and/or endemic freshwater systems for conservation purposes. A few global initiatives have gathered available information on biodiversity of inland waters: Groombridge & Jenkins (1998); Groombridge & Jenkins (2000) and Revenga & Kura (2003).
56
Project goal
Our purpose is to complete these existing projects by providing an expert assessment of animal (species and generic) diversity in the continental (fresh)waters of the world by focusing on taxonomic and biogeographic diversity. The main three objectives for each group are:
(1) to give the current numbers of known global species and generic diversity;
(2) to identify the known biogeographic distribution (by zoogeographic region), and to stress possible gaps;
(3) to highlight the main areas of endemicity.
Because these extant patterns are the results of historic processes, the project will also emphasize phylogenetic aspects and processes of evolution and speciation. In addition, information on human related issues such as economical and medical uses, threats, conservation issues, are also included when pertinent.
Our assessment includes non-marine aquatic species of inland waters in two categories:
(1) The ‘real aquatic species’ accomplish full or part of their lifecycle in or on the water.
(2) The ‘water-dependent or paraquatic’ species show close/specific dependence on aquatic habitats (eg., for food or habitat).
For each group, the so-called limno-terrestrial species are not included in the total numbers but they can be discussed in the chapter when pertinent. Regarding interface environments: euryhaline species in estuaries are only included if they show a genuine tolerance to freshwater (< 3 g/l) and only the non-marine fauna is including from Anchialine caves and marine to non-marine interstitial environments.
Project activities
A first implementation phase of this project was carried out from September 2002 to June 2003 and led to a first, very approximate, assessment. This assessment was based on existing databases, published reviews and scientific expertise. The objective was to produce a preliminary discussion document that mainly identified gaps in our knowledge and could be used for discussion (Lévêque et al., 2004). These preliminary results give an order of magnitude for known freshwater animal species worldwide of 100,000, half of which are insects. Among other groups, there are some 20,000 vertebrate species; 10,000 crustacean species and 5,000 mollusc species that are either true aquatic or water dependant species.
The preliminary study highlighted gaps in the basic knowledge of species richness at continental and global scales:
(1) Some groups such as freshwater nematods or annelids have been less studied and data on their diversity and distribution is scarce. Because current richness estimates for these groups are greatly biased by knowledge availability, we can expect that real species numbers might be much higher.
(2) Zoogeographic regions are not equal in the face of scientific studies: The neotropical and the oriental regions are especially lacking global estimates of species richness for many groups, even for some usually well-known ones such as molluscs or insects.
A second phase has started in March 2005 and will be completed in June 2006. This phase consists in implementing a more complete review of animal diversity in freshwaters. We have invited taxonomic experts to assemble a team of authors and write a draft chapter on the

57
diversity of each animal group. These coordinating authors are invited to participate in a workshop where their data will be presented and discussed. (October 13-16, 2005). The final versions of these chapters will be published as a special issue of the international journal Hydrobiologia (IF = 0.72 for 2003), with potential spin-off in the hardcover series Developments in Hydrobiology. (scheduled: June 2006)
References
Clark, R. & J. King, 2004. The Water Atlas: Mapping the World’s Most Critical Resource. Earthscan/James & James, London, U.K.
Dudgeon, D., A.H. Arthington, M.O. Gessner, Z. Kawabata, D J. Knowler, C. Lévêque, R.J. Naiman, A. Prieur-Richard, D. Soto, M.L.J. Stiassny & C.A. Sullivan, 2006. Freshwater biodiversity: impotance, threats, status and conservation challenges. Biological reviews (in press).
Groombridge, B. & M. Jenkins, 1998. Freshwater Biodiversity: a Preliminary Global Assessment. World Conservation Monitoring Centre, Cambridge, U.K.
Groombridge, B. & M. Jenkins, 2000. Global Biodiversity. Earth’s Living Resources in the 21st Century. World Conservation Monitoring Centre, Cambridge, U.K.
Jackson, R.B., S.R. Carpenter, C.N. Dahm, D.M. McKnight, R.J. Naiman, S.L. Postel & S.W. Running, 2001. Water in a changing world. Ecological Applications 11: 1027-1045.
Lévêque, C., E.V. Balian, & K. Martens, 2004. An assessment of animal species diversity in continental water systems. Hydrobiologia 542: 1-29.
Postel, S. & S. Carpenter, 1997. Freshwater ecosystem services. In Daily, G.C. (ed), Nature’s Services: Societal Dependence on Ecosystem Services. Island Press, Washington D.C., U.S.A.: 195-214.
Postel, S. & B. Richter, 2003. Rivers for Life: Managing Water for People and Nature. Island Press, Washington D.C., U.S.A.
Revenga, C. & Y. Kura, 2003. Status and Trends of Biodiversity of Inland Water Ecosystems. Secretariat of the Convention on Biological Diversity, Montreal, Technical Series 11.

58
Changes in phytoplankton and bacterial biodiversity linked to hydrodynamics in Lake Tanganyika
Cocquyt, C.1, A. De Wever1, M. Stoyneva2, P.-D. Plisnier3 & W. Vyverman1
1 Ghent University, Department of Biology, section Protistology and Aquatic Ecology, Krijgslaan 281-S8, B-9000 Gent, Belgium. [email protected], [email protected], [email protected]
2 Sofia University, Faculty of Biology, Department of Botany, Dr. Zankov 8, 1164-Sofia, Bulgaria. [email protected]
3 Royal Museum for Central Africa, Department of Geology, Leuvensesteenweg 13, B-3080 Tervuren, Belgium. [email protected]
Keywords: phytoplankton, diatoms, bacterioplankton, biodiversity, lake hydrodynamics, Lake Tanganyika, East Africa
Introduction
Lake Tanganyika is situated in the East African Rift at 776m above sea- level, between 3°20’ and 8°48’south of the equator. The lake is about 650km long and has a maximum depth of 1,470m, making it the second deepest lake of the world. It contains 18% of the world surface freshwater and is important for its fish production. The high rate of endemism makes this lake interesting from a biodiversity perspective.
Nutrient dynamics in this meromictic lake are mainly regulated by seasonal changes in hydrodynamics. The lake is situated in a region with two major seasons: a dry, cooler season from mid-May to September and a rainy warmer season from October to mid-May. Although temperature varies between 23.25 and 27.25°C, the lake is permanently stratified in the north while in the south the thermocline sometimes disappears. Oxygen is present up to the same depth as the thermocline (between 50 and 100m) in the northern basin; in the southern basin oxygen is sometimes observed beneath the thermocline, up to 240m depth. During the dry season, the strong south-east monsoon winds blow the upper, warmer epilimnion waters to the north, resulting in a tilting of the thermocline with upwelling of colder nutrient rich water in the south of the lake. At the end of the dry season, when the south-east winds cease, a secondary upwelling occurs in the north of the lake, after which thermocline oscillations, bringing colder, nutrient richer water higher up in the water column, are observed. These oscillations decrease in strength and disappear finally resulting in a maximal water column stability at the end of the rainy season (Plisnier et al., 1999; O’Reilly et al., 2003).
The present study deals with phytoplankton and bacteria. Two phytoplankton size classes were discerned: i) organisms smaller than 5µm: picoplankton (smaller than 2µm) and phytoplankton between 2 and 5µm; ii) phytoplankton organisms larger than 5µm. They belong to the groups of cyanobacteria, chlorophytes, diatoms, dinoflagellates, chrysophytes and cryptophytes.
Material and Methods
To study seasonal and interannual changes in among other things limnology and phytoplankton composition, the Belgian Climlake project carried out a monitoring at two

59
stations in the pelagic region: one station in the southernmost part of the lake near Mpulungu and one near Kigoma in the northern basin. Sampling was carried out biweekly at several depths (0, 20, 40, 60, 80 and 100m). Additional samples were taken at 8 stations, during a north-south transect in July 2002, July 2003 and February 2004. Picoplankton and phytoplankton smaller than 5µm were studied by epifluorescence microscopy, phytoplankton larger than 5µm by inverted microscopy and prokaryotic/bacterial community composition using DGGE (Denaturing Gradient Gel Electrophoresis) analysis of PCR amplified 16S rDNA fragments.
Results and discussion
The biweekly monitoring shows clear seasonal changes within phytoplankton groups, when phytoplankton larger than 5µm is taken into account (Cocquyt & Vyverman, 2005). During the dry season, the upwelling period in the southern basin, biomass is highest and diatoms are the most important algal group. At the beginning of the wet season, peaks of higher algal biomass occur due to the oscillation of the thermocline and internal waves.
The results of the north-south transect of July 2002 and July 2003 showed that the phytoplankton larger than 5µm was more important in the north, decreasing towards the south. On the other hand, picoplankton and phytoplankton between 2 and 5µm increased towards the south resulting in a higher total biomass in the south of the lake. Interannual variability was observed: higher biomasses were observed in 2003, related to a more important upwelling of nutrient rich hypolimnion waters.
Prokaryotic diversity
Dominant bands were sequenced and identified as members of the Cyanobacteria, Actinobacteria, Nitrospirae, green nonsulfur bacteria, Firmicutes, Gamma- and Delta-Proteobacteria. The distribution of these genotypes displayed both vertical and latitudinal variation. The variation in the bacterial community composition could be related to the thermal water column stratification, which influences oxygen and nutrient concentration (De Wever et al., 2005). The influence of the upwelling on the bacterial community composition can be observed in the distribution pattern of certain genotypes, which are only detected in the hypolimnion in the north of the lake, which are also observed in the epilimnion in the south.
These spatial variation in community composition is also reflected in differences in the Shannon biodiversity index values, with higher values in the hypolimnion and in the epilimnion in the south of the lake.
Phytoplankton/diatom diversity
The lowest number of diatom taxa, observed per 500 counted frustules in each sample, was observed during the dry, windy season. At that moment, Nitzschia asterionelloides, a colony building species, obtained its maximum relative abundance, up to and reaching 100%. During the rest of the year littoral species, benthic as well as facultative planktonic, were also observed in small quantities in the pelagic of the lake. Near Mpulungu, at the end of the rainy season, during maximal stability of the water column, smaller Nitzschia spp. (with affinity to N. fonticola) became important.
Lowest values for the Shannon biodiversity index were obtained for both Kigoma and Mpulungu during the dry season when upwelling events of nutrient enriched deeper water occur in the lake and disturbance of the water column is maximal (up to 60m near Kigoma

60
and 100m near Mpulungu). Highest diversity values were obtained during periods of low mixing (up to 30m near Kigoma), which are situated in the second period of the rainy season.
If we look at the picoplankton results from the north-south transect, a north-south increase was observed in the epilimnion. Highest biodiversity index values were obtained in the southern basin in the epilimnion as well as in the hypolimnion. In the northern basin an increase in biodiversity was observed towards the deeper layers.
Conclusion
Important changes in both phytoplankton and bacterial community composition and biodiversity was observed along a north-south transect during the dry season. The biomass ratio of large (> 5µm) to small (< 5µm) phytoplankton decreased from north to south, while prokaryotic diversity increased. These changes could be related to the decreased water column stability in the south during the upwelling period. The importance of the water column stability could also be observed at the two monitoring stations during the period 2002-2003: highest diversity of diatoms (and phytoplankton > 5µm) was observed at the end of the rainy season during periods of maximal stability in the water column.
Acknowledgement
The presented results are part of the Climlake project (EV/02/2C) financed by the Belgian Science Policy, which also financed a Research fellowship for MS. ADW has a research grant supported by the Institute for the Promotion of Innovation through Science and Technology in Flanders (IWT).
References
Cocquyt, C. & W. Vyverman, 2005. Phytoplankton in Lake Tanganyika: a comparison of community composition and biomass off Kigoma with previous studies 27 years ago. Journal of Great Lakes Research 31(4): 535-546.
De Wever, A., K. Muylaert, K. Van Der Gucht, S. Pirlot, C. Cocquyt, J.-P. Descy, P.-D. Plisnier & W. Vyverman, 2005. Bacterial community composition in Lake Tanganyika: Vertical and horizontal heterogeneity. Applied and Environmental Microbiology 71(9): 5029-5037.
O’Reilly, C.M., S.R. Alin, P.-D. Plisnier, A.S. Cohen & B.A. McKee, 2003. Climate change decreases aquatic ecosystem productivity in Lake Tanganyika, Africa. Nature 424: 766-768.
Plisnier, P.-D., D. Chitamwebwa, L. Mwape, K. Tshibangu, V. Langenberg & E. Coenen, 1999. Limnological annual cycle inferred from physical-chemical fluctuations at three stations of Lake Tanganyika. Hydrobiologia 407: 45-58

61
IBISCA: a large-scale study of arthropod mega-diversity in a neotropical rainforest
Corbara, B.1, Y. Basset2 & H. Barrios3
1 Canopy Raft Consortium & LAPSCO, UMR-CNRS 6024, Université Blaise Pascal, 34 avenue Carnot, F-63037 Clermont-Ferrand cedex, France. [email protected]
2 Smithsonian Tropical Research Institute, Panama, [email protected] 3 Universidad de Panama, [email protected]
Keywords: biodiversity, arthropods, Neotropics, canopy
The IBISCA (Investigating the BIodiversity of Soil and Canopy Arthropods1) project aims to study the relationships between beta-diversity and the vertical stratification of arthropods in a neotropical rainforest. To this end, the arthropod fauna of nine sites (400m2), all less than 2km apart, has been studied from the ground to the upper canopy in the San Lorenzo Protected Area, Panama (near Colon, Caribbean coast, 9º17’N, 79º58’W; alt. 130m). This tropical wet evergreen forest averages 3152mm of rainfall each year and has a mean annual air temperature of 25.8ºC.
IBISCA participants used an unprecedented range of techniques for canopy access. As well as insecticide knockdown techniques (“fogging”) and single rope access, a range of major access devices was available. The canopy crane at the Fort Sherman site was one of these (see www.stri.org/tesp/fts.htm). The canopy platform known as the “Solvin Bretzel” was also used. This is a structure of pneumatic plastic beams and netting, and is the latest version of the canopy raft (“Radeau des Cimes”). A transect based on use of a manned helium balloon (“Bulle des Cimes”) was also established. The “IKOS” treehouse was available at an additional site. Information about the Solvin Bretzel and related procedures can be found on www.radeau-des-cimes.org.
These techniques and devices complement each other well and IBISCA represents the first attempt to combine them in a large-scale investigation. They provided spatial replication during a six-week field study that involved 45 participants from 15 countries (23 professional entomologists, 5 professional botanists, 7 students and 10 technical staff members) and which took place in September-October 2003 (rainy season). Three sites were delineated within the perimeter (0.8ha) of the San Lorenzo canopy crane. Two sites were installed along the 800m transect of the Bubble. One site consisted of the Solvin Bretzel and another was centred on the IKOS. In addition, two canopy sites were accessible via a network of ropes set up by professional tree climbers (the ninth site was seldom used).
Seasonal replications were conducted three times at the three crane sites: one complete replication (all the sampling protocols described hereunder were used) in May 2004 (beginning of the rainy season) and two partial replications (only a few sampling protocols involved) in February 2004 (dry season) and October-November 2004 (rainy season).
To collect arthropods, 14 different protocols were used (see Table 1) involving sampling techniques such as fogging (insecticide knockdown; 3 surrogate sites were fogged instead of
1 In French: Inventaire de la Biodiversité des Insectes du Sol et de la CAnopée In Spanish: Investigaciones sobre la Biodiversidad de los Insectos de la Selva Centro Americana

62
the crane sites), branch beating, various kinds of traps including pitfalls, small and large flight intercepting traps, sticky traps, light traps, bait traps, Berlese-Tullgren Extractors (for microarthropods in suspended soils and on the ground), Winkler sifters (litter) and hand-collecting (ants and termites).
Table 1. IBISCA sampling effort.
Sampling protocol 02/04 05/04 10/04
(target arthropods) Sites (n) Samples (n) Sites (n)
Soil/Litter:1. Pitfall traps
(active arthropods) 8 120 (3 days each) 2 2 22. Winkler
(active and passive arthropods) 8 408 samples of 1 m2
3
Canopy and/or understorey:
3. Canopy fogging(wide range of arthropods) 8 48 (6 subsamples at each) 6 6
4. Composite flight-interception traps*(large flying insects) 5 120 (3 weeks each) 5 5 5
5. Beating(passive foliage arthropods) 7 320 2 2 2
(dead branches) 16 trees 16 trees6. Light traps
(insects attracted to light) 8 48 (1 night each) 2 3 27. Sticky traps
(small flying insects) 9 594 (5 days each) 2 2 28. Ground flight interception traps
(large flying insects) 8 60 (2 days each) 89. Malaise traps
(large and small insects flying in the understorey) 6 6 610. Bait traps
(bees) 8 611. Hand collecting
(galling insects) 6 18 vertical transects 5
Both soil/litter and canopy:
12. Berlese-Tullgren(microarthropods) 8 384 4
13. Wood rearing(xylophagous insects) One experiment carried at one site with ca. 15 plant species.
14. Hand collecting(social insects) 8 3
* Composite flight-interception traps have run continuously until the end of October 2004.
September/October 2003
12 sites of 400 m2 were surveyed for vascular plants with a DBH = 10 cm (9 sites and 3 surrogate sites
for fogging at crane sites).
160 sections of 10 m2 on ground 45 samples in the canopy (termites); two 170x40 m transects
and approximately 300 samples in the canopy and understorey each (ants).
The sampling protocols used during IBISCA at the different canopy/ground sites permitted, for the first time, a large-scale study of the interactions between horizontal and vertical faunal turnover. The analysis of a careful selection of focal taxa of arthropods from different clades

63
and ecological niches will provide valuable information on faunal distributions. Actually more than 50 focal taxa in all, mostly families or sub-families, were studied. The spatial replication achieved with programmes such as the sticky, light and flight interception traps and the Berlese-Tullgren extractors is high and has few equivalents in the published literature, particularly when the vertical dimension is also being considered.
Roslin (2003) and Ozanne et al. (2003) provide useful summaries of the significance of canopy research in tropical rainforests. Detailed information on the IBISCA field work, accessible to a broad audience, is reported in Didham and Fagan (2003), Corbara (2004a, 2004b), Schmidl and Corbara (2005) and Ribeiro and Corbara (2005), for example. Updated information on the whole program is also available in several reports (Springate & Basset 2004, Basset & Leponce 2005), as well as on the IBISCA website at www.naturalsciences.be/cb/ants/projects/ibisca_main.htm
Arthropod data collected during IBISCA are entered into a shared database, conceived and maintained by Maurice Leponce and Yves Basset (Royal Belgian Institute of Natural Sciences, Brussels). It is accessible through the Internet to all IBISCA field participants as well as to the many taxonomists involved in the identification of the collected material (being sorted, at least, to the morphospecies level). As of recently (May 2006), +400,000 specimens and +3,000 species of arthropods have been data-based, among which many species will eventually prove to be new to science and described. For example, 26 new species have already been described from tenebrionid and buprestid material alone (Ferrer & Ødegaard 2005, Curletti 2005), including one species named in honour of the project, Lenkous ibisca Ferrer & Ødegaard 2005 (Col. Tenebrionidae).
The interpretation of the results (in terms of both vertical stratification and beta-diversity of the different focal taxa) is still at an early stage, but will benefit from information provided by several parallel studies which characterize the sites surveyed (e.g., type of vegetation, canopy thickness, incidence of light, apparent leaf damage, etc.). A joint ESF (European Science Foundation) – UNEP (United Nations Environment Program) – GCP (Global Canopy Program) Exploratory Workshop (“The Last Biotic Frontier: Towards A Census of Canopy Life” – www.naturalsciences.be/cb/ants/meetings/esf_exploratory_workshop.htm) has been held in July 2005 in Brussels, with all the European and most of the non-European IBISCA participants, as well as invited high-ranking ecologists and statisticians. This aims to produce the best synthesis from the 14 sampling programs.
IBISCA may be considered as a model for ongoing large-scale programmes of biodiversity investigation. Comparable projects which involve multiple canopy access are in preparation. These will also include devices such as the “Canopy-Glider”, an innovative flying inflatable craft which is actually in its test phase.
Acknowledgements
We thank Pro-Natura International, Océan Vert, the Blaise Pascal University (France), the University of Panama and the Smithsonian Tropical Research Institute (STRI) for initiating and organizing the IBISCA-Panama project. Special thanks to the Canopy Crane team and to "Les ACCRO-branchés" for assistance with logistics in the field. Core funding for IBISCA was provided by SolVin-Solvay, STRI, the United Nations Environment Programme, a Walcott endowment fund grant from the Smithsonian Institution, the European Science Foundation and the Global Canopy Programme.
IBISCA is greatly honoured to be under the patronage of Professor E.O. Wilson of Harvard University.

64
References
Basset, Y. & M. Leponce 2005. IBISCA: Towards a Census of Canopy Life. What’s Up? The Newsletter of the International Canopy Network 12(1): 1-2.
Corbara, B., 2004a. Diversité des arthropodes dans une forêt tropicale. Insectes 133: 3-7. www.inra.fr/Internet/Hebergement/OPIE-Insectes/pdf/i133corbara.pdf
Corbara, B., 2004b. IBISCA-Panama. Objectif biodiversité. Le Courrier de la Nature 216: 34-41.
Curletti, G., 2005. Notes about the genus Agrilus Curtis, 1825 in Panama. Lambillionea 105 (4): 545-571.
Didham, R. & L. Fagan, 2003. (Editorial) Project IBISCA – Investigating the Biodiversity of Soil and Canopy Arthropods. The Weta 26: 1-6.
Ferrer, J. & F. Ødegaard, 2005. New species of darkling beetles from Central America with systematic notes (Coleoptera: Tenebrionidae). Annales Zoologici 55: 633-661.
Ozanne, C.M.P., D. Anhuf, S.L. Boulter, M. Keller, R.L. Kitching, C. Körner, F.C. Meinzer, A.W. Mitchell, T. Nakashizuka, P.L. Silva Dias, N.E. Stork, S.J. Wright & M. Yoshimura, 2003. Biodiversity meets the atmosphere: a global view of forest canopies. Science 301: 183-186.
Ribeiro, S.P. & B. Corbara, 2005. Dossel florestal: a fronteira desconhecida. Ciencia Hoje 37: 54-58.
Roslin, T. 2003. Not so quiet on the high frontier. Trends in Ecology and Evolution 18: 376-379.
Schmidl, J. & B. Corbara, 2005. IBISCA – Artenvielfalt der Boden- und Baumkronen-Arthropoden in einem tropischen Regenwald (San Lorenzo NP, Panama). Entomologische Zeitschrift, Stuttgart 115: 104-108.
Springate, N.D. & Y. Basset, 2004. IBISCA 2003-2005, Panama: progress report. Bulletin of the British Ecological Society 35: 21-23.

65
Digitization of the type specimens of Lepidoptera (butterflies and moths) from the Royal Museum for Central Africa: before long the pictures on the web
Dall’Asta, U. & F. Desmet
Lepidoptera laboratory, Entomology Section, Royal Museum for Central Africa, B-3080 Tervuren, Belgium. [email protected]
Abstract
Digitization of Lepidoptera type material of the Royal Museum for Central Africa has been carried out with a Coolpix 990 digital camera. All primary types, as well as allotypes, were photographed. In the absence of the former two, a picture of a paratype (excluding Microlepidoptera, Pyraloidea and Lymantriidae) was taken. All labels were included on the photograph and the status of the type was checked with recent literature. These photographs, 4,374 in total (of which 1,498 primary types),will be available on the web early next year with information on synonymy and other data about the specimens.
Introduction
Even today, biologists sometimes wonder why so much effort is carried out to keep natural history collections in good condition. One of the major reasons is that in many fields, these are the most important depository of information on organisms. Except for vertebrates and higher plants, finding the name of organisms can sometimes be a very difficult task. In zoology, this is mainly the case for invertebrates. Within this group, some organisms are better known like butterflies. In West-Europe, these can often be identified in the field even without capturing the specimen. However, such easy identifications remain an exception in invertebrates.
When switching to the tropics, even for a well known group such as the butterflies, identification becomes also difficult due to the vast number of species. In West-Europe, for example, there are a little less than 400 different butterfly and skipper species, but in the Afrotropical region (Sub-Saharan Africa including the surrounding islands), there are more than 4,000 (Larsen, 2005). Within habitats, this diversity is also clearly seen, as for example on a single mountain, mount Fébé near Yaoundé (Cameroon), on which more than 700 different butterfly species were captured (Libert, pers. comm.). A second example is a degraded forest in Ivory Coast (Bossematié Forest, 20km south of Abengourou), an area of only 216 km², in which probably as many as 500 different butterfly species occur (Fermon, et al., 2000).
This difficulty in identification is of course even worse in other groups of tropical invertebrates, furthermore the literature on these organisms is scattered amongst innumerable publications. A practical example of identification of Afrotropical moths will be presented later in this paper. Because of all these difficulties, the easiest and most practical way of identifying specimens becomes comparing them with those of a well curated collection. This

66
means that these collections of invertebrates are real identifications tools which are very often used by many scientists, not only for systematics, but also for biodiversity studies, finding of indicator organisms, faunistics, etc.
The specimens which are the most manipulated are of course the type specimens. They are the bearers of the scientific names and, in case of doubtful identifications, scientists always refer to them. In order to preserve this type material as much as possible, a program of digitization was carried out to photograph these specimens.
The Lepidoptera collection of the Royal Museum for Central Africa
The Royal Museum for Central Africa, located in Tervuren, was established in 1897 and is thus a fairly recent Museum. The entomology section is very large, it occupies 2,000m²,in total. The Lepidoptera collection, like all other insect collections of the section, is exclusively Afrotropical.
In the early 20th century the Lepidoptera send to the Museum from Africa came chiefly from the former Belgian Colonies: the Democratic Republic of the Congo, Rwanda and Burundi. Today, still 75% of the specimens are from these countries. Later, correspondents from Ghana, Kenya and Uganda sent quite a lot of specimens and, for these countries we have now also a good coverage of the species. All together, other countries, including South Africa, make up only a few per cent of the collection.
Through databasing of two families/subfamilies (Papilionidae & Charaxinae) it was possible to estimate the total number of specimens in the Lepidoptera collection: about 240,000 butterflies and skippers (Rhopalocera), and 230,000 macro- and micromoths (Heterocera). The collection of butterflies and skippers probably contains 75% of the nearly 4,000 known Afrotropical species. Curation of the moths families revealed that the coverage for moths is much less: about 27% of the Noctuidae species and about 33% of the Geometridae (two of the largest Afrotropical moth families) are represented out of the about 37,500 known Afrotropical species (Vane-Wright, 1997). All these collections are housed in 197 massive oak cupboards in more than 4,000 hermetic boxes (Figure 1).
Aim and scope of the digitization programme
The specimens
As mentioned before, the types are the most manipulated specimens and the digitization programme was focused on them. The aim was to put on internet recto and verso photographs of type material. First of all of, the primary type (holotype, lectotype or neotype) was
Figure 1. General view of the butterfly collection of the Royal Museum for Central Africa: a little less than half a million specimens housed in 197 cupboards in more than 4.000 drawers. (photo: San-Ho Correwyn)

67
photographed. If available, the allotype (which is usually a specimen of the opposite sex) was also recorded. When no primary type or allotype were present, a paratypewas photographed. Since it is a tradition to deposit paratypes in sister museums, these specimens are, in modern Lepidopterology, nearly as valuable as primary types.
On the photographs, the recto and the verso of all or nearly all labels were included, as well as a small lath to have an idea of the expanse of the specimen (Figure 2).
Figure 2. Left: Cymothoe arcuata Overlaet (Nymphalidae), holotype recto; right: Bunaeopsis princeps aurata Rougeot (Saturniidae), holotype verso.
In this project, all types of Lepidoptera under the responsibility of the authors were photographed: the butterflies, the skippers and the macromoths.The Microlepidoptera and Pyraloidea (curated by others) as well as the Lymantriidae were not included. This latter family is now being revised and, when revision will be completed, the photographs of types will also be included.
Bibliographic work
Although photographing the specimens proceeded rather quickly, a big drawback was the verification of the types.Doing this verification with the original literature would have been a monumental task, so we made the choice to do it with recent catalogues, if available (1960 and later). Luckily, there is a recent catalogue for butterflies and skippers (Ackery et al. 1995), and verification did not take too much time. Here follows the list of type material for this group in the collection of the R.M.C.A. (Table 1).
Table 1. Number of primary types, allotypes and paratypes if primary types are absent, of butterflies and skippers of the collection of the R.M.C.A.
Family/subfamily Ht At Pt
Papilionidae 30 9 4
Pieridae 87 40 16
Nymphalinae 341 190 36
Acraeinae 35 13 4
Satyrinae 18 13 13
Danainae 3 2 0
Hesperiidae 24 18 7
Lycaenidae 135 58 30
Subtotal 673 343 110

68
Unlike the butterflies and skippers, there is no single catalogue for the Afrotropical moths. Even on the catalogue level, literature on moths is scattered in different journals and books. Those that were used for the verifications of the type material are listed in Table 2. Knowing that there are about 50 macromoth families, it is obvious that the coverage of this group in recent literature is far from complete.
When recent catalogues were not available, checking was done with older ones or information found the collection of The Natural History Museum, London. Table 3 shows the list of the numbers of primary types of macromoths at the R.M.C.A.
None the less, the authors were sometimes confronted with unsolvable problems. For example, two holotypes of a Saturniid species mentioned in recent catalogue could not be traced back through the zoological record and their label data could not be checked.
This shows once more the weakness of our actual state of the knowledge on African moths: only catalogues or revisions, all of them with very little illustrations, mainly in black and white, and illustrates the difficulties in identifying taxa in the absence of reliable collections.
Material and methods
The project of digitizing the type specimens started in January 2003 with a Nikon COOLPIX 990 digital camera. A first step was to calibrate this camera to the needs of the project. The automatic settings were unsatisfactory and the following settings were used:
Table 2. List of catalogues used to verify the type status of the Heterocera of the R.M.C.A. The family/subfamily names are the ones currently accepted in Lepidopterology, original references at the end of the paper.
Family/subfamily Catalogue
Agaristinae Kiriakoff, 1977
Arctiinae Goodger & Watson, 1995
Drepanidae Watson, 1965
Geometridae Scoble, 1999
Noctuidae Poole, 1989
Notodontidae Kiriakoff 1964 & 1970a
Saturniidae Bouyer, 1999
Sphingidae Kitching & Cadiou, 2000
Thaumetopoeinae Kiriakoff, 1970b
Thyretinae Kiriakoff, 1960
Thyrididae Whalley, 1971
Table 3. Number of primary types in the Heterocera of the R.M.C.A., excluding Microlepidoptera, Pyraloidea and Lymantriidae.
Family Ht
Noctuidae 191
Notodontidae 158
Geomatridae 85
Thyretidae 63
Arctiidae 49
Zygaenidae 40
Saturniidae 38
Eupterotidae 32
Lasiocampidae 29
Agaristidae 19
Ctenuchidae 19
Limacodidae 13
Sphingidae 11
Thaumetopoeidae 8
Drepanidae 7
Other families 14
Total 776

69
- Flash: off
- Focus mode: ‘macro close-up’
- Image quality: FINE (1.0-1.2 megabyte per photograph)
- Illumination: circular neon lamp, setting ‘fluorescent’ (submenu: +1+2+3) for Rhopalocera, and annular illumination, setting ‘cloudy’, submenu: -2-3 for Heterocera
When searching for the best settings to take the pictures, our policy was to focus on yellow, because when this colour is at its best, the others are also quite satisfactory. As background the most suitable colours seemed to be light blue or light grey.
Note that the Coolpix 990 is now bypassed by quite a number of more performing digital cameras.
Results
During the period of January 2003 till February 2005 a total of 1,498 primary types were photographed and their type status verified to the best of the author’s abilities. The total number of photographs taken, including secondary type material, is 4,374, of which 2,246 butterflies and skippers and 2,128 macromoths (Table 4).
Table 4. Number of photographs of (A) butterflies and skippers or (B) moths taken for the digitalization project, excluding Microlepidoptera, Pyraloidea and Lymantriidae.
A B
Family/subfamily # Phot.
Papilionidae 80
Pieridae 292
Acraeinae 106
Satyrinae 88
Danainae 10
Nymphalinae 1138
Hesperiidae 100
Lycaenidae 432
Total 2246
Family # Phot.
Noctuidae 522
Notodontidae 402
Geomatridae 318
Thyretidae 148
Arctiidae 124
Saturniidae 118
Zygaenidae 96
Eupterotidae 80
Lasiocampidae 72
Agaristidae 40
Ctenuchidae 40
Drepanidae 32
Thyrididae 32
Sphingidae 30
Limacodidae 28
Other families 46
Total 2128
The information about the photographs has been edited using Excel (because of the flexibility and ease of transfert of this software). The fields used in the excel file were: | Code | Family | Subfamily | Genus | species | subspecies | form | author | comments | HTrecto | HTverso | ATrecto | ATverso | PTrecto | PTverso |. The ‘code’ field contains a unique code, different for each specimen. It should be noted that the ‘comments’ field is also very importantsince it can contain information on synonymy, as well as all problems encountered during the process of verification of the type material with the recent catalogues.

70
Conclusion
Before long the 4,374 photographs and the corresponding Excel file will be transferred to a user friendly website. One of the outcomes of this website will be that the section will start a policy of not lending type material any more. Specialists will find low resolution pictures on the web as first information. If better quality is needed, original photographs can be sent by e-mail. If this information is still not satisfactory, the only alternative will be to visit the section and look at the specimens themselves. These photographs and corresponding information should be available on the museum website early next year.
Acknowledgements
Without the Coolpix 990 brought in by Dr. Marc De Meyer through a project, the digitization would not have been possible.
References
Ackery, P.R., C.R. Smith & R.I. Vane-Wright (eds), 1995. Carcasson’s African butterflies: an annotated catalogue of the Papilionoidea and Hesperioidea of the Afrotropical region. East Melbourne: CSIRO, xi + 803 pp.
Bouyer, T., 1999. Catalogue of African Saturniidae. Entomologia Africana collection hors série n°1, 73 pp, 16 col. pl.
Fermon, H., M. Waltert, T.B. Larsen, U. Dall’Asta & M. Mühlenberg, 2000. Effects of forest management on diversity and abundance of fruit-feeding nymphalid butterflies in south-eastern Côte d’Ivoire. Journal of Insect Conservation 4: 173-189, 4 figs, 6 tabs.
Goodger, D.T. & A. Watson, 1995. The Afrotropical tiger-moths. An illustrated catalogue, with generic diagnoses and species distribution, of the Afrotropical Arctiinae (Lepidoptera: Arctiidae). Stenstrup, Denmark: Apollo Books, iv + 65 pp.
Kitching, I.J. & J.-M. Cadiou, 2000. Hawkmoths of the world: an annotated checklist of world Sphingidae (Lepidoptera). The Natural History Museum, London: Comstock Publishing Associates, vi +226 pp, 8 col. pl.
Kiriakoff, S.G., 1960. Lepidoptera, Familia Thyretidae. In Wytsman, P., Genera Insectorum, fasc. 214e. – Imprimerie et Editions Mercurius, 66 pp., 2pl.
Kiriakoff, S.G., 1964. Lepidoptera, Familia Notodontidae, pars prima, genera Aethiopica et Malgassica. - in Wytsman, P., Genera Insectorum, fasc. 217e. – Imprimerie et Editions Mercurius, 213 pp., 11pl.
Kiriakoff, S.G., 1970a. Lepidoptera, Familia Notodontidae, addenda et corrigenda ad partem primam genera Aethiopica et Malgassica. In Wytsman, P., Genera Insectorum, fasc. 217a. – Imprimerie et Editions Mercurius, 74 pp.
Kiriakoff, S.G., 1970b. Lepidoptera, Familia Thaumetopoeidae. In Wytsman, P., Genera Insectorum, fasc. 219e. – Imprimerie et Editions Mercurius, 33 pp., 3pl.
Kiriakoff, S.G., 1977. Lepidoptera Noctuiformes Agaristidae II (Ethiopian and Madagascan Species) In Das Tierreich, vol. 98. Walter de Gruyter, Berlin, i-viii + 1-165.

71
Larsen, 2005. Butterflies of West Africa. Stenstrup, Denmark: Apollo Books, vil. 1, 595 pp, vol. 2, 270 pp, 125 col. pl.
Poole, R.W., 1989. Noctuidae. Lepidopterorum Catalogus (New Series) (118), part 1, xii + 1-500, part 2 iv + 501-1013, part 3, viii +1015-1314. Leiden: E.J. Brill.
Scoble, M.J. (ed.), 1999. Geometrid Moths of the World: a catalogue. The Natural History Museum, London: CSIRO Publishing, Collingwood, Australia, part 1, xxv + 1-482 + 1-129 (index 1&2), part 2, 485-1016 +1-129 (index 1&2).
Vane-Wright, R.I., 1997. African Lepidopterology at the millennium. Metamorphoses Supplement 3: 11-27, 4 figs.
Watson, A., 1965. A revision of Ethiopian Drepanidae (Lepidoptera). Bulletin of the British Museum (Natural History) (Ent.), Suppl. 3: 177 pp.
Whalley, P.E.S., 1971. The Thyrididae (Lep.) of Africa and its islands; a taxonomic and zoogeographic study. Bulletin of the British Museum (Natural History) (Ent.), Suppl. (17): 198 pp.

72
Mitigation strategy for the Human-Elephant Conflict on Mount Kenya (Kenya): The scope of electric fencing as a plausible solution
Hirani, P.
Current address: Preetika Hirani, P.O. Box 48798, 00100 GPO, Nairobi, Kenya. [email protected]
Keywords: human-elephant conflict, Mount Kenya, electric fence, Loxodonta africana africana, GIS
Abstract
Man and animals have co-existed for a long time, yet, conflicts between the two now occur in many regions of the world. Human-elephant conflict (HEC) features regularly in many regions where elephants live alongside man. This study addresses the human-elephant conflict on Mount Kenya, which occurs primarily due to humans and elephants competing for the same resources, namely habitat. Crop raiding is the primary result of the HEC and electric fences are erected to mitigate this conflict. The location of the fence is the principal determinant of its effectiveness whereby the alignment should adequately accommodate the needs of the elephants within the enclosed area. The boundary of Mount Kenya National Reserve is set as the hypothetical fence in this study and GIS is used as a tool to determine the habitat suitability of the enclosed area for the elephants. Elephant population growth rate and elephant population density are the two factors used to analyse the suitability and adequacy of the elephant habitat. Based on a compilation of past elephant population databases incorporated into GIS, this study concludes that the enclosed area will be sustainable up to the mid fifties of this century. However, considering the illegal farming within the fenced area, the sustainability is estimated until the mid twenties of this century. To complement the existing electric fence, buffer zones are proposed in order to ensure a more sustainable solution.
Introduction
Conflict between wildlife and people is a prevalent event where the two populations have a common interface. Human-elephant conflict (HEC) is a frequent feature in Asia and Africa because of sharing resources, mainly habitat. HEC is a frequent occurrence in the Mount Kenya region where the elephants (Loxodonta africana africana) raid crops on the farms and the farmers retaliate by injuring or killing the elephants. This contest results in an average of 3 human deaths and 12 elephant deaths per year (Vanleeuwe, pers. comm., 2003b). Increased human population growth rate and a high population density of 500-600 persons per km2 (Emerton, 1999) are identified as the primary cause of HEC. The ever-expanding human population is encroaching on the agriculturally fertile land of Mount Kenya (Emerton, 1999) and compressing the elephant habitat. This compression has resulted in the elephant population being marooned on a small ‘island’ on the mountain, surrounded by cultivation and settlement (Kangwana, 1995).
73
To address the HEC situation, the affected farmers have resolved to putting up an electric fence barrier. At the time of the study (2003), there were various small scale projects taking place whereby affected farmers were helped financially by various donors to put up electric fences. In most cases, the fence is placed at the boundary of the Mount Kenya National Reserve, and these are eventually planned to link and create a perimeter fence similar to the one on the Aberdares Range (Lambrechts et al., 2003). For this reason, the Mount Kenya National Reserve boundary has been set as the hypothetical perimeter fence in this study.
The perimeter fence, including the ring of human settlement and agriculture, results in closure of migratory exits and corridors and confines the elephants (Vanleeuwe & Lambrechts, 1999). This enclosure results in lack of freedom of movement for the elephants and may have detrimental effects on the existing and future elephant population (Laws et al., 1975).
Although the fence may check and reduce further human encroachment onto the elephant habitat, the purpose of the barrier may be overcome solely due to lack of sufficient suitable enclosed habitat for the current and future elephant population (FAO, 1998). Moreover, the fence will create an enclosed area, simulating a ‘Protected Area’ and can be classified as a ‘Fenced Reserve’. Protected areas act as elephant refuges and HEC has been observed to be high on agricultural land which is in close proximity to these areas thus the conflict may continue (Barnes et al., 1995; Bhima, 1998).
Considering the current trend of increasing elephant population, HEC occurrence will escalate. This rise in HEC could be attributed to the speculation that the ecological carrying capacity (with respect to the elephants) of the enclosed habitat will be reached and thereafter exceeded as elephant density increases due to limited habitat range (Laws et al., 1975; Blanc et al., 2003). In that case, elephants are likely to force their way onto the reserve-adjacent farms for food, despite being fenced (Hoare, 2000). Therefore it is important to determine a suitable size of the ‘Fenced Reserve’, and consequently the fence position to accommodate any future increase in the elephant population.
Additional need to determine a suitable size for the current and future population arises as population control mechanisms practiced in the open savannah are not entirely applicable for the Mount Kenya region. Translocation, for example, is very treacherous due to the steep gradient of the area and high density of forest cover (Vanleeuwe, pers. comm., 2003a).
The main aims of this paper are (1) to determine if an electric fence will control the HEC effectively and (2) to identify for what length of time the hypothetical fence (at its determined position and alignment) on the boundary of the Mount Kenya National Reserve will control HEC effectively. Since L. a. africana is endangered and in this case regarded as a pest (Sitati et al., 2003), it faces elimination from this ‘natural’ habitat with a great cost. It is important at this point that some intervening action is undertaken before the fence alignment could have drastic irreversible consequences on the elephant population.
Study area
Mount Kenya (Figure 1) is an extinct volcano located about 180km north of Nairobi, capital city of Kenya (Coe, 1967; Gathaara, 1999; UNDP, year unknown). It straddles the equator with a 120km wide base, and its highest peak, Nelion, (Coe, 1967) stands at an altitude of 5,199m, making it Africa’s second highest mountain (Gathaara, 1999; UNDP, year unknown).
The mountain has rich biological diversity (ecosystems and species), due to the wide range in altitude (1,200m-5,199m) and rainfall (Vanleeuwe and Lambrechts, 1999). The rich biological diversity can be illustrated within the 8 distinct forest types, accommodating 81 endemic flora species, 6 species of mammals of international conservation interest, of which

74
one is the African savannah elephant, Loxodonta africana africana (Gathaara, 1999; UNDP, year unknown).
%[
%[
%[
#S
#S
#S
#S
N an y uki
N y eri
E m bu
Tim auM eru
K aratin a
N aro M o ru
3 0 0 3 0 6 0 K i lometers
N
EW
S
3 0 0 3 0 6 0 K i lometers
N at io n al R es er ve (N R )N at io n al Park ( N P )H yp o thet ic al fenc e L ak eR iv ersR ailwayR oad s
%[ M ajor t ow n#S Min o r to w n
Legend
Figure 1. Location of Mount Kenya National Park and Reserve, Kenya.
Methodology
This study uses two sets of secondary data, spatial data for GIS analysis and elephant population data (Tables 1 and 2) to determine the elephant sustenance requirements. The spatial data including thematic polygon layers and physical features were incorporated into Arcview GIS version 3.2. Average elephant density was calculated from the elephant population dataset (compiled by African Elephant Specialist Group, AfESG) and was used to identify the areal requirements of the elephant population.
Table 1. The Park and Reserve area as inferred from ArcView GIS 3.2, and the officially stated.
Calculated Area (km2) Officially Stated Area (km
2) Percentage difference
Mount Kenya National Reserve
2011.07 2124 (Vanleeuwe et al., 2003)
5.32
Mount Kenya National Park
621.50 715 (KWS website) 13.08
Table 2. Elephant numbers, *calculated using population estimate and area surveyed, **calculated according to the officially stated area in Table 1. ***calculated with respect to the inferred area from ArcView GIS 3.2.
Source Douglas-
Hamilton, 1979 Reuling et al., 1992
Omondi et al., 1998
Vanleeuwe, 1999
Vanleeuwe et al. (year
unknown)
Cited in Cumming &
Jackson, 1984 Said et al.,
1995 Barnes et al., 1999
Pers. comm.
Blanc et al., 2003
Year of survey 1979 1991 1998 1999 2001
Area of survey (km2) 2000 1367 2810 - 2007
Elephant population estimate
3000 4245 4022 2270 2911
At 95% confidence limit
- ±1740 ±1083 - ±640
Elephant population density per km
2
1.5.* 3.10* 1.43 1.45*
Elephant numbers in National Reserve
3186.00** 3016.61***
6584.40** 6234.32***
3037.32** 2875.83***
3079.80** 2916.05***

75
Elephant population data were missing for consecutive years therefore the available population data were extrapolated on a graph to derive a trend-line and the population growth rate was derived from the graph equation (Figure 2). Data of year 1998 onwards were used so as to create a scenario to represent the period closer to the timing of the study. The derived growth rate was assumed constant for this study and is used to determine the adequacy and suitability of the fenced area.
y = 2862.7e0.0046x
R2 = 1
2870
2875
2880
2885
2890
2895
2900
2905
2910
2915
2920
0 1 2 3 4 5
Years after 1997
Ele
phan
t pop
ulat
ion
size
Results
The various GIS layers were analysed to identify favourable conditions and environmental barriers. Scrutinizing the area within the Mount Kenya National Reserve, it is observed that the entire reserve provides suitable conditions for elephant habitation.
Considering that 71% of the elephant paths studied by Vanleeuwe and Lambrechts (1999) are below 10º, this is hypothesized to be the preferred slope for elephant habitation. GIS analysis revealed that majority of the area within the National Reserve is below a slope of 10º therefore suitable for elephants (Figure 3). Average elephant density of 1.87 elephants per km2 was calculated from the elephant population dataset (table 2). The derived growth rate was 0.46% per year (Figure 2). Incorporating the density and annual percentage growth rate of the elephants, the area within the National Reserve is calculated to sustain the elephant population up to the year 2056.
%[
%[
%[
#S
#S
#S
#S
N an y uki
N y eri
E mbu
Tim auM eru
K aratina
N aro M o ru
3 0 0 3 0 6 0 K ilometers
N
EW
S
3 0 0 3 0 6 0 K ilometers
Slop e of E levation 0 - 1010 - 2020 - 90
Hy po thetical fence Nat ional P ark (NP )LakeRailw ayRo ads
%[ Major tow n#S Minor tow n
Legend
Figure 2. Elephant population growth rate.
Figure 3. Indication of suitable slopes (slopes less than 10°) on Mount Kenya.
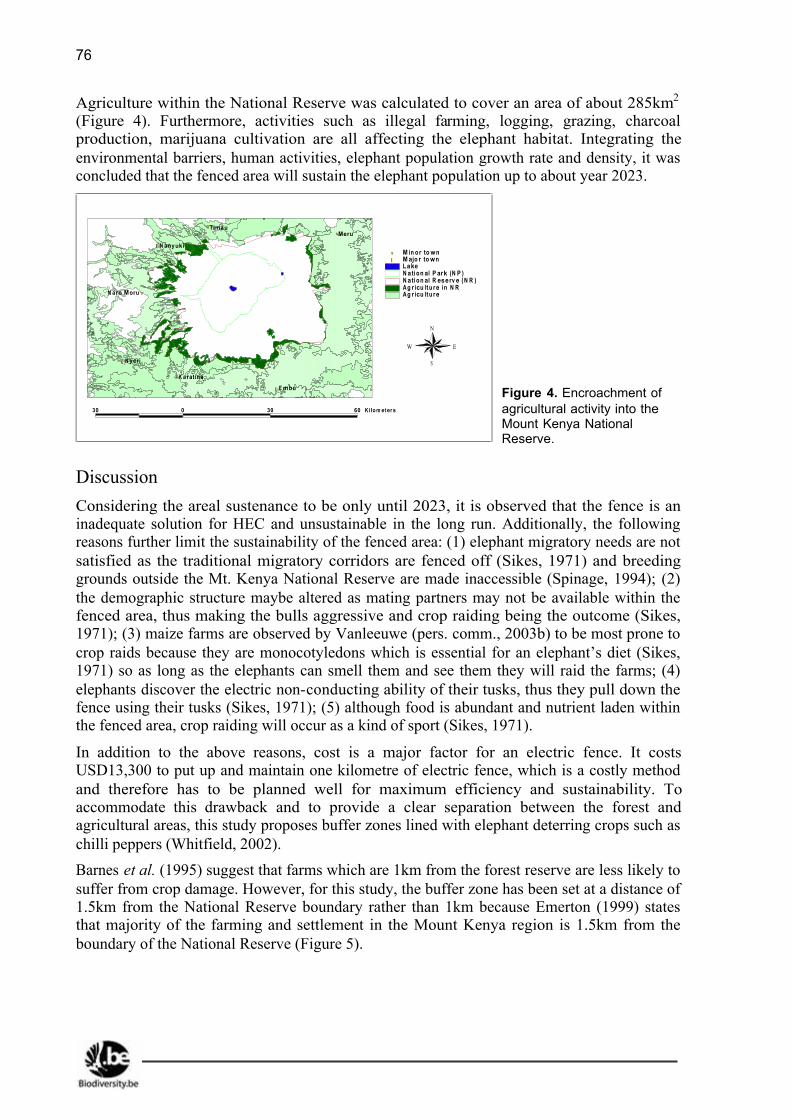
76
Agriculture within the National Reserve was calculated to cover an area of about 285km2 (Figure 4). Furthermore, activities such as illegal farming, logging, grazing, charcoal production, marijuana cultivation are all affecting the elephant habitat. Integrating the environmental barriers, human activities, elephant population growth rate and density, it was concluded that the fenced area will sustain the elephant population up to about year 2023.
%[
%[
%[
#S
#S
#S
#S
N anyuki
N yeri
E mbu
TimauMeru
K aratina
N aro Moru A g r icu ltu reA g r icu ltu re in N RN ati on al R eserv e ( N R )N ati on al P ark (N P )Lake
%[ M ajo r to wn#S M in or to wn
30 0 30 60 K ilo m et er s
N
EW
S
Discussion
Considering the areal sustenance to be only until 2023, it is observed that the fence is an inadequate solution for HEC and unsustainable in the long run. Additionally, the following reasons further limit the sustainability of the fenced area: (1) elephant migratory needs are not satisfied as the traditional migratory corridors are fenced off (Sikes, 1971) and breeding grounds outside the Mt. Kenya National Reserve are made inaccessible (Spinage, 1994); (2) the demographic structure maybe altered as mating partners may not be available within the fenced area, thus making the bulls aggressive and crop raiding being the outcome (Sikes, 1971); (3) maize farms are observed by Vanleeuwe (pers. comm., 2003b) to be most prone to crop raids because they are monocotyledons which is essential for an elephant’s diet (Sikes, 1971) so as long as the elephants can smell them and see them they will raid the farms; (4) elephants discover the electric non-conducting ability of their tusks, thus they pull down the fence using their tusks (Sikes, 1971); (5) although food is abundant and nutrient laden within the fenced area, crop raiding will occur as a kind of sport (Sikes, 1971).
In addition to the above reasons, cost is a major factor for an electric fence. It costs USD13,300 to put up and maintain one kilometre of electric fence, which is a costly method and therefore has to be planned well for maximum efficiency and sustainability. To accommodate this drawback and to provide a clear separation between the forest and agricultural areas, this study proposes buffer zones lined with elephant deterring crops such as chilli peppers (Whitfield, 2002).
Barnes et al. (1995) suggest that farms which are 1km from the forest reserve are less likely to suffer from crop damage. However, for this study, the buffer zone has been set at a distance of 1.5km from the National Reserve boundary rather than 1km because Emerton (1999) states that majority of the farming and settlement in the Mount Kenya region is 1.5km from the boundary of the National Reserve (Figure 5).
Figure 4. Encroachment of agricultural activity into the Mount Kenya National Reserve.

77
%[
%[
%[
#S
#S
#S
#S
N anyuki
N yeri
E mbu
Tim auMeru
K aratina
N aro Mo ruNR buffer outNR buffer inNational R es erve (N R )National Park (N P)LakeRoads
%[ Major town#S Minor town
30 0 30 60 K ilo m et er s
N
EW
S
There are two possibilities for the buffer zone, in the National Reserve or outside the National Reserve. A buffer zone outside the National Reserve will be problematic because the area is densely populated and farmed, thus raising issues of land ownership. However, a buffer zone planted with elephant-repellent crops inside the National Reserve may be problematic because it has a protection status of World Heritage site and a Biosphere Reserve.
To address the above issue the study further suggests that a double fence be erected, that is an electric fence at 1.5km inside the National Reserve and a regular barbed wire fence at the National Reserve boundary, lined with chilli peppers. Moreover, this reduces the length of the electric fence required (due to reduced perimeter length) and thus its costs and also avoids abrupt ending of agricultural area at the electric fence.
Conclusion
The outcome of the study directly shows how important the alignment and position of the fence can be. Additional elephant population data, requirements and barriers should be integrated in future research for enhanced results. Although the elephant is a flagship species and warrants greater conservation priorities, it is important to study other affected species in the ecosystem so that the fence position would cater for the species and their needs. Recognising the complexity of the issue, a compromise between humans and elephants has to be achieved for sustainable co-existence.
However, it must be noted that many difficulties (e.g. unaffordable high fees for essential GIS information) were encountered while searching for GIS information and detailed elephant data for the study area. Consequently, this led to limited results thus affecting this study. This shows that the access, distribution and sharing of such data is not only useful but also imperative for effective dissemination worldwide.
Acknowledgements
This study was undertaken as a partial fulfilment of a BSc degree in Environmental Science at the University of East Anglia (UEA), U.K. I am very grateful to FAO Africover for their provision of free access to GIS data for this project. I would like to thank my supervisor, Andrew Lovett, for his patience and invaluable assistance towards this study.
Figure 5. Suggested buffer zones at the Mount Kenya National Reserve boundary.

78
References
Barnes, R.F.W., S. Azika & B. Asamoah-Boateng, 1995. Timber, cocoa, and crop-raiding elephants: A preliminary study from Southern Ghana. Pachyderm 19: 33-38.
Barnes, R.F.W., G.C. Craig, H.T. Dublin, G. Overton, W. Simons, & C.R. Thouless, 1999. African Elephant Database 1998 (AED), IUCN/SSC African Elephant Specialist Group (AfESG). IUCN, Gland, Switzerland and Cambridge, UK. x + 250pp.
Bhima, R., 1998. Elephant status and conflict with humans on the western bank of Liwonde National Park, Malawi. Pachyderm 25: 74-80.
Blanc, J.J., C.R. Thouless, J.A. Hart, H.T. Dublin, I. Douglas-Hamilton, G.C. Craig & R.F. W. Barnes, 2003. African Elephant Status Report 2002 (AESR): An update from the African Elephant Database (AED), IUCN/SSC African Elephant Specialist Group (AfESG). IUCN, Gland, Switzerland and Cambridge, UK. vi + 304pp.
Coe, M. J., 1967. The Ecology of the Alpine zone of Mount Kenya. W. Junk, The Hague.
Cumming, D. H. M., & P. Jackson, 1984. The Status and Conservation of Africa’s Elephants and Rhinos, IUCN.
Emerton, L., 1999. Mount Kenya: The Economics of Community Conservation. Evaluating Eden Series, Discussion Paper 4.
FAO, 1998. Kenya – Aberdare Natural Resources Development Project: Environmental Impact Assessment Report. FAO Investment Centre and ADB Cooperative Programme, 141pp.
Gathaara, G., 1999. Aerial Survey of the Destruction of Mt. Kenya, Imenti and Ngare Ndare Forest Reserves. Nairobi, Forest Conservation Programme / KWS, 33pp.
Hoare, R., 2000. African elephants and humans in conflict: the outlook for co-existence. Oryx 34: 34-38.
Kangwana, K., 1995. Human-Elephant conflict: The challenge ahead. Pachyderm 19: 11-14.
Laws, R.M., I.S.C. Parker & R.C.B. Johnstone, 1975. Elephants and their habitats: The Ecology of Elephants in North Bunyoro, Uganda. Oxford University Press.
Lambrechts, C., B. Woodley, C. Church, & M. Gachanja, 2003. Aerial Survey of the Destruction of the Aberdare Range Forests, UNEP, KWS, RhinoArk, KFWG, 53pp.
Said, M.Y., R.N. Chunge, G.C. Craig, C.R. Thouless, R.F.W. Barnes, & H.T. Dublin, 1995. African Elephant Database 1995 (AED), IUCN, Gland, Switzerland. 225pp.
Sikes, S.K., 1971. The Natural History of the African Elephant. Weidenfeld and Nicolson.
Sitati, N.W., M.J. Walpole, R.J. Smith & N. Leader-Williams, 2003. Predicting spatial aspects of human-elephant conflict. Journal of Applied Ecology 40: 667-677.
Spinage, C.A., 1994. Elephants. T & A D Poyser Natural History Ltd.
UNDP, year unknown. A Recovery Vision for Mt. Kenya National Reserve and World Heritage Site: A working document for the Mount Kenya Donor/Partner Forum. UNDP-GEF/SGP.
Vanleeuwe, H. & C. Lambrechts, 1999. Human Activities on Mount Kenya from an Elephant’s Perspective. Pachyderm 27: 69-73.

79
Vanleeuwe, H.,B. Woodley, C. Lambrechts & M. Gachanja, 2003. Changes in the state of conservation of Mt. Kenya forests: 1999-2002, An Interim Report, DICE, KWS, UNEP, KFWG. Nairobi, Kenya.
Vanleeuwe, H., pers. comm., 2003a. Personal communication by e-mail dated 01/10/2003.
Vanleeuwe, H., pers. comm., 2003b. Personal communication by e-mail dated 16/12/2003.
Whitfield, J., 2002. Elephants don’t like it hot. Published online: 16 July 2002. news@nature
80
The tropical collections of the University of Liège Museum of Zoology: diversity, database and access
Loneux, M.
Museum of Zoology curator (1991-2003), (University of Liège, Zoological Institute, Quai Van Beneden 22, B-4020 Liège, Belgium. [email protected] Contact for collections: [email protected] or [email protected] Museum website: www.ulg.ac.be/museezoo
Keywords: University of Liège Museum of Zoology, tropical collections
Abstract
The University of Liège Museum of Zoology is one of the oldest Belgian academic museums. Its collections comprimes specimens from all over the world, of which one third comes from tropical countries. Most of these specimens have been collected from 1820 to World War I. Main collectors of that period were the famous explorer Francis de Laporte (‘Comte de Castelnau’) and Edouard van Beneden. Cooperation projects with some African countries and a scientific expedition to the Australian Reef Barrier brought back more specimens to the Museum. Since the 1980s the Museum mainly focuses on the educational espect of the collections, and does not use them any more as research material.
This contribution expresses the scientific value of the Museum’s tropical collection, where its quantity, quality, diversity, historical value, systematic types, extensive database (more than 21,700 items) and systematic organization is certainly worth the visit by scientist interested in tropical biodiversity.
The University of Liège zoological collections
Founded in 1817, the University of Liège is one of the three oldest universities in Belgium, along with Leuven and Ghent. Because of the obligation to illustrate the courses (official decree by King Guillaume I in 1816), most of its collections were purchased during the 19th century. The collections expanded to a worldwide biodiversity range notably by the contributions of two famous professors successively in charge of the courses: Jean-Theodore Lacordaire (1835 to his death in 1871) and Edouard Van Beneden (1871 to his death in 1910).
The collected specimens are registered since 1837 in handwritten catalogues, which are still preserved. They were used as a reference to build a computerized database of the collections. The limited information given by the catalogues has been completed since 1996 by several new data-fields (taxonomy, synonymy, continent, conservation status in the world, etc.), useful to sort the specimen cards and extract interesting information (Loneux 2002, 2005a). These ongoing improvements are made step by step, from need and queries, and are not yet completed in the same way for all the taxa, but the level of digitization allows to present the nature and diversity of the collection.
The collection database lists 21,790 specimen cards (January 15th, 2005), which represent at least 31,991 specimens of invertebrates and vertebrates. The Filemaker Pro database facilities allow any search or sort and since the geographic information has been added in separated

81
fields (Loneux 2005b), it is now possible to summarize the holdings by continent or country, focusing on tropical origin.
Major sources of the tropical collections
Between 1850 and 1865, Lacordaire purchased numerous vertebrate specimens from South-East Asia, South America and Australia. One of his providers was the famous explorer Francis de Laporte, better known as ‘Comte de Castelnau’. The succeeding professor Van Beneden collected hundreds of specimens during his expedition in Brazil in 1872 (Van Beneden, 1873).
After World War II, Belgian cooperation projects with some African countries brought back many specimens from Africa, in particular from the Democratic Republic of the Congo. During the same period, the collections were reorganised in the renovated Museum of Zoology, which officially opened to the public in November 1962. In 1967, the University of Liège organised a scientific expedition to the Australian Reef Barrier (Büssers, 1970), from which numerous marine specimens generated the creation of a special exhibition room about corals.
Since the 1980s, the Museum does not purchase collections or specimens anymore. The growth of the collection during the last twenty years is the result of private gifts and donations, concerning mainly birds, insects and mammals, which are not restricted the European continent.
Diversity of the tropical collections
The tropical collections at the museum contain vertebrates as well as invertebrates. According to a sorting key by country, 8,167 of the 21,790 specimens recorded in the database concern tropical species (South America, Central America, Africa, South-East Asia, Indonesia, Australia). This corresponds to 9,875 specimens, which makes up 31% of all specimens. 80% of these are vertebrates (6,832 cards corresponding to 7,987 specimens). Of the invertebrates, almost all phyla are represented, but Mollusca, Arachnida, Echinodermata and Cnidaria are more abundant. Another considerable source is Pergens’ Bryozoa collection, which comprises at least 1,400 specimens, but these are not exclusively from the tropics.
Scientific interest of the tropical collections
Quantity
31% of all recorded specimens come from tropical countries, but the invertebrates – especially the insects – are not individually registered yet. Thus, several thousands of specimens could be added: 8,000 insects from Paraguay (Estacion entomologica Fabre from 1937), 11,000 moths and butterflies from the Léon Candèze collection (South-East Asia, Africa, etc.), several hundreds of African butterflies from the collections of J. Hamoir and G. Faniel, several hundreds of Brazilian insects and crustaceans collected by E. Van Beneden and his collaborators, etc. Thus, the total of tropical specimens preserved at the museum is 4 times more than officially recorded!
Quality
The collections holds only one sample from Yemen, registered in the catalogue as Branchipus nov. sp. (Crustacea, Branchiopada) in 1877, but was never studied for more than one century.

82
The second Crustacean Conference organised in Liège (September 1996) offered an opportunity to revise the collection of branchiopods, thanks to the collaboration of a French specialist (Loneux & Thiéry, 1998). He identified the sample as Streptocephalus simplex Gurney, 1906. The sample contained several specimens, including females with eggs (cysts), which were new to science. The morphological structure of the cyst envelope – nowadays described with a Scanning Electron Microscope (SEM) – is a diagnosis criterion for this taxon (Thiéry, pers. comm.). Their description was published in 1996 in the Fauna of Saudi Arabia (Thiéry, 1996). This illustrates that even very few old specimens can be of big scientific interest.
Historical value
As historic collections, the collections at the museum can provide information on the biodiversity of the past. Some of the specimens preserved up to now represent species (not restricted to tropical areas) that are currently vulnerable, threatened, endangered or even extinct. DNA studies can be based on samples from these specimens.
Systematic types
The collections of the museum hold a few scientific types among the Cnidaria, Kamptozoa, Tunicata and Trematoda, mainly described by Van Beneden and collaborators, but these types do not come from the tropics. The recently described and tropical Antisabia juliae Poulicek, Büssers & Vandewalle, 1996 (Mollusca, Hipponocidae), coming from Papouasia is represented by 6 paratypes. There is currently no complete inventory of all systematic types present in the collections.
Collection database
The handwritten catalogues of the collections provided information on registration number, scientific name, place of capture and/or country of origin, date of capture and/or registration, preservation mode, provider’s name and (if applicable) cost of purchase. They were used as a reference to build a computerized database, where we added new fields such as taxonomy, synonymy, country, continent, conservation status, references to publications, place of storage, etc.
Precise information on location was often limited to ‘area of origin’ with obsolete names of the 19th century. More information is sometimes available on the specimen label, but this should be checked for all specimens. A nomenclature update was done for most vertebrates (birds, mammals, reptiles, fish…) and some invertebrates, based on available literature and collaboration with specialists (for Branchiopoda, Ceriantharia, etc.)
To complete and improve the database, the following steps are recommended:
(1) to inventory all the depositories;
(2) to check and record every specimen: some are not registered at all, e.g. numerous crustaceans from Brazil;
(3) to list the systematic types preserved in the collections;
(4) to diffuse the data through publications and online access to the database;
(5) to favour partnership and collaborations.

83
The actual constraints for these works are:
(1) the lack of staff for collection management and care, or even accompanying volunteer work;
(2) the lack of funding for scientific valorisation;
(3) the lack of scientific recognition from funding providers.
Collection access
Since the official merger of the Museum of Zoology and the Aquarium in 2004, public revaluation is the only objective. The public exhibition – organized and accessible for students and the general public – is open every day of the year. The major part of the collections, however, is hidden in the large depository rooms and cabinets and is untouched for tens of years. The specimens are – as the collections in the exhibition rooms – systematically organised and accessible for any interested researcher.
To contact the museum or to make an appointment with the current curator Dr. Christian Michel to visit the depositories, use one of the following e-mail addresses: [email protected] or [email protected].
For more information, visit www.ulg.ac.be/museezoo.
References
Büssers, J.-C., 1970. La Grande Barrière d’Australie. Les Naturalistes belges 51 (1): 2-34.
Loneux, M., 2002. Trésors des collections scientifiques du Musée de zoologie (ULg): atouts pour la connaissance de la faune belge. Symposium Etat de la Faune belge, 14 décembre 2001, I.R.S.N.B. Bruxelles. Bulletin de l’Institut Royal des Sciences Naturelles, Biologie 72-Suppl.: 263-269.
Loneux, M., 2005a. How to develop an unrecognized scientific heritage: the case of the University of Liège Zoological Collections, Belgium. pp 77-84 in Tirrell P. (ed.), Proceedings of the Third Conference of the International Committee for University Museums and Collections (UMAC). Norman, Oklahoma: Sam Noble Oklahoma Museum of Natural History, September 2003.
Loneux, M., 2005b. The birds in the collections of the Zoological Museum of the University of Liège: diversity and interest, a first approach. Pp.29-34 in Dekker, R.W.R.J., M. Güntert, P. Howlett, M. Loneux & C.S. Roselaar (Eds), 2005. Proceedings of the Third European Conference on Bird Collections, 10-12 October 2003, National Museum of Natural History, Leiden, The Netherlands. Zoologische Mededelingen Leiden 79-3, 30- ix-2005, 183pp
Loneux, M. & A. Thiéry, 1998. Révision des grands branchiopodes conservés au Musée de Zoologie de l’Université de Liège: Intérêt des collections muséologiques. Naturalistes belges 79 (2): 33-47.
Thiéry, A., 1996. Large branchiopods (Crustacea: Anostraca, Notostraca, Spinicaudata, Laevicaudata) from temporary inland waters of the Arabian Peninsula. Fauna of Saudi Arabia 15: 37-98.
Van Beneden, E., 1873. Rapport sommaire sur les résultats d’un voyage au Brésil et à la Plata. Bulletin de l’Académie royale de Belgique 2ème série, t. XXXV, 6: 3-20.

84
The tropical birds preserved at the University of Liège Museum of Zoology
Loneux, M.
Museum of Zoology curator (1991-2003), University of Liège, Zoological Institute, Quai Van Beneden 22, B-4020 Liège, Belgium. [email protected] Contact for collections: [email protected] or [email protected] Museum website: www.ulg.ac.be/museezoo
Keywords: university museum collections, birds, threatened & extinct species, South East Asia, South America, Africa
Abstract
According to the list of the ‘Threatened bird of the world’, most of the threatened bird species live in tropical areas, notably South America and South East Asia. The University of Liège Museum of Zoology holds numerous birds from these tropical areas, collected and purchased during the 19th century. This contribution is an inventory of the tropical bird species preserved in collections and lists the specimens which belong to the threatened or extinct species.
Introduction
The University of Liège Museum of Zoology holds collections since its foundation in 1817, to illustrate the natural history courses. The collections grew notably during the first century of the University’s existence (Loneux 2005a). They hold about six thousands bird specimens at the moment, which constitute half the vertebrates in collection. They were collected from all over the world and are preserved as mounted skins, skeletons, skulls, eggs or organs in fluid. Nearly all bird families are represented (Loneux 2005b).
A database of all specimens in collection has been developed since 1992, based on the old successive handwritten registers of the collections. In 1996, it has been improved with a useful storage inventory and geographic and taxonomic information (Loneux 2005a). This particularly applies to birds, for which abundant and well-documented taxonomic literature was available (Walters 1980, Wolters 1982, Del Hoyo et al. 1992-2002, Del Hoyo et al. 2003-2004, Perrins 1991).
According to the ‘Atlas of the endangered species’ (Mackay 2002) and the ‘List of the threatened birds of the world’ (Birdlife International 2000 updated online, IUCN 2004), most of the threatened bird species live in tropical areas, notably South America and South East Asia. The Museum of Zoology holds numerous birds from these tropical areas, and most of them have been purchased in the 19th century. This contribution inventories the tropical bird species preserved in collections and lists the specimens belonging to the presently threatened or extinct species.

85
Material and method
Thanks to the collection-database (Filemaker Pro software), searching and extracting the birds in collection was easy, and sorting them by any key was possible. We used the database fields ‘Continent’ and ‘Country’ to sort by geographic origin. In addition, two fields were added to each specimencard in the database: one field containing a sort number to represent the systematic order of the bird families, and a second field describing the present conservation status of the species.
This conservation status data was obtained from the red list category of the IUCN (2004), published on their website ( www.redlist.org), considering the 9,917 bird species described to date. This red list totalizes 1,213 ‘Globally Threatened Birds’ (GBTs), which can be subdivided in 179 ‘critically endangered’, 345 ‘endangered’ and 689 ‘vulnerable’ species. In addition, the information on extinct species has been checked in Balouet & Alibert (1990) and completed in the conservation status field.
Results
The database comprises 5,944 specimencards of birds (April,10 2005), recorded since 1837. Among these cards, 271 concern specimens that are definitively lost, 5,614 cards correspond to a single specimen and the remaining concern multiple specimens or even multiple species per card. The exact number of bird specimens in collection to date – expected to be between 5900 and 5995 – is not yet defined, because three series of European birds (1x10⁴, 1x28 and 1x44) include several damaged specimens, which are not noted separately in the catalogues.
Figure 1. Geographic range of the bird specimens at the museum.
Table 1. Numbers of bird specimens at the museum from tropical countries. A few islands and countries have not been included.
Country Number of bird specimens
Antilles 13
Angola 4
Australia 529
Botswana 53
Brazil 425
Cambodia 75
Chile 140
China 61
Colombia 299
Congo (DRC) 49
Costa-Rica 2
Cuba 3
Ecuador 60
Egypt 14
Ethiopia 25
Guatemala 113
Guyana 189
India 67
Indonesia (Java) 221
Indonesia (Sumatra)
58
Indonesia (Borneo)
12
Indonesia (Seram) 110
Indonesia (Celebes)
6
Madagascar 19
Malaysia (Malacca)
403
Mexico 175
Myanmar 11
Nepal 9
Papua New Guinea
54
Peru 16
Philippines 36
Rwanda-Burundi 127
Senegal 52
South Africa 334
Sri-Lanka 94
Suriname 2
Thailand 37
Venezuela 33
3930

86
Two thirds (3,930) of the bird specimens come from the tropical areas (Figure 1) and most of them have been collected and purchased during the 19th century. Almost 700 of this bird specimens where collected by the famous explorer ‘Comte de Castelnau’ between 1830 and 1860, in South East Asia and South America. A list of tropical countries and their number of bird specimens in collection is given in Table 1.
A detailed list of birds from Rwanda-Burundi collected by J. Lewalle and registered in the museum catalogue in 1990, is given in Table 2. Most of the specimens of this collection are not yet identified and should be studied by specialists in African birds.
Table 2. List of birds from Rwanda–Burundi collected by J. Lewalle and registered in the museum catalogue in 1990.
Catalogue number (RE)
Family Number of specimens
Species name
13781 Alcedinidae 1 Alcedo cristata (Pallas, 1764)
13780 Alcedinidae 2 Halcyon leucocephala (P. L. S. Müller, 1776)
13798 Ardeidae 2 Bubulcus ibis ibis (Linnaeus, 1758)
13774 Ardeidae 2 Bubulcus ibis ibis (Linnaeus,1758)
13775 Ardeidae 3 Ixobrychus minutus (Linnaeus, 1766)
13795 Bucerotidae 1 To identify
13799 Charadriidae 1 To identify
13803 Columbidae 2 To identify
13797 Coraciidae 3 To identify
13788 Coraciidae 1 Coracias caudatus Linnaeus, 1766
13789 Coraciidae 1 Coracias garullus Linnaeus, 1758
13804 Corvidae 2 To identify
13777 Corvidae 1 Corvus albicollis Latham, 1790
13792 Cuculidae 11 To identify
13778 Cuculidae 1 Cuculus solitarius Stephens, 1815
13794 Laniidae 5 To identify
13787 Meropidae 1 Merops corsicus
13786 Meropidae 1 Merops nubicus nubicoïdes Des Murs & Pucheran, 1846
13785 Meropidae 1 Merops superciliosus Linnaeus, 1766
13793 Muscicapidae 2 To identify
13801 Nectariniidae 9 To identify
13782 Nectariniidae 1 Anthreptes collaris (Vieillot, 1819)
13806 Phalacrocoracidae 5 To identify
13776 Phalacrocoracidae 1 Phalacrocorax africanus africanus (Gmelin, 1789)
13802 Phasianidae 1 To identify
13784 Pittidae 1 Pitta angolensis Vieillot, 1816
13796 Rallidae 6 To identify
13791 Scolopacidae 3 To identify
13790 Scolopacidae 1 Gallinago media (Latham, 1787)
13805 Strigidae 1 To identify
13783 Sturnidae 1 Lamprotornis purpurcopterus Rüppell, 1845
13779 Threskiornithidae 1 Bostrychia hagedash (Latham, 1790)
13800 Passeriforma 52 To identify

87
169 specimencards of the bird collection of the museum concern species listed as world-threatened or extinct (sensu IUCN 2004). Of these specimens, 13 are lost, 35 are exhibited in public showcases (Table 3) and 14 have been checked in the depository. The presence of the other 108 specimens must still be verified in the storage depositories.
Table 3. List of the 35 specimens of threatened bird species exhibited in the public rooms of the museum, as stuffed specimen (ST), mounted skeleton (MOSK) or skull (SK). Status derived from IUCN red list (2004) and Balouet & Alibert (1990).
Species Family Status Nature
Apteryx australis mantelli Bartlett, 1852 Apterygidae vulnerable ST
Apteryx australis Shaw, 1813 Apterygidae vulnerable MOSK
Ara militaris (Linnaeus, 1766) Psittacidae vulnerable ST
Balaeniceps rex Gould, 1850 Balaenicipitidae vulnerable ST
Casuarius casuarius (Linnaeus, 1758) Casuariidae vulnerable ST
Casuarius casuarius (Linnaeus, 1758) Casuariidae vulnerable MOSK
Cephalopterus glabricollis Gould, 1851 Cotingidae vulnerable ST
Chlamydotis undulata macqueenii (J.E. Gray, 1832) Otididae vulnerable ST
Crax pauxi (Linnaeus, 1766) Cracidae vulnerable SK
Diomedea exulans exulans Linnaeus, 1758 Diomedeidae vulnerable ST
Ectopistes migratorius (Linnaeus, 1766) Columbidae extinct (1914) ST (male)
Ectopistes migratorius (Linnaeus, 1766) Columbidae extinct (1914) ST (female)
Epimachus fastuosus (Hermann, 1783) Paradisaeidae vulnerable ST (male)
Epimachus fastuosus (Hermann, 1783) Paradisaeidae vulnerable ST (female)
Falco naumanni (Fleischer, 1818) Falconidae vulnerable ST
Fregata aquila (Linnaeus, 1758) Fregatidae vulnerable ST
Fregata aquila (Linnaeus, 1758) Fregatidae vulnerable MOSK
Goura cristata (Pallas, 1764) Columbidae vulnerable ST
Goura victoria (Fraser, 1844) Columbidae vulnerable ST
Heteralocha acutirostris (Gould, 1837) Callaeidae extinct (1907) ST
Leptoptilos javanicus (Horsfield, 1821) Ciconiidae vulnerable ST
Leptoptilos javanicus (Horsfield, 1821) Ciconiidae vulnerable MOSK
Lorius garrulus (Linnaeus, 1758) Psittacidae endangered ST
Nestor meridionalis (J. F. Gmelin, 1788) Psittacidae vulnerable ST
Otis tarda tarda Linnaeus, 1758 Otididae vulnerable ST
Procnias tricarunculata (Verreaux, 1853) Cotingidae vulnerable ST
Psittrichas fulgidus (Lesson, 1830) Psittacidae vulnerable ST
Raphus cucullatus (Linnaeus, 1758) Raphidae extinct (1680) SK (copy)
Rhynochetos jubatus J.Verreaux & Des Murs,1860 Rhynochetidae endangered ST
Rynchops albicollis Swainson, 1838 Rynchopidae vulnerable ST
Strigops habroptilus G. R. Gray, 1845 Psittacidae critically endangered
ST
Strigops habroptilus G. R. Gray, 1845 Psittacidae critically endangered
MOSK
Syrmaticus reeviisi J. E. Gray, 1829 Phasianidae vulnerable ST
Tangara peruviana (Desmarest, 1806) Emberizidae vulnerable ST
Tragopan melanocephalus (J. E. Gray, 1829) Phasianidae vulnerable ST

88
If we ignore multiple specimens of one species and specimens definitively lost, the collection houses 97 species of globally threatened or extinct birds. The geographic range of these threatened species is given in Table 4. Among the 169 specimens concerned, 119 specimens (70%) come from tropical areas and 50 from non-tropical areas, but it is important to stress that quantity is not the main interest of a collection. For example, the only two bird specimens from Costa Rica (Table 1) are both threatened species and one of the mere three bird specimens from Cuba (1/3 of the holdings) and two of the eight specimens from Paraguay (1/4 of the holdings) concern globally threatened species.
Table 4. Geographic range of the globally threatened or extinct birds, subdivided per continent: 169 specimens (97 species) of which 119 are certainly tropical. More specific information between brackets: number of globally threatened or extinct bird specimens out of total bird specimens (Table 1) for that country.
Geographic area Number of specimens
Tropical Africa 8 (Madagascar: 1 out of 19)
Central America 6 (Costa Rica: 2 out of 2)
(Cuba: 1 out of 3)
South America 35 (Paraguay: 2 out of 8)
(Brazil: 25 out of 425)
(Colombia: 5 out of 299)
South East Asia (tropical) 42 (Mallaca: 8 out of 403)
(Java: 13 out of 221)
(Seram: 11 out of 110)
(Borneo: 1 out of 12)
Oceania 28 (Australia: 19 out of 521)
(Melanesia: 2 out of 2)
(Papouasia: 7 out of 58)
Non-tropical Oceania 12 (New South Wales (Australia): 2 out of 8)
(Tasmania: 2 out of 4)
(New Zealand: 8 out of 22)
Pacific Ocean 7
Non-tropical Asia 9
Eurasia 3
Europe 9
North Africa 1
North America 5
Atlantic Ocean 1
Antarctica 3
169
Discussion
Although all exhibited bird specimens will be inventoried and checked (435 specimens so far), the biggest part of the collection remains ‘hidden’ in the depositories. 4,279 bird specimens listed in the database have no information on the storage location yet and their presence should be checked.
The inventory of the depositories began in 2001 with the voluntary collaboration of teenagers interested in collection management and valorisation (Loneux 2005a), but this initiative stopped with the dismissal of a separate curator for the museum in 2003, and the fusion with

89
the Aquarium. The lack of staff and funding did not allow completing the inventory, but most of the birds seem to be preserved in the wooden boxes in the storage room, where the former curators arranged them by systematic family in the 40s and 50s.
Information on geographic origin and gender of a specimen – which was retrieved from the handwritten catalogues or the specimen label – is completed for a small part of the inventory. More management and scientific work on the collection should be done to achieve this initiative.
Conclusion
The tropical bird collection at the University of Liège Museum of Zoology is interesting for research, due to its numerous tropical species, diversity in geographic origins, historic background and rather good preservation state of its specimens. More visit/study-requests from researchers would bring greater recognition to the museum, where lately only its educational role – through its permanent exhibition – is considered.
Today most university museums and collections in Europe as well as in the USA face severe financial and appreciation problems, and must therefore demonstrate the value of their heritage to and for research and society (Davis 1996, Ferriot & Lourenço 2004, Gropp 2003, Suarez & Tsutsui 2004). This trend has led to the recent creation of the special working group UMAC (University Museums And Collections) inside the ICOM (International Council Of Museums) (Stanbury 2001).
Beyond the presentation of the tropical birds preserved at the University of Liège Museum of Zoology, this contribution is therefore also a call to researchers to take into account all available museum collections: those at national museums as well as those at regional and academic museums. This would help smaller museums to get better recognition as complementary resource for current research, as we tried to do for the museum at Liège (Loneux & Thiéry 1998, Loneux 2002, Loneux 2005b).
References
Balouet J.C. & E. Alibert, 1990. Extinct species of the world. Lessons for our future. Charles Letts & Co Ltd., London.
BirdLife International, 2000. Threatened birds of the world. Barcelona and Cambridge, UK: Lynx Edicions and BirdLife International.
Davis, P., 1996. Museums and the natural environment: the role of natural history museums in biological conservation. Leicester University Press, London & New York.
Del Hoyo, J., A. Elliott & J. Sargatal, 1992-2002. Handbook of the birds of the world. Volumes 1-7. Ostrich to Woodpeckers. Lynx Edicions, Barcelona.
Del Hoyo, J., A. Elliott & D. Christie, 2003-2004. Handbook of the birds of the world. Volumes 8-9. Lynx Edicions, Barcelona.
Ferriot, D. & M. Lourenço, 2004. De l’utilité des musées et collections des universités. La Lettre de l’OCIM, 93: 4-16.
Gropp, R.E., 2003. Are university natural science collections going extinct? Bioscience 53: 550.

90
IUCN 2004: 2004 IUCN red list of threatened species. www.redlist.org
Loneux, M., 2002. Trésors des collections scientifiques du Musée de zoologie (ULg): atouts pour la connaissance de la faune belge. Symposium Etat de la Faune belge, 14 décembre 2001, I.R.S.N.B. Bruxelles. Bulletin de l’Institut Royal des Sciences Naturelles, Biologie 72-Suppl.: 263-269.
Loneux, M., 2005a. How to develop an unrecognized scientific heritage: the case of the University of Liège Zoological Collections, Belgium. pp 77-84 in Tirrell P. (ed.), Proceedings of the Third Conference of the International Committee for University Museums and Collections (UMAC). Norman, Oklahoma: Sam Noble Oklahoma Museum of Natural History, September 2003.
Loneux, M., 2005b. The birds in the collections of the Zoological Museum of the University of Liège: diversity and interest, a first approach. Pp.29-34 in Dekker, R.W.R.J., M. Güntert, P. Howlett, M. Loneux & C.S. Roselaar (Eds), 2005. Proceedings of the Third European Conference on Bird Collections, 10-12 October 2003, National Museum of Natural History, Leiden, The Netherlands. Zoologische Mededelingen Leiden 79-3, 30- ix-2005, 183pp
Loneux, M. & A. Thiéry, 1998. Révision des grands branchiopodes conservés au Musée de Zoologie de l’Université de Liège: Intérêt des collections muséologiques. Naturalistes belges, 1998, 79 (2): 33-47.
Mackay, R., 2002. The atlas of endangered species – Threatened plants and animals of the world. Earthscan Ed., London. 128 pp.
Perrins, C., 1991. L’encyclopédie mondiale des oiseaux. L’inventaire de tous les oiseaux du monde. Les principales espèces illustrées et décrites. Bordas, Paris. 420 pp.
Stanbury, P., 2001. Managing the visibility of university museums and collections. In Managing University Museums. OECD. France.
Suarez, A.V. & N.D. Tsutsui, 2004. The value of museum collections for research and society. Bioscience 54: 66-74.
Walters, M., 1980. The complete birds of the world. David & Charles Inc., USA. 340 pp.
Wolters, H.E., 1982. Die Vogelarten der Erde. Eine systematische Liste mit Verbreitungsangaben sowie deutschen und englischen Namen. Paul Parey Verlag 1975-1982. 635 pp.

91
The Castelnau's fish collection and watercolour notebooks
Loneux, M.
Museum of Zoology curator (1991-2003), University of Liège, Zoological Institute, Quai Van Beneden 22, B-4020 Liège, Belgium. [email protected] Contact for collections: [email protected] or [email protected] Museum website: www.ulg.ac.be/museezoo
Keywords: Castelnau expeditions, watercolour notebooks, fish, type-specimens, Chrysophrys nasutus
Abstract
In 1865, Jean-Theodore Lacordaire (professor of natural sciences at the University of Liège) purchased more than thousand specimens collected by the famous explorer ‘Comte de Castelnau’. Castelnau (London 1812 – Melbourne 1880) travelled around the world being both explorer and diplomat. His most famous trip was the crossing of South America from Mato Gross to Peru, coming back by the Amazon. He discovered and described several species. The specimens collected by Castelnau present at the Museum of Zoology include mainly birds and fishes. One of the fish specimens is labelled as Chrysophrys nasutus type and is probably the (holo)type specimen for Cymatoceps nasutus. The fish specimens were accompanied by five original watercolour notebooks, showing coloured fish-drawings made by the collector at the catch moment. Despite the fact that some of the paintings were used in the past to restore the colours of the naturalised fishes, further research on the relations between the collection and the notebooks should be made.
To improve the collections of the University, Jean-Theodore Lacordaire (professor of natural sciences from 1836 to 1871) purchased at least one thousand specimens collected by the French explorer François Louis Nompar de Caumont de Laporte, also known as the ‘Comte de Castelnau’(Anonymous, 1982).
Castelnau (London 1812 – Melbourne 1880) travelled around the world both explorer and diplomat. He discovered and described several new fish from South America (Castelnau, 1855), Southern Africa (Castelnau, 1861) and at last Australia, where he lived the rest of his life as general consul and continued his research on fishes (Castelnau, 1872, 1873, 1875, 1876,1878a, 1878b, 1878c, 1879). He also has published three volumes of natural history on beetles (Castelnau, 1840 in Bogaert-Damin & Piron, 1987) and other papers and monographs on insects (Castelnau, 1834a, 1834b, Laporte de Castelnau & Gory, 1835, 1836, 1837). His most famous trip was without a doubt the crossing of South America from Matto Gross to Peru, returning via the Amazon. This expedition collected a lot of information and specimens, now dispersed among museums around the world.
The Castelnau collection at the University of Liège Museum of Zoology contains mainly birds (697 specimens), mounted fishes (291), some mammals (45) and a few marine invertebrates which all have been progressively recorded in the handwritten registers and are added in the collection database of the museum (Loneux, 2005).

92
One of the fishes in the collection that is presented in the exhibition room of the museum, is marked as a type-specimen and labelled as Chrysophrys nasutus CASTELNAU, type (Figure 1). From FishBase, the online catalogue of fishes ( www.fishbase.org), this species is valid as Cymatoceps nasutus (Castelnau, 1861) (Smith & Smith, 1986: 585) and the holotype is not present in the Muséum national d'Histoire naturelle (Bauchot & Daget, 1972: 66). Thus, the holotype described by Castelnau could be that specimen displayed in the public
exhibition room of the University of Liège Museum of Zoology since 1962, but incognizable for fish specialists. Many of Castelnau’s old specimens are nowadays still exhibited in the public rooms of the museum, but much more are preserved in the depositories.
More strange but precious pieces in the collection are the original watercolour notebooks by Castelnau, which accompanied the purchase and remained undiscovered for over 140 years (Figure 2). They were made in the field by the collector, showing coloured fish-drawings painted at the catch moment. The five books were realized during various expeditions: at the Bay of Bahia (1848-1854), Cap of Good Hope (1856), Southern Africa (1857), as well as Siam, Singapore and the Sea of China. The excellent quality of the paintings has been used in the past to restore the colours of some of the naturalised fishes (e.g. Figures 3 & 4), but the contents of this small art treasure should be better diffused, preserved and valorised.
A survey of the relations between the fishes preserved in the collection and the specimens painted in the notebooks should be made, for specimens both in the exhibition room and the old depositories (Figure 5). Further research on this collection can include: nomenclature updating, checking the presence and validity of types and controlling the exact geographic location and provider for the fish specimens collected during 19th century in South America, South Asia and South Africa, because registration of these specimens has been spread over more than twenty years from 1865 in the old handwritten catalogues of inventory and systematic. The actual lack of staff and funding to work on the collections in Liège does not allow realising such aims our-selves, but any external researcher interested would be welcome.
Figure 1. Chrysophrys nasutus Castelnau, 1861, (R.E. 4729 registered in 1876, noted as type), valid as Cymatoceps nasutus (Castelnau, 1861), coming from Cap de Bonne Espérance. From Fishbase, the type locality is known as Table Bay, Cape town, South Africa. Photo: M. Loneux
Figure 2. View of the travel note books accompanying the specimens purchased in 1865 by J.T. Lacordaire for the University of Liège zoological collections. Photo: M. Loneux ( www.ulg.ac.be/museezoo/castel.htm)

93
References
Anonymous, 1982: Castelnau in Grand Larousse Universel, Tome III, 1982, Grand Dictionnaire encyclopédique Larousse en 15 volumes. Larousse Eds.
Bauchot, M.-L. and J. Daget, 1972. Catalogue critique des types de Poissons du Muséum national d'Histoire naturelle. (Suite) (Famille des Sparidae). Bull. Mus. Natl. Hist. Nat. (Sér. 3) No. 24 (Zool. 18): 33-99.
Bogaert-Damin, A.-M. & J. A. Piron, 1987. Livres d'Animaux du XVIe au XXe siècle dans les collections de la Bibliothèque Universitaire Moretus Plantin, Publication n°3, Bibliothèque Universitaire Moretus Plantin, Namur.
Castelnau, F.L. Laporte de (as F.L. de Laporte) 1834a. Monographie du groupe des Rhipicérites (Coléoptères Pentamères). Ann. Soc. Entomol. Fr. 3: 225-270 pl. 2
Castelnau C, F. L. de Laporte. 1834b. Études entomologiques ou description d’insectes nouveaux et observations sur leur synonyme. Paris: Méquignon-Marvis. Père et Fils.
Castelnau, F. L. De Laporte, Comte De. 1840. Histoire naturelle des insectes coléoptères, (avec une introduction sur l'anatomie et la physiologie des animaux articulés par M. Brullé), Paris, P. DUMÉNIL, 3 volumes illustrés, format 8°. Vol. 1 cxxv 324 pp. Vol. 2 [I]-563pp, 37 pls.
Castelnau, F. L., 1855 Poissons. In: Animaux nouveaux or rares recueillis pendant l'expédition dans les parties centrales de l'Amérique du Sud, de Rio de Janeiro à Lima, et de Lima à Para; exécutée par ordre du gouvernement Français pendant les années 1843 a 1847, Part 7, Zoology. Exped. Amer. Sud. t. 2, p. i-xii + 1-112, pls 1-50.
Castelnau, F. L. 1861. Mémoire sur les poissons de l'Afrique australe. J. Balliére et fils, Paris. p. i-vii + 1-78.
Figure 3. Example of fish specimen displayed in the exhibition room and restored after the watercolour painting made by Castelnau in his travel books: Cossyphus macrurus Günther, 1862. Photo: M. Loneux
Figure 4. Page of the travel notebook where the species painted by Castelnau is the model used to restore the colours of the specimen of Cossyphus macrurus presented in
Figure 3. Photo: M. Bockiau

94
Castelnau, F. L., 1872 Contribution to the ichthyology of Australia. No. 1.--The Melbourne fish market (pp. 29-242). No. II.--Note on some South Australian fishes (pp. 243-247). Proceedings of the Zoological Acclimatisation Society of Victoria v. 1, p. 29-247 plus 1 p. Errata
Castelnau, F. L., 1873 Contribution to the ichthyology of Australia. Nos. III thru IX [with subtitles, indexed as one work]. Proceedings of the Zoological Acclimatisation Society of Victoria v. 2, p. 37-158
Castelnau, F. L., 1875 Researches on the Fishes of Australia. Philadelphia Centennial Expedition of 1876. Intercolonial Exhibition Essays, 1875-6. Research. Fish. Australia No. 2, p. 1-52
Castelnau, F. L., 1876. Mémoire sur les poissons appelés barramundi par les aborigènes du nord-est de l'Australie. J. Zool. (Gervais) v. 5, p. 129-136
Castelnau, F. L. 1878a. Australian fishes. New or little known species. Proceedings of the Linnaean Society of New South Wales, 2 (3): 225-248, pls. 2-3.
Castelnau, F. L. 1878b. On several new Australian (chiefly) fresh-water-fishes. Proceedings of the Linnaean Society of New South Wales, 3 (2): 140-144.
Castelnau, F. L. 1878c(Sept.) [ref. 762]. Notes on the fishes of the Norman River. Proc. Linn. Soc. N.S.W. v. 3 (pt. 1): 41–51.
Castelnau, F. L. 1879 (May) [ref. 764]. Essay on the ichthyology of Port Jackson. Proc. Linnean Society N.S.W. v. 3 (pt. 4): 347–402.
Fishbase ( www.fishbase.org), online Catalogue of Fishes, W. Eschmeyer, January 2004, online version updated April 2005.
Laporte de Castelnau, F.L., 1835. Études entomologiques ou descriptions d'insectes nouveaux et observations sur la synonymie, par M. F. L. de Laporte, Comte de Castelnau. Revue Entomol. (Caen) 3: 157-181.
Laporte de Castelnau, F.L. de & H.L. Gory, 1835. Histoire Naturelle et Iconographie des Insectes Coléoptères. Monographie des Buprestides. Volume 1, livraisons 1-7, genera: Sternocera, Julodis, Acmaeodera, Chrysochroa, Chrysodema, Ptosima (genera separately paginated). Paris: P. Duménil
Laporte de Castelnau, F.L. de & H.L. Gory, 1836. Histoire Naturelle et Iconographie des Insectes Coléoptères. Monographie des Buprestides.Volume 1, livraisons 8-11, genera: Bubastes, Aurigena, Capnodis, Buprestis (pp. 1-64, genera separately paginated). Paris: P. Duménil
Laporte de Castelnau, F.L. de & H.L. Gory, 1837. Histoire Naturelle et Iconographie des Insectes Coléoptères. Monographie des Buprestides. Volume 1, livraisons 12-16, genera: Buprestis (pp. 65-160), Nascio, Acherusia, Asthraeus, Bulis, Acantha, Apatura. Paris: P. Duménil.
Loneux M. 2005: How to Develop an Unrecognized Scientific Heritage: the Case of the University of Liège Zoological Collections, Belgium. pp 77-84 in TIRRELL P. (Ed.), Proceedings of the Third Conference of the International Committee for University Museums and Collections (UMAC). Norman, Oklahoma: Sam Noble Oklahoma Museum of Natural History, September 2003.
Smith, J.L.B. & M.M. Smith, 1986. Sparidae. p. 580-594. In M.M. Smith and P.C. Heemstra (eds.) Smiths' sea fishes. Springer-Verlag, Berlin.

95
Tropical insects in collection at the University of Liège Museum of Zoology: a first approach
Loneux, M., P. Grogna, A. Govers, & N. Lizzaraga
University of Liège, Zoological Institute, Quai Van Beneden 22, B-4020 Liège, Belgium. loneuxmichele@skynet, [email protected], [email protected] Contact for collections: [email protected] or [email protected] Museum website: www.ulg.ac.be/museezoo
Keywords: University museum richness, Brazil, Paraguay, Central Africa, South-East Asia, insect collections, Coleoptera, Hymenoptera, Lepidoptera, type-specimens, Léon Candèze
Abstract
The University of Liège Museum of Zoology holds some large and not well-known insect collections, which are still very well preserved, due to the work of famous entomologists and curators such as Fritz Carpentier and Noël Magis. Insects from tropical areas are very well presented in these collections and were collected all around the world. The expedition of Edouard van Beneden in Brazil (in company of two entomologists) provided numerous specimens, mainly Coleoptera. More than 8,500 insects were sent from Paraguay by the Estacion Entomologica ‘FABRE’ and are still preserved in the original mailing boxes. Due to investment of the University in cooperation projects with some African countries, numerous insects (mainly Lepidoptera and Coleoptera) were collected there between 1900 and 1990. The main source of exotic insect specimens is the “Léon Candèze’s collection of Lepidoptera from around the world”, which comprimes more than 9,500 specimens. A first inventory, which digitized all genera and families present in this collection, showed it contains at least five systematic types. However, the aforesaid collections need an in depth study from researchers interested in the genera and species they concern. Even though not every insect specimen is recorded in the handwritten registers or the collection database, the well-organised depositories allow finding them easy, and any request of study would be welcome.
Introduction
The insect collections of the University of Liège Museum of Zoology are not well-known, which is the reason why few entomologists come to study them, in spite of the fact that famous entomologists such as Jean-Theodore Lacordaire (professor and responsible of the collections at Liège from 1835 to 1871), Fritz Carpentier (curator of the collections from 1922 to 1958) and Noël Magis (curator of the museum from 1972 to 1991) were involved in their preservation or enrichment. Notably Carpentier and Magis have contributed to the very good presentation of the insect biodiversity in the renovated Museum of Zoology, open to the public since 1962.
The tropical insects preserved in Liège were collected in Brazil, Paraguay, South-East Asia and Africa. Other countries like India, China, Columbia and Madagascar are also represented. Even though not every specimen is recorded in the handwritten registers or the computerised collection database (Loneux, 2005), the well organised depositories allow to find the

96
collections rather easy. This first inventory of the tropical insects preserved in the collections of the University of Liège focuses on the large series of specimens from tropical areas and aims to invite entomologists to study them.
Insects from Brazil
The expedition of Edouard Van Beneden in Brazil (autumn 1872 to January 1873) provided a lot of specimens to the collections of the University, ranging all animal classes. The entomological collection was mainly made by Camille Van Volxem and Walthère de Selys-Longchamps (son of the famous baron Michel-Edmond de Sélys-Longchamps), who accompanied Van Beneden on his expedition. All collectionsites are described in Van Beneden’s short report of the expedition (Van Beneden, 1873).
This collection contains three boxes of Coleoptera (Figures 1 & 2) (76 specimens of Cerambycidae, 164 specimens of other Coleoptera) and several isolated insects from different orders, scattered among other boxes. Despite some exceptions (Pelseneer, 1890), most insects have not been identified so far. Some of the identified however can be found in the public showcases.
Insects from Paraguay
At an unknown date, a total of 8,534 insects from Paraguay were sent by the Estacion Entomologica ‘FABRE’ to the university of Liège. These insects were captured in February, March and April 1937 and are still preserved in the 13 original mailing boxes (Figures 3 & 4). The collection represents specimens from the Coleoptera (including Dytiscidae) and Hymenoptera (Table 1); respectively prepared and sent by Dr. M. Vinogradoff and Dr. A. Lapchinsky. The specimens have never been studied so far.
Figure 1. First entomological box of Coleoptera (mainly Cerambycidae), collected in Brazil during the winter of 1872-1873 by Edouard Van Beneden and collaborators. Photo: M. Loneux.
Figure 2. Second entomological box of Coleoptera (mainly Cerambycidae) collected in Brazil during the winter of 1872-1873 by Edouard Van Beneden and collaborators. Photo: M. Loneux

97
Table 1. Collection of insects from the Entomological Station ‘FABRE’, Paraguay, with a total of 8,534 specimens, all captured in 1937.
Insect Order Number of specimens
Month of capture in 1937
Geographic origin in Paraguay
Heteroptera 293 February - March Puerto Pablo
Hymenoptera 147 March Puerto Pablo, Riacho ’Cara-Cara’
Hymenoptera 132 March Tres Bocas, Aroyo seco
Hymenoptera: Formicidae 482 February Zavalo-Cué
440 March Tres Bocas
Hymenoptera: Sphegidae 100 February Puerto Pablo (ph)
Hymenoptera: Vespidae 110 February Riacho ‘Cara-Cara’
Hymenoptera: Vespidae, Sphegidae 125 February Puerto Pablo
Coleoptera (aquatic) 1,630 February Puerto Cliza
1,300 March Rio Confuso Santa Clara
1,500 February Rio Pilcomoyo
2,150 April Rio Paraguay St. Antonio
Coleoptera: Scarabeidae 125 April St. Antonio
Insects from Africa
Due to the historical relationships between Belgium and some African countries, the museum also numbers insect collections from Africa. They were collected between 1900 and 1990 in the Democratic Republic of the Congo, Côte d'Ivoire, Kenya, Mozambique, Madagascar and other countries. Most of these collections contain Lepidoptera and come from private donations (collection G. Faniel, collection Joseph Hamoir: butterflies). They are rather small and would be easy to inventory.
Figure 3. Example of insects arranged in one mailing box: aquatic Coleoptera, 1500 specimens. More mailing boxes can be seen in on the left side. Photo: M. Loneux
Figure 4. Example of insects arranged in one mailing box: Hymenoptera - Vespidae, 110 specimens caught in Riacho ‘Cara-Cara’ in February 1937. Photo: M. Loneux

98
For example, the collection G. Faniel comprises 24 entomological boxes, where only 6 contain European species. The major part of these collection concerns Central African Geometridae (79 specimens), Noctuidae (329) and Sphingidae (165). 417 of these specimens are labelled “from MBDKA”, 156 “from Zwaziland (genus Acrea)”. About 40 specimens of Lepidoptera from Kasai are still preserved unmounted.
In addition to the Lepidoptera collections, a great amount of beetles are represented. Most of these are Cerambycidae, Cicindelidae, and Scaraboidea. A lot of African insects are also displayed in the systematic part ‘Insecta’ of the public exhibition room in the museum.
Insects from South-East Asia and the rest of the world
The “Léon Candèze’s collection of Lepidoptera from around the world” is the main source of exotic specimens in the museum.
Entomologist Léon Candèze (1863-1926) – son of the famous entomologist Ernest Candèze (1827-1898, specialist of Coleoptera Elateridae) – studied Lepidoptera from around the world, and the Heterocera in particular. He died before he could publish his findings on the Heterocera from Indochina, but his manuscript was published posthumously in 1927 in the journal ‘Lepidoptera’ (Candèze, 1927b).
As stated in the introduction (Candèze, 1927a), this published catalogue covers the material collected by M. R. Vitalis de Salvaza, before 1914, in Cambodia, Laos, Tonkin, Cochinchine and Annam (former state in central Vietnam). The whereabouts of this material are unknown and do not seem to be included in the collection gifted to the University of Liège in 1927 by Ms L. Candèze (registered as two groups of boxes and cabinets, May 1927, RE 11486 & RE 11487).
The Candèze collection of Lepidoptera gifted to and preserved at the museum comprises more than 9,500 specimens, mainly Heterocera (7,943) and numerous Rhopalocera (1,639), captured in Australia, Brazil, Peru, Chile, Central America, South East Asia, Africa and Europa. Approximately 80% (7,745) of all specimens come from tropical areas (Table 2). All genera and families present in each entomological box of the collection were entered in an Excel-sheet.
Table 2. Details on the Léon Candèze Lepidoptera Collection preserved at the University of Liège Museum of Zoology.
Families Genera Species Specimens
Heterocera 44 767 2542 7943
Tropical 706 2020 6167
Not tropical 26 433 1589
Unknown 18
Not identified 17
89 187
Rhopalocera 16 186 599 1639
Tropical 171 575 1578
Not tropical 0 1 2
Unknown 12
Not identified 3
23 59
Total 60 953 3141 9582

99
A first inventory showed that the collection is still well-preserved and contains at least five systematic types (Table 3): one specimen from France (Europe) and four specimens from Vietnam (Asia). Due to the size of the collection, not all species and geographical data have been listed yet. The completion of this inventory, together with a more profound search for previously published papers of Candèze, should be done to promote this collection to the scientific community concerned by the taxa and the geographic areas represented.
Table 3. List of the systematic types found in the Léon Candèze collection of Lepidoptera preserved at the University of Liège Museum of zoology.
Heterocera, Family Anthroceridae
Zygaena transalpina hippocrepidis ab. miltosa Candèze, 1883 Larochelle (France). Candèze.fe.je.natur XIII, 1882-1883, 3: 47. 1 specimen
Heterocera, Family Agaristidae
Exsula dentatrix var. nigridorsa Candèze, 1911 Pnôm-Pènh (Vietnam). Lepidoptera II, 1927: 78. 1 Male
Exsula dentatrix var. nigridorsa Candèze, 1911 Pnôm-Pènh (Vietnam). Lepidoptera II, 1927: 78. 1 Female
Scrobigera salvazae (vitalisi) Candèze, 1911 Pnôm-Pènh (Vietnam). Lepidoptera II, 1927: 79. 1 Male
Scrobigera salvazae (vitalisi) Candèze, 1911 Pnôm-Pènh (Vietnam). Lepidoptera II, 1927: 79. 1 Female
The large Lepidoptera collection of Edmond De Laver (400 entomological boxes) has also brought several specimens from China and other tropical countries, but mainly concerns the European species, and is not discussed here.
In addition to the Lepidoptera collections, the depositories also houses Coleoptera from Java, China, India…
Conclusion
The tropical insects collections preserved in the depositories at the University of Liège Museum of Zoology mainly concern Lepidoptera: butterflies as well as moths. South American Coleoptera and Hymenoptera are also well represented. These collections have not been exhaustively inventoried, neither the specimens recorded in the collection database. They need an in depth study from researchers interested in the genera and species they concern and the tropical areas they represent. Their access is easy, and any request of study would be welcome.
References
Candèze L., 1927a. Lépidoptères Hétérocères de l'Indochine Francaise. Avant-propos. Encyclopédie entomologique, Série B, Mémoires et Notes, II, Lepidoptera, Vol. II (2): 73–100.
Candèze L., 1927b. Lépidoptères Hétérocères de l'Indochine Francaise. Encyclopédie entomologique, Série B, Mémoires et Notes, III, Lepidoptera, Vol. II (3-4): 101–133.
Loneux, M., 2005. How to Develop an Unrecognized Scientific Heritage: the Case of the University of Liège Zoological Collections, Belgium. In Tirrell P. (ed.), Proceedings of

100
the Third Conference of the International Committee for University Museums and Collections (UMAC). Norman, Oklahoma: Sam Noble Oklahoma Museum of Natural History, September 2003: 77-84.
Pelseneer, 1890. Bull. Soc. Entom. Belg. p.CLXXIV.
Van Beneden, E, 1873. Rapport sommaire sur les résultats d’un voyage au Brésil et à la Plata. Bulletin de l’Académie royale de Belgique, 2ème série, t. XXXV, 6: 3-20.

101
Albertine Rift zoodiversity: exploitation of the historical data in the Royal Museum for Central Africa, Tervuren
Louette, M.
Department African Zoology, Royal Museum for Central Africa, B 3080 Tervuren, Belgium. [email protected]
Keywords: biodiversity, zoology, collection, database, conservation, DR Congo
An overview of present activities concerning databasing and datasharing by the scientists of the Department of African Zoology of the Royal Museum for Central Africa is given, followed by the results of a case study with practical output from bird collections for in-situ conservation in the Albertine Rift.
The first part of the contribution reviews current activities concerning databases and related research by the scientists of the Department of African Zoology (DAZ) of the Royal Museum for Central Africa (RMCA). Table 1 lists the number of zoological specimens deposited in the RMCA (all from central Africa), the bulk of which was collected during the colonial period. Many originate from the Congo basin and the Albertine Rift in the east of the Democratic Republic of Congo, Rwanda and Burundi (amongst them a certain number in the then National Parks of the Belgian Congo, but many others were collected at random, outside protected areas).
Table 1. Approximate numbers of zoological specimens in the RMCA (situation in 2004).
Taxonomical group Total Albertine Rift
Pisces 650,000 100,000
Amphibia 200,000 88,000
Reptilia 40,000 14,000
Aves 150,000 43,000
Mammalia 90,000 25,000
Insecta 6,000,000 1,500,000
Other Invertebrata 1,000,000 200,000
These collections are duly registered with their corresponding ecological data. Many faunistical papers were published over the years, including catalogues of the numerous type material held here (see e.g. Louette et al., 2002). In recent decades efforts were made to store the information on these collections in databases. This whole process results from activities considered as routine by the DAZ staff, and involves much quality control by each researcher in his particular discipline. Digitization of the collections has also started (see papers Dall’Asta & Desmet, 2006 (this volume), De Prins, 2005).
Since many years these collections are used in data-mining for biodiversity patterns, prediction of distribution ranges, geographical distribution and ecological profiles of particular species. Data-sharing processes are ongoing with various international institutions

102
and NGO’s using RMCA collection data. In 2000-2003, the Belgian Science Policy funded a project ‘Valorisation of museum collection databases for Biodiversity research’.
The DAZ is participating in Belgian networks (e.g. Generalized Natural Sciences Online and Spatial Information System, ‘GNOSIS’, a collaborative GIS project funded by the Belgian Science Policy Office) and in international networks, notably the following two (both EU funded), for linking the information in taxonomical collections:
- SYNTHESYS Networking (SYNTHESYS is a project of the ‘Consortium of European Taxonomical Facilities’, of which the RMCA is a member).
- ‘European Network for Biodiversity Information’ (ENBI). In WP13: ‘Making non-European biodiversity data in European repositories globally available’, for which the information via prototypes of the web interface has been released, the DAZ is participating in two pilot projects, together with other taxonomical institutions: ‘Database for African fruit flies’: projects.bebif.be/enbi/fruitfly, and ‘Biodiversity data in the Albertine Rift’, including butterflies, fishes of Lakes Kivu and Tanganyika, and birds: projects.bebif.be/enbi/albertinerift/common
Several years ago, the DAZ created the ‘African Biodiversity Information Centre’ (funded by the framework agreement of the Belgian Directorate General for Development Cooperation) with a programme of study visits on biodiversity, targeting African experts and doctoral students.
The second part of the contribution describes a case study concerning the use of the information available on the RMCA Albertine Rift collection.
Surprisingly, at first view, the Albertine Rift was not mentioned by Myers et al. (2000) in their striking paper on the world’s biodiversity hotspots for conservation priorities. This has to do with one of their criteria (‘experiencing exceptional loss of habitat’). Nevertheless, many decision makers interpreted this absence mistakenly as if the Albertine Rift were not a biodiversity hotspot. It became clear that perception needed to be changed and, that crucial information needed to be made available to the international community (after either a change in criteria for prioritizing or, as bad luck would have it, after the habitat would deteriorate further) if the Albertine Rift is to be regarded as a biodiversity hotspot. Taxonomists knew that this region contains for instance more endemic and widespread vertebrate species than any other region on mainland Africa, but perhaps there was a lack of information or of tools for making information available. Therefore, a consortium of organisations, led by the World Conservation Society, initiated the process of including relevant data in an inventory of the biodiversity of the Albertine Rift (Plumptre et al., 2003). The bird, reptile and amphibian data from the RMCA collection (see Table 1) were made available and proved to be of vital importance for this inventory (Behangana et al., 2003a, 2003b; Kahindo-Ngabo et al., 2003). The 900 meter contour was selected as lowest altitude of the Albertine biological region because there are museum collections at RMCA of Albertine Rift endemic bird species as low as this altitude. The area encompassed by this definition is around 313,000km². Herremans et al. (2004) again revealed its conservation importance and especially the fact that some of its restricted biodiversity tends to occur at the lowest altitudes, outside the present-day protected areas. It became clear that the Itombwe massif, an unprotected area west of the northern end of Lake Tanganyika (for which the RMCA has the sole historical zoological collections, thanks to the great efforts of Prigogine, 1971, 1978, 1984), contains more endemic bird species than any other site in the Albertine Rift (34). Itombwe is the top priority for conservation in the Albertine Rift at present because it is very threatened. It is closely followed by Kahuzi Biega National Park (30) and Virunga National Park (27) (Plumptre et

103
al., 2003). Rodrigues et al. (2004) state that: “If the conservation goal is species representation, then the expansion of the global network of protected areas must account for biodiversity patterns, rather than rely on … targets that are formed largely by political and feasibility considerations. Given the increasing threats to biodiversity, such expansion should be made strategically by focusing on those regions that would contribute most to the global system and prioritizing, within those, the regions where the urgency for conservation action is greatest…”
One of the key lessons learnt in the present context: for data-deficient areas (including those where instability prevents new inventories such as is, unfortunately, the case nowadays in the Albertine Rift), museum collections hold the principal information in order to make the correct decisions for conservation.
Acknowledgements
I want to thank my co-workers for gathering information: Gert Boden, Marc De Meyer, Marc Herremans, Rudy Jocqué, Danny Meirte, Jos Snoeks and Wim Wendelen. Renaat Van Rompaey’s comments and those made by an anonymous referee were highly appreciated. Wim Tavernier was helpful with the presentation.
References
Behangana, M., D. Meirte, A.J. Plumptre, K. Howell & H. Hinkel, 2003a. Reptiles. Albertine Rift Technical Reports, Series 3: 39-45.
Behangana, M., D. Meirte, A.J. Plumptre, K. Howell, S. Stuart & H. Hinkel, 2003b. Amphibians. Albertine Rift Technical Reports, Series 3: 46-53.
Dall’Asta, U. & F. Desmet, 2006. Digitization of the type specimens of Lepidoptera (butterflies and moths) from the Royal Museum for Central Africa: before long the pictures on the web. In Segers, H., P. Desmet & E. Baus (eds). ‘Tropical Biodiversity: Science, Data, Conservation’ Proceedings of the 3rd GBIF Science Symposium, Brussels, 18-19 April 2005 (this volume).
De Prins, J., 2005. A digital quantitative comparison of biodiversity data of gracillariid moths (Lepidoptera, Gracillariidae) in the tropical areas with an approach of moth and host- plant relationships. In Segers, H. (ed). ‘Tropical Biodiversity: Science, Data, Conservation’ Abstract Volume of the 3rd GBIF Science Symposium, Brussels, 18-19 April 2005
Herremans, M., M. Louette & D. Meirte, 2004. Importance of historical bird collections for in-situ conservation in the Albertine Rift. In Segers, H., E. Branquart, A. Caudron & J. Tack, 2004. ‘Scientific tools for biodiversity conservation: monitoring, modelling and experiments’ Proceedings of the European Platform for Biodiversity Research Strategy meeting held under the Belgian EU Presidency, 2-4 December 2001, Brussels, 211.
Kahindo-Ngabo, C., A. Plumptre, N.E. Baker, I. Owiunji, M. Wilson, C.T. Williams, A. Byaruhanga, M. Languy, M. Herremans, T. Butynski & D. Moyer, 2003. Birds. Albertine Rift Technical Reports, Series 3: 30-38.

104
Louette, M., D. Meirte, A. Louage & A. Reygel, 2002. Type specimens of birds in the Royal Museum for Central Africa, Tervuren. Documentation Zoologique (Musée Royal de l’Afrique Centrale, Tervuren), 26.
Myers, N., R.A. Mittermeier, C.G. Mittermeier, G.A.B. da Fonseca & J. Kent, 2000. Biodiversity hotspots for conservation priorities. Nature 403 (6772): 853-858.
Plumptre, A.J., M. Behangana, T. Davenport, C. Kahindo, R. Kityo, E. Ndomba, D. Nkuutu, I. Owiunji, P. Ssegawa & G. Eilu, 2003. The biodiversity of the Albertine Rift. Albertine Rift Technical Reports, Series 3.
Prigogine, A., 1971. Les oiseaux de l’Itombwe et de son hinterland. Vol. 1. Annales du Musée Royal de l’Afrique Centrale, Tervuren. Série 8, Sciences Zoologiques, 185.
Prigogine, A., 1978. Les oiseaux de l’Itombwe et de son hinterland. Vol. 2. Annales du Musée Royal de l’Afrique Centrale, Tervuren. Série 8, Sciences Zoologiques, 228.
Prigogine, A., 1984. Les oiseaux de l’Itombwe et de son hinterland. Vol. 3. Annales du Musée Royal de l’Afrique Centrale, Tervuren. Série 8, Sciences Zoologiques, 243.
Rodrigues, A.S.L., S.J. Andelman, M.I. Bakarr, L. Boitani, T.M. Brooks, R.M. Cowling, L.D.C. Fishpool, G.A.B. da Fonseca, K.J. Gaston, M. Hoffmann, J.S. Long, P.A. Marquet, J.D. Pilgrim, R.L. Pressey, J. Schipper, W. Sechrest, S.N. Stuart, L.G. Underhill, R.W. Waller, M. E.J. Watts & X. Yan, 2004. Effectiveness of the global protected area network in representing species diversity. Nature 428 (6983): 640-643.
105
Intensification of slash-and-burn agriculture in the rural village of Pokola (Republic of Congo): socio-economic context and ecological implications
Maniatis, D.
Environmental Change Institute, University of Oxford, UK.
Keywords: Slash-and-burn agriculture, Social and ecological sustainability, Fallow period, African rain forests, Biodiversity conservation, Species diversity
Abstract
Agriculture is an important predominant economic and survival activity for a large part of the world’s population. Slash-and-burn agriculture (SABA) is a form of agriculture often utilised in tropical rainforests worldwide. The aim of this study is to examine the problematic of SABA around the rural village of Pokola (Republic of Congo). This was done by conducting a socio-economic survey followed by an ecological survey of 17 fallow plots and 5 forest plots. Species richness, species average qualitative similarity, species abundance cover percentage and species habitat, were examined against a set of variables. It is shown that SABA is a part of the daily life in Pokola for about half of its population. Furthermore, the study shows that increasing activity in SABA is having considerable adverse effects on the environment and that it is no longer ecologically or socially sustainable. Results and analyses have shown that agricultural methods have changed in such a way that fields are cultivated longer and fallow periods have shortened. A striking feature in many fallow plots is the dominance of Musanga cecropioides and Chromolaena odorata. A fallow land model derived by this study is proposed. The study shows that the need for a participatory management plan is of great importance if this problem is to be tackled in an ecologically and socially sustainable manner.
Introduction
The African rain forest is rapidly being transformed and cleared and has already lost more than two-thirds of its original forest (Wilkie & Laporte, 2001). Some of this is due to long-term climatic change, yet much can be attributed to human activity (Naughton-Treves & Weber, 2001). One of the factors often considered is slash-and-burn agriculture.
Known as ‘shifting cultivators’, the people who are active in slash-and-burn agriculture (SABA) have often been blamed for large-scale forest destruction, loss of biodiversity, uncontrolled burning and contribution to global climate change (Fox et al., 2000). Contrastingly, a growing community of scientists and development experts now argue that some slash-and-burn agro-ecosystems are sustainable under conditions of low land use pressure, and that there is a role for this type of agriculture in development (Klainman et al., 1995).

106
SABA1 is a form of agriculture often utilised in tropical rainforests worldwide (Alegre & Cassel, 1996), linked to some 240 million hectares of closed forests and 170 million hectares of open forests (Brady, 1996; Prasad et al., 2001). Traditional SABA can be defined as follows: “… a plot of forest is felled and burnt, providing fertile ash in which to grow food crops. After one to three years, as weeds proliferate and fertility declines, the plot is abandoned and left to revert to forest. After a fallow period, ideally of 20 years or more, the cycle is repeated” (Pye-Smith, 1997).
Fallows can be defined as land that is not farmed at the present time, but will be farmed in the future (Van Noordwijk, 1999). The SABA system used by many farmers in Africa (and around the world), is experiencing an unparalleled stress due to rising population pressure, land use intensity and ‘shifted cultivators’2 (Myers, 1991). Due to the above-mentioned factors, land uses for both agricultural and non-agricultural purposes have created land scarcity, leading to shorter fallow periods. In many cases, farmers have reduced their fallow periods below the sustainable levels necessary to maintain an ecological balance under shifting cultivation (Harwood, 1996; Adesina et al,. 2000; Brady, 1996; Essama-Nssah et al., 2002), therefore making the traditional sustainable SABA system unsustainable and environmentally degrading.
This paper will focus on shifting cultivation and its problems in the village of Pokola in northern Congo. In the 1960s the village of Pokola, situated at the banks of the river Sangha, was made up of a few hundred people, mainly fishermen. Since the logging company, the Congolaise Industrielle du Bois (CIB), installed itself in the region in 1968, the population of this rural village has increased to ~12,600 inhabitants (time of study in 2003). Pokola is thus dealing with a large population increase (16% per year) due to the favourable living conditions that are directly and indirectly linked to the presence of CIB (brick houses, access to clean water and electricity, access to the hospital and pharmacy run by CIB). Therefore the aims of this research are twofold: (1) to quantify and understand through a socio-economic survey how the local people carry out slash-and-burn agriculture and what they consider as problems, and (2) to examine the vegetation dynamics of fallow and forest plots and evaluate the differences.
It is clear that in such a rapidly changing case as the situation in Pokola, it is imperative that scientists share the data they have already collected and work together in order to achieve not only good but effective science that can be transmitted on several levels from politicians, to stakeholders and to the people themselves.
Material and methods
Study area
The Republic of Congo is situated in Western Africa. The climate is tropical, with generally high heat and humidity levels. The average temperature is 23.9°C. Most areas have two wet and two dry seasons. Its highly diverse forests are representative of the biological diversity of forests in the Congo Basin, which is home to about 80% of Africa’s moist forests and 20% of the world’s tropical moist forests (Essama-Nssah et al., 2002). Only the Amazon accounts for more. The north is covered by 15 million hectares of equatorial forest.
In Congo’s northern forest sector, CIB is the figurehead forest operator where it has been operating in the village of Pokola for over 25 years. It is the largest industrial forest operator
1 Other names include, shifting cultivation or swidden agriculture. 2 Migrants that have only recently started practising SABA and therefore often do not understand its underlying principles.

107
in the whole of Congo. CIB holds four adjacent Forest Management Units: Pokola, Kabo, Pikounda and Loundougou, which together cover an area of 1.3 million hectares surrounding the south and east boundaries of the Nouabalé-Ndoki National Park.
Fieldwork was conducted within the village of Pokola and its surrounding area from May to August 2003.
Data collection
Data collection started with a socio-economic questionnaire in order to gather information about the agricultural tactics. This was followed by a fallow land questionnaire from selected interviewees and some other people who had offered to help. The aim of the fallow land questionnaire was to find out precise information about the agricultural history of a particular plot that was then in fallow. Finally, 17 fallow plots (plots 1-17) and 5 (plots 18-22) forest plots were sampled.
Data collection for Socio-Economic survey (SES)
The survey was conducted by random sampling, examining different aspects of: (1) agriculture, (2) environment, (3) demography, using both open and closed ended questions. A total of 82 people were interviewed.
Data collection for fallow and forest plots research
To begin with, a survey of the history of the fallow lands was conducted with certain people from the SES (based on their quality of answers) and some people who had not fallen in the sample during the SES (but were keen to help), to go and visit their fallow land(s).
Twenty-two homogenous plots of 25 x 25m (625m²) were selected in fallow (n = 17) and in forests (n = 5) lands (Van Gemerden et al., 2003b). ‘Corridors’ were opened around these plots. All the vegetation as well as signs that might have importance such as the presence or absence of animal trails, nests, hunting (snares) and termites within this area was sampled and recorded. The vegetation was divided into five strata: (1) Trees (T) > 7m; (2) Small trees (ST) 3-7m; (3) Woody herbaceous plants (WH) < 3m; (4) Non-woody herbaceous plants (NWH) < 3m; (5) Climbers – ligneous and non-ligneous (C).
Vegetation under 30 cm was discarded in order to avoid foreseen identification problems. The Braun-Blanquet scale was used for combined abundance coverage (Cain & Castro, 1959). The midway of each score was taken and used as an indicator of species relative abundance. Species with a high percentage cover have a high abundance of that species. Tree circumferences for each tree, with a minimum circumference of 30cm (about 9.5cm in diameter), were measured in each plot3. The most representative height of the canopy was measured using a clinometer.
In the sampled plots, three soil samples were taken (at the diagonal two extremes and one in the centre of the plot). Three horizons were sampled: 0-5cm, 5-10cm and 10-20cm. Analysis was carried out for all 22 plots and all three layers for: pH, acidity, Magnesium (Mg), Calcium (Ca), Potassium (K), Carbon Exchange Capacity (CEC)) and Organic Matter percentage (OM%).
3 This was chosen arbitrarily since it was considered that anything below this circumference was still a ‘small’ tree and not
an ‘actual’ tree and secondly because there was a certain time constraint.

108
Data analysis
Data analysis for SES
Logistic regression using the Statistical Package for the Social Sciences (SPSS) version 11.5 was used to determine whether such demographic variables as gender, age group and education explain why some respondents could have more favourable attitudes than others towards (1) the willingness to participate in a forest protection programme and (2) the willingness to carry out sedentary agriculture4 (Mehta & Kellert, 1998).
Data analysis for fallow and forest plots
A combination of independent-samples t-test and analysis of variance (ANOVA) was used to test various relationships.
A two-way ANOVA of pH, CEC and OM% in the three layers in both forest and fallow plots was done to examine whether the reduction of these components between layers is the same in forest and fallow plots. A principal components analysis (PCA) was applied as a data reduction for the soil samples, reducing pH, OM%, CEC, K, Mg and Ca into one variable (called PCA axis 1 (fertility)), which was then tested against different variables.
Ordination of samples using multi-dimensional scaling (MDS) in PRIMER version 5 was used for examining the average qualitative (presence/absence) similarity between fallow and forest plots, species abundance (cover percentage), and species habitat and their relationship with different variables such as basal area, representative canopy height, PCA axis 1 (fertility), fallow age, age of plot and total years cultivated. As the data sets had a normal distribution, bivariate correlation analysis using Pearson’s correlation was used to look at the correlation between these different variables. The same tests and calculations were done as far as species richness is concerned.
Furthermore, as a measure of α-diversity, the Shannon-Wiener Index (H’) of Diversity was calculated for tree species in all plots. Only tree species with a minimum circumference of 30cm were used for this calculation. H’ is calculated by: H’ = - Σ pi ln (pi), where pi is the fraction of the total number of individuals in the sample that belong to species i (Morin, 1999). H’ was tested against fallow age, age of plot, total years cultivated and fertility.
In order to assess recovery in terms of tree species composition, β diversity5 of tree species was calculated for all 22 plots using the Jaccard Index for similarity coefficients (Cj) (Jaccard, 1908). Cj is calculated by: Cj = j / (a + b – j), where j = the number of species found in both sites, a = the number of species found in site A and b = the number of species found in site B. This index is designed to equal 1 in case of complete similarity (where the two sets of species are exactly identical) and 0 if the sites are entirely dissimilar (have no species in common).
For testing relationships of fallow lands with different variables (always fallow age, age of plot and total years cultivated), all 17 fallow plots were included together with a randomly selected forest plot (plot 18) in the correlation analysis and scatter graphs as an indication of an optimal condition6.
4 i.e. no longer shifting agriculture 5 Beta – diversity measures the amount of change between two sites or along an environmental gradient. 6 An arbitrary age of 30 years was given as a value for fallow age, 0 years for the age of the plot and 0 years for total years
cultivated.

109
Results
Socio-economic survey
Demography
As the people that were most active in agriculture and easily found in the households were usually women, 68% of the people interviewed were female. The majority of the people interviewed (76%) had arrived in Pokola over the last twelve years and were several different nationalities and ethnicities (Rwandan, DRC, etc.). Only 50% of the interviewees had a family member working for CIB, revealing that many people are attracted to this area although they are not necessarily employed by CIB and that a large proportion of the people depend entirely on agriculture for their livelihood.
Agriculture
The 82 people interviewed together owned a total of 190 fields. Ninety percent of these were acquired within the last 10 years. Importantly, for approximately 62% of the interviewed people, agriculture is their only activity during the year.
As far as the distance from the houses to the agricultural plots is concerned, 96% of the people have their fields within a 10 km radius of the village. Only 2% had fields at 10 km or further away. These results were expected as people walk on foot to work their fields and back, so generally people do not want to walk more than 5-10km. Only 1% of the farmers still had fields in the forest.
The main crops cultivated (by order of importance) were: cassava, plantain banana, corn and tomato. In the context of this study, it is important to examine whether or not the traditional SABA methods had changed. Sixty seven percent of the people thought that the methods have changed, 22% thought there had been no changes and 11% did not want to express their opinion on this issue or were not sure. Out of the 67% that thought methods had changed, 46% gave high demographic pressure and a lack of space as the main reason.
As expected, when reasons were given for leaving land fallow the following results came out (the remaining percentage was classified as NA):
- 89% left the fields fallow due to a decrease in yield;
- 1% left the fields fallow due to the increasing presence of weeds;
- 4% left the fields fallow for a combination of the above reasons.
One of the most striking and worrying results of this research is the number of years the fields are left fallow before re-cultivation. The average time left fallow has been reduced to 4 years, with a minimum of 10 months and a maximum time period of 10 years. It was also observed in the fallow plots survey that only one person left remnant trees when clearing. When asked if there is a systematic increase in the fallow period after each cycle of cultivation, answers differ widely, with 43% answering “yes” and 46% answering “no”. Given the current population growth and land use intensity, it is most likely that fallow periods do not increase after each cycle of cultivation. Eighty-eight percent of the interviewees said that they saw a big difference in yield between cultivating a forest cleared for the first time and a fallow land.
The main observations from the agricultural results are that (1) the people of Pokola highly depend on SABA as a means of survival, (2) there is a problem with the fallow period and (3) that there is scope for improvement as most people realise that the agricultural methods have changed in a negative way.

110
Environment
A very positive trend was found concerning people’s views on forest protection, with 78% of the respondents answering that the protection of the forest is important to them. Seventy-two percent of the people would also be interested in participating in a forest protection and management programme.
With the idea of a management plan for agriculture and conserving the forest cover around the village, statistical analysis using logistic regression was done to examine whether or not gender, age group and education had an impact on:
(1) The willingness to participate in a forest protection programme;
(2) The willingness to ‘settle7’ agriculture.
Somewhat surprisingly, no relationships at all were found between these variables and the willingness to settle. For willingness to participate in a forest protection programme, women (B = 1.45, P<0.05) and higher education (B = 0.72, P<0.05) were found to have a significant positive effect on the answer.
Fallow and forest plot research
Botany
A total of 294 species were identified in Bambendzele language, of which 280 were identified to the family level and 274 to the species level. A botanical list was made. As there is no botanical list for Congo, it is hoped that this might be useful for people conducting research in this area in the future, together with some other lists that already exist. The list was handed over in electronic and paper format to the botanists, CIB and to be distributed to NGO’s working in the area.
Table 1. Summary of independent-samples t-test outputs examining species richness in forest and fallow plots.
p Mean spp per plot in forests
Mean spp per plot in fallows
Deduction
Total spp richness < 0.01 79.6 56 Forest plots have higher total spp richness than fallow plots
T spp richness < 0.01 15 4.65 Forest plots have higher T spp richness than fallow plots
ST spp richness < 0.05 15.8 9.53 Forest plots have higher ST spp richness than fallow plots
WH spp richness < 0.01 36.4 23.24 Forest plots have higher WH spp richness than fallow plots
NWL spp richness < 0.05 6.4 10.53 Fallow plots have higher NWH spp richness than forest plots
C spp richness > 0.05 16.2 12.76 There is no significant difference between forest and fallow plots C spp richness
Basal area
Basal area ranged from 0.57 to 44.97m²/hectare in fallow plots (average 15 m²/ha) and from 20.55 to 148.19 in forest plots (average 51.8m²/ha). It was proposed that basal area of the
7 i.e. not shifting anymore

111
fallow plots would increase as fallow age increased. No relationship was found between basal area and fallow age or basal area and total years of cultivation.
Continuing, it was expected that forest plots had higher total species richness (# species per plot) than fallow plots. Species richness in the fallow plots ranged from 29 to 78 (average of 56) and from 70 to 94 (average ~80) in forest plots.
An independent-samples t-test was applied to examine whether there was a significant difference in species richness per strata between forest and fallow plots (Table 1).
Soil samples
Initially, seven soil variables existed being: pH, acidity, OM%, CEC, K, Mg and Ca. As these variables were highly correlated to each other, a PCA was applied and these variables were computed into one variable called ‘PCA axis 1 (fertility)’. The best percentage of variance was explained by using soil layer one only (67.54%).
The relationship between the weighted scores for the first two axes and forest and fallow plots was analysed using a correlation analysis. Forest and fallow plots were correlated with PCA axis 1 (r = -0.817, P<0.01). Therefore, PCA axis 1 (fertility) will be used to examine different relationships between fertility and different variables.
One of these relationships was how this variable related to the species richness of both forest and fallow plots. Correlation analysis results for PCA axis 1 (fertility) and species richness for all strata gave a strong relationship (r = -0.49, P<0.05) (Figure 1).
PCA axis 1 (fertility)
3210-1-2-3
Spe
cies
ric
hnes
s (a
ll s
trat
a)
100
90
80
70
60
50
40
30
20
forest plots
fallow plots
Total Population
Rsq = 0.2393
2221
20
19
18
17
16
15
1413
12
11
109
8
7
6
5
4
3
2
1
The relationship between PCA axis 1 (fertility) and fallow age, age of plot and total years cultivated was also tested. Correlation analysis shows that there is a relationship between PCA axis 1 (fertility) and fallow age (r = -0.53, P<0.05) and total years cultivated (r = 0.48, P<0.05) and none with the age of plot.
Figure 1. Relationship between species richness for all strata and PCA axis 1 (fertility). Samples with a negative score have high values of species richness, samples with a positive score should have low values of species richness, but this does not seem to be the case. Fore example, plot 1 has lower species richness than plot 5 which has a higher positive score.

112
Average qualitative (absence/presence) similarity between fallow and forest plots
The same variables as above were tested against the MDS axis 1 of species average qualitative similarity, Qs, (measured by the absence or presence of a species).
An independent t-test showed that for total species Qs, T Qs, ST Qs, WH Qs and NWH species abundance a significant difference was found (P<0.01) between forest and fallow plots. The exception was climber species where no significant difference was found (P>0.05). For each stratum except C species, where abundances are similar, forest plots have higher species abundance than fallow plots.
MDS – species abundance (cover percentage)
The same variables and relationships as above were tested for the MDS axis 1 for abundance (which was derived from percentage cover of species). The same structure was followed as before. Independent t-test showed that for total species abundance, T species abundance, ST species abundance, WH species abundance and NWH species abundance a significant difference was found between forest and fallow plots (P<0.01). No significant difference was found between forest and fallow plots in the C species (P>0.05). For each stratum except C spp, forest plots have higher species abundance than fallow plots.
After careful analysis of the relative abundance cover percentage of the most representative species encountered in the forest and fallow plots data, it can be seen that two species which stand out in fallow plots as pioneer species, are Musanga cecropioides in the tree strata and Chromolaena odorata (siam weed, a well known invasive weed) in the NLH strata. None of these two species occur in forest plots, therefore one can say that they are undoubtedly related to the clearing of land. Their abundance cover percentage is given in Figure 2.
Fallow plot
Forest plot
1
2
3
4
5
6
7
8
9 10
11
12
13
14
15
16
17
18
19
20 21
22
Stress: 0.13
These two species were in turn tested against fallow age, age of plot, years cultivated and PCA axis 1 (fertility). Two interesting correlations were found here. Firstly, M. cecropioides is correlated with total years cultivated (r = -0.53, P<0.05) and secondly, the occurrence of M. cecropioides and C. odorata are highly correlated as well (r = -0.78, P<0.01).
MDS – Primary, secondary and agricultural species
It was assumed that: (1) forest plots have a higher average of primary species than fallow plots, (2) fallow plots have a higher average of secondary species than forest plots, (3) fallow plots have a higher average of agricultural species than forest plot. These assumptions can be accepted, as can be seen from Table 2.
Figure 2. MDS 2-dimensional output for species abundance cover % in all strata. A stress value of < 0.2 gives a potentially useful 2-dimensional picture, though for values at the upper end of this range, too much reliance should not be placed on the detail of the plot.

113
Table 2. Independent-samples t-test output on differences between forest and fallow plots for primary, secondary and agricultural species.
p Mean spp per plot in forests
Mean spp per plot in fallows
Deduction
Primary spp < 0.01 74 27.7 Forest plots have more primary species than fallow plots
Secondary spp < 0.01 16.6 30 Fallow plots have more secondary species than forest plots
Agricultural spp
< 0.01 0 2.7 Fallow plots have more agricultural species than forest plots
A correlation analysis was applied to examine the relationship between primary, secondary and agricultural species and fallow age, age of plot and total years cultivated. Figure 3 illustrates the variables where a significant correlation was found.
Total years cultivated
76543210
Num
ber
of p
rim
ary
spec
ies
80
70
60
50
40
30
20
10
0
forest
fallow
Total Population
Rsq = 0.2385
18
17
16
15
1413
12
11
109
8
7
6
5
4
32
1
Fallow age (years)
403020100
Num
ber
of p
rim
ary
spec
ies
80
70
60
50
40
30
20
10
0
forest
fallow
Total Population
Rsq = 0.4809
18
17
16
15
1413
12
11
109
8
7
6
5
4
32
1
Figure 3. Illustration of variables where a significant correlation was found. (a) relationship between number of primary species and total years cultivated (P < 0.05) (b) number of primary species and fallow age (P < 0.01).
Tree species diversity (H’)
Independent t-test shows that there is a significant difference in tree species diversity between forest and fallow plots (P<0.01). The Shannon diversity of the tree vegetation ranged from 0 to 2.02 (average of 0.67) in fallow plots and from 1.16 to 3.04 (average of 2.3) in forest plots (Figure 4). A significant correlation (r = 0.74, P<0.01, Figure 3) was only found between tree species diversity and fallow age, none with age of the plot, total years of cultivation or PCA axis 1 (fertility).
The Jaccard Index for similarity coefficients showed no high similarity between any forest or fallow plot (highest was Cj = 0.12 between plot 17 and 19).

114
Fallow age
403020100
Shan
non
-Wie
ner
Ind
ex o
f div
ersi
ty (
H')
3,5
3,0
2,5
2,0
1,5
1,0
,5
0,0
forest
fallow
Total Population
Rsq = 0.5437
18
17
16
15
14
13 12
1110
9
8
7
654
32
1
Discussion
Socio-economic survey
One of the most important factors influencing the use of land and other natural resources, including forests, is human population growth. The nature of use of forests varies significantly depending on the state of socio-economic development (FAO, 2003). For most of the settlers in Pokola, survival depends on SABA, both in subsistence and economic terms. In this case, guaranteeing survival has meant the adoption of an intensified cycle of SABA, resulting in unsustainable activities. Questions on the agricultural cycle indicated that: (1) cassava is the most dominant crop with the highest yield, (2) the fallow periods have decreased quite significantly, (3) lands are left fallow due to decreased yields and (4) there is no systematic increase in the fallow period after each cycle of cultivation. In accordance with point (3), Coomes et al. (2000) showed that with expanding populations and increased competition for land in the Peruvian Amazon, people increased their holdings in forest fallow, yet decreased the length of fallow.
Furthermore, the reasons for change in SABA methods identified are strikingly applicable, meaning that there is a big awareness within the community about the problem, which might in turn be due to the relatively high education level (1 out of 2 people are literate). People understand that without the forest and a proper system for SABA in the future, they will face direct negative consequences. Although farmers realise this, ‘today’s’ production is given priority (Vosti & Witcover, 1996) over tomorrow’s worries. Women and people with a higher education level are more likely to participate in conservation programmes (in this case only in the forest protection programme).
Employment in this area can only be found with CIB, meaning that for about 50% of the people interviewed, the only source of income is agriculture. This also explains why very few of the farmers had land in forest. This is in contrast to, for example, settlers in a Brazilian Amazon colony where farmers still had more than half of their lands in forest (Fujisaka et al., 1996). In the same study, Fujisaka et al. showed that one of the main factors driving land clearing was the need to produce food, which is also one of the main factors in Pokola.
Figure 4. Relationship between H’ and fallow age.

115
Forest and fallow plots
Currently, an increase in the agricultural production in Pokola is only obtained by the reduction of the fallow period, resulting in (1) losses of secondary vegetation areas and (2) in the expansion of agricultural areas. In some of the cases, the fallow period was almost eliminated to accelerate agricultural production and increased yields. The same tendencies have been found by Metzger (2002) in the Bragantina region of the NE Brazilian Amazon. The question which was also raised by Metzger, is up to which point the fallow period can be reduced in the traditional SABA without the system becoming unsustainable. Metzger indicates that in NE Brazilian Amazon, sustainable conditions could be maintained with 11 years of fallow for each cropping year, while shorter cycles would break down the system if agricultural improvements were not implemented. One can assume that the ecological system in Pokola is no longer sustainable and will break down in the future if a proper management plan is not introduced.
Prolonged farming periods exacerbate soil degradation, and, conversely, longer fallow periods theoretically improve soil conditions relative to shorter fallow periods, the ratio of farming period to fallow describes the relative ability of an agro-ecosystem to maintain soil conditions over the long term (Kleinman et al., 1995). In Pokola however, farming periods are increasing and fallow periods are decreasing, indicating that cultivable soil conditions will disappear in the near future if no action is taken.
One of the objectives of this study was to assess the effect of SABA on conservation values of tropical forests. Species richness in fallow plots in the NWH strata increased compared to forest plots, most likely due to an influx of secondary species. It was shown that well managed fallow plots had higher species richness than degraded fallow plots. It should also be noted that some fallow plots (17, 8 and 4) had a relatively high species richness and species diversity (plots 17, 8, 12 and 13), indicating that there is a conservation value of these fallows (which might then be called secondary forests).
Many studies have been conducted on ecosystem recovery through secondary succession in fallow areas (Ohtsuka, 1999). The results of the current study show that most forest characteristics of rain forest in northern Congo did not recover from shifting cultivation. This is probably due to their relatively young fallow age. Van Gemerden et al. (2003a) showed that following recovery after 50-60 years of fallow, the proportion of endemic species was still significantly lower in shifting cultivation sites compared to forests. However, two forest plots (8 and 17) had relatively high values of the Shannon index and plot 17 showed a Jaccard similarity Cj = 0.12 with plot 19, which indicates (although weakly) that there is the potential of restoration through secondary succession.
Recovery of basal area and species composition has not been observed in the plots, due to their relatively young age. In this study, basal area even seemed to decline with fallow age after an initial increase after about 5 years. A study conducted by Van Gemerden et al. (2003a) in Cameroon, showed that basal area and plant density recovered after 50-60 years in shifting cultivation sites.
There is a substantial botanical compositional difference between forest and fallow plots and within some fallow plots. Possible explanations for these compositional differences are probably that (1) species found in forest plots might have a poor intrinsic dispersal capacity, (2) a low abundance of propagule sources and (3) a decline of pollination and dispersal vectors. Although animal traces were found in many of the fallow plots (n = 13), this does not necessarily mean that these are the exact vertebrates that affect dispersal of large seeded mature forest plant species.

116
Carrière et al. (2002) found that woody plants, especially those that persist in later successional stages, were enhanced under the canopies of remnant trees in fallows. Although it was not possible to prove the same relationship in this work since only one plot (plot 17) was found where remnant trees had been left after clearing and cultivation, nevertheless the very rich presence of species in this plot back up the results of Carrière. Therefore, further research should be undertaken on this point and Carrière’s postulation should be incorporated into a management plan for Pokola.
In central Africa fallows are known to be dominated by the most common pioneer species, M. cecropioides, and to a lesser extent by Trema guineensis, Macaranga spp. and Myrianthus arboreus (Mitja & Hladik, 1989). In this study, most fallows were clearly dominated by M. cecropioides and to a much lesser extent by these other pioneer species. The results show that pioneering species, such as M. cecropioides, appear to dominate succession for a relatively long time. If species diversity for all strata could have been measured, species diversity would probably have been more similar between forest and fallow plots, but there would have been a significant floristic difference. In SABA plots, vegetation removal, burning, soil disturbance and weeding, effectively eliminate possibilities for regeneration and resprouting and cause a depletion of the original forest seed bank (Uhl et al., 1981, 1982, 1988).
The very abundant Chromolaena in the fallow plots is known to be spreading throughout Southeast Asia into the south Pacific, into central and eastern Africa from the infestations in western and southern Africa and is regarded as a very serious threat to the environment and agriculture in many of these countries (McFayden & Skarratt, 1996). Although no specific relationship was shown in this study between fallow age and the abundance of this weed, a study by Kushwaha et al. (1981) showed that (1) seedling survival of this weed was markedly reduced with the increase in the age of fallow, (2) recruitment of new individuals to the
As time goes by
Diversity, abundance cover % and basal area
Abundance of weeds
Presence of animal tracks
# of crop rotations after each other
Nutrient and soil depletion
Fallow plot in 'good' conditionFallow plot in 'mediocre'
conditionFallow plot in 'bad' conditionForest plot
Key
Fallow age decreases
Yields of next agricultural cultivation
Phytosanitary problems
Abundance of pioneer species
Species diversity H'
Various tree species
Various pioneerspecies
Weeds
Various ST and WHspecies
Various ST and WHpioneer species
Figure 5. Proposal for a general fallow model in northern Congo

117
population reached a peak in 3 years old fallows and (3) the size of existing populations declined sharply after 5 years. They also found that due to increased population pressure on their study site in India, the fallow cycle had been reduced considerably to 4-5 years, resulting in large tracts of land having been taken over by weeds such as C. odorata. The reason why no relationships were found could be due to the small sample size or due to the data bias as the reliability of information on fallow age obtained from people interviewed is questionable. It can be postulated that the findings by Kushwaha apply to the case of Pokola and therefore should be considered when drawing up a management plan. Once more, fallow age seems to be the key to the problem. Hence, a model of different fallow types including most of the factors is suggested by the author (Figures 5 and 6).
Fallow plot in 'bad' condition
As time goes by
Diversity, abundance cover % and basal area
Abundance of Chromolaena odorata
Presence of animal tracks
Increasing # of crop rotations after each other
Nutrient and soil depletion
Fallow plot in 'good' conditionFallow plot in 'mediocre'
condition
Forest plot
Some points to be considered
w How reliable is the data onfallow age?
w Can species diversity bemeasured for all strata?
w What other weeds andpioneer species are present,what is their distribution and/or abundance cover %?
w What are the similaritycoefficients between thesethree stages of fallow plotsand a forest plot?
w How significant is theincrease and intensificationof follow-up crop cycles?
w What is the ratio of yearscultivated to years fallow?
Fallow age decreases
Yields of next agricultural cultivation
Phytosanitary problems
Abundance of Musanga cecropioides
T species diversity H'
Figure 6. Proposal for an applied fallow model for the situation of Pokola
SABA is part of the system and the daily life of most people in Pokola. It is associated with other forest activities such as hunting, fishing and gathering for some. At the present time, SABA is producing surpluses which are sold on the local market. The surpluses for the moment are somewhat proportional to the need of the community. However, this could no longer be the case in the near future if population continues to increase. On the other hand, currently, the system cannot be considered as ecologically sustainable. Therefore, the issue of social and ecological sustainability is becoming a more severe and urgent question to tackle.
The results and above discussion have shown that the drastic shortening of the fallow periods is detrimental to the environment and poses a challenge for biodiversity conservation. The primary factor in Pokola is the increase in population density due to the relatively good living conditions provided by CIB (subsidised influx). This increase augments pressure on the lands. It is also clear that the people are confronted with economic development, thus encouraging farmers to produce faster and increased quantities.

118
As land is becoming scarce, fallow periods are shortening. Thus, this accelerated rotation leads to increasing use of secondary forests which no longer have time to mature. As shown by the study, repeated clearing of the secondary forests leads to a decrease in species diversity, leading to the dominance of M. cecropioides and ultimately to the disappearance of contiguous tree cover (leaving C. odorata as the most abundant species).
Land shortage means that the productivity per land unit must be increased. If this is to continue in Pokola, the danger is that increasingly complex and demanding agricultural practices will have to be adopted. Moreover, if and when it becomes impossible to restore soil fertility by natural vegetation, it will probably become necessary to use fertilisers to make up for the loss, while these are very difficult and expensive to obtain in this isolated area. It is necessary that the simple practices and methods for composting organic vegetable matter should be introduced and the population trained. This would minimise the need for chemical fertilisers, while at the same time increase productivity and reduce waste streams.
SABA has become part of the forest ecosystem. The process of ‘capturing’ the nutrient cycle helps to constitute a self-generating agricultural system. It should be acknowledged that stabilising SABA can take place only when other means of reconstituting soils and nutrients have been found. Traditional SABA can be seen as a ‘simultaneous polyculture’, as planted plots have a mixture of different crops. This diversity, which results from the local culture, knowledge and expertise, should be considered as an irreplaceable genetic heritage.
The study has also shown that the local people are prepared to participate in various programmes. This offers significant potential for a successful management plan. Furthermore, ITTO principles (2003) also state that concessionaires such as CIB should encourage the participation of local populations present in the Forest Management Units in the management of forest resources.
Conclusion
This study postulates a basic understanding regarding the relationships between various socio-economic and ecological parameters across SABA. It also places into perspective the problems related to modified SABA methods in a remote tropical rural village that is faced with intense population pressure. Most importantly, it calls for the absolute necessity of further research in this area and into this particular problem, as well as the construction and adaptation of a long-term participatory management plan involving all stakeholders. To complicate matters, there are relatively few biologists, ecologists, conservationists and anthropologists working together in Africa – and even fewer who are African citizens. More in depth understanding is needed if we are to develop and implement successful management policies. Sharing, exchange and accessibility of data is a major issue which needs to be addressed. Until our knowledge improves, our ability to conserve and/or manage effectively will be limited.
The findings of this study are in general agreement with observations and work by others. It was shown that SABA can be sustainable as long as it is practiced under care of the traditional methods. Pressures, due to population increase, on high cultivation rate and low fallow time result in significant adverse effects on the environment. This is manifested by low land productivity, species disappearance and very slow fallow land regeneration, if any.
In conclusion, a biodiversity conservation management plan that would ignore the impact of SABA on the natural processes of forest regeneration may suggest a strategy that, if employed, could lead to the inadvertent and irreversible collapse of the ecosystem and of the economic and social system as well. Although this study is focused on the problematic of

119
SABA, the issue is relevant for other production systems (e.g., fishing, pisciculture) in which the management of natural resources can have an impact on the ‘sustainability and renewability’ of that particular resource by changing the balance among species that comprise the resource environment.
Understanding and modelling the impact of SABA on one hand and other resource uses on the dynamics of resource recovery on the other hand, should improve long-term management of renewable resources. This would help prevent short-sighted and sub-optimal irreversible changes in ecosystem characteristics and economic value.
In a more general context, this study demonstrates that in trying to resolve such complex and conflicting situations as conserving biodiversity and the environment including the ‘people’ aspect, we will probably not achieve all our aspirations. However, at least incremental progress will have been made. Disregarding the problem is not an option we have. Addressing such issues is one of the most important democratic, environmental and human rights struggles of our and future generations.
Acknowledgements
This research was undertaken as partial fulfilment of a BSc in Environmental Sciences at the University of East Anglia, Norwich, UK. I thank the director of CIB, Mr. Jean-Marie Mevellec, for having accepted me as an intern. For his patience, guidance and kindness, special thanks to Dr. Dominque Paget who was my supervisor in Pokola. Mr. Olivier Desmet likewise attributed me much of his time, experience and help. Special thanks as well to the WCS and fieldwork team members, their patience, continuous explanations, ideas and support formed a crucial part of the study: Antoine Moukassa, Roger Mombandzo, Kossa Kossa, Charles and Pascal. Many thanks to Nadine Laporte and Tiffany Lin for their support with the Landsat TM images and analyses of the soil samples. Many thanks to my advisor and supervisor at UEA, Dr. Paul Dolman, for having strongly supported me when I was in Congo and for his time, patience and multiple explanations on how to best use, manipulate and correlate my data.
References
Adesina, A.A., D. Mbila, G.B. Nkamleu, & D. Endamana, 2000. Econometric analysis of the determinants of adoption of alley farming by farmers in the forest zone of southwest Cameroon. Agriculture, Ecosystems and Environment 80: 255-265.
Alegre, J.C. & D.K. Cassel, 1996. Dynamics of soil physical properties under alternative systems to slash-and-burn. Agriculture, Ecosystems and Environment 58: 39-48.
Brady, N.C. 1996. Alternatives to slash-and-burn: a global imperative. Agriculture, Ecosystems and Environment 58: 3-11.
Cain, S.A. & G.M. Castro, 1959. Manual of vegetation analysis. Harper & Brothers Publishers, New York.
Carrière, S.M., P. Letourmy & D.B. McKey, 2002. Effects of remnant trees in fallows on diversity and structure of forest regrowth in a slash-and-burn agricultural system in Southern Cameroon. Journal of Tropical Ecology 18: 375-396.

120
Coomes, O.T., F. Grimard, & G.J. Burt, 2000. Tropical forests and shifting cultivation: secondary forest fallow dynamics among traditional farmers of the Peruvian Amazon. Ecological Economics 32: 109-124.
Essama-Nssah, B., J. Gockowski & L.A. Kelly, 2002. A New Deal for Cameroon’s Forests. In Lele, U. (ed), Managing a global resource: challenges of forest conservation and development. World Bank series on Evaluation and Development Vol 5, p.137-165.
FAO, 2003. Forestry outlook study for Africa: Subregional report: Central Africa.
Fox, J., D.M. Truong, A.T. Rambo, N.P. Tuyen, L.T Cuc & S., Leisz, 2000. Shifting cultivation: A New Old Paradigm for Managing Tropical Forests. BioScience 50(6): 521-528.
Fujisaka, S., W. Bell, N. Thomas, L. Hurtado & E. Crawford, 1996. Slash-and-burn agriculture, conversion to pasture, and deforestation in two Brazilian Amazon colonies. Agriculture, Ecosystems and Environment 59: 115-130.
Harwood, R.R., 1996. Development pathways toward sustainable systems following slash-and-burn. Agriculture, Ecosystems and Environment 58: 75-86.
ITTO, 2003. ATO/ITTO principles, criteria and indicators for the sustainable management of African natural tropical forests. ITTO Policy Development Series No 14.
Jaccard, A., 1908. Nouvelles recherches sur la distribution florale. Bulletin de la Société Vaudoise de Sciences Naturelles 44: 223-270.
Kleinman, P.J.A., D. Pimentel. & R.B. Bryant, 1995. The ecological sustainability of slash-and-burn agriculture. Agriculture, Ecosystems and Environment 52: 235 -249.
Kushwaha, S.P.S., P.S. Ramakrishnan & R.S. Tripathi, 1981. Population dynamics of Eupatorium odoratum in successional environments following slash and burn agriculture. Journal of Applied Ecology 18: 529-535.
McFayden, R.C. & B. Skarratt, 1996. Potential distribution of Chromolaena odorata (siam weed) in Australia, Africa and Oceania. Agriculture, Ecosystems and Environment 59: 89-96.
Mehta, J.N. & S. Kellert, 1998. Local attitudes toward community based-conservation policy and programmes in Nepal: a case study in the Makalu-Brarun Conservation Area. Environmental Conservation 25(4): 320-333.
Metzger, J.P., 2002. Landscape dynamics and equilibrium in areas of slash-and-burn agriculture with short and long fallow period (Bragentina region, NE Brazilian Amazon). Landscape Ecology 17: 419-431.
Myers, N., 1991. Tropical forests – Present status and future outlook. Climate Change 19: 1-2.
Mitja, D. & A. Hladik, 1989. Aspects de la reconstitution de la végétation dans deux jachères en zone forestière humide (Makokou, Gabon). Acta Oecologica/Oecologica Generalis 10: 75-94.
Morin, P.J., 1999. Community ecology. Blackwell Publishing, Abingdon, p.18.
Naughton-Treves, L. & W. Weber, 2001. Human Dimensions of the African Rain Forest, In Weber, W., L.J.T. White, A. Vedder, L. Naughton-Treves (eds), African Rain Forest Ecology and Conservation. Yale University Press, New Haven and London p.30-43.
Ohtsuka, T., 1999. Early stages of secondary succession on abandoned cropland in north-east Borneo Island. Ecological Research 14: 281-290.

121
Pye-Smith, C., 1997. Focus: Friendly Fire-Far from being environmental vandals, traditional slash-and-burn farmers in Asia have a lot to teach ecologists about sustainable agriculture. New Scientist 156: 2108-2115.
Prasad, V.K., Y. Kant & K.V.S. Badarinath, 2001. CENTURY ecosystem model application for quantifying vegetation dynamics in shifting cultivation areas: A case study from Rampa Forests, Eastern Ghats (India). Ecological Research 16: 497-507.
Uhl, C., H. Clark & P. Murphy, 1981. Early plant succession after forest cutting and burning in the Upper Rio Negro region of the Amazon Basin. Journal of Ecology 69: 631-649.
Uhl, C., H. Clark & K. Clark, 1982. Successional Patterns Associated with Slash-and-Burn Agriculure in the Upper Rio Negro Region of the Amazon Basin. Biotropica 14(4): 249-254.
Uhl, C., R. Buschbacher & E.A.S. Serrap, 1988. Abandoned pastures in Eastern Amazonia. 1. Patterns of plant succession. Journal of Ecology 76: 663-681.
Van Gemerden, B.S., G.N. Shu & H. Olff, 2003a. Recovery of conservation values in Central African rain forest after logging and shifting cultivation. Biodiversity and Conservation 12: 1553-1570.
Van Gemerden, B.S., H. Olff, M.P.E. Parren & F. Bongers, 2003b. The pristine rain forest? Remnants of historical impacts on current tree species composition and diversity. Journal of Biogeography 30: 1381-1390.
Van Noordwijk, M., 1999. Productivity of intensified crop-fallow rotations in the Trenbath model. Agroforestry Systems 47(1-3): 223-237.
Vosti, S.A. & Witcover, J., 1996. Slash-and-burn agriculture – household perspectives. Agriculture, Ecosystems and Environment 58, 23-28.
Wilkie, D.S. & N. Laporte, 2001. Forest Area and Deforestation in Central Africa: Current Knowledge and Future Directions, in Weber, W., L.J.T. White, A. Vedder, L. Naughton-Treves (eds.) African Rain Forest Ecology and Conservation. Yale University Press, New Haven and London: p.119-139.

122
Configuration problem and description logic: towards automated species distribution mapping
Pérez Lapeña, B.1, R.A. de By & F. Corsi
International Institute for Geoinformation Science & Earth Observation (ITC), P.O. Box 6, 7500 AA Enschede, The Netherlands. [email protected], [email protected], [email protected]
1 Current address: Water Engineering & Management University of Twente, P.O. Box 217, 7500 AE, Enschede, The Netherlands.
Keywords: Configuration problem, description logic, species distribution mapping, GIS, African mammals
Abstract
Moving towards more automated data integration requires using a more structured semantic approach to data handling. While current systems are focusing on basic data interoperability we investigate options to define a reliable method which automatically constructs a species distribution map, using a GIS, from spatial foundation data, species knowledge, mapping method knowledge and map purpose.
We apply description logics (DLs) to the domain of species distribution mapping. Any species distribution mapping procedure can be simplified as a combination of: Data (D)–Method (M)–Output (O)
We build suitable ontologies to handle the D component, namely (a) species, (b) ecological preferences and (c) environmental layers.
We look at the M component as a complete script to generate a distribution map. The construction of scripts is addressed as a configuration problem.
Finally we test the approach using the data of the African Mammals Databank (IEA, 1998) and modelling the species Cercopithecus wolfi Meyer, 1891.
Problem identification
GIS based environmental suitability models have become widely used proxies to the definition of species distribution ranges (Corsi et al., 2000; Guisan & Zimmermann, 2000) and are becoming standard tools in a number of biodiversity assessment projects (e.g. GAP Analysis Project (Scott & Jennings, 1997; Scott et al., 1993), African Mammals Databank (IEA, 1998)) to the extent that the basic methodology is being embedded in the Global Assessments projects (see IUCN, Conservation International, and NatureServe (2004), for a description) as an important step for the assessment of species Red List categories (IUCN, 2000).
GIS based species distribution models can be classified according to the methodology used to build them (Corsi et al., 2000; Skidmore, 2001). They fit into two main groups: inductive and deductive. Inductive models make use of species observations to derive the ecological preference according to a set of environmental characteristics in those particular locations. In the deductive models, the ecological preferences are assumed to be known a priori, either

123
extracted from the literature or from experts’ opinion, or both. Once the species ecological preferences have been determined, the next step performed is to identify the areas where the ecological preferences characteristics are fulfilled.
Choosing the correct model depends on the combination of available datasets, available knowledge and purpose of the modelling exercise. This paper addresses the issue of methodical consistency, specifically in that of repeatable, instantaneous computer-aided species distribution mapping, in scenarios where new data sets become available regularly. We do not attempt to answer ecological problems here, but rather want to provide flexible methods supporting ecologists in their mapping procedures, in the hope of deriving a procedural understanding that could eventually be (better) automated.
A number of examples exist (e.g. GBIF, OBIS, IABIN) which support self-descriptive exchange of biodiversity information amongst researchers, making shareability of data in many cases a reality. Nevertheless in the case of species mapping procedures we are interested not only in knowledge representation and sharing, but also in the reasoning mechanism that allows finding relationships otherwise difficult to visualize.
In the traditional approach to species environmental suitability modelling, knowledge is represented by means of ad hoc data structures, and reasoning is accomplished by ad hoc procedures that manipulate these structures. We investigate options to define a reliable method which automatically constructs a species environmental suitability model, using GIS, from spatial foundation data, species knowledge, mapping method knowledge and map purpose. We work under the assumption that any of the latter four inputs may change overnight, possibly resulting in re-determination of the output, the species map.
We look into Description Logics as the formalism that allows to combine data, metadata and the logic behind them, in an effort to automate species modelling procedures and, at the same time, allow to deal with changes in user requirements and data availability and support different modelling approaches.
We view the problem of mapping a species distribution as a configuration problem, and apply description logics to this domain. Configuration problems can be defined as problems dealing with finding a suitable composition of parts to construct a whole. These problems are typical of many engineering disciplines, for instance in manufacturing and various forms of industrial design. In our case, the configuration to be constructed is a GIS execution scheme – such as a script – that produces a species map. To construct such a scheme, we need to determine the species data, and its ecological characteristics, the availability of base geodata sets representing ecological parameters, as well as a choice of the applied (predictive) ecological models. The chosen model provides definitions of each of its model steps, the actual implementation of which may depend on, for instance, available data.
The choices to be made can typically be accommodated within the domain of configuration problem solving, by setting up the knowledge base in an appropriate way. This paper deals especially with that aspect, and demonstrates our first results.
Approach and methods
We tackle the problem of species distribution mapping within a framework with the following overall characteristics:
- be sensitive to the complexity of the overall problem, for instance, allowing the generation of scripts for different species, using different base data sets, applying different models, potentially using different GIS implementation platforms;

124
- be sustainable and repeatable, thereby providing a mechanism that could be maintained, and that could be trusted to provide consistent results;
- be extensible, allowing for instance the addition of more species information, the constant renewal of base data sets, typically obtained from geodata providers over the internet, and the inclusion of additional models of species mapping;
- be capable of providing explanation about the construction of actual scripts, for instance explaining why some model was chosen over another.
To implement such framework we need a formalism that (a) allows us to describe and manipulate data and their metadata together; (b) accommodates the description of taxonomic data (as in data taxonomies, or ontologies); (c) relates to formats already in use for (geo)data exchange on the internet; and (d) allows to reason over such descriptions. In short, the formalism that we are looking for needs to be declarative, and preferably logic-based, and fit for data exchange.
We opted for SHIQ (Horrocks et al., 2000), one of the formalisms of the family of description logics. This logic can be used to provide a formal semantics of languages such as DAML+OIL (Connolly et al., 2001) and OWL (Bechhofer et al., 2004), both XML-based exchange languages for ontological information. The reason why we picked this logic is that it is (a) highly expressive, (b) it has a sound and complete axiomatics (proof system), and (c) it has been implemented in a public domain reasoner (RACER (Renamed ABox and Concept Expression Reasoner) (Haarslev & Möller, 2001)), which was the reasoner of choice for our project.
We based our case study on the data provided by the African Mammals Databank project (IEA, 1998), more specifically though arbitrarily, on the monkey species of the subfamily Cercopithecinae. We used the data that the AMD project produced to the full extent: species data, species ecological preferences, spatial data sets (vegetation, land cover, permanent water bodies), and also the eco-computational models applied were modelled in our case study. All of these were cast in a metadata structure representing details, and fit for reasoning, and indeed configuration determination.
Metadata structure and formalism
Description logics (DLs) allow describing a Universe of Discourse (UoD) in terms of concepts, which are viewed as populations of individuals, and roles, which represent binary relations between individuals. Though the characteristics vary between them, most DLs allow further structuring the UoD description with notions such as concept union, concept intersection, and universal/existential role quantification. Concepts can be declared to be in a subsumption relation with each other, and so can roles. Roles are commonly used to denote attributes, and 1:1, 1:N, N:M relationships. More information on DLs can easily be gleaned from the literature, for instance from Baader, 2003; Borgida & Brachman, 2003; Haarslev & Möller, 2001 & 2003 and Horrocks et al., 2000.
Using the SHIQ formalism, we built simple ontologies for the species that we worked on, for their ecological preferences, for two ecological models, as well as for the types of spatial data set that we expected to work with. For the species, for instance, the ontology reflected the latest taxonomic beliefs. In the case of Wolf’s Monkey (Cercopithecus wolfi Meyer, 1891), used below as an example, Cercopithecus was one of four genera considered in our simple taxonomic ontology, along with the Cercopithecus mona superspecies (the Mona monkeys) and its six species (C. wolfi being one of them). To all species were assigned attributes, but

125
those that were shared amongst all members of a monophyletic group (a complete taxonomic subtree) were attributed to the node in the taxonomy representing the whole group.
For the ecological mapping model, we focused on a single deductive model, which did allow for treatment of specific ecological preferences like water and elevation dependence. This is one of the models defined and applied for the development of the AMD (IEA, 1998).
Configuration
The construction of a species distribution mapping script is a problem domain that lends itself well tackled with configuration techniques (Felfernig et al., 2002; McGuinness, 2003). These techniques attempt to construct a consistent whole out of a range of possible parts. In our case, the whole is the complete script; the parts are computational steps, fuelled by data sets. The DL is used to build a knowledge base that describes the part types, the potential part-whole relationships, the mutual part interfaces in terms of constraints on data types, and even some forms of incompatibility.
To do so, we followed the technique proposed in Felfernig et al. (2002), where a configuration problem is defined as a triple (D, S, C). Here, D is the domain description of the script, S is the system requirements specification defining the specific configuration problem, and C consists of a subset of the concepts and a subset of the roles, which together form the allowed configuration language to describe configuration solutions.
Species distribution mapping case study
The first model we developed consisted of three first- level components, i.e., computational steps; with each of these steps consisting of smaller components. A component can be seen as a part plugged into the script. This is true for components at all levels.
Species data selection The overall goal of this step is to determine the species of interest to the user, and optionally the area of interest to the user. Also, once these have been identified, any knowledge regarding the species’ ecological preferences will be traced in the knowledge base.
Spatial data set selection Since this model is a deductive one, this step identifies whether an Extent of Occurrence (EO) for the species is available, and whether spatial-ecological data sets for the preferences identified above are available. Also, any necessary data conversions are determined as preparatory steps.
Mapping potential species distribution In this third step of the model, the data sets found earlier are combined in a spatially meaningful way, using the GIS of choice, to obtain the potential distribution map.
In the deductive approach here depicted, the species’ ecological preference information is available within the system. We provide below a description of one type of ecological preference and how this has been stored for use in the mapping procedure. It is based on suitability scores assigned to each of the environmental variables separately and a fixed rule to determine the final score when suitability scores are combined.
The ontology developed for ecological preferences is depicted in Figure 1. The ecological preference concept represents the population of ecological preferences associated to Taxon individuals (the ontology for Species is depicted in Figure 2). It discriminates between an ecological preference that associate a taxon to discrete and continuous themes (e.g.,

126
vegetation and elevation respectively) as their operational treatment in GIS context is fundamentally different.
Figure 1. Ontology for the species’ ecological preferences.
Figure 2. Graphical User Interface of Protégé showing the representation of the Taxon concept.
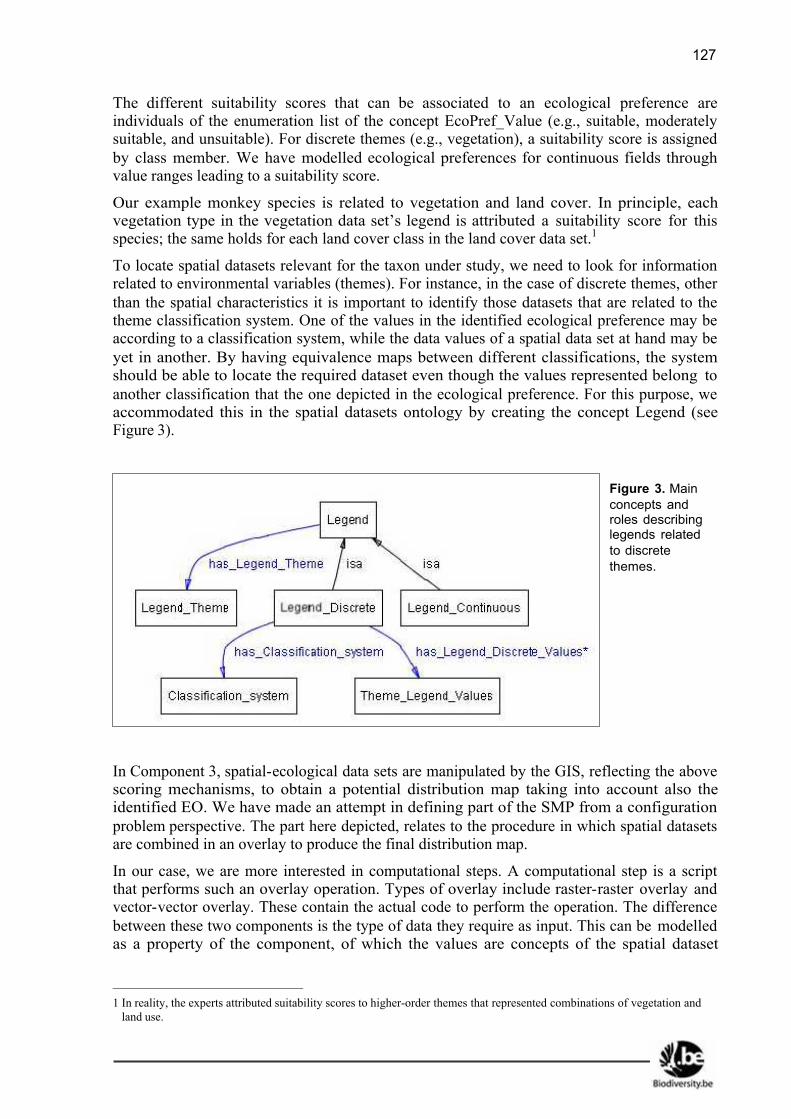
127
The different suitability scores that can be associated to an ecological preference are individuals of the enumeration list of the concept EcoPref_Value (e.g., suitable, moderately suitable, and unsuitable). For discrete themes (e.g., vegetation), a suitability score is assigned by class member. We have modelled ecological preferences for continuous fields through value ranges leading to a suitability score.
Our example monkey species is related to vegetation and land cover. In principle, each vegetation type in the vegetation data set’s legend is attributed a suitability score for this species; the same holds for each land cover class in the land cover data set.1
To locate spatial datasets relevant for the taxon under study, we need to look for information related to environmental variables (themes). For instance, in the case of discrete themes, other than the spatial characteristics it is important to identify those datasets that are related to the theme classification system. One of the values in the identified ecological preference may be according to a classification system, while the data values of a spatial data set at hand may be yet in another. By having equivalence maps between different classifications, the system should be able to locate the required dataset even though the values represented belong to another classification that the one depicted in the ecological preference. For this purpose, we accommodated this in the spatial datasets ontology by creating the concept Legend (see Figure 3).
In Component 3, spatial-ecological data sets are manipulated by the GIS, reflecting the above scoring mechanisms, to obtain a potential distribution map taking into account also the identified EO. We have made an attempt in defining part of the SMP from a configuration problem perspective. The part here depicted, relates to the procedure in which spatial datasets are combined in an overlay to produce the final distribution map.
In our case, we are more interested in computational steps. A computational step is a script that performs such an overlay operation. Types of overlay include raster-raster overlay and vector-vector overlay. These contain the actual code to perform the operation. The difference between these two components is the type of data they require as input. This can be modelled as a property of the component, of which the values are concepts of the spatial dataset
1 In reality, the experts attributed suitability scores to higher-order themes that represented combinations of vegetation and
land use.
Figure 3. Main concepts and roles describing legends related to discrete themes.
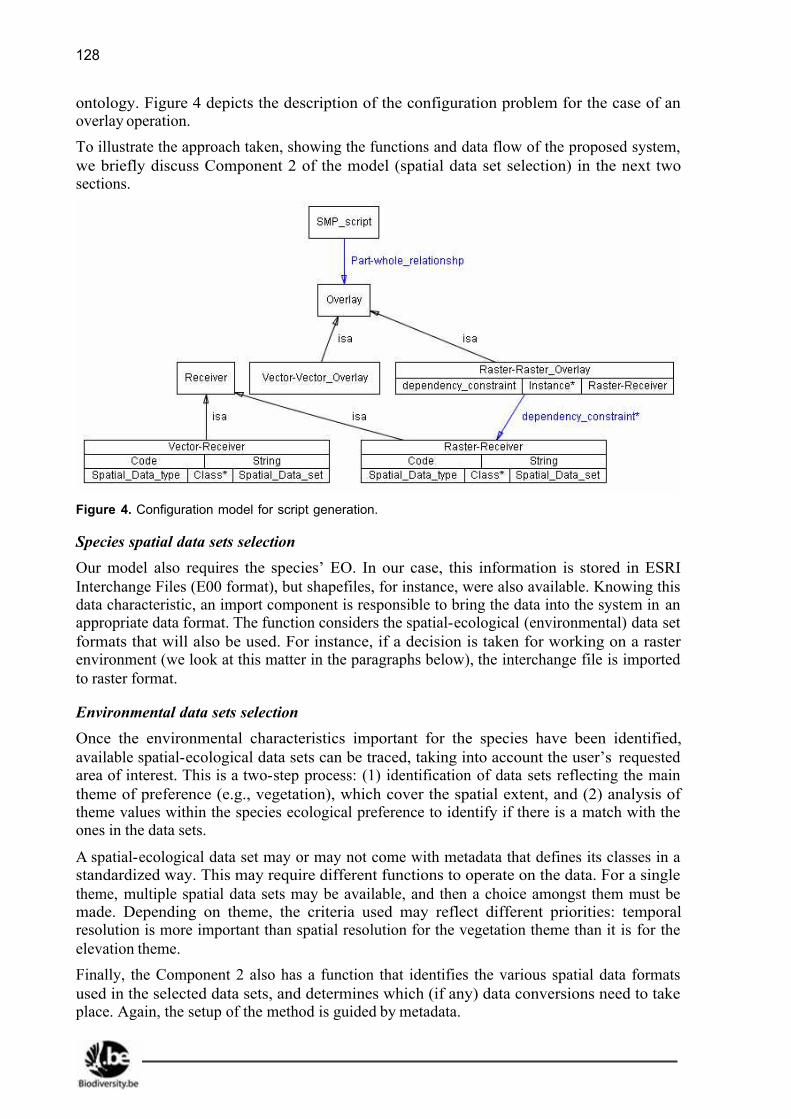
128
ontology. Figure 4 depicts the description of the configuration problem for the case of an overlay operation.
To illustrate the approach taken, showing the functions and data flow of the proposed system, we briefly discuss Component 2 of the model (spatial data set selection) in the next two sections.
Figure 4. Configuration model for script generation.
Species spatial data sets selection
Our model also requires the species’ EO. In our case, this information is stored in ESRI Interchange Files (E00 format), but shapefiles, for instance, were also available. Knowing this data characteristic, an import component is responsible to bring the data into the system in an appropriate data format. The function considers the spatial-ecological (environmental) data set formats that will also be used. For instance, if a decision is taken for working on a raster environment (we look at this matter in the paragraphs below), the interchange file is imported to raster format.
Environmental data sets selection
Once the environmental characteristics important for the species have been identified, available spatial-ecological data sets can be traced, taking into account the user’s requested area of interest. This is a two-step process: (1) identification of data sets reflecting the main theme of preference (e.g., vegetation), which cover the spatial extent, and (2) analysis of theme values within the species ecological preference to identify if there is a match with the ones in the data sets.
A spatial-ecological data set may or may not come with metadata that defines its classes in a standardized way. This may require different functions to operate on the data. For a single theme, multiple spatial data sets may be available, and then a choice amongst them must be made. Depending on theme, the criteria used may reflect different priorities: temporal resolution is more important than spatial resolution for the vegetation theme than it is for the elevation theme.
Finally, the Component 2 also has a function that identifies the various spatial data formats used in the selected data sets, and determines which (if any) data conversions need to take place. Again, the setup of the method is guided by metadata.

129
Results and Conclusions
We built up a tiny fraction of what needs to become a full ontology, using OWL, and its underlying formalism SHIQ. The ontology reflected knowledge on species, their ecological preferences, spatial data sets, two versions of a deductive species distribution model plus its computational components. The ontology was set up in such a way that it allowed the formulation – and subsequent solution – of a GIS script derivation, seen as a configuration problem.
We applied this procedure to a single species, Wolf’s Monkey. The result is shown in Figure 5. This is the first result we obtained in this project. Of the main objectives that we set out to address (see Section ‘Problem identification’), we believe that that our approach shows promise for the future. The configuration technique allows describing complex scripting problems, as we parameterized much of the whole problem domain. It remains to be seen how the system will be able to deal with larger amounts of base data, for instance in the knowledge base. The declarative nature of the knowledge base, and the systematic setup of the configuration problem, is probably advantageous for maintenance over time, and certainly leads to repeatable exercises. It even allowed us to find some slight inconsistencies in previously published work. The approach certainly lends itself well for extensions, as more species, more data sets, and more models can be added at will. We have not worked yet on the explanatory facets of our approach, nor on techniques that would allow to provide feedback about choices made to the end users.
Figure 5. Potential distribution of Wolf’s Monkey (Cercopithecus wolfi Meyer, 1891). Area depicted is part of the Southern Zaire Basin, Democratic Republic of Congo, south and east of Zaire River, including the Kasai River watershed.
130
References
Baader, F., 2003. The Description Logic Handbook, chapter Description Logic Terminology, Appendix: 485-495. Cambridge University Press, Cambridge, UK.
Bechhofer, S., F. van Harmelen, J. Hendler, I. Horrocks, D.L. McGuinness, P.F. Patel-Schneider & L.A. Stein, 2004. Owl Web Ontology Language reference. Technical report, World Wide Web Consortium (W3C). W3C Recommendation 10 February 2004.
Borgida, A. & R.J. Brachman, 2003. The Description Logic Handbook, chapter Conceptual Modeling with Description Logic: 349-372. Cambridge University Press, Cambridge, UK.
Connolly, D., F. van Harmelen, I. Horrocks, D.L. McGuinness, P.F. Patel-Schneider & L.A. Stein, 2001. DAML+OIL (march 2001) reference description. Technical report, World Wide Web Consortium (W3C). W3C Note 18 December 2001.
Corsi, F., J. de Leeuw & A. Skidmore, 2000. Modeling species distribution with GIS. In L. Botani & T.K. Fuller (eds), Research Techniques in Animal Ecology: 389-434. Columbia University Press, New York.
Felfernig, A., G. Friedrich, D. Jannach & M. Zanker, 2002. A joint foundation for configuration in the Semantic Web. In Proceedings 15th European Conference on Artificial Intelligence - Configuration Workshop: 89-94. ECAI.
Guisan, A. & N.E. Zimmermann, 2000. Predictive habitat distribution models in ecology. Ecological Modelling 135: 147-186
Haarslev, V. & R. Möller, 2001. Description of the RACER system and its applications. In C. Goble, D.L. McGuinness, R. Möller & P.F. Patel-Schneider (eds), Working Notes of the 2001 International Description Logics Workshop (DL-2001): 132-141. Stanford, Ca, USA. www.ceur-ws.org/Vol-49
Haarslev, V. & R. Möller, 2003. RACER user’s guide and reference manual, version 1.7.7. Technical report, Concordia University, Montreal, Canada & University of Applied Sciences, Wedel, Germany. www.sts.tu-harburg.de/~r.f.moeller/racer/racer-manual-1-7-7.pdf
Horrocks, I., U. Sattler & S. Tobies, 2000. Reasoning with individuals for the description logic SHIQ. In D. MacAllester (ed), Proceedings of the 17th International Conference on Automated Deduction (CADE 2000) in Lecture Notes in Artificial Intelligence 1831: 482-496.Springer-Verlag. www.cs.man.ac.uk/~horrocks/Publications/download/2000/CADE17.pdf
IEA, 1998. African Mammals Databank - A Databank for the Conservation and Management of the African Mammals Vol. 1 & 2. Institute of Applied Ecology. European Commission Directorate, Bruxelles. Report to the Directorate-General for Development (DGVIII/A/1) of the European Commission. Project No. B7-6200/94-15/VIII/ENV.
IUCN, 2000. IUCN Red List Categories. Version 3.1 Prepared by IUCN Species Survival Commission. IUCN
IUCN, Conservation International, and NatureServe, 2004. Global Amphibian Assessment. www.globalamphibians.org Downloaded on 15 October 2004.
McGuinness, D.L., 2003. The Description Logic Handbook, chapter Configuration: 388-405. Cambridge University Press, Cambridge, UK.

131
Scott, J.M., F. Davis, B. Csuti, R. Noss, B. Butterfield, C. Groves, H. Anderson, S. Caicco, F. D'Erchia, T. Edwards, J. Ulliman & G. Wright, 1993. Gap analysis: A geographic approach to protection of biological diversity. Journal of Wildlife Management 57(1) supplement, Wildlife Monographs 123.
Scott, J.M. & M.D. Jennings, 1997. A Description of the National Gap Analysis Program. www.gap.uidaho.edu/About/Overview/GapDescription/default.htm
Skidmore, A. (ed), 2002. Taxonomy of Environmental Models in the Spatial Sciences. In Environmental Modeling with GIS and Remote Sensing: 8-25. Taylor and Francis, London.

132
One year of taxonomic capacity building by the Belgian Focal Point to the Global Taxonomy Initiative
Samyn, Y., A. Réveillon, A. Franklin & J.L. Van Goethem
Belgian Focal Point to the Global Taxonomy Initiative, Royal Belgian Institute of Natural Sciences, Vautierstraat 29, B-1000 Brussels, Belgium, [email protected]
Keywords: taxonomy, collection management, capacity building, GTI, developing countries, Belgium
Abstract
In June 1992, the United Nations Convention on Biological Diversity (CBD) was adopted. Conservation of biological diversity, sustainable use of its components and fair and equitable sharing of the benefits arising from the use of genetic resources, the three objectives of the CBD, became prime points on the political agenda of contracting parties. It was soon realized that effective implementation of these objectives was going to be largely dependent on the capacity to inventory, assess and monitor biodiversity. As such, modern taxonomic research, collection management and access to taxonomic data were recognized to be important keys to achieve operability of the CBD. The Global Taxonomy Initiative (GTI), one of the cross-cutting issues of the CBD, is the locomotive striving to install a satisfying amount of taxonomic capacity worldwide.
The Royal Belgian Institute of Natural Sciences (RBINS), in its capacity of Belgian National Focal Point to the GTI (GTI NFP), contributes to Belgium’s GTI engagements by being a centre of: (i) information; (ii) facilitation, (iii) cooperation, and (iv) tutoring. Even though the RBINS is the largest of Belgium's high quality taxonomic research organisations, it only can come to terms with its obligations through synergistic cooperation with the other national taxonomic research institutes, i.e. the Royal Museum for Central Africa (RMCA) in Tervuren and the National Botanic Garden (NBG) in Meise, as well as with various other national and international partners. This contribution sketches the modus operandi with which the GTI NFP contributes to taxonomic capacity building in developing countries, as well a synopsis of the first results.
Introduction
The Global Taxonomy Initiative in a nutshell
The immense value of biological diversity was officially and legally acknowledged by the vast majority of the worlds’ governments at the famous Earth Summit in Rio De Janeiro, Brazil (June 1992). One of the instruments towards the conservation and sustainable use of the environment, adopted during that meeting, was the United Nations Convention on Biological Diversity, an agreement that, at present (April 2005), is ratified by 188 parties (187 countries + the European Community).
This Convention brought suite to an outbreak of national and international programmes that aim to implement its three objectives: (i) the conservation of biological diversity, (ii) the sustainable use of its components, and (iii) the fair and equitable sharing of the benefits

133
arising from the use of genetic resources. In the mid of the subsequent frantic, but constructive political and scientific international meetings, it was realized that taxonomy is the key to success of implementing the CBD.
At the second bi-annual grand assembly, the so-called Conference of the Parties (COP-2), the contracting parties addressed the limited and often eroded taxonomic and curatorial capacity in many parts of the world. It was recognized that this situation was especially stringent in the mega-diverse countries of the South where, paradoxically, only a tiny fraction of the world’s taxonomists are active, but facing serious financial and infrastructural handicaps. With the adoption of the cross-cutting Global Taxonomy Initiative (COP-3), the CBD Secretariat installed a forum for resolving the so-called taxonomic impediment. This agreement quickly became an important paean for sound taxonomic research worldwide. During COP-6, the political decision for the GTI was complemented with a ‘programme of work’, a strategic plan that guides parties to implement the GTI objectives. The latter not only sets effective goals, but also provides the rationale for the choice of the operational targets. The Secretariat’s flow-chart of the operational programme is here retaken with permission (Figure 1). Successful implementation of this programme of work will, to a very large extent, depend on far-going integration and fine-tuning of other existing regional, national and global initiatives.
Belgium and the GTI
Belgium signed and ratified the CBD in 1992 and 1996 respectively. In implementing COP decision V/9, paragraph 4, Belgium designated, in 2001, the Royal Belgian Institute of Natural Sciences in Brussels as its National Focal Point to the GTI. This research institute and museum harbours a vast collection of recent zoological specimens (roughly 27 million), a library of global importance, well-equipped research facilities and well-trained scientific and curatorial staff. It is the largest of Belgium's high quality taxonomic research institutes. It works in partnership with the other Belgian museums and institutes, i.e. the Royal Museum for Central Africa in Tervuren and the National Botanic Garden, in Meise, as well as with universities and other relevant taxonomic research. Concisely, Belgium has the taxonomic and curatorial capacity to effectively contribute to the tackling of the taxonomic impediment.
Structure of the Belgian GTI NFP
Even though only one staff member mans the Belgian GTI NFP full time (YS), it can certainly not be stated that the GTI NFP is a singleton. Au contraire, the GTI NFP
Figure 1. The five operational objectives of the programme of work as captured in a diagram (from COP VI/8; reproduced with permission of the CBD Secretariat).

134
primordially is a consortium of five directly implicated individuals. The head of the Department of Invertebrates of the RBINS (JVG) guides at the same time the CBD NFP and the GTI NFP activities. He is supported and criticized in this endeavour by the capacity building coordinator (AF) who links GTI (and other CBD-related) activities with policy, and is in charge of the further development of the programme. One of the two Clearing House Mechanism (CHM) tutors, at the same time IT assistant (AR), provides technical assistance with respect to information exchange, data access and tutoring on databases. All team members benefit from logistic support as provided by the partim secretary. It is obvious that this team can only come to terms with its GTI obligations (e.g. tutoring, access and transparency of collections) through far going staff support of the RBINS and its sister institutions. The structure of the Belgian GTI NFP is represented in Figure 2.
The Belgian approach to taxonomic capacity building
The Belgian GTI NFP fully supports the point of view that rapid access to taxonomic collections and infrastructure can, and will, significantly advance taxonomic research. At the same time it realizes that giving unlimited open access to this information is bound to remain unproductive if, simultaneously, the worlds’ acute shortage of well- trained taxonomists and curators is not dealt with. To reverse this arduous state of play, the RBINS in its capacity of GTI NFP, has signed a specific convention with the Belgian Development Cooperation (DGDC) to, inter alia, install the needed taxonomic and curatorial capacity in developing countries.
Countries eligible for cooperation are considered with the aid of the OECD-DAC List of Aid Recipients as at 1 January 2003. From this list Belgium has further chosen to have privileged relations with 18 countries, the majority of them in Africa (Algeria, Benin, Burundi, D.R. Congo, Mali, Morocco, Mozambique, Niger, Rwanda, Senegal, South Africa, Tanzania and Uganda) and some in South America (Ecuador, Colombia and Peru), Asia (Vietnam) and the Middle East (Palestine). The modus with which Belgium assesses the taxonomic needs of its partners from the developing world is twofold: top-down, or expert-driven, and bottom-up, or demand-driven, but always needs-dependent (Samyn et al., 2004).
The top-down approach: internal research-driven capacity building projects
The top-down tactic validates the extensive expertise of Belgian taxonomists who have long standing research experience in developing countries. Under this approach Belgian experts with knowledge on local taxonomic impediments are funded by the Belgian GTI NFP to carry out biodiversity research in developing countries on the single condition that their research project simultaneously augments standing local taxonomic capacity. As such, activities like
Figure 2. Structure of the Belgian GTI NFP. The GTI NFP also draws extensively on the scientific staff of Belgium’s taxonomic institutions, especially with respects to taxon specific tutoring.

135
training of local actors to identify taxa or to build and manage reference collections useful to the country, stand high on the agenda of the Belgian taxonomists carrying out their research project (Figure 3).
Figure 3. The top-down approach. Belgian experts with vast knowledge on local taxonomic impediments are funded to carry out research-oriented projects with clear capacity building components.
The bottom-up approach: demand-driven, expertise and collection dependent tutoring and access to Belgian collections
The second approach works primordially demand-driven as it is explicitly based on the taxonomic needs expressed by individuals or institutions seeking capacity building support from the Belgian Focal Point to the GTI, either through tutoring in taxonomy or through access to Belgian collections (Figure 4). These needs are captured through an internet-based call for proposals that is widely publicised through active participation in key international meetings (e.g. SBSTTA, COP) and complementary international forums (e.g. BioNET INTERNATIONAL, National GTI Focal Points, CITES workshops, etc.).
Selected candidates are invited to the RBINS, the RMCA, the NBG or other competent Belgian taxonomic research teams where they receive both taxon-specific and non taxon-specific training. The former are provided by experts from the above-mentioned scientific institutions while the latter are provided by Belgian GTI NFP team. Non-taxon-specific training modules include theoretical introductions to the most relevant biological disciplines commonly employed by the contemporary taxonomist (e.g. components and measurement of biodiversity; species and classification concepts; cladistics; evolution; nomenclature), databasing, as well as funding bodies, international conventions and writing in taxonomic research (from idea to taxonomic paper).
Figure 4. The bottom-up approach. Through an online call for proposals taxonomic needs are intercepted; these are resolved by giving general taxonomic training as well as training on the taxonomy of the group of interest.

136
In addition to training in Belgium, applicants can also request the Belgian GTI NFP to organise a short-term regional training course in developing countries. In this case the non-taxon and taxon-specific training is complemented with field trips allowing teaching of sampling and inventory techniques.
Results of the first operational year
The top-down approach
Targeting scientists of the RBINS, the 2004 call for proposals elicited four proposals that were reviewed by a panel of experts and resulted in the funding of three projects in three different continents, with a taxonomic focus on three different zoological groups. Table 1 recapitulates the project titles, the partners and the capacity building components of the three selected projects. The possibility of recurrent one-year funding for these projects is ipso facto not excluded, and will, to a large extent, depend on the achieved results of these projects, as well as on the impact of a next call.
Table 1. The three selected top-down projects from the 2004 call for research oriented taxonomic projects; clear capacity building components determine their strength.
Project title RBINS Partner Capacity Building components
Herpetological species richness and community structure of the Kaieteur National Park Tepui
Vertebrates Section
CEIBA Biological Centre, Guyana
- Training (parataxonomists, taxonomists) - Collections development - Tools production (keys, guides)
Biodiversity assessment in three protected areas in northwest Cambodia
Entomology Department
Sam Veasna Centre for Wildlife Conservation, Cambodia
- Training (parataxonomists, taxonomists) - Collections development - Methodology development
Biodiversity and management of rodents and shrews in eastern D.R. Congo
Vertebrates Section
University of Kisangani, D.R. Congo
- Training (taxonomist) - Collections development - Dissemination of knowledge
The bottom-up approach
In 2004, two calls for proposals were launched (closure: end of March and end of November 2004, respectively). In total 51 proposals were received (11 following the first and 40 following the second call). Belgium’s priority countries and the geographical origin of the received calls are visualised in Figure 5. One third (17 out of 51) of the submitted projects have been selected for support. Table 2 recapitulates the project titles, the partners and the capacity building components of the selected projects.

137
Figure 5. Geographic impact of the Belgian GTI project. Top: countries with which Belgium has privileged relationships; bottom: countries that have submitted a proposal whereby green applies to the first call, blue to the second call; numbers indicate responses higher than one.
Table 2. Bottom-up training projects carried out after the 2004 calls. * indicates that training will be given post April 2005.
Country Gender trainee
Taxon (Phylum/classis/order) Place of visit
Purpose of visit
Comoros Male Echinodermata/Holothuroidea RBINS, RMCA
Training (taxonomy)
Comoros-2 Male Echinodermata/Holothuroidea RBINS, RMCA
Training (collections)
Brazil Male Magnoliopsida (Laurales) NBG Access to Belgian collections
Malaysia (ASEANET)
Male Invertebrates, micro-organisms RBINS, other
Networking
DR Congo Male Arthropoda/Insecta/Lepidoptera RBINS, RMCA
Training (collections, taxonomy)
Cuba Female Arthropoda/Aracnida/Acarina RBINS Training (taxonomy, collections)
Tanzania Female Mollusca/Gastropoda/Pulmonata RBINS Training (taxonomy)
Benin Male Arthropoda/Insecta/Diptera RBINS, RMCA
Training (taxonomy)
Nigeria Male Chordata/Mammalia/Rodentia RBINS, University
Training (taxonomy)
Peru Female Arthropoda/Crustacea/Copepoda RBINS Training (taxonomy)
Morocco* Male Mollusca/Gastropoda/Pulmonata RBINS Training (taxonomy)
Benin* Male Arthropoda/Insecta/Diptera RBINS, RMCA
Training (taxonomy)
Thailand* (5 GTI candidates)
3 Females 2 Males
Rotifera Echinodermata/Holothuroidea
Thailand Training (taxonomy)
Comoros Male Echinodermata/Holothuroidea Comoros Follow-up training

138
To date (April 2005), ten research visitors have received non-taxon-specific as well as taxon-specific training in Belgium. Two additional candidates will benefit from a capacity building visit to Belgium later in 2005 and five other selected candidates (together with some ten, largely externally funded, other candidates) will benefit from a regional training workshop in Thailand, on the taxonomy of Rotifera and Echinodermata.
As a follow-up of training in Belgium, the GTI tutor, assisted by independently funded colleagues from the RBINS and from the RMCA, carried out a visit to the Comoros that requested complementary field-training on Holothuroidea (sea cucumbers).
Conclusions
Even though our project has only been running for little more than one year, we here present some conclusions, which we think helpful for other National GTI Focal Points that strive to implement the operational programme of work of the GTI (See also Figure 1).
Operational objective 1 (taxonomic needs assessment) Our dichotomous system of calls for proposals (top-down and bottom-up) enables an adequate identification of taxonomic needs. The top-down approach has the main advantage that taxonomic impediments can be remedied through a longer term follow-up (one year with possible yearly follow-up); the bottom-up approach has the main merit that it is small-scaled and thus that remediation can be done ad hoc and ad hominem.
Operational objectives 2 (build and maintain human and infrastructural resources for taxonomic research) Through in and ex situ training, we are able to install human capacity at multiple levels (from technical curators to professional taxonomists). Infrastructural resources are installed through synergetic cooperation with other, independently funded, projects. Novel taxonomic data are generated by readily providing taxonomic services (e.g. identification of specimens sent to Belgian experts) and by carrying out study visits to the requesting developing country (Figure 6).
Operational objective 3 (facilitate access to taxonomic information) The Belgian GTI NFP achieves this objective through networking and linkage with digitisation projects that make taxonomic information available to the countries of origin. Moreover, wherever possible, the Belgian GTI Focal Point assists with the building of duplicate reference collections (voucher material spread over Belgian and developing nation institutions) (Figure 7).
Operational objectives 4 & 5 (generate key taxonomic information for implementation of CBD) The Belgian GTI NFP achieves these objectives by facilitating ongoing biodiversity research (e.g. through revision of project proposals), through valorisation of archives (e.g. historical inventory maps of central Africa, pre 1950 scientific papers, bird ringing data) and through active participation in organizations such as CITES.
Figure. 6. Comoros - October 2004. Ex situ and follow-up In situ training is given to Comorese GTI students. To stimulate further taxonomic work, the tutors leave behind a reference collection, didactic material and (separately funded) research equipment.

139
Two main challenges for the immediate future are to: (i) make sure that our trainees stay fully functional and (ii) arm them to become trainers themselves. The answer to the first challenge will largely be dependent on our ability to ensure durable funding for our ex-trainees. In this regard, we are currently putting together an interoperable database with ad hoc funding bodies, with the aim to help provide our former trainees with adequate funding sources. In response to the second challenge, the Belgian GTI NFP is actively researching if a series of peer-reviewed manuals dedicated to capacity building in taxonomy can be realized. The explicit aim of these manuals would be to clear existing taxonomic know-how by giving a detailed account of the knowledge and skills to perform sound taxonomic research.
Our capacity building journey has just begun, but it is reassuring that the road map we employed so far has proven not only liability and feasibility but also efficiency.
Acknowledgments
This project runs with significant financial support from the Directorate-General for Development Cooperation. Implementation of the programme of work would have been impossible without the cooperation of numerous colleagues of the RBINS, the RMCA and the NBG. Dr H. Segers of the Belgian Biodiversity Platform, is acknowledged for his ongoing constructive input to our capacity building project. We thank the CBD Secretariat for its continuous interest in our pragmatic programme.
The work described in this paper was undertaken as part of the 2003-2007 Specific Convention between DGDC and RBINS.
Figure 7. How the Belgian GTI NFP implements the five operational objectives of the programme of work of the GTI. Through linkage with the Belgian CHM awareness of CBD issues is achieved.

140
References
Franklin, A. & J.L. Van Goethem (eds), 2004. Report on Implementation of Programme of Work for the Global Taxonomy Initiative. Royal Belgian Institute of Natural Sciences, Brussels, 25 pp.
Samyn, Y., D. VandenSpiegel, A. Franklin, A. Réveillon, H. Segers & J.L. Van Goethem, 2004. The Belgian focal point to the Global Taxonomy Initiative and its role in strengthening individual and institutional taxonomic capacity for, inter alia, sea cucumbers. In Lovatelli, A. et al. (eds), Advances in sea cucumber aquaculture and management, FAO Fisheries Technical Paper 463, Rome, pp. 415-418.
Glossary
CETAF Consortium of European Taxonomic Facilities
CBD Convention on Biological Diversity
CBD NFP National Focal Point to the Convention on Biological Diversity
CHM Clearing-House Mechanism
CITES Convention on International Trade in Endangered Species of Wild Fauna and Flora
COP Conference of the Parties
DGDC Directorate-General for Development Cooperation
GTI Global Taxonomy Initiative
GTI NFP National Focal Point to the Global Taxonomy Initiative
RBINS Royal Belgian Institute of Natural Sciences, Brussels, Belgium
RMCA Royal Museum for Central Africa, Tervuren, Belgium
NBG National Botanic Garden, Meise, Belgium
SBSTTA Subsidiary Body on Scientific Technical and Technological Advice
141
The management of banana (Musa spp.) genetic resources at the IPGRI/INIBAP gene bank: the conservation and documentation status.
Van den houwe, I.1, B. Panis2, E. Arnaud3, R. Markham3 & R. Swennen2
1 INIBAP Musa Germplasm Transit Centre (ITC), c/o KULeuven, Kasteelpark Arenberg 13, 3001 Leuven, Belgium. [email protected]
2 KULeuven, Laboratory for Tropical Crop Improvement, Kasteelpark Arenberg 13, 3001 Leuven, Belgium. 3 INIBAP, Parc Scientifique Agropolis II, 34397 Montpellier, Cedex 5, France.
Keywords: active and base collection, in vitro conservation, medium term storage, cryopreservation, data management, MGIS
Abstract
The international banana germplasm collection is managed by the IPGRI/INIBAP Transit Centre in Belgium since 1985. This unique collection, placed under the auspices of FAO in 1994, consists of approximately 1200 accessions of wild, cultivated and improved bananas, introduced from 44 countries in the world. Samples of these accessions are permanently maintained in vitro as proliferating shoot cultures under slow growth conditions at low temperature (16°C) and reduced light intensity (25µmol/m²/s). Incoming germplasm undergoes a standardized indexing process for five virus diseases in collaboration with 3 indexing centres (Australia, France and South Africa) and pathogen-free accessions are made freely available for international distribution. Throughout the last five years, over 25,000 samples of germplasm have been delivered worldwide to hundreds of institutes and individuals involved in development projects with farmers, for various research activities or to underpin specific gene bank activities such as cytological studies and virus eradication research. Currently, also a long-term base collection is being established, using a cryopreservation protocol developed at the Laboratory of Tropical Crop Improvement, KULeuven, Belgium. At present, more then one quarter of the entire collection is safely stored in liquid nitrogen (-196°C). Evidently, the effective management and use of this unique collection strongly depends on its documentation status. To facilitate data maintenance and processing relevant for the day-to-day activities of the gene bank, a tailored-made information system using bar-codes has been put in place recently. All passport data, and available characterization and evaluation data are documented in the INIBAP’s Musa Germplasm Information System (MGIS). This decentralized system contains standardized information on banana varieties managed in 18 banana gene banks around the world and is readily accessible for users ( mgis.grinfo.net or mgis.inibap.org). The data of the INIBAP Transit Centre, which are part of the MGIS database, are also available through SINGER (System-Wide Information Network on Genetic Resources), an on-line database containing information on genetic resources held by the CGIAR Centres ( singer.cgiar.org).
Introduction
Banana (Musa spp.) is one of the most ancient fruit crops known and used by man. The genus originated in South-East Asia and was domesticated first in Papua New Guinea, probably

142
more than 7000 years ago (Denham et al., 2003). Later on the crop was spread to the African continent (De Langhe, 1995) where two secondary centres of landrace diversity developed, the plantains (AAB) evolved in West- and Central-Africa and the highland bananas (AAA-EA) in East-Africa.
Today, banana is grown in every humid tropical and many sub-tropical regions and ranks fourth as the world's most valuable food crop, behind rice, wheat and maize (INIBAP, 2005). Almost 95 million metric tons (MT) of which 30 million MT plantains, are harvested annually around the world (INIBAP, 2004). The fruit crop provides a staple food source for 400 million people and reaches its greatest importance in parts of East-Africa where annual consumption is over 200kg/capita (FAOSTAT data, 2005). About 90% of the total production takes place on small-scale farms and is used for home consumption or goes to domestic markets (INIBAP, 2004). The remaining 10%, consisting of a few dessert banana types only, is produced on commercial plantations in Latin-America and the Caribbean mainly, and enters the world trade (INIBAP, 2005).
Recognizing the importance of bananas as a staple food and a vital source of income for small growers in several developing countries, the International Network for the Improvement of Banana and Plantain (INIBAP), the banana branch of the IPGRI (International Institute on Plant Genetic Resources) ‘Commodities for Livelihoods’ Programme started in 1985 coordinating and supporting the international effort for collecting, preserving, documenting and enhancing the use of banana genetic resources.
The INIBAP Musa gene bank
The international Musa germplasm collection
Since 20 years, INIBAP holds the most comprehensive collection of banana in the world. The gene bank, managed at the INIBAP Transit Centre (ITC), housed at the Laboratory of Tropical Crop Improvement at KULeuven, Belgium, counts almost 1200 accessions, introduced from 44 countries in the world (Table 1). The collection covers all categories of cultivated materials, a wide range of wild relatives, and elite germplasm produced by breeding programmes worldwide. After the establishment of the INIBAP Transit Centre (ITC) in 1985, major banana field gene banks started sending duplicate samples of their accessions to Leuven for back-up storage. In the late 80s, IPGRI/INIBAP took the responsibility of coordinating collecting missions in unexplored areas of diversity in order to broaden the exploitable genetic base. Within the framework of four missions jointly executed by IPGRI and QDPI (Queensland Department of Primary Industries) that took place in Papua New Guinea, more than 300 unique accessions were collected (Sharrock, 1990). Once a specimen has been collected, it is conserved by a national institution in the country of origin and duplicates of the samples are deposited at the IPGRI/INIBAP gene bank. In the 90s more original materials were collected in Vietnam, Indonesia, China, India, Tanzania and Oman and they are progressively included in the global Musa collection. The collection was also further enriched with a range of improved cultivars produced by several breeding programmes in the world (Table 1).
In 1994, the collection was placed under the auspices of FAO within the International Network of ex situ Collections ensuring the long term storage of holdings and unrestricted access by the world community.

143
Table 1. Holdings of the international in vitro collection of banana and their origin or donor source.
Origin/Donor Number of
accessions Genotypes
Papua New Guinea (1989-1990) 278 diploid wild/cultivated forms
Collecting Missions Vietnam (1996) 43 wild/cultivated forms
Tanzania (2002) 21 East African highland bananas
Centre de Coopération Internationale en Recherche Agronomique pour le Développement (CIRAD), Guadeloupe and France (1987-1990)
233 wild/cultivated forms
Centro Agronómico Tropical de Investigación y Enseñanza (CATIE), Costa Rica (1986-1989)
23 cultivated forms
Collections Fundación Hondureña de Investigación Agrícola (FHIA), Honduras (1988)
126 wild/cultivated forms
Institut de Recherches Agronomique et Zootechnique (IRAZ), Burundi (1987)
54 East African highland bananas
International Institute of Tropical Agriculture (IITA), Nigeria (1986-1987)
115 AAB-plantains
Centre Africain de Recherche sur Bananiers et Plantains (CARBAP), Cameroon Centre de Coopération Internationale en Recherche Agronomique pour le Développement (CIRAD), Guadeloupe Empresa Brasileira de Pesquisa Agropecuaria (EMBRAPA), Brazil Fundación Hondureña de Investigación Agrícola (FHIA), Honduras Instituto Nacional de Investigaciones en Vinades Tropicales (INIVIT), Cuba International Atomic and Energy Agency (IAEA), Austria International Institute of Tropical Agriculture (IITA), Nigeria
Breeding programmes
Taiwan Banana Research Institute (TBRI), Taiwan
114 improved cultivars
Others (other collections, botanical gardens, private persons,...)
168 wild/cultivated forms
Operation of the banana gene bank
New accessions are usually received at the ITC as small samples of in vitro cultures, classical vegetative propagation material (young suckers) or as seeds. Initially, from each new sample
144
an aseptic shoot culture is established. A selection of the most vigorous one from which a sub-clone of seven cultures will be established, is made. A set of five cultures is sent to an INIBAP Virus Indexing Centre (VIC) at CIRAD (Centre de coopération internationale en recherche agronomique pour le développement), France, QDPI, Australia or PPRI (Plant Protection Research Institute), South Africa, where they are inspected for the presence of the five major banana viruses, CMV (cucumber mosaic cucumovirus), BBTV (banana bunchy top virus), BSV (banana streak virus), BanMMV (banana mild mosaic virus) and BBrMV (banana bract mosaic virus), following standardized indexing procedures as proposed in the FAO/IPGRI Technical Guidelines for the Safe movement of Germplasm (Diekmann & Putter, 1996). From the other two cultures, a set of 20 replicates is produced for storage under medium term storage conditions in the active collection. If the test results are negative after inspection at the VICs, the accession is cleared for distribution. In case viruses are detected, the accession is subjected to virus therapy (Helliot et al., 2003; 2004) and re- indexed. A virus-free line is maintained in the active collection to meet requests from clients and a subset of cultures is prepared for storage in liquid nitrogen in the base collection. A second subset of materials is regenerated under greenhouse conditions for harvesting leaf samples that are processed in a DNA/lyophilized leaf bank. The banked leaf materials serve as voucher for the germplasm stored in the active and base collection and samples are made available to users for research into gene discovery and function, marker development and detailed genotypic characterisation.
The establishment of the INIBAP Transit Centre, with the in vitro collection, in a non-banana growing country, linked to the INIBAP virus indexing centres activity, greatly facilitated the international exchange of banana germplasm over the past 20 years. Currently, 62% of all accessions in the active collection is certified as virus-free and has 20 multiple healthy shoot cultures that are readily accessible for distribution. Samples are made freely available so that useful diversity reaches as many researchers and eventually farmers in the developing world as possible. Standard shipments of germplasm usually contain five separate in vitro cultures -multiple shoot clusters or rooted plants- of each requested accession.
Since 1985, about 200 institutes in 88 countries worldwide benefited from this service. In the last five years only, over 25,000 samples of germplasm and associated information have been delivered worldwide to users involved in development projects with farmers, for various basic research activities, or to underpin specific gene bank activities such as cytological studies and virus eradication research.
Conservation of Musa diversity
Ex situ conservation approaches
Bananas are fast-growing herbaceous perennials arising from underground rhizomes. The wild plants that are classified as two species, Musa acuminata (AA) and Musa balbisiana (BB), set seed. These species gave origin to the common cultivated types which are characterized by female sterility, parthenocarpy and various levels of male sterility. The seedless clones which can be diploid, triploid or tetraploid, are maintained exclusively through vegetative propagation by suckers.
Since the application of seed storage in a crop such as banana is limited to the wild relatives, banana genetic resources are traditionally preserved ex situ in field collections. The conservation of germplasm in these live gene banks is most suitable for characterization and breeding purposes. However, it involves tremendous risks of exposure of valuable and unique germplasm to biotic threats and environmental stresses. Moreover, such collections require

145
regular replanting, large amounts of land space and labour input. In the early ‘80s, the implementation of tissue culture techniques opened new perspectives for a complementary conservation approach for vegetatively propagated crops, including banana. The application of in vitro storage allows conservation of germplasm in a protected environment and offers the added advantages of disease elimination, aseptic plant production, safe and easy international exchange of plant materials and lower conservation costs. Nonetheless, maintaining the material as shoot tip or meristem cultures remains labour intensive and involves the risk of losing valuable germplasm through accidental contamination of cultures and human error. Another and major impediment of storage of tissue cultures under slow growth conditions is the possibility of genetic instability due to somaclonal variation. Preservation of in vitro tissues at cryogenic temperatures (-196°C) whereby all metabolic processes and cell divisions are arrested, is considered as the only suitable alternative that can ensure the long term security of stored germplasm. The method also has the advantage that very limited space is required, the material is protected from contamination and very little maintenance is needed (Sharrock & Engels, 1997).
Medium and long term storage of the global Musa collection
INIBAP opted to preserve the collection at the ITC under in vitro medium term storage conditions with a long term back-up in liquid nitrogen. Each accession is maintained under the form of 20 proliferating shoot cultures all grown on a semi-solid Murashige and Skoog-based culture medium supplemented with 30g/l sucrose and two plant growth regulators, a cytokinin, BAP (10µM) and auxin, IAA (1µM). In order to prolong the culture life of the stored accessions, slow growth procedures are adopted. The cultures are stored at low ambient temperature (16°C) and reduced light conditions (25µM/m2 /s), requiring subculturing every 4-22 months depending on the genotypic constitution of the accession (Van den houwe et al., 1995).
Of greatest importance for the effective management of the active collection is the periodic monitoring of stored accessions to determine and guarantee the quality of the stored germplasm. Cultures are checked at regular intervals for their general performance, tested for the presence of endophytic bacteria (Van den houwe & Swennen, 2000), and accessions are timely rejuvenated in vitro and regenerated in the field to assess their true-to-typeness (INIBAP, 2002). However, despite all preventive measures to keep the germplasm in optimal conditions, losses of plant material or of its genetic integrity inevitably occur. Therefore, the development of an efficient and reliable protocol for cryopreservation of banana is essential for long term storage of its genetic resources.
At the Laboratory of Tropical Crop Improvement research on cryostorage of banana has been conducted for many years, resulting in the development of three cryogenic techniques that allow safe and stable preservation of the entire collection (Panis & Thinh, 2001). The first two methods use highly proliferating meristem clusters that are pre-cultured on sucrose (0.4M) enriched medium during 2 weeks. Groups of pre-cultured meristem clumps are either directly frozen (simple freezing method, Panis et al. 2002), or subjected to a vitrification treatment i.e. freezing without lethal ice crystal formation (vitrification method, Panis & Thinh, 2001) prior to storage in liquid nitrogen. It was observed that post-cryopreservation viability rates for the simple freezing method depend on the genotype and vary from 0-4% for Musa acuminata and AAA-highland bananas (AAA-EA) over 19-25% for AAA, AAB dessert bananas and AAB plantains (AABpl) to 53% for ABB cooking bananas (Figure 1). Viability rates for the vitrification method appeared to be relatively high compared to those of the first method. Post-thaw recovery rates for ABB clones remain 50% whereas increased recovery growth rates are obtained for AAB dessert bananas, AAB plantains and AAA dessert bananas (41-

146
51%). Viability rates for the AAA-highland bananas and Musa acuminata accessions however remain very low (0-30%). A third method involves vitrification of tiny individual meristems. One millimeter sized shoot-tips excised from rooted in vitro plants are excised and frozen with the droplet vitrification technique. This results in ultra rapid freezing and thawing rates that proved to be essential for high and reproducible post-thaw regeneration rates. When this protocol was applied to 56 accessions belonging to 7 different genomic groups of Musa spp., an average of 52.9% post-thaw regeneration was obtained. These results were relatively genotype independent. Only wild diploid Musa acuminata accessions proved to be somewhat more recalcitrant towards cryopreservation though an acceptable average regeneration rate of 39% was still obtained (Panis et al., 2005) (Figure 1). This method, although more than 2 times more laborious compared to the previous ones, offers a good alternative for those cultivars responding unfavourably towards the freezing of highly proliferating meristem cluster.
0
10
20
30
40
50
60
70
80
90
100
AB
B
AA
Bp
l
AA
B
AA
A
AA
A-E
A
AA
M.
acu
min
ata
Genomic group
Po
st-
tha
w r
eg
en
era
tio
n (
%)
Simple freezing (meristem clumps)
Vitrification (meristem clumps)
Vitrification (apical meristems)
Figure 1. Average post-thaw regeneration rates of banana accessions grouped according their genomic constitution after the application of three different cryopreservation protocols.
The combination of the three techniques is now being used on a routine basis to cryopreserve the whole collection and resulted in the safe storage of 330 banana accessions belonging to the various genomic groups so far.
Documentation of banana genetic resources
Documentation status of the conserved banana germplasm
Proper documentation of germplasm accessions is essential not only to facilitate their conservation and understand the diversity but also to allow efficient utilization of a collection. It is assumed that the majority of the diversity within the genus Musa is represented by the numerous field and in vitro collections but the uneven quality and accuracy of the related documentation is a serious drawback for its efficient use.

147
Many Musa collections, including the ITC-collection, have not been systematically documented. For the major part of preserved clones, passport data and only limited characterization and evaluation data are available. In an effort to upgrade the documentation status of the global Musa collection, samples of accessions are regenerated and grown in the field along-side the reference plant for taxonomic verification. Plants are systematically being described using the IPGRI morpho-taxonomical descriptors (IPGRI-INIBAP/CIRAD, 1996). Recently, the ploidy level of all accessions in the ITC collection was determined using flow cytometric (Dolezel et al, 1997) at the Institute of Experimental Botany in Czech Republic and a variety of genetic markers (STMS, RFLP and RAPD) are being used to conduct taxonomic studies and for gaining better insight in the organization of genetic diversity (Ford-Lloyd et al., 1997). The sequence-tagged microsatellite sites technique, for instance, has confirmed the group and sub-group classifications of clones of M. acuminata, M. balbisiana and Australimusa. This work is conducted by CIRAD-FLHOR in Guadeloupe where the technique has been applied to more than 300 accessions so far (INIBAP, 1999). Furthermore, information on disease resistance and agronomic performance of improved hybrids and natural germplasm in the collection is systematically generated through INIBAP's International Musa Testing Program (IMTP) (Orjeda, 2000).
Managing and sharing Musa germplasm information
Musa Gene Bank Management System
In order to facilitate and enhance the effectiveness of the day-to-day management of the INIBAP Transit Centre gene bank, an in-house developed searchable database system, Musa Gene Bank Management System (MGBMS), has been implemented recently. The application, developed in SQL 7.0 and Visual Basic 6.0, runs on Access 8.0 and is capable of processing all data at the accession level that are generated through the different gene bank operations, as well as related information. Reflecting the basic principles of gene bank management, the module attributes an identifier which is the unique gene bank accession ID number, called ITC code, assigned to the accession upon acquisition. This ID number is used by the system to link the passport data of the given accession, its designation status and taxonomic information, as well as additional information such as local names or uses of the accession, health status testing data and the availability of the accession for distribution. The system also keeps record of gene bank operation data including the storage location details, stocks and monitoring data of the accession in the active, base and lyophilized leaf collection and it manages germplasm orders and shipment processing data and contacts information.
As part of the MGBMS, bar-coding has been introduced in the in vitro gene bank to ensure accurate labelling of accessions. The use of a mobile device with integrated bar-code reader that communicates with the central database allows quick collection and retrieval of accession information on site (Figure 2).
Figure 2. Managing the inventory of the active in vitro collection at the INIBAP gene bank using a barcode based system.

148
Musa Germplasm Information System
Scientists are unable to use crop germplasm unless and until they have easy access to detailed and accurate information on each accession. It is known that available information on banana genetic resources is scattered among numerous national and regional field collections or associated institutes. Moreover, as the quality and completeness of the available information varies widely among and within collections, its usefulness is limited.
In 1997, INIBAP laid the basis for a global information system for Musa through the release of MGIS (Musa Germplasm Information System) (Figure 3). The aim of the system is to enhance knowledge on Musa diversity, to help rationalizing conservation and to improve the use of banana genetic resources through a facilitated access to comprehensive information.
Figure 3. Structure of the Musa germplasm Information System (MGIS) and information flow through the system.
MGIS is based on a network of gene bank curators who have the primary responsibility of providing and entering data, following a standard format provided by the ‘Descriptors list for bananas’ (IPGRI-INIBAP/CIRAD, 1996). During specific training workshops, gene bank curators receive the MGIS CD-ROM to install locally an information management system for their proper collection. A tool is included in the system to send updated data through small binary files to IPGRI/INIBAP in Montpellier where all data are compiled, verified and fed into the central database.
Today, the MGIS database contains key information, including passport data, botanical classification, morpho-taxonomic descriptions and characteristics such as agronomic traits, disease resistance, stress tolerance, biochemical or molecular genetic markers, and plant photographs as well as GIS information on 5188 accessions managed in 18 banana collections around the world making it the most extensive source of information on banana genetic

149
resources. As more accessions will be included in MGIS, a more complete picture of the diversity managed in ex situ collections will emerge, based upon a broad range of standard information.
The database is publicly accessible through the internet ( mgis.inibap.org or mgis.grinfo.net) and a PC-based version of MGIS containing updated collection information together with a stand-alone menu-driven software package is also made available on CD-ROM, upon request.
The global database can be queried on the identity, origin, characteristics and distribution of individual accessions in the collections. This allows curators of the participating institutions worldwide to share and compare their data. The database is also particularly helpful for various germplasm users namely breeders, researchers and farmer communities, in locating alternative sources of banana germplasm and identifying the most appropriate accessions with particular traits of interest.
From the data recorded in MGIS, two volumes of Musalogue, a catalogue of Musa germplasm, have been published. The first volume describes the germplasm collected in Papua New Guinea (Arnaud & Horry, 1997). The second one presents the diversity in the genus Musa and contains the main morpho-taxonomic characteristics and photographs of wild and cultivated bananas in the various sections, groups and the most important subgroups (Daniells et al., 2001).
IPGRI/INIBAP also provides information on the global Musa collection to SINGER, the System-wide Information Network for Genetic Resources of the CGIAR (Consultative Group on International Agricultural Research) linking the genetic resources databases of all CGIAR centres. These centres hold more than half a million samples of crop, forage and tree diversity which is of vital importance for food security and agricultural development. The SINGER database is accessible via Internet at singer.grinfo.net.
References
Arnaud, E. & J.P. Horry, 1997. Musalogue: a catalogue of Musa germplasm. Papua New Guinea collecting missions, 1988-1989. International Network for the Improvement of Banana and Plantain, Montpellier, France.
Daniells, J., C. Jenny, D. Karamura & K. Tomekpe, 2001. Musalogue: a catalogue of Musa germplasm. Diversity in the genus Musa. In Arnaud, E. & S. Sharrock (eds), International Network for the Improvement of Banana and Plantain, Montpellier, France.
De Langhe, E, 1995. Banana and Plantain: The earliest fruit crops? INIBAP Annual Report 1995, INIBAP, Montpellier, France: 6-8.
Denham, T., S.G. Haberle, C. Lentfer, R. Fullagar, J. Field, N. Porch, M. Therin, B. Winsborough & J. Golson, 2003. Multi-disciplinary evidence for the origins of agriculture from 6950-6440 Cal BP at Kuk Swamp in the Highlands of New Guinea. Science 301: 189-193.
Diekmann, M. & C.A.J. Putter, 1996. FAO/IPGRI Technical guidelines for the safe movement of germplasm. No. 15. Musa (2nd edition). Food and Agriculture Organisation of the United Nations, Rome/International Plant Genetic Resources Institute, Rome. www.inibap.org/pdf/IN960084_en.pdf

150
Dolezel, J., M.A. Lysak, I. Van den houwe, M. Dolezelova & N. Roux, 1997. Use of flow cytometry for rapid ploidy determination in Musa species. INFOMUSA 6(1): 6-9.
FAOSTAT data, 2005. faostat.fao.org/faostat/collections?subset=agriculture.
Ford-Lloyd, B.V., D.J.W. Kaemmer, G.J.W. Kahl & P.J.L. Lagoda, 1997. Focus paper II: Molecular marker assisted analysis of the Musa genome complex. In: Networking Banana and Plantain: INIBAP Annual Report 1998, INIBAP, Montpellier, France, 60.
Helliot, B., B. Panis, E. Frison, E. Declercq, R. Swennen, P. Lepoivre & J. Neyts, 2003. The acyclic nucleoside phosphonate analogues, adefovir, tenofovir and PMEDAP, efficiently eliminate banana streak virus from banana (Musa spp.). Antiviral Research 59: 121-126.
Helliot, B., B. Panis, R. Hernandez, R. Swennen, P. Lepoivre & E. Frison, 2004. Development of in vitro techniques for the elimination of cucumber mosaic virus from banana (Musa spp.). In Mohan Jain, S. & R. Swennen (eds), Banana improvement: cellular, molecular biology, and induced mutations. Proceedings of a meeting, 24-28 September 2001, Leuven, Belgium, 183-189.
INIBAP, 1999. Networking Banana and Plantain: INIBAP Annual Report 1998. INIBAP, Montpellier, France, 64.
INIBAP, 2002. Networking Banana and Plantain: INIBAP Annual Report 2001. International Network for the Improvement of Banana and Plantain, Montpellier, France.
INIBAP, 2004. Banana – food and wealth. www.inibap.org/pdf/food_en.pdf
INIBAP, 2005. www.inibap.org/index.php?page=home->bp->importance&lang=en
IPGRI-INIBAP/CIRAD, 1996. Descriptors for Banana (Musa spp.). International Plant Genetic Resources Institute, Rome, Italy/International Network for the Improvement of Banana and Plantain, Montpellier, France/ Centre de Coopération Internationale en Recherche Agronomique pour le Développement, Montpellier, France. www.inibap.org/pdf/descriptors_en.pdf
Orjeda, G., 2000. Evaluating bananas: a global partnership. Results of IMTP Phase II. INIBAP, Montpellier, France.
Panis, B. & N.T. Thinh, 2001. Cryopreservation of Musa germplasm. INIBAP Technical Guidelines No. 5. INIBAP, Montpellier, France. www.inibap.org/pdf/IN020224_en.pdf
Panis, B., H. Strosse, S. Van Den Hende & R. Swennen, 2002. Sucrose preculture to simplify cryopreservation of banana meristem cultures, CryoLetters 23: 375-384.
Panis, B., B. Piette & R. Swennen R., 2005. Droplet vitrification of apical meristems: a cryopreservation protocol applicable to all Musaceae. Plant Science 168:45-55.
Sharrock, S, 1990. Collecting Musa in Papua New Guinea. In Jarret, R.L. (ed.). Identification of Genetic Diversity in the Genus Musa: Proceedings of an international workshop, 5-10 September 1988, Los Baños, Philippines, 140-157.
Sharrock, S. & J. Engels, 1997. Focus paper I: Complementary conservation. In: Networking Banana and Plantain: INIBAP Annual Report 1997. INIBAP, Montpellier, France, 60.
Van den houwe, I., K. De Smet, H. Tézenas du Montcel & R. Swennen, 1995. Variability in storage potential of banana shoot cultures under medium term storage conditions. Plant Cell, Tissue and Organ Culture 42: 269-274.
Van den houwe, I. & R. Swennen, 2000. Characterization and control of bacterial contaminants in in vitro cultures of banana (Musa spp.). Acta Horticulturae 530: 69-79.
151
Biodiversity at the Ghent University Zoology Museum: potential and implementation
Verschelde, D.1 & D. Adriaens1, 2
1 Zoology Museum, Ghent University, K.L. Ledeganckstraat 35, 9000 Gent. [email protected]; www.zoologymuseum.ugent.be
2 Evolutionary Morphology of Vertebrates, Ghent University, K.L. Ledeganckstraat 35, 9000 Gent. [email protected]
Abstract
The Ghent University Zoology Museum has since its foundation in 1817 continuously invested in the expansion and management of its collection using a minimal budget. The collection comprises both a survey of the biodiversity of the animal kingdom, ranging from protozoans to large mammals, and a very important collection for comparative anatomy of vertebrates. The mission statement of the museum has since been collecting and managing these two collections, and applying it for educational purposes, i.e. during lectures for academic students. The last decade however, substantial efforts have been made to stimulate the access of the collection to the general public.
The last eight years, efforts have been going on to digitally archive the collection, which comprises an estimate of far over 20,000 specimens. Till 2003, only a subset of this collection has been archived, due to limited staff and funding. By then 8,610 specimens were archived digitally. This information has since been made accessible worldwide through the webpage of the museum ( www.zoologymuseum.ugent.be), but recently the visibility has been much improved thanks to the Global Biodiversity Information Facility (GBIF – www.gbif.net). Additionally, a recent funding by the Belgian node (Belgian Biodiversity Platform ( www.biodiversity.be) – ‘BeBIF’), allowed us to increase the archived collection with 5,901 records only in about one month time (1,193 insects, 2,996 coleopterans, 666 birds and bird anatomy specimens, 1,046 skulls and other anatomical specimens of mammals). This clearly demonstrates that an important biodiversity collection such as the Ghent University Zoology Museum, substantially benefits and largely depends on external funding, in order to allow efficient archiving and thus providing useful biodiversity data that can be accessed by taxonomists or other scientists.
Introduction
The Ghent University Zoology Museum is but an itsy-bitsy spider among natural historical giants, such as the Royal Belgian Institute for Natural Sciences in Brussels, the Africa Museum in Tervuren, the Botanical Garden in Meise,… but still it contains a quite impressive and historically important collection.
The historical background of Zoology Museum at the Ghent University goes back to 1817 when it was founded at the same time of the foundation of the Ghent University itself. A Dutch law of 1816 dictated that any academic institution needed to collect material – in this case specimens – to illustrate the theoretical courses (Verschelde, 2003). For this purpose,

152
funds were made available at the first ‘annual meeting’ of 1817. At the annual meeting of 1818 a professor reported that a major collection of zoological specimens had been purchased (partim collection of Themminck), its only aim being to illustrate the zoology courses and to be studied by scientific personnel and students; miserly hidden from the public eye.
Concerning zoology in general, there were – during the first 50 years – two different collections linked to two courses: Comparative Anatomy and Zoology, given by two different professors. In 1870 these two courses – Comparative Anatomy coming from Prof. Poelman and Zoology coming from Prof. Boddaert (Willem, 1913) – were appointed to one, newly nominated, professor: Prof. Dr. Felix Plateau. Prof. Plateau can therefore be regarded as the first director of the museum as it still stands today: a combination of two previously separate collections.
To locate the Ghent University Zoology Museum in the background of museums, we would have to describe our museum as a small natural history collection but at the same time as a large university collection.
Contemporary efforts
Compared to the original objective we have clearly been broadening our aims. Our mission statement – among others – involves the management of specimens spanning a wide range of zoological diversity, creating public awareness to biodiversity and facilitating international accessibility of the collection.
Wanting to present an overview of the animal kingdom, we try to fill in any gaps in our collection. Students are involved in the preparation and assembling of skeletons. Old collection items with special cultural and/or historical value are restored and highlighted.
The general public is tantalized with special exhibitions and guided tours where science is mingled with anecdotal – often even humorous – and historical information. We organize quizzes, tasting specials for families and practical courses for pupils. We even visit kindergarten classes. All of this is done with the objective of achieving the promotion of biodiversity to the general public.
Opening ones collections and museum to an international public requires a good, contemporary inventory. The backbone to this, is to archive the collection electronically. The curator started this in 1997 with a self constructed – Microsoft Access© based – inventory database shell. This inventory could be viewed on the museum’s website, but in a non-user-friendly way. Later, by February 2004, with the help of the Belgian Biodiversity Information Facility (‘BeBIF’, now integrated in the Belgian Biodiversity Platform), a major step was taken when the inventory was made accessible to the world through GBIF.
Collection overview
Our museum can be regarded to have four major collections. These are: the invertebrate collection (400m²; 11 phyla; estimated to have over 25,000 specimens), the vertebrate collection (1,063m²; all major groups; estimated to have over 7,000 specimens), the nematode (type) collection (>4,000 slides; including type specimens), and the comparative anatomy of vertebrates collection (301m²; >3,000 estimated specimens).
We should not only focus on the scientific value of an university collection: such a collection almost always has certain historical value too. As noted above, the Zoology Museum has a history that goes back as far as the Ghent university itself. It has a unique and historical collection of comparative anatomy of vertebrates, in which you can find the organs of

153
different vertebrate groups for comparison next to one another. Most of them date from between 1842 and 1900, when subsequently two professors – Prof. Poelman and Prof. Plateau – made it their life’s achievement. Among many others, we have a dissected and dried Green turtle (Chelonia mydas) on which a technician worked, in the 1870s, for six months to dissect, reveal and prepare its blood vessels. We have famous zoo animals, such as the locally legendary elephant ‘Betsie’ of the Ghent zoo (1853-1904) – which died during the winter of 1878 and was praised in public songs – of which we still have some vertebrae. We had famous directors, such as Felix Plateau (1841-1911, son of Joseph Plateau, who was the inventor of the cinema). We have irreplaceable items, such as a collection of wax models of Ziegler (1870s, mainly embryology), and extinct animals: e.g. a Tasmanian wolf, Thylacinus cynocephalus (Harris, 1808), UGMD 51124 and a Javanese Wattled Lapwing, Vanellus macropterus, UGMD 51963.
Archiving efforts in the past
All previous efforts, starting from 1997, were compromised by a couple of serious problems: man power and facilities problems. Concerning man power, we have to rely on one curator, whose efforts have been strengthened by contributions of students – either during practical courses or by student volunteers – and by voluntary laymen (Figure 1). Our facilities problems concern a very small budget, small infrastructure and computer shortage.
By the end of 2003, the following number of specimens were archived electronically: 7,723 invertebrate specimens; 6,726 vertebrates (+ comparative anatomy) specimens; and 1,820 nematode slides (Figure 1). › only about 40% of total estimated collection was archived electronically.
Figure 1. Overview of archiving efforts.
Results of 2004
During 2004, major efforts – on three different levels – were done to increase the number of entrees (Figure 1).
Volunteers and curator: In the nematode collection 1,200 slides were added (total: 1,820 nematode slides).
Students and curator: during practical courses, some 558 specimens of butterflies, rodents and bats were added to the inventory.
Some examples:
- Tarsius spectrum UGMD 51923
- Daubentonia madagascariensis UGMD 55282
- Sarcophilus harissi UGMD 51123
- Pteropus edwardsii UGMD 54838
The main contribution to the increase of inventoried specimens was made possible thanks to funds and computers of the Belgian Biodiversity Information Facility (‘BeBIF’). Four job
0
5000
10000
15000
20000
25000
Invertebrates Vertebrates +
Comp. Anat.
Nematoda
1998199920002001200220032004Estimated total

154
students could be paid to do a full time job in archiving 1,193 insects (mainly lepidopterans), 2,996 coleopterans, 666 birds and bird anatomy specimens, and 1,046 skulls and other anatomical specimens of mammals. › BeBIF funding allowed archiving of 5,901 specimens in one month!
Hostie collection of lepidopterans
1,193 specimens (total: 1,504 lepidopteran specimens)
Some examples:
- Zygaena filipendula UGMD 3166
- Agrius convulvi UGMD 3225
- Smerinthys ocellata UGMD 3215
- Parnassius apollo UGMD 4586
Goetghebuer collection of coleopterans
2,996 specimens (total: 3,000 coleopteran specimens)
Smaller specimens: up to 600 specimens in one insect box
Collection of bird specimens and anatomy
666 specimens (total: 2,305 bird specimens)
Some examples:
- Pharomachrus mocinno UGMD 55060
- Merops leschenaulti UGMD 55129
- Indicator indicator UGMD 54927
- Pteroglossus aracari UGMD 55046
Skulls and mammalian organs
1,046 specimens
Some examples:
- Orycteropus afer UGMD 55835
- Tachyglossus aculeatus UGMD 56004
- Homo sapiens UGMD 56011
- Panthera leo UGMD 56035
But not only did we work on the number of inventoried specimens. As stated above, we also optimized the accessibility of collection data, by providing it through to GBIF with the assist of BeBIF.
- It is now possible to have search facilities.
- Accessible since February 2004. By the end of 2004 more than 3,200 searches from countries all over the world were made.

155
Future plans
Surely, we (curator, students and volunteers) will continue our efforts to archive the collection specimens digitally; but we are also planning to add digital imagery. We could for example add anatomical information for educational purposes, both academic and other. (DigiCAT – “digital atlas of comparative anatomy of teleosts”).
We will improve the electronic accessibility further by expanding the database management:
- Create a dynamic based website
- Coupling the inventory to the NeMys database ( www.nemys.ugent.be)
- Continuing data provision towards GBIF
Acknowledgements
We would like to thank all our:
- Voluntary laymen: Mrs. Nelly Matheve, Mrs. Francine Ronse, Mrs. Monique Christiaens.
- Student volunteers: Hanne, Annelies, Thomas, Jens, Niels, Willem, Pieter
- Job students: Hannelore Scheirs, Annelies Hallaert, Thomas Maerten, Pieter Provoost.
All of this wouldn’t have been possible without the funding of
- Ghent University
- Faculty of Science (UGent)
- Belgian Biodiversity Information Facility (‘BeBIF’)
- Belgian Science Policy
References
Verschelde, D., 2003. The Ghent University Zoology Museum: a struggle for life. UMAC 2003 conference proceedings: 99-102.
Willem, V., 1913. Felix Plateau. Liber Memoralis, tome II: 221-232.

156
Biodiversity of cucurbits consumed as sauce thickener in Ivory Coast: a capital resource for the economic prosperity of rural women
Zoro Bi, I A.1, K K. Koffi1, Y. Djè1, M. Malice2 & J.-P. Baudoin2
1 Université d’Abobo-Adjamé, UFR des Sciences de la Nature 02 BP 801, Abidjan 02, Ivory Coast. [email protected]
2 Unité de Phytotechnie tropicale et d’Horticulture, Faculté Universitaire des Sciences agronomiques de Gembloux. Passage des Déportés, 2. B-5030 Gembloux, Belgique.
Keywords: Cucurbitaceae, biodiversity, Ivory Coast, rural women, edible seeds, Cucurbits
Abstract
A survey of the biodiversity of cucurbit species consumed as sauce thickener in Ivory Coast was carried out in the framework of a collaborative research project involving Gembloux Agricultural University (FUSAGx, Belgium) and the University of Abobo-Adjamé (UAA, Ivory Coast). Collecting missions from different ecological regions of the country resulted in a germplasm collection of 176 plant introduction accessions composed of 13 cultivars in five species and genera. These species are Citrullus lanatus var. citroides, Cucumeropsis mannii, Cucumis melo var. agrestis, Cucurbita pepo and Lagenaria siceraria. The most common species is C. lanatus var. citroides. There was a moderate diversity within species (2 to 4 open-pollinated cultivars per species) probably due to the farmer’s selection process that reduces the genetic richness. All these cucurbits are mostly grown by women as minor plants intercropped with major food crops. Data obtained from these investigations also showed that the studied species have good market potential so that their promotion can contribute to the economic well-being of rural people. Indeed, these species are widely accepted at both cities and villages levels, due to their cultural and culinary values.
Introduction
The conservation and characterisation of indigenous genetic resources are crucial to fulfil the needs of breeders for both present and future generations (Frankel, 1974; Brown & Briggs, 1991; Eyzaguirre, 1995). The chance for fulfilling future demand of genetic resources is better when a high level of genetic diversity is conserved and made available (Given, 1987; Anonymous, 1991; Given, 1994). This challenge should not be missed, particularly for the neglected and underutilised crops in Africa such as fonio, bambara groundnut, and indigenous cucurbits that have numerous agronomic and economic potentials, making them materials for which improved production and uses can result in food security and incomes generation for peasants (Chweya & Eyzaguirre, 1999; IPGRI, 2002). Indeed, many neglected and underutilised crops (so called orphan crops) are reported to be rich in nutrients, well adapted to extremely divergent agro-ecosystems and various cropping systems characterized by minimal inputs.
To address these issues, a collaborative project involving Gembloux Agricultural University (Belgium) and the University of Abobo-Adjamé (Ivory Coast) has been implemented using the main edible-seeded cucurbit species cultivated or growing naturally in Ivory Coast as

157
plant materials. Specifically, the following topics were defined for the project: plant material collecting in various ecological regions of the country, botanical identification and genetic characterization of ecotypes, agronomic evaluation of the most common species, study of their reproductive biology and improved cropping systems implementation. The studied cucurbits are prized for their oleaginous seeds consumed as soup thickener, preferentially during popular feasts and prestigious ceremonies (van Epenhuijsen, 1974; Akobundu et al., 1982; Badifu, 2001; Zoro Bi et al., 2003). We report herein preliminary results obtained from investigations on inter- and intraspecies diversity of the target plant materials, as well as the current cropping systems involved and some major constrains to production.
Materials and methods
Study sites and plant materials
This study was carried out during the period 2000-2004 in Ivory Coast, covering 322,462 km2 and located between latitudes 4°30’N-10°30’N and longitudes 2°30’W-8°30’W. The country is bordered by the Atlantic Ocean to the south, Ghana to the east, Guinea Conakry and Liberia to the west, and Burkina Faso and Mali to the north. Investigations were made in three sites (designated south, centre and east), selected in three agro-ecosystems, also differing by the food habits of the local populations.
The south site is localized between latitudes 4°41’N-6°00’N and longitudes 4°00’W-7°30’W. In this zone, rainfalls are abundant (annual mean > 2000mm) and the mean annual temperature is 28°C, with an annual amplitude of 5-10°C. Vegetation is mainly consisting of tropical rain forest, with mangrove on the coastal side. Two departments (Alépé and San Pedro) and 10 villages were selected in this site for field observations.
The east site is limited by latitudes 6°00’N-8°00’N and longitudes 3°00’W-5°00’W and includes three departments (Abengourou, Daoukro and Bongouanou) and 10 villages. This site is characterized by the transitional woodland savanna, with several blocks of semi-deciduous forests. Rainfalls vary from 875 to 1910mm, with an annual mean of 1250mm; the annual mean temperature is 27°C.
The centre site is also composed of three departments: Beoumi, Sakassou and Zuénoula. It is limited by latitudes 6°00’N-8°00’N and longitudes 5°00’W-7°00’W. A total of 20 villages were visited in this site. Annual rainfalls vary from 800 to 1400mm, with an annual mean of 1200mm; the annual mean temperature is 27°C. The vegetations are dominated by woodland savannas.
Plant materials are the indigenous edible-seeded cucurbits cultivated by rural people or growing naturally. To extract the seeds, the fruits are split using a piece of wood or a machete, placed on the ground with the inner part downward, and covered with the help of banana leaves or a plastic awning until the solid flesh starts to decay. The seeds are then extracted, washed, dried, shelled, and winnowed to get the kernels. Then the kernels are slightly toasted and ground for use as thickener of a traditional soup called ‘egussi’ soup in most sub-Saharan countries and ‘pistachio’ soup in Ivory Coast. Edible oil can also be extracted from the seeds (van Epenhuijsen, 1974; Badifu, 2001).
Data collection and analysis
In each zone, a participatory rural appraisal-based method (Chambers, 1992) was used to gather local community knowledge of traditionally cultivated cucurbit species, namely their vernacular names, diversity, relative cultural and social importance, and uses. To check if

158
morphological variations observed within a species were not due to environmental conditions prevailing in the original sites, representative samples of each plant introduction (PI) accession were grown at the experimental station of the University in Abidjan for 2-4 seasons, with two replicates and 20-50 seeds per plot of 25m x 25m. Within each species, morphological differences between cultivars were examined considering the following traits: mature fruit shape and colour, seed shape, seed size (estimated as height x width), and 100-seed weight. The estimates of seed size and 100-seed weight were then used to compare cultivars using Student t-test (for two cultivars) or one-way analysis of variance (for more than two cultivars) that was completed by the Newman-Keuls test, if necessary (Zar, 1996). Statistical analyses were performed using the StatsDirect™ statistical package for Windows, release 2.4 (StatsDirect, 2005).
Results and discussion
Inter- and intraspecies diversity
A total of 176 PI accessions composed of five species in five genera were collected throughout the three zones: Citrullus lanatus var. citroides (Thumb.) Matsum. & Nakai. (90 PI accessions), Cucumeropsis mannii Naudin (43 PI accessions), Cucumis melo var. agrestis L. (25 PI accessions), Cucurbita pepo L. (5 PI accessions), and Lagenaria siceraria (Molina) Standl. (13 PI accessions). Intraspecies diversity based on fruit and seed traits was observed in the five species.
Citrullus lanatus var. citroides
This species is a monoecious, yellow flowered and creeping annual vine, presenting leaves deeply divided into 5-7 more or less subdivided lobes. Locally called ‘wlêwlê’, the species is the most common edible-seeded cucurbit species cultivated in Ivory Coast. The fruits are round or oval (Figure 1), uniformly light green or mottled light and dark green and contain a white bitter flesh embedding about 200 seeds. The mature dried seeds are yellowish in color (Figure 1). Various fruit and seed shapes and colours are reported in C. lanatus (Gusmini, 2003). Two cultigroups were reported for this species. The first cultigroup, containing three cultivars (defined on the basis of seed size), has smooth seeds that are tapered to the point of attachment. Fruits of the second cultigroup, with one cultivar, are round and narrow or wide stripped. The seeds are ovoid and flattened, with a thickened and roughened margin. Statistical analyses highlighted significant differences between and within cultigroups for 100-seed weight and seed size (Table 1). Note that a type which presents slightly colored-flesh fruit, with brown seeds is often observed on permanent rubbish or on plots of unbuilt grounds in cities. This form could be a weedy type probably derived from the edible-fleshed C. lanatus var. lanatus that is widely consumed in towns. Our hypothesis is supported by the fact that some watermelon accessions held in the U.S. Department of Agriculture (USDA) show the edible seed phenotype, designated by breeders as the egussi seed type (Gusmini, 2003). Results from many studies devoted to genes controlling C. lanatus seed traits and their segregation patterns (see review by Gusmini et al., 2004) are also in accordance with our observations.
With regard to the mating system, it is worth noting that andromonoecy, a recessive trait that is reported to be common in C. lanatus var. citroides (Gusmini, 2003), was not observed in the collected cultivars.

159
Figure 1. Fruits and seeds of Citrullus lanatus var. citroides. Left to right, top row, fruit shape and color: round and light green; oval and light green; and round and wide striped. Bottom row, seed shape, color, and size: tapered, yellowish, and big-sized; tapered, yellowish, and medium-sized; tapered, yellowish, and small-sized; ovoid, flattened, yellowish, and big-sized.
Table 1. Difference between cultivars of edible-seeded cucurbits from Ivory Coast, based on mean
values (± SD) of seed size and 100-seed weight (n = sample size)
Species Cultivar / Type Seed size (mm2)
(n = 100) 100-seed weight (mg)
(n = 10)
Citrullus lanatus Big seeds 120.41±16.94
c 11.50±0.61
a
Medium seeds 058.81±9.76b 05.49±0.23
b
Small seeds 42.07±7.17a 04.26±0.26
c
Thickened margin seeds
179.06±26.11d 17.45±0.60
Cucumeropsis mannii Big seeds 138.31±12.90
c 11.87±0.59
a
Medium seeds 096.80±10.79b 10.73±0.33
b
Small seeds 049.44±7.68a 04.47±0.15
c
Cucumis melo var. agrestis Green-fruited 019.16±2.59
b 01.11±0.04
a
Orange-fruited 013.24 ±1.48a 00.58±0.11
b
Cucurbita pepo Green-fruited
79.59±9.12
a
7.54±0.34
a
Yellow-fruited 123.92±11.48b 07.87±0.53
a
Lagenaria siceraria Round-fruited 159.08±19.43
a 25.08±0.70
a
Blocky-fruited 190.78±26.88b 21.60±2.80
b
NB: For each trait and each species, means within a column followed by different superscripts were significantly different (P £ 0.01), based on Student t or Newman-Keuls tests.

160
Cucumeropsis mannii
This species is a monoecious annual climbing vine, locally called ‘n’viêlê’. It can climb up to a height of 3-5m. The leaves are embossed, with three notched lobes. Fruits are uniformly slight green or yellowish and blocky. Seeds are whitish, flattened, and tapered to the point of attachment (Figure 2). According to peasants, maximizing yield of this species implies vertical training of the vines. For this reason, in the target zones, C. mannii is systematically intercropped with yam, since the latter also needs training trellis to yield. Three cultivars defined on the basis of seed size were found for this species (Figure 2 and Table 1).
Cucumis melo var. agrestis
Two andromonoecious types, with dark green leaves, yellow flowers and small oval fruits (3-7cm length) were collected in the target zones. The most common type (Figure 3) is cultivated and locally called ‘lomi n’gatê’. The seeds of this type are toasted, ground, and eaten as soup thickener. The flesh of fruits is light green, lacks aroma, and has a bitter taste. The second type, less widely cultivated, is often found along the roads, on permanent rubbish or on plots of unbuilt grounds in villages and cities. Its mature fruits are orange in colour (Figure 3), possess aroma and are exclusively used as vegetable. The fruits are cut into slices and added to soup. In addition to mature fruit colour, the other differences between the two types are related to seed size and 100-seed weight (Table 1).
The melon family is a worldwide economically important crop that includes wild types and numerous varieties, either consumed as desert fruit, vegetable or sauce constituent (van Epenhuijsen, 1974; Akobundu et al., 1982; Chweya & Eyzaguirre, 1999; Badifu, 2001; Zoro Bi et al., 2003). Varieties vary widely in fruit size, morphology and taste, as well as vegetative traits and climatic adaptation (Silberstein et al., 1999; El Tahir & Taha Yousif, 2004). The most recent classification of C. melo L. subdivides this species into two subspecies: agrestis and melo (Pitrat et al., 2000). Within the subspecies agrestis, 5 botanical varieties are recognised, while in the subspecies melo, 11 varieties are recognized. The two forms of C. melo var. agrestis observed in the present study are probably cultivars belonging to one of the five botanical varieties described by Pitrat et al. (2000). Unfortunately the publication of the latter is mainly based on the fruit traits and do not contain illustrations which could help clarifying the botanical classification of our specimens.
Figure 2. Fruit and seeds of Cucumeropsis mannii. Seed pictures, left to right, seed size: big-sized, medium-sized, and small-sized.

161
Figure 3. Fruits and seeds of Cucumis melo var. agrestis. Top row, left to right: cultivated type; uncultivated type. Bottom row, left to right: seed of the cultivated type; seed of the uncultivated type.
Cucurbita pepo
Two open-pollinated cultivars, identified as C. pepo on the basis of the study of Paris (2001) and locally named ‘n’gando’, were collected. The cultivars present yellow flowers and blocky fruits with orange flesh. This species is found in backyard gardens or on plots of unbuilt grounds in villages and cities. The main difference between the two cultivars is related to the colour of the mature fruit that can be mottled light and dark green or yellow, and to the seed size (Figure 4 and Table 1).
C. pepo is among the economically most important vegetable crops worldwide and is grown in both temperate and tropical regions (Paris, 2001; Bisognin, 2002; Sanjur et al., 2002). It is also one of the most variable species for fruit traits. The species includes both edible-fruited forms (pumpkins and squash) and small- fruited, often bitter, and inedible forms known as gourds (Hart, 2004). In many cases, variability in fruit traits among cultivars can be related to differences in quality needed for the culinary uses of the mature fruit and seeds. The two cultivars described in the present study have fibrous flesh so that they are solely cultivated for their seeds. Nevertheless, they expressed obvious morphological differences.

162
Figure 4. Fruits and seeds of Cucurbita pepo. Top row, left to right: yellow-fruited cultivar; green-fruited cultivar. Bottom row, left to right: seed of the yellow-fruited cultivar; seed of the green-fruited cultivar.
Lagenaria siceraria
This is a species of the monoecious white flowered gourds locally called ‘bebou’. The local name is related to the manual shelling of the seeds, due to their hard coat. Two cultivars, recognizable by the fruit shape (blocky or round), were collected. Fruit and seed shape and size are reported to be highly variable in Lagenaria (Bisognin, 2002). In our case, seeds from the round-fruited cultivar are characterized by the presence of a cap on the distal side (Figure 5). With regard to seed size and 100-seed weight, significant differences were observed between the two cultivars (Table 1).
Cropping systems and main constraints to production
The first conducted surveys in the country covered about 100 farms distributed in the three regions (centre, east and south). Traditional cucurbit species consumed in sauce in Ivory Coast are mainly grown by women as minor crop in association with major food, spice or perennial commercial crops. The most common associated plants are in the south: eggplant, pepper and okra, in the east and the centre: cassava, yam, maize, vegetables (eggplant, tomato and pepper), cotton and acajou. Nevertheless, in the centre site C. lanatus var. citroides is sometimes cultivated as major crop in monoculture. The contribution of women to plant biodiversity management and conservation is common in developing countries (Hoddel et al., 1999; Howard, 2003). In many cases it has been demonstrated that they are farmers and plant breeders, particularly of indigenous crops.

163
In the selected sites, overall, areas cultivated with indigenous cucurbit species are small in size (0.25-0.50ha), depending on needs, work tasks, and capacities of the women, as well as on their relative independence in the households. In the surveyed sites, men are in fact the dominant decision-makers concerning selection of land and crop. In the choice of crops, preference is usually given, in decreasing order, to: local perennial plants with economic potential or value (coffee, cacao, acajou, etc., according to the site), food staple crops and crops cultivated by women. Therefore, despite their economic and cultural importance, the edible-seeded cucurbits which are under the women’s responsibility are often neglected. The second problem related to the cultivation of these plants is the lack of adapted reliable cropping practices allowing stable and sufficient production. This problem concerns particularly sowing date and density, weeding schedule, and fertilization.
Conclusion
This study highlighted the occurrence, in Ivory Coast, of five species of cucurbit incorrectly called ‘pistachio’ in cities and cultivated on a small scale by women for their oleaginous seeds that represent a great importance in the socio-cultural live of several peoples. Production and uses of the recorded species are mainly carried out by rural women, making these underexploited crops capital resources for women economic prosperity. The intraspecies diversity was however limited to 2 to 4 varieties. This small number of variety seemed to be the product of two main factors: a relatively limited farmers’ knowledge about varietal diversity and a selection process oriented towards the most common cultivars, based on the needs and goals of the household.
In order to valorise the cucurbits biodiversity in Ivory Coast, priorities are given to the following investigations:
- Identification of diversity sites to collect new germplasm covering the whole agro-ecological situation of the country;
- Genetic organization at inter- and intraspecies levels, using both morphological and molecular descriptors;
- Study of reproductive biology, with in-depth examination on forms of sex expression, flowering sequences, seed physiology and viability;
- Identification of major biotic and abiotic constraints and improvement of crop husbandry in both sole and multiple cropping systems.
Figure 5. Fruit and seeds of Lagenaria siceraria. Bottom row, left to right: seed of the round-fruited cultivar, seed of the blocky-fruited cultivar.

164
Acknowledgments
Helpful comments of Irié Bi Vroh (Cornell University, New York, USA) resulted in significant improvement of the manuscript. This research was financed by the Direction Générale de la Coopération au Développement (DGCD, Brussels, Belgium) and supervised by the Comité Universitaire pour le Développement (CUD, Brussels, Belgium).
References
Akobundu, E.N.T., J.P. Cherry & J.G. Simmons, 1982. Chemical, functional and nutritional properties of Egussi (Colocynthis citrullus) seed protein products. Journal of Food Science 47: 829-835.
Anonymous, 1991. Genetic sampling guidelines for conservation collections of endangered plants. In Falk, D.A. & K.E. Holsinger (eds), Genetics and conservation of rare plants. Oxford University Press, Oxford: 225-238.
Badifu, G.I.O., 2001. Effect of processing on proximate composition, antinutritional and toxic contents of kernels from Cucurbitaceae species grown in Nigeria. Journal of Food Composition and Analysis 14: 153-161.
Bisognin, D.A., 2002. Origin and evolution of cultivated cucurbits. Ciêcia Rural 32: 715-723.
Brown, A.H.D. & J.D. Briggs, 1991. Sampling strategies for genetic variation in ex situ collections of endangered plant species. In Falk, D.A. & K.E. Holsinger (eds), Genetics and conservation of rare plants. Oxford University Press, Oxford, UK: 99-119.
Chambers, R., 1992. Rural appraisal: rapid, relaxed and participatory. Discussion paper 311. Institute of Development Studies, Brighton (UK).
Chweya, J.A. & P.B. Eyzaguirre, 1999. The biodiversity of traditional leavy vegetables. IPGRI, Rome.
El Tahir, I.M. & M. Taha Yousif, 2004. Indigenous melons (Cucumis melo L.) in Sudan: a review of their genetic resources and prospects for use as sources of disease and insect resistance. Plant Genetic Resources Newsletter 138: 36-42.
Eyzaguirre, P.B., 1995. In situ conservation and sustainable use of minor vegetable and fruit species. In Engels, J.M.M. (ed), In situ conservation and sustainable use of plant genetic resources for food and agriculture in developing countries. IPGRI/DSE, Bonn-Röttgen: 104-116.
Frankel, O.H., 1974. Genetic conservation: our evolutionary responsibility. Genetics 78: 53-65.
Given, D.R., 1987. What the conservationist requires of ex situ collections. In Branwell, D., O. Hamann, V. Heywood & H. Synge (eds), Botanic gardens and the world conservation strategy. Academic Press, London: 103-116.
Given, D.R., 1994. Principles and practice of plant conservation. Chapman & Hall, London.
Gusmini, G., 2003. Watermelon (Citrullus lanatus) breeding handbook. NC State University, Raleigh.
Gusmini, G., T.C. Wehner & R.L. Jarret, 2004. Inheritance of egussi seed type in watermelon. Journal of Heredity 95: 268-270.

165
Hart, J.P., 2004. Can Cucurbita pepo gourd seeds be made edible? Journal of Archaeological Science 31: 1631-1533.
Hoddel, U., M. Gessler, H.H. Cai, V.V. Thoan, N.V. Ha, N.X. Thu & T. Ba, 1999. In situ conservation of plant genetic resources in home gardens of southern Vietnam. IPGRI, Rome.
Howard, P.L., 2003. Women and plants: gender relations in biodiversity management and conservation. Zed Books Ltd., London.
IPGRI, 2002. Neglected and underutilized plant species: strategic action plan of the International Plant Genetic Resources Institute (IPGRI). IPGRI, Rome.
Paris, H.S., 2001. Characterization of the Cucurbita pepo collection at the newe Ya’ar research center, Israel. Plant Genetic Resources Newsletter 162: 41-46.
Pitrat, M., P. Hanelt & K. Hammer, 2000. Some comments on interspecific classification of cultivars of melon. Acta Horticulturae 510: 29-36.
Sanjur, O.I., D.R. Piperno, T.C. Andres & L. Wessel-Beaver, 2002. Phylogenetic relationships among domesticated and wild species of Cucurbita (Cucurbitaceae) inferred from a mitochondrial gene: implications for crop plant evolution and areas of origin. Proceedings of National Academy Science of USA 99: 535-540.
Silberstein, L., I. Kovalski, R. Huang, K. Anagnostou, M.M.K. Jahn & R. Perl-Treves, 1999. Molecular variation in melon (Cucumis melo L.) as revealed by RFLP and RAPD markers. Scientia Horticulturae 79: 101-111.
StatsDirect, 2005. StatsDirect statistical software, release 2.4. StatsDirect Ltd., Sale (UK).
van Epenhuijsen, C.W., 1974. Growing native vegetables in Nigeria. FAO, Rome.
Zar, J.H., 1996. Biostatistical analysis. Printence Hall, New Jersey.
Zoro Bi, I., K.K. Koffi & Y. Djè, 2003. Caractérisation botanique et agronomique de trois espèces de cucurbites consommées en sauces en Afrique de l’Ouest: Citrullus sp., Cucumeropsis mannii Naudin et Lagenaria siceraria (Molina) Standl. Biotechnology, Agronomy, Society and Environment 7: 189-199.

166
EPBRS workshop ‘Innovative research for data acquisition and assessment’, Brussels, Belgium, 18 April 2005
The EPBRS is “a forum for scientists and policy-makers to ensure that research contributes to halting the loss of biodiversity by 2010.” Its participants, from across Europe, meet to identify and promote strategically important biodiversity research that will contribute to policies and management to reduce biodiversity loss, and help to conserve, protect, restore and make the use of the components of biodiversity sustainable.
The EPBRS keeps close connections with relevant international bodies, national governments, and the EU institutions. Since its inception in 1999 it has met twice a year under successive EU presidencies. The agendas of the meetings of the EPBRS balance science and policy. The scientific flavour of the meeting ensures that all participants enjoy sufficient depth of understanding to discuss the substantive issues constructively. The themes addressed in the meetings are not only important to Europe, but of particular relevance to the organizing country, and are often related to forthcoming CBD meetings. The group has so far dealt with many topics, including biodiversity and climate change, health, islands and archipelagos, invasive organisms, water and forest, the ecosystem approach, indicators, the new Member States, sustainable use, sustainable development, and sustaining livelihoods.
The main tangible deliverable of each EPBRS meetings is the short written agreement of the group on issues that are of high scientific and policy importance.
During the 10th meeting of the Governing Board (GB10) of the Global Biodiversity Information Facility (GBIF) EPBRS held a workshop on ‘Innovative research for data acquisition and assessment’. It took place on Monday 18th April 2005 in the Royal Museum of Fine Arts in Brussels. The output of the workshop was presented to the 10th meeting of the GBIF Governing Board, forwarded to the European Commission to be used in the European 7th Framework Programme, and made available to those responsible for the national research strategies of the EU member states.
Tack, J.
Instituut voor Natuur en Bosonderzoek (INBO), Kliniekestraat 25, B-1070 Brussels, Belgium. [email protected]

167
The mission of the European Platform for Biodiversity Research Strategy (EPBRS) is to ensure that research contributes to halting the loss of biodiversity by 2010.
RECOMMENDATIONS OF THE WORKSHOP OF THE
EUROPEAN PLATFORM FOR BIODIVERSITY RESEARCH STRATEGY
held during the Luxembourg Presidency of the EU
Brussels, Belgium, 18th April 2005
concerning
INNOVATIVE RESEARCH FOR BIODIVERSITY DATA
AQUISITION & ASSESSMENT
To achieve the quality of data needed to halt biodiversity loss, research is needed on: 1. methods to integrate and aggregate data varying in scale, precision and accuracy1 to answer
local, regional and global research and policy questions 2. quality assessments and confidence estimates based on data provenance, characteristics,
collection bias and processing, 3. spatial and temporal sampling strategies to take into account statistical characteristics and
cost efficiency 4. biodiversity informatics to discover and exploit links between ecological, species, genetic,
molecular, economic and social data 5. tools and criteria for prioritisation of data collection.
To develop the necessary high quality and policy relevant research on the above priority areas, particular attention should be paid to:
- effective communication among policy makers, scientists, practitioners and the general public
- wide agreement on metadata standards for data collection and processing
- the application of common protocols and agreed standards for the construction of and access to biodiversity-related databases
- confidentiality issues, legal aspects and IPR of data, and protocols for data access and use
- digitisation and validation of existing data, including taxonomic synonyms and georeferencing of observations and specimens
- automated artificial intelligence data parsing techniques for digitised versions of non-electronic data sources such as publications, field notes, catalogue cards and photographs.
1 including earth observation, geographical, meteorological, geological, chemical, physical, socioeconomic, governance,
local knowledge and other biodiversity data