Embed Size (px)
Citation preview

Ecology, 96(4), 2015, pp. 998–1009� 2015 by the Ecological Society of America
Trophic phylogenetics: evolutionary influences on body size, feeding,and species associations in grassland arthropods
ERIC M. LIND,1,4 JOHN B. VINCENT,2 GEORGE D. WEIBLEN,3 JEANNINE CAVENDER-BARES,1 AND ELIZABETH T. BORER1
1Department of Ecology, Evolution, and Behavior, University of Minnesota, St. Paul, Minnesota 55108 USA2Plant Biological Sciences Graduate Program, University of Minnesota, St. Paul, Minnesota 55108 USA
3Bell Museum of Natural History and Department of Plant Biology, University of Minnesota, St. Paul, Minnesota 55108 USA
Abstract. Contemporary animal–plant interactions such as herbivory are widelyunderstood to be shaped by evolutionary history. Yet questions remain about the role ofplant phylogenetic diversity in generating and maintaining herbivore diversity, and whetherevolutionary relatedness of producers might predict the composition of consumercommunities. We tested for evidence of evolutionary associations among arthropods andthe plants on which they were found, using phylogenetic analysis of naturally occurringarthropod assemblages sampled from a plant-diversity manipulation experiment. Consideringphylogenetic relationships among more than 900 arthropod consumer taxa and 29 plantspecies in the experiment, we addressed several interrelated questions. First, our resultssupport the hypothesis that arthropod functional traits such as body size and trophic role arephylogenetically conserved in community ecological samples. Second, herbivores tended to co-occur with closer phylogenetic relatives than would be expected at random, whereas predatorsand parasitoids did not show phylogenetic association patterns. Consumer specialization, asmeasured by association through time with monocultures of particular host plant species,showed significant phylogenetic signal, although the strength of this association varied amongplant species. Polycultures of phylogenetically dissimilar plant species supported morephylogenetically dissimilar consumer communities than did phylogenetically similar poly-cultures. Finally, we separated the effects of plant species richness and relatedness inpredicting the phylogenetic distribution of the arthropod assemblages in this experiment. Thephylogenetic diversity of plant communities predicted the phylogenetic diversity of herbivorecommunities even after accounting for plant species richness. The phylogenetic diversity ofsecondary consumers differed by guild, with predator phylogenetic diversity responding toherbivore relatedness, while parasitoid phylogenetic diversity was driven by plant relatedness.Evolutionary associations between plants and their consumers are apparent in plots onlymeters apart in a single field, indicating a strong role for host-plant phylogenetic diversity insustaining landscape consumer biodiversity.
Key words: arthropod phylogeny; Cedar Creek LTER, Minnesota, USA; community phylogenetics;diversity; grassland; herbivores; parasitoids; predators.
INTRODUCTION
Communities of primary producers have a fundamen-
tal influence on the structure and function of trophicwebs. In terrestrial ecosystems, the richness of plantspecies serves as a reasonable first-order predictor of
herbivore richness and perhaps other trophic groups aswell (Basset et al. 2012). Patterns of host specializationin herbivores (Weiblen et al. 2006) and their parasitoids
(Hrcek et al. 2011) raise the possibility that associationsof consumer species, beginning with herbivores butincluding higher trophic levels, are generally explained
by plant evolutionary relatedness. Consumer communi-ties include many different trophic roles and lineages,
sometimes varying depending on ecological context.
Here, we define primary consumers (referred to hereafter
as herbivores) as those known or thought to consume
mostly plant tissue, and secondary consumers as
inclusive of predators (which consume animal tissue as
adults) and parasitoids (which utilize living animal tissue
for development of their offspring). The explanatory
power of evolutionary relatedness in predicting associ-
ations among consumers and producers, and across
consumer trophic levels, is largely unknown.
Previous experimental work has demonstrated the
importance of plant species richness in determining the
abundance, richness, and trophic structure of consumer
communities (Siemann et al. 1998, Haddad et al. 2009,
Borer et al. 2012, Dinnage et al. 2012, Rzanny and Voigt
2012). For instance, a long-term biodiversity experiment
showed that increasing grassland plant species richness
supports a predictable increase in herbivore richness
(Siemann et al. 1998), with weaker effects on predatory
arthropod richness but a strong increase in the
Manuscript received 28 April 2014; revised 15 September2014; accepted 17 September 2014. Corresponding Editor:N. J. B. Kraft.
4 E-mail: [email protected]
998

abundance of secondary consumers (Haddad et al.
2009). An analysis of consumer communities in a similar
plant diversity experiment found increased diversity of
trophic interactions among consumer functional groups
(Rzanny and Voigt 2012), indicating not just effects on
consumer species diversity, but also that the intensity of
food-web relationships changes with plant diversity.
Finally, structural equation modeling of whole commu-
nities of plants and consumers suggests producer
biomass may be equally or even more important than
plant diversity in promoting consumer diversity (Borer
et al. 2012). Although these studies have documented the
overall influence of primary producer diversity on
consumers at the ecosystem level, mechanistic explana-
tions of consumer–host species relationships, as medi-
ated by trait interactions and evolutionary history, are
also needed (Rafferty and Ives 2013).
Speciation and ecological specialization have long
been hypothesized to explain the diversity of plant–
insect associations, because colonization of new host
plants by herbivores may involve adaptation to over-
come particular plant defenses as well as the evolution of
reproductive isolation (Ehrlich and Raven 1964, Farrell
1998, Tilmon 2008). Considering that many herbivores
feed on a limited set of closely related plants, the
phylogenetic diversity of a plant community should
predict the diversity of the herbivore assemblage (Mitter
et al. 1991, Novotny et al. 2006), sometimes called the
herbivore niche hypothesis. The analogous hypothesis
for higher-order consumers, such as predators and
parasitoids, is that herbivore phylogenetic and trait
diversity should predict ‘‘enemy’’ diversity (Bailey et al.
2009). Importantly, the strength of this prediction
should be lesser for predators that have transient
interactions with herbivores as a meal for adults, versus
parasitoids whose offspring will be endophagous to an
herbivore and thus more likely to experience selection
for specialization against herbivore defenses. In any
case, whether higher-order consumers of either guild
show significant phylogenetic structure with respect to
either primary producers or primary consumers, remains
an open question.
Community phylogenetic tools have enabled ecolo-
gists to detect the influence of evolutionary history on
contemporary ecological patterns and interactions
(Webb et al. 2002, Cavender-Bares et al. 2009). The
emerging literature on community phylogenetics has
focused largely on primary producers (e.g., Cavender-
Bares et al. 2004, Strauss et al. 2006) or individual
monophyletic functional consumer groups (e.g., Helmus
et al. 2010, Pellissier et al. 2013). Examinations of
trophic interactions in phylogenetic context mainly have
focused on the primary producer community rather than
the evolutionary relationships of the consumers (e.g.,
Fine et al. 2006, Weiblen et al. 2006, Dinnage et al. 2012,
Whitfeld et al. 2012b; but see Pellissier et al. 2013). An
analysis of the ecological importance of phylogenetic
relatedness in consumer communities, particularly one
spanning multiple trophic levels and deeper branches in
the animal tree of life, has yet to be attempted.Assembling current phylogenetic knowledge into
hypotheses of relatedness for community samples is amajor challenge for ecologists (Beaulieu et al. 2012).
Here, we present a phylogeny estimate derived from anintensively sampled grassland arthropod community
including .900 taxa, the largest of its kind to date.We use this community phylogeny to examine theinfluence of evolutionary relatedness on arthropod
traits, feeding associations, and co-occurrences. Wecollected these arthropods within a plant biodiversity
manipulation experiment, thus allowing us to examinethe phylogenetic distribution of the arthropod commu-
nity responses to plant species richness and plantphylogenetic relatedness. Specifically, we set out to
answer the following questions: (1) Is there phylogeneticsignal in two ecologically important arthropod traits,
body size and trophic role, in a multitrophic grasslandarthropod consumer community? (2) Is there phyloge-
netic structure in the co-occurrences of arthropod taxaat scales relevant to ecological interactions (e.g.,
sampled plots)? (3) How do plant species identity,richness, and phylogenetic diversity influence the phy-
logenetic diversity of the consumer community? Do therelationships between consumers and plants differ bytrophic role? (4) Do secondary consumer communities
differ by mode of attack (predator or parasitoid)? Arethese higher trophic levels more influenced by the
phylogenetic relatedness of the herbivore community,or the plant community? (5) Does increasing evolution-
ary distance among plant assemblages (phylogeneticbeta diversity) drive increasing evolutionary distance
among consumer assemblages?
METHODS
Arthropod sampling, identification, and traits
The arthropods from this study were collected within
a plant diversity experiment at the Cedar Creek LTER(Minnesota, USA; 45.4018 N , 93.2018 W), establishedby plowing and disking a former agricultural field in
1993, then seeding with prairie plants in 1994. Each ofthe 168 experimental plots was 13 3 13 m, and was
seeded with 1, 2, 4, 8, or 16 locally occurring plantspecies drawn randomly from a pool of 36 species (a
total of 29 unique plant species were present in the plotsanalyzed here). Plots were annually weeded to retain the
assigned plant species composition treatment. Plantswere chosen to represent five functional groups (C3 and
C4 grasses, forbs, legumes, and woody species). Plantspecies abundances were measured annually in these
plots, as percent cover (1996–2000). Further experimen-tal details are provided in Tilman (1996).
Arthropods were collected annually in late summer(August) in the plant diversity plots from 1996 to 2006,
and additional collections were made in June from 1997to 2002. Arthropod sampling was performed using 25
net sweeps per plot; all individuals were examined,
April 2015 999ARTHROPOD TROPHIC PHYLOGENETICS

identified to species or morphospecies within a known
genus or, in some cases, family, and counted. The
combined data set included 905 taxa from 15 orders,
represented by 65 534 individuals. Each taxon was
assigned to a trophic role (herbivore, detritivore,
parasitoid, or predator) following Siemann et al. (1997,
1998). Body sizes, estimated as a volume for individual
taxa as length3width3 depth (mm3), were assigned for
91% of the individuals, following Siemann et al. (1998)
and Borer et al. (2012).
Community phylogeny estimation
Due to a lack of available genetic information and
other challenges (detailed in Appendix) we followed a
grafting approach (Beaulieu et al. 2012) to assemble a
phylogenetic hypothesis for the 905 arthropod taxa from
Cedar Creek. Initially, taxa named in the Tree of Life
web project were assumed to be monophyletic at each
rank in the Linnean hierarchy (e.g., order, family,
subfamily, genus) unless contradicted by recent evidence
from the systematics literature; in this case, an unre-
solved polytomy was retained at the rank immediately
above. The backbone topology of relationships among
major clades and orders followed Regier et al. (2010) for
arthropods and Trautwein et al. (2012) for the class
Insecta. Relationships within orders were based on
recently published molecular phylogenetic hypotheses
(see Appendix for references). Particular taxa not
sampled in the recent literature were placed in the tree
as polytomies of higher taxa on the assumption of
monophyly of families, subfamilies, and genera, etc.
Incompletely identified taxa (e.g., ‘‘geometrid larva’’)
were also assigned as polytomies of the nearest
identifiable clade (e.g., Geometridae). Polytomies were
retained in all analyses. Example source tables and R
code used to create the phylogeny are available in a
Supplement.
We estimated relative divergence times among com-
munity members by assigning minimum ages in millions
of years ago (Ma) to 120 of 392 (31%) of ancestral nodes
based on fossil evidence as summarized in Grimaldi and
Engel (2006). We then used the bladj algorithm in the
program phylocom (Webb et al. 2008) to obtain ages for
all nodes by distributing the ages of remaining nodes
evenly between dated nodes and tips. Although the bladj
algorithm makes the unrealistic assumption of constant
evolutionary rates among lineages, it seems to perform
as well as more sophisticated molecular dating tech-
niques (Whitfeld et al. 2012a).
Analysis
Trait conservatism in community phylogeny.—We
tested for evidence of phylogenetic influence in the
distribution of two key traits, body size and trophic role,
using the geiger package (Harmon et al. 2008) in R (R
Development Core Team 2011). For both traits, we
estimated Pagel’s k (Pagel 1999), which varies from 0
(trait random with respect to phylogeny) to 1 (trait
evolved according to Brownian motion on the phylog-
eny). We additionally calculated Blomberg’s K (Blom-
berg et al. 2003) for body size (K is not meaningful for
categorical states like trophic role).
Calculating phylogenetic structure of co-occurrence.—
We estimated the phylogenetic structure of species
occurrences in a given sample using the D statistic
introduced by Fritz and Purvis (2010). Originally, D was
developed to analyze phylogenetic structure in extinc-
tion risk, which, like occurrence of a consumer in a given
plant community, is not an evolved trait per se, but is
likely to be highly correlated with evolved species traits.
We calculated D for each observed sample of arthropods
using 1000 replicate simulations in the phylo.D function
of the caper package (Orme et al. 2012) in R. We first
calculated D for the arthropod tree as a whole, and
second for each of the three most abundant trophic
groups, herbivores, predators, and parasitoids, on
phylogenetic trees that had been pruned to match these
groups. We hypothesized that herbivores would be more
likely to be phylogenetically structured than the higher-
order consumers, due to their stronger evolutionary
associations with the manipulated host-plant diversity.
We further hypothesized that parasitoids (in lineages
Hymenoptera and Diptera) would be more phylogenet-
ically structured than predators (including members of
Araneae, Heteroptera, Coleoptera, etc.) due to the close
association of parasitoids with their hosts.
Calculating arthropod consumer and plant community
phylogenetic diversity.—We calculated phylogenetic di-
versity of arthropods sampled in a given plot using two
measures. One was Faith’s PD, the summed distance
from each observed taxon to the root of the tree (Faith
1992). Here, we take advantage of the fact that PD
increases monotonically with species richness, as it
represents a composite phylogenetic diversity response
variable. We also calculated the mean phylogenetic
distance (MPD) among taxa in a sample, weighted by
the abundance of taxa in a plot in a given year (Webb et
al. 2002). We separately calculated plot-level PD and
MPD within each sampling year for herbivores,
predators, and parasitoids. To relate the phylogenetic
diversity of the primary producer community to the
phylogenetic diversity of the consumer community, we
used the plant phylogeny from Cadotte et al. (2009).
Similar to the methods of Dinnage et al. (2012), we
calculated abundance-weighted, standardized MPD, as
well as PD for the plant community in each year. All
phylogenetic diversity metrics were calculated using the
picante package in R (Kembel et al. 2010).
We used mixed-effects multiple regression analysis to
evaluate the power of plant phylogenetic diversity (PDp
and standardized MPD, not intentionally manipulated
in the original experiment) to explain phylogenetic
diversity of herbivores alone (with both PDherb and
MPDherb as response variables), and predators (PDpred
and MPDpred) and parasitoids (PDpara and MPDpara).
Models were constructed for the five years in which data
ERIC M. LIND ET AL.1000 Ecology, Vol. 96, No. 4

from all three trophic levels were available (1996–2000).
In the model predicting diversity of higher consumers,
we also included the MPDherb and PDherb data from
each plot, to test whether the phylogenetic diversity of
the secondary consumers was influenced by taxonomic
or phylogenetic diversity of herbivorous arthropods.
Because PD is known to covary strongly with species
richness, we used plant species richness as a grouping or
random factor, and allowed slopes of all relationships to
vary by plant species richness level in each model, and
by herbivore species richness in secondary consumer
models. Thus, predictor effect size estimates and
significance tests in the models are evaluated after
accounting for variance due to species richness. In all
models, we used sample year as a random intercept term.
We used the method of Nakagawa and Schielzeth (2013)
to calculate marginal R2 values for each model, which
indicates the amount of explanatory power of the
predictor variables, once variation due to random effects
is accounted for.
Phylogenetic influence of plant community on herbivore
community.—We used two further procedures to esti-
mate the influence of evolutionary relatedness on
herbivore co-occurrence with respect to plant commu-
nity phylogenetic structure. First, we took advantage of
the fact that the biodiversity experiment contained
monoculture plots to test whether individual plant
species supported phylogenetically structured herbivore
communities. Put another way, does herbivore affinity
for a given plant monoculture appear to be phylogenet-
ically conserved? To test this, we used the arthropod
phylogeny pruned to only contain herbivores to model
both random and Brownian evolution in abundance in
each monoculture plot, summed across all sample years.
We used the FitContinuous function in the geiger
package (Harmon et al. 2008) in R to compare the
likelihood of the following models: Brownian motion (k¼ 1), no phylogenetic influence (or random, k ¼ 0), and
the best-fit k value (between 0 and 1). We then compared
AIC of models for each plant species to determine the
strength of phylogenetic influence on the herbivore
community found feeding on that host-plant species.
Our second approach was to examine the strength of
correlation between the abundance-weighted differences
in community phylogenetic distance among all pairs of
plant plots (phylogenetic beta diversity, hereafter
phylobeta) and the community phylogenetic distance
among their associated herbivore communities. We used
the comdist function of the picante package to create
two pairwise distance matrices between all plots; one for
MPD of the plant communities and the other for the
MPD of herbivores. These matrices thus depict the
standardized expected phylogenetic distance between an
individual randomly drawn from each community, from
both producers and consumers, weighted by the
abundance of the members of the respective communi-
ties. We then used Mantel tests to evaluate the strength
of correlation between the phylobeta matrices. Under
the herbivore niche hypothesis, an increase in the
phylogenetic distance between plant communities
should result in a corresponding increase in herbivore
phylogenetic distance. We performed these tests for the
experiment as a whole, and separately for each of the
plant diversity levels.
Phylogenetic influence of herbivore community on
parasitoid and predator communities.—Extending the
logic of the herbivore niche hypothesis, specialized
secondary consumers such as parasitoids should have
phylogenetic structure in association with their hosts
(herbivores), while more typically generalist predators
may not. We tested these two hypotheses as for
herbivore–plant associations, in this case using the
phylobeta matrix of herbivore communities to predict
predator and parasitoid phylobeta matrices. We expect-
ed to see a positive correlation in phylogenetic distance
between communities of herbivores and parasitoids, but
little or no correlation with predators.
RESULTS
We produced a dated phylogeny including 905 taxa
sampled from a single grassland arthropod community
(Fig. 1). We were able to resolve 392 of 904 ancestral
nodes (43%), spanning 15 arthropod orders containing
184 families. Many of these polytomies were due to
incomplete identification; of the 905 unique taxa, 225
were identified only to family (including many larval
samples and parasitoid taxa). The remaining unresolved
nodes were due to lack of information in the phylogenetic
systematics literature. Dominant (diverse and abundant)
herbivore clades included leaf beetles (Coleoptera:
Chrysomelidae), grass flies (Diptera: Chloropidae), and
leafhoppers (Hemiptera: Auchenorrhyncha). Dominant
predators included spiders (Araneae), wasps (Hymenop-
tera: Vespoidea), and ants (Hymenoptera: Formicidae).
Parasitoids were dominated by wasps (Hymenoptera:
Ichneumonidae and Hymenoptera: Pteromalidae). Com-
plete information on clade diversity, resolution and age
estimates can be found in Appendix: Table A2.
Phylogenetic conservatism in trophic role and body size
We found that trophic role and body size had
different associations with the phylogenetic history of
our naturally occurring community samples (Fig. 1).
Trophic role was strongly phylogenetically conserved as
indicated by an estimated k¼ 1.0, an identical likelihood
to a model of Brownian motion evolution along the tree.
Body size also showed significant phylogenetic conser-
vatism, with an estimated K ¼ 1.18 (P ¼ 0.001 in
randomization tests; all effects throughout this study
significant at P ¼ 0.05), indicating slightly greater
clustering on the phylogeny than would be expected
under Brownian evolution.
Phylogenetic structure of arthropod communities
Overall, the co-occurrence of arthropod taxa across
the phylogenetic tree exhibited little evidence for
April 2015 1001ARTHROPOD TROPHIC PHYLOGENETICS
evolutionary signal, as D ¼ 0.899 6 0.005 (mean 6
standard error of the mean) for the community as a
whole (in this analysis D ¼ 1 indicates perfect
randomness of data with respect to the tree). Taking
advantage of the experimental replication to analyze
each plot sample as a community reveals more dynamic
patterns. On a plot basis, where there was more
variation, in 53% of assemblages (165 out of 313 plots),
D was significantly ,1. However, no plots were found
with the strong phylogenetic conservatism expected if
occurrence was controlled strictly by the influence of
traits undergoing strict Brownian evolution (D ’ 0).
This overall result hid important differences among
trophic groups, with more closely related herbivores but
less closely related parasitoids in plots than would be
expected at random (Fig. 2). In particular, 79% of
herbivore plot-scale assemblages showed significant
phylogenetic clustering within plots (as revealed by D
significantly ,1). Of predator assemblages within plots,
25% were significantly clustered (D significantly ,1)
with respect to arthropod phylogeny, most exhibiting
strong phylogenetic clustering (D not significantly
different from 0). Still, the majority of predator
assemblages (72%) showed random co-occurrence pat-
terns. Likewise, although parasitoids as a whole
appeared to be overdispersed on the phylogeny (Fig.
2), 92% of the parasitoid assemblages were not
distinguishable from those expected at random.
Influence of plant phylogenetic diversity on the
phylogenetic diversity of arthropods
The phylogenetic diversity of the herbivore commu-
nity was significantly explained by the plot-scale
phylogenetic diversity of the plant community (Fig. 3,
Table 1). Both PDp and MPDp contributed significantly
to the model, which had an overall marginal R2¼ 0.13.
When each plant community predictor including species
richness (SR) was used alone in single-parameter
models, all had a significant positive influence on PDherb;
but PDp alone had better explanatory power than either
of the other two variables (marginal R2 values PDp ¼0.11; SRp ¼ 0.07, MPDp ¼ 0.06). Notably, PDherb
increased with increasing PDp within each plant richness
class (Fig. 3). When MPDherb was used as the response
variable, weighting the phylogenetic diversity of herbi-
vores by abundance of taxa, PDp remained the strongest
predictor in combined models (Table 1), although the
overall explanatory power of the model was much less
(marginal R2¼ 0.03). On average, more phylogenetically
diverse plant communities supported more phylogenet-
ically diverse herbivore communities.
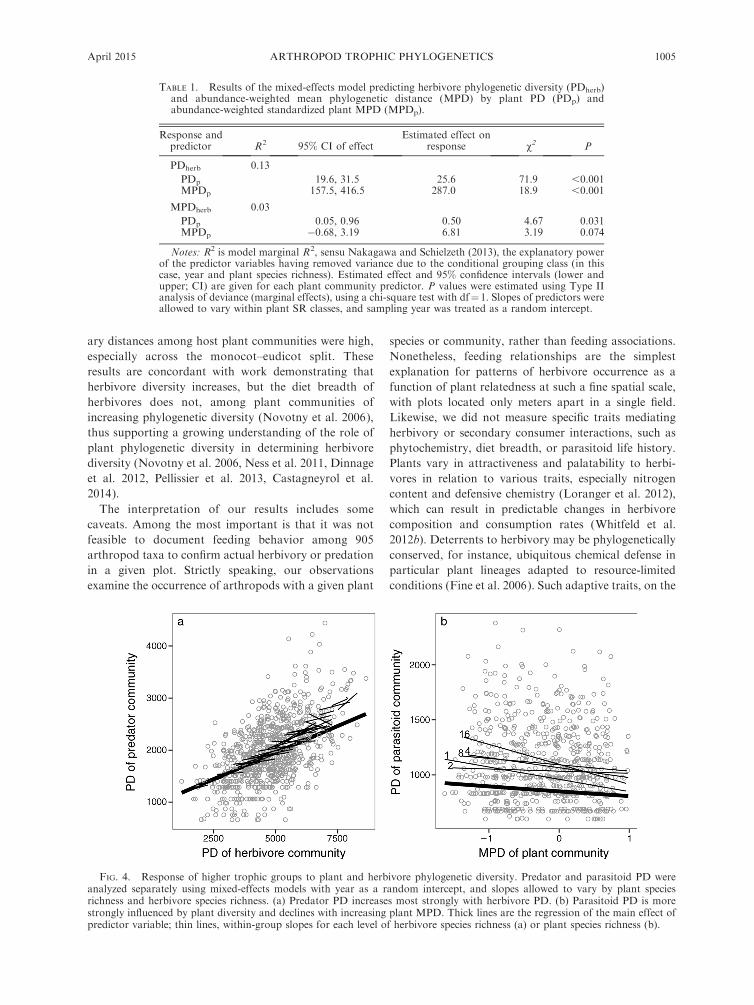
The best predictors of secondary consumer phyloge-
netic diversity differed by trophic guild (Fig. 4, Table 2).
Predator phylogenetic diversity (PDpred) responded
strongly to PDherb, across and within herbivore richness
levels (Fig. 4). In contrast, parasitoid phylogenetic
diversity (PDpara) was explained by MPDp, such that
increasing standardized MPD in plant communities
resulted in lower PDpara. This result held across and
within plant richness levels (Fig. 4), when MPDpara was
used as a response variable (Table 2). In sum, predator
phylogenetic diversity increased with increasing herbi-
vore phylogenetic diversity, while parasitoid phyloge-
netic diversity declined with increasing plant
phylogenetic diversity.
Phylogenetic clustering of consumers on plant
monocultures
The majority of plots maintained as plant species
monocultures were occupied by herbivore communities
that were significantly phylogenetically clustered, with
kest between 0.5 and 1.0 (Table 3). There were extremes
in the degree of clustering; in particular herbivores on
the oaks (Quercus sp.) showed almost perfect Brownian
distribution (kest ¼ 0.99), while the forb Monarda and
legume Lespedeza supported communities that did not
differ from a random sample from the complete
arthropod community.
Phylogenetic beta diversity of arthropods relative to plot-
scale plant composition
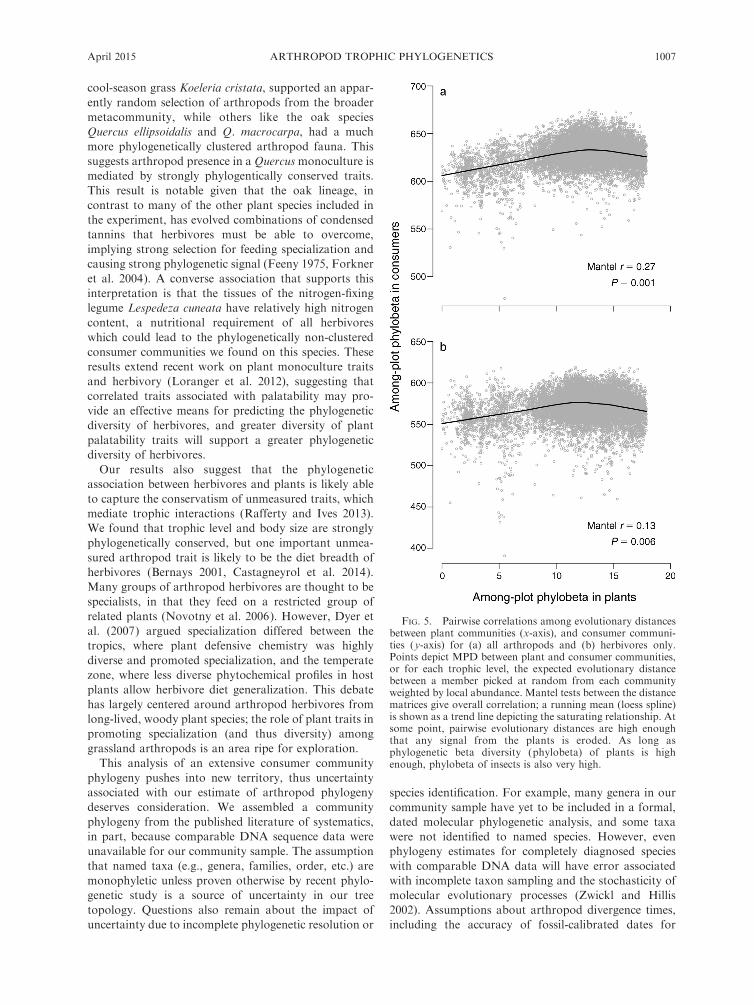
We found weak but significant correlations in plot–
plot phylobeta diversity of consumers relative to that of
plant hosts, despite high variance in plot–plot MPD for
the consumer samples (Fig. 5). The phylobeta diversity
among arthropod assemblages was more strongly
correlated with plant phylobeta diversity (Mantel r ¼0.27, P , 0.001) than was herbivore phylobeta diversity
(Mantel r ¼ 0.13, P ¼ 0.003). Thus, when phylogenetic
distances between plant communities were low, arthro-
pod phylogenetic distances were also low. As plant
phylogenetic distances increased, phylogenetic distances
in arthropods also increased, until a point at which
evolutionary distances among plants no longer influ-
enced phylogenetic turnover of arthropods. This satu-
ration effect coincided with paired comparisons of plots
having constructed plant communities dominated by
monocots with those dominated by eudicots. Consumer
phylobeta remained high but did not increase with
increasing difference above this threshold, resulting in
relatively weak linear associations overall. Similarly,
herbivore phylobeta diversity was not an especially good
predictor of predator (Mantel r ¼ 0.05, P ¼ 0.001) or
parasitoid (Mantel r ¼ 0.04, P ¼ 0.095) phylobeta
diversity.
DISCUSSION
By assembling a dated phylogeny estimate for a
taxonomically broad sample of arthropod consumers
within experimentally controlled primary producer
communities, we have demonstrated how evolutionary
relatedness influences plot-level ecological interactions
among multiple trophic levels. First, consumer phylo-
genetic relatedness effectively described two commonly
measured and ecologically important arthropod traits,
body size and trophic role. Second, multiple lines of
ERIC M. LIND ET AL.1002 Ecology, Vol. 96, No. 4

evidence demonstrate the phylogenetic conservatism
(evolutionary specialization) of herbivore–host plant
affinity in sampled communities. Most importantly,
the phylogenetic diversity of herbivore assemblages was
driven by the phylogenetic diversity of the plant
community, showing the predictive ability proffered by
the evolutionary histories of plant assemblages for their
herbivores.
FIG. 1. Assembled phylogenetic tree of 905 arthropod taxa sampled from a grassland biodiversity experiment at the CedarCreek LTER in central Minnesota, USA. Dates (in millions of years ago, Ma) of nodes were assigned from fossil evidence whereavailable, and otherwise modeled using assumption of constant evolutionary rates between dated nodes and tips. Right sideshows body size (originally measured in mm3) of an individual of the given taxa as measured or extracted from the literature.Taxa have been color-coded by trophic role. Major clades of interest are labeled by name and indicated by a circle at the root ofthe clade.
April 2015 1003ARTHROPOD TROPHIC PHYLOGENETICS

We present three lines of evidence consistent with the
herbivore niche hypothesis (Novotny et al. 2006), which
predicts that herbivore diversity is driven by evolution-
ary association with host plants, implicitly assuming
herbivore dietary specialization. First, herbivores of
most plant monocultures were more closely related than
expected by chance. We interpret this as evidence of
phylogenetic conservatism in feeding preferences among
closely related specialist herbivores. Second, more
phylogenetically diverse assemblages of arthropod her-
bivores were found in plots containing more phyloge-
netically diverse plant communities. Plant phylogenetic
diversity also had more power to predict the phyloge-
netic diversity of herbivores than plant species richness,
and relationships were consistent within plant species
richness levels. Finally, plot–plot comparisons showed
that phylogenetic turnover among arthropod communi-
ties (phylogenetic beta diversity) was positively corre-
lated with phylogenetic distances among plant
communities, as has been found in more phylogeneti-
cally limited analyses (Pellissier et al. 2013). However,
we found that turnover was saturating when evolution-
FIG. 2. Density plot of D statistics (Fritz and Purvis 2010) depicting phylogenetic structure of co-occurring arthropodassemblages by trophic role for the three most abundant trophic groups. Plots of all plant diversity levels were included in theanalysis. For herbivores (N¼ 537 taxa), predators (N¼ 101 taxa), and parasitoids (N¼ 82 taxa), the occurrence of taxa in a givenplot was modeled as a binary variable. The D statistic is the observed number of state changes throughout the tree, scaled by 1000replicate expectations of the states due to random (D ¼ 1.0) and Brownian (D ¼ 0.0) models.
FIG. 3. Herbivore community phylogenetic diversity (PD) increases with increasing plant PD and standardized meanphylogenetic distance (MPD). Relationships were analyzed in a mixed-effects model with year as a random intercept, and slopeswere allowed to vary by plant species richness. Regression lines indicate relationships within plant species richness classes, and arelabeled by the richness class; manipulated plant species richness in plots: 1, 2, 4, 8, or 16 species of plants.
ERIC M. LIND ET AL.1004 Ecology, Vol. 96, No. 4
ary distances among host plant communities were high,
especially across the monocot–eudicot split. These
results are concordant with work demonstrating that
herbivore diversity increases, but the diet breadth of
herbivores does not, among plant communities of
increasing phylogenetic diversity (Novotny et al. 2006),
thus supporting a growing understanding of the role of
plant phylogenetic diversity in determining herbivore
diversity (Novotny et al. 2006, Ness et al. 2011, Dinnage
et al. 2012, Pellissier et al. 2013, Castagneyrol et al.
2014).
The interpretation of our results includes some
caveats. Among the most important is that it was not
feasible to document feeding behavior among 905
arthropod taxa to confirm actual herbivory or predation
in a given plot. Strictly speaking, our observations
examine the occurrence of arthropods with a given plant
species or community, rather than feeding associations.
Nonetheless, feeding relationships are the simplest
explanation for patterns of herbivore occurrence as a
function of plant relatedness at such a fine spatial scale,
with plots located only meters apart in a single field.
Likewise, we did not measure specific traits mediating
herbivory or secondary consumer interactions, such as
phytochemistry, diet breadth, or parasitoid life history.
Plants vary in attractiveness and palatability to herbi-
vores in relation to various traits, especially nitrogen
content and defensive chemistry (Loranger et al. 2012),
which can result in predictable changes in herbivore
composition and consumption rates (Whitfeld et al.
2012b). Deterrents to herbivory may be phylogenetically
conserved, for instance, ubiquitous chemical defense in
particular plant lineages adapted to resource-limited
conditions (Fine et al. 2006). Such adaptive traits, on the
TABLE 1. Results of the mixed-effects model predicting herbivore phylogenetic diversity (PDherb)and abundance-weighted mean phylogenetic distance (MPD) by plant PD (PDp) andabundance-weighted standardized plant MPD (MPDp).
Response andpredictor R2 95% CI of effect
Estimated effect onresponse v2 P
PDherb 0.13
PDp 19.6, 31.5 25.6 71.9 ,0.001MPDp 157.5, 416.5 287.0 18.9 ,0.001
MPDherb 0.03
PDp 0.05, 0.96 0.50 4.67 0.031MPDp �0.68, 3.19 6.81 3.19 0.074
Notes: R2 is model marginal R2, sensu Nakagawa and Schielzeth (2013), the explanatory powerof the predictor variables having removed variance due to the conditional grouping class (in thiscase, year and plant species richness). Estimated effect and 95% confidence intervals (lower andupper; CI) are given for each plant community predictor. P values were estimated using Type IIanalysis of deviance (marginal effects), using a chi-square test with df¼ 1. Slopes of predictors wereallowed to vary within plant SR classes, and sampling year was treated as a random intercept.
FIG. 4. Response of higher trophic groups to plant and herbivore phylogenetic diversity. Predator and parasitoid PD wereanalyzed separately using mixed-effects models with year as a random intercept, and slopes allowed to vary by plant speciesrichness and herbivore species richness. (a) Predator PD increases most strongly with herbivore PD. (b) Parasitoid PD is morestrongly influenced by plant diversity and declines with increasing plant MPD. Thick lines are the regression of the main effect ofpredictor variable; thin lines, within-group slopes for each level of herbivore species richness (a) or plant species richness (b).
April 2015 1005ARTHROPOD TROPHIC PHYLOGENETICS

other hand, may not necessarily be phylogenetically
conserved but instead may be strongly convergent,
especially if traits are ecologically important (Whitfeld
et al. 2012b). However, our observation of phylogenetic
signal in herbivore associations suggests that suites of
conserved traits could be important in this grassland
plant community.
Although herbivore diversity and herbivory rates can
be determined by the phylogenetic diversity of plants
(Novotny et al. 2006, Ness et al. 2011, Dinnage et al.
2012, Pellissier et al. 2013, Castagneyrol et al. 2014),
plants vary in the predictability of consumers, as
revealed by the communities sampled from plant species
in monoculture in the experiment. Some plants, like the
TABLE 2. Results of the mixed-effects multiple regression model predicting secondary consumer(predator and parasitoid) phylogenetic diversity (PDpred, PDpara, MPDpred and MPDpara,respectively) by herbivore and plant species richness (SR), herbivore and plant PD, andherbivore and plant abundance-weighted standardized MPD.
Response andpredictor R2
95% CIof effect
Estimated effect onresponse v2 P
PDpred 0.24
PDp �2.3, 3.7 0.7 0.2 0.635MPDp �48.7, 82.0 16.7 0.3 0.617PDherb 0.2, 0.3 0.2 73.1 ,0.001MPDherb �391.0, 71.6 �159.7 1.8 0.175
MPDpred 0.00
PDp 0.00, 0.00 0.00 0.02 0.891MPDp �0.08, 0.04 �0.02 0.52 0.473PDherb 0.00, 0.00 0.00 0.02 0.884MPDherb �0.27, 0.13 �0.07 0.44 0.507
PDpara 0.10
PDp 0.00, 0.00 0.00 1.91 0.167MPDp �0.09, �0.02 �0.05 8.97 0.003PDherb 0.00, 0.00 0.00 0.91 0.340MPDherb �0.10, 0.14 0.02 0.09 0.760
MPDpara 0.03
PDp 0.37, 1.99 1.18 8.13 0.004MPDp �37.96, �13.94 �25.95 17.99 ,0.001PDherb �0.02, 0.00 �0.01 1.84 0.175MPDherb �43.65, 42.34 �0.66 0.00 0.976
Notes: See Table 1 for details on calculating R2, P values, 95% CI, and slope. In this table, year,plant species richness, and herbivore species richness were set as the conditional grouping classes.
TABLE 3. Strength of phylogenetic structuring of herbivores sampled from host-plantmonocultures.
Plant species kest AICkest DAICk¼1 DAICk¼0
Achillea millefolium 0.03 4077.26 427.17 4.51Agropyron smithii 0.90 3731.70 118.55 150.03Amorpha canescens 0.95 4320.45 46.20 308.00Andropogon gerardii 0.88 2540.60 181.78 137.98Asclepias tuberosa 0.71 3681.56 178.72 26.87Elymus canadensis 0.74 3604.05 228.28 43.58Koeleria cristata 0.57 3929.60 320.42 3.65Lespedeza capitata 0.03 3975.72 298.76 0.00Liatris aspera 0.61 3507.51 273.76 12.60Lupinus perennis 0.85 3976.74 148.56 113.84Monarda fisculosa 0.07 4062.22 164.18 3.42Panicum virgatum 0.06 2850.78 259.13 2.99Petalostemum purpurea 0.79 4188.84 143.04 78.68Poa pretensis 0.88 3448.79 193.68 122.74Quercus ellipsoidalis 0.99 3845.83 1.27 408.69Q. macrocarpa 0.99 3434.71 2.74 359.76Schizachyrium scoparium 0.46 3032.78 507.93 5.14Sorghastrum nutans 0.71 3153.21 389.20 40.01
Notes: For the cumulative herbivore assemblage on each plant species, estimated Pagel’s k (kest),the Akaike information criterion (AIC) for the estimated k value, and the difference between theAIC of the kest model and that of Brownian evolution (k¼ 1) and no phylogenetic influence (k¼ 0).In all cases, the best-fit k had the lowest (best) AIC values. We judged models within 2–4 AIC unitsto be equivalent. Values in bold indicate either no significant difference between kest and k ¼ 1(strong phylogenetic signal) or none between kest and k¼ 0 (no phylogenetic signal).
ERIC M. LIND ET AL.1006 Ecology, Vol. 96, No. 4
cool-season grass Koeleria cristata, supported an appar-
ently random selection of arthropods from the broader
metacommunity, while others like the oak species
Quercus ellipsoidalis and Q. macrocarpa, had a much
more phylogenetically clustered arthropod fauna. This
suggests arthropod presence in a Quercusmonoculture is
mediated by strongly phylogentically conserved traits.
This result is notable given that the oak lineage, in
contrast to many of the other plant species included in
the experiment, has evolved combinations of condensed
tannins that herbivores must be able to overcome,
implying strong selection for feeding specialization and
causing strong phylogenetic signal (Feeny 1975, Forkner
et al. 2004). A converse association that supports this
interpretation is that the tissues of the nitrogen-fixing
legume Lespedeza cuneata have relatively high nitrogen
content, a nutritional requirement of all herbivores
which could lead to the phylogenetically non-clustered
consumer communities we found on this species. These
results extend recent work on plant monoculture traits
and herbivory (Loranger et al. 2012), suggesting that
correlated traits associated with palatability may pro-
vide an effective means for predicting the phylogenetic
diversity of herbivores, and greater diversity of plant
palatability traits will support a greater phylogenetic
diversity of herbivores.
Our results also suggest that the phylogenetic
association between herbivores and plants is likely able
to capture the conservatism of unmeasured traits, which
mediate trophic interactions (Rafferty and Ives 2013).
We found that trophic level and body size are strongly
phylogenetically conserved, but one important unmea-
sured arthropod trait is likely to be the diet breadth of
herbivores (Bernays 2001, Castagneyrol et al. 2014).
Many groups of arthropod herbivores are thought to be
specialists, in that they feed on a restricted group of
related plants (Novotny et al. 2006). However, Dyer et
al. (2007) argued specialization differed between the
tropics, where plant defensive chemistry was highly
diverse and promoted specialization, and the temperate
zone, where less diverse phytochemical profiles in host
plants allow herbivore diet generalization. This debate
has largely centered around arthropod herbivores from
long-lived, woody plant species; the role of plant traits in
promoting specialization (and thus diversity) among
grassland arthropods is an area ripe for exploration.
This analysis of an extensive consumer community
phylogeny pushes into new territory, thus uncertainty
associated with our estimate of arthropod phylogeny
deserves consideration. We assembled a community
phylogeny from the published literature of systematics,
in part, because comparable DNA sequence data were
unavailable for our community sample. The assumption
that named taxa (e.g., genera, families, order, etc.) are
monophyletic unless proven otherwise by recent phylo-
genetic study is a source of uncertainty in our tree
topology. Questions also remain about the impact of
uncertainty due to incomplete phylogenetic resolution or
species identification. For example, many genera in our
community sample have yet to be included in a formal,
dated molecular phylogenetic analysis, and some taxa
were not identified to named species. However, even
phylogeny estimates for completely diagnosed species
with comparable DNA data will have error associated
with incomplete taxon sampling and the stochasticity of
molecular evolutionary processes (Zwickl and Hillis
2002). Assumptions about arthropod divergence times,
including the accuracy of fossil-calibrated dates for
FIG. 5. Pairwise correlations among evolutionary distancesbetween plant communities (x-axis), and consumer communi-ties (y-axis) for (a) all arthropods and (b) herbivores only.Points depict MPD between plant and consumer communities,or for each trophic level, the expected evolutionary distancebetween a member picked at random from each communityweighted by local abundance. Mantel tests between the distancematrices give overall correlation; a running mean (loess spline)is shown as a trend line depicting the saturating relationship. Atsome point, pairwise evolutionary distances are high enoughthat any signal from the plants is eroded. As long asphylogenetic beta diversity (phylobeta) of plants is highenough, phylobeta of insects is also very high.
April 2015 1007ARTHROPOD TROPHIC PHYLOGENETICS
particular lineages and otherwise uniform evolutionary
rates among the remainder, is yet another potential
source of error. Exploring each source of error and
potential effects on community phylogenetic analyses is
an important area for future work. In the meantime, and
until a comprehensive tree of life is available (Stoltzfus et
al. 2013), we suggest that our approach, a literature-
based estimate of arthropod phylogeny, represents a
reasonably accurate, pragmatic alternative to inferring
community phylogeny from DNA sequences (Beaulieu
et al. 2012).
The phylogenetic approach we employed revealed that
the probability of herbivore co-occurrence in a given
plot increased with increasing shared evolutionary
history of plant hosts, and herbivores are more closely
related than would be expected at random, indicating a
shared inheritance of feeding association. This lends a
final leg of support to the role of phylogenetic history in
explaining plant–herbivore trophic dynamics (Bernays
2001, Novotny et al. 2006). Likewise, the evolutionary
distance among different plant assemblages predicted
the evolutionary distance among arthropod consumers
as a whole. However, this was a saturating relationship,
such that at some evolutionary distances among host
plants (corresponding roughly to the eudicot–monocot
split), producer relatedness had no further influence on
that of consumers.
In contrast, a more variable set of patterns was
observed for predators and parasitoids, with some
communities defined by highly conserved co-occurrence
patterns but most samples being little different from
random samples of the guild metacommunity. It was
especially surprising that parasitoid assemblages were
not more influenced by phylogeny or correlated with
herbivore phylogenetic diversity, given their intimate life
history with herbivores (Stireman et al. 2006, Bailey et
al. 2009). Instead, the parasitoid assemblage phyloge-
netic diversity was negatively influenced by plant
relatedness, such that on average, higher parasitoid
phylogenetic diversity occurred on the most closely
related plant communities. Predators, on the other hand,
were more phylogenetically diverse with increasing
herbivore phylogenetic diversity, a pattern holding
within each herbivore diversity level. One contributing
explanation to these contrasting patterns is the lower
resolution of the parasitoid phylogenetic tree we used,
which had higher numbers of polytomies than the
corresponding herbivore and predator trees. However,
because predators and parasitoid plot–plot phylobeta
had little correspondence with herbivore phylobeta, it
appears that, at local scales, phylogenetically structured
trophic relationships may be most important for
grassland herbivores.
By synthesizing disparate phylogenetic hypotheses
and fossil evidence into a coherent, dated tree, we were
able to analyze an entire arthropod consumer commu-
nity as well as its trophic components, spanning deep
branches of animal evolution. Overall, arthropod plant–
herbivore interactions are largely reflective of evolution-
ary associations, while higher trophic level associations
within experimental diversity plots differed by guild in
surprising ways. Our results demonstrate that the
evolutionary history of both plants and their consumers
mediates species interactions to generate and maintain
consumer diversity, even at local scales.
ACKNOWLEDGMENTS
We thank David Tilman, Evan Siemann, and John Haarstadfor generating and sharing Cedar Creek data sets, Laura Dillwho collected literature and data for the phylogeny, and WillPearse for suggestions on the analysis. This work would nothave been possible without the committed efforts of JohnHaarstad (1946–2008), in particular, for sampling and identi-fying the arthropods of Cedar Creek. This work was funded, inpart, by the University of Minnesota and NSF grants DEB-1042132 (to E. Borer and E. Seabloom) and DEB-1234162 (toCedar Creek LTER).
LITERATURE CITED
Bailey, R., K. Schonrogge, J. M. Cook, G. Melika, G. Csoka,C. Thuroczy, and G. N. Stone. 2009. Host niches anddefensive extended phenotypes structure parasitoid waspcommunities. PLoS Biology 7:e1000179.
Basset, Y., et al. 2012. Arthropod diversity in a tropical forest.Science 338:1481–1484.
Beaulieu, J. M., R. H. Ree, J. Cavender-Bares, G. D. Weiblen,and M. J. Donoghue. 2012. Synthesizing phylogeneticknowledge for ecological research. Ecology 93(Supplement):S4–S13.
Bernays, E. A. 2001. Neural limitations in phytophagousinsects: implications for diet breadth and evolution of hostaffiliation. Annual Review of Entomology 46:703–727.
Blomberg, S. P., T. Garland, and A. R. Ives. 2003. Testing forphylogenetic signal in comparative data: behavioral traits aremore labile. Evolution 57:717–745.
Borer, E. T., E. W. Seabloom, and D. Tilman. 2012. Plantdiversity controls arthropod biomass and temporal stability.Ecology Letters 15:1457–1464.
Cadotte, M. W., J. Cavender-Bares, D. Tilman, and T. H.Oakley. 2009. Using phylogenetic, functional and traitdiversity to understand patterns of plant communityproductivity. PLoS ONE 4:e5695.
Castagneyrol, B., H. Jactel, C. Vacher, E. G. Brockerhoff, andJ. Koricheva. 2014. Effects of plant phylogenetic diversity onherbivory depend on herbivore specialization. Journal ofApplied Ecology 51:134–141.
Cavender-Bares, J., D. D. Ackerly, D. A. Baum, and F. A.Bazzaz. 2004. Phylogenetic overdispersion in Floridian oakcommunities. American Naturalist 163:823–843.
Cavender-Bares, J., K. Kozak, P. Fine, and S. Kembel. 2009.The merging of community ecology and phylogeneticbiology. Ecology Letters 12:693–715.
Dinnage, R., M. W. Cadotte, N. M. Haddad, G. M. Crutsinger,and D. Tilman. 2012. Diversity of plant evolutionary lineagespromotes arthropod diversity. Ecology Letters 15:1308–1317.
Dyer, L., et al. 2007. Host specificity of Lepidoptera in tropicaland temperate forests. Nature 448:696–699.
Ehrlich, P. R., and P. H. Raven. 1964. Butterflies and plants: astudy in coevolution. Evolution 18:586–608.
Faith, D. 1992. Conservation evaluation and phylogeneticdiversity. Biological Conservation 61:1–10.
Farrell, B. D. 1998. ‘‘Inordinate fondness’’ explained: why arethere so many beetles? Science 281:555–559.
Feeny, P. 1975. Biochemical coevolution between plants andtheir insect herbivores. Pages 3–19 in L. E. Gilbert and P. H.Raven, editors. Coevolution of animals and plants. Univer-sity of Texas Press, Austin, Texas, USA.
ERIC M. LIND ET AL.1008 Ecology, Vol. 96, No. 4
Fine, P. V. A., Z. J. Miller, I. Mesones, S. Irazuzta, H. M.Appel, M. H. H. Stevens, I. Saaksjarvi, L. C. Schultz, andP. D. Coley. 2006. The growth–defense trade-off and habitatspecialization by plants in Amazonian forests. Ecology87(Supplement):S150–S162.
Forkner, R. E., R. J. Marquis, and J. T. Lill. 2004. Feenyrevisited: condensed tannins as anti-herbivore defences inleaf-chewing herbivore communities of Quercus. EcologicalEntomology 29:174–187.
Fritz, S. A., and A. Purvis. 2010. Selectivity in mammalianextinction risk and threat types: a new measure ofphylogenetic signal strength in binary traits. ConservationBiology 24:1042–1051.
Grimaldi, D., and M. S. Engel. 2006. The evolution of theinsects. Cambridge University Press, New York, New York,USA.
Haddad, N., G. Crutsinger, K. Gross, J. Haarstad, J. Knops,and D. Tilman. 2009. Plant species loss decreases arthropoddiversity and shifts trophic structure. Ecology Letters 12:1029–1039.
Harmon, L. J., J. T. Weir, C. D. Brock, R. E. Glor, and W.Challenger. 2008. GEIGER: investigating evolutionary radi-ations. Bioinformatics 24:129–131.
Helmus, M. R., W. Keller, M. J. Paterson, N. D. Yan, C. H.Cannon, and J. A. Rusak. 2010. Communities contain closelyrelated species during ecosystem disturbance. Ecology Letters13:162–174.
Hrcek, J., S. E. Miller, D. L. J. Quicke, and M. A. Smith. 2011.Molecular detection of trophic links in a complex insect host–parasitoid food web. Molecular Ecology Resources 11:786–794.
Kembel, S. W., P. D. Cowan, M. R. Helmus, W. K. Cornwell,H. Morlon, D. D. Ackerly, S. P. Blomberg, and C. O. Webb.2010. Picante: R tools for integrating phylogenies andecology. Bioinformatics 26:1463–1464.
Loranger, J., S. T. Meyer, B. Shipley, J. Kattge, H. Loranger,C. Roscher, and W. W. Weisser. 2012. Predicting inverte-brate herbivory from plant traits: evidence from 51 grasslandspecies in experimental monocultures. Ecology 93:2674–2682.
Mitter, C., B. Farrell, and D. Futuyma. 1991. Phylogeneticstudies of insect plant interactions–insights into the genesis ofdiversity. Trends in Ecology and Evolution 6:290–293.
Nakagawa, S., and H. Schielzeth. 2013. A general and simplemethod for obtaining R2 from generalized linear mixed-effects models. Methods in Ecology and Evolution 4:133–142.
Ness, J. H., E. J. Rollinson, and K. D. Whitney. 2011.Phylogenetic distance can predict susceptibility to attack bynatural enemies. Oikos 120:1327–1334.
Novotny, V., P. Drozd, S. E. Miller, M. Kulfan, M. Janda, Y.Basset, and G. D. Weiblen. 2006. Why are there so manyspecies of herbivorous insects in tropical rainforests? Science313:1115–1118.
Orme, D., R. Freckleton, G. Thomas, T. Petzoldt, S. Fritz, N.Isaac, and W. Pearse. 2012. caper: comparative analyses ofphylogenetics and evolution in R. http://cran.r-project.org/web/packages/caper/index.html
Pagel, M. 1999. The maximum likelihood approach toreconstructing ancestral character states of discrete charac-ters on phylogenies. Systematic Biology 48:612–622.
Pellissier, L., C. Ndiribe, A. Dubuis, J. N. Pradervand, N.Salamin, A. Guisan, and S. Rasmann. 2013. Turnover of
plant lineages shapes herbivore phylogenetic beta diversityalong ecological gradients. Ecology Letters 16:600–608.
R Development Core Team. 2011. R: A language andenvironment for statistical computing. R Foundation forStatistical Computing, Vienna, Austria. www.r-project.org
Rafferty, N. E., and A. R. Ives. 2013. Phylogenetic trait-basedanalyses of ecological networks. Ecology 94:2321–2333.
Regier, J. C., J. W. Shultz, A. Zwick, A. Hussey, B. Ball, R.Wetzer, J. W. Martin, and C. W. Cunningham. 2010.Arthropod relationships revealed by phylogenomic analysisof nuclear protein-coding sequences. Nature 463:1079–1083.
Rzanny, M., and W. Voigt. 2012. Complexity of multitrophicinteractions in a grassland ecosystem depends on plantspecies diversity. Journal of Animal Ecology 81:614–627.
Siemann, E., J. Haarstad, and D. Tilman. 1997. Short-term andlong-term effects of burning on oak savanna arthropods.American Midland Naturalist 137:349–361.
Siemann, E., D. Tilman, J. Haarstad, and M. Ritchie. 1998.Experimental tests of the dependence of arthropod diversityon plant diversity. American Naturalist 152:738–750.
Stireman, J. O., J. D. Nason, S. B. Heard, and J. M. Seehawer.2006. Cascading host-associated genetic differentiation inparasitoids of phytophagous insects. Proceedings of theRoyal Society B 273:523–530.
Stoltzfus, A., et al. 2013. Phylotastic! Making tree-of-lifeknowledge accessible, reusable and convenient. BMC Bio-informatics 14:158.
Strauss, S. Y., C. O. Webb, and N. Salamin. 2006. Exotic taxaless related to native species are more invasive. Proceedingsof the National Academy of Sciences USA 103:5841–5845.
Tilman, D. 1996. Biodiversity: population versus ecosystemstability. Ecology 77:350–363.
Tilmon, K., editor. 2008. Specialization, speciation, andradiation. University of California Press, Berkeley, Califor-nia, USA.
Trautwein, M. D., B. M. Wiegmann, R. Beutel, K. M. Kjer,and D. K. Yeates. 2012. Advances in insect phylogeny at thedawn of the postgenomic era. Annual Review of Entomology57:449–468.
Webb, C. O., D. D. Ackerly, and S. W. Kembel. 2008.Phylocom: software for the analysis of phylogenetic commu-nity structure and trait evolution. Bioinformatics 24:2098–2100.
Webb, C. O., D. D. Ackerly, M. A. McPeek, and M. J.Donoghue. 2002. Phylogenies and community ecology.Annual Review of Ecology and Systematics 33:475–505.
Weiblen, G. D., C. O. Webb, V. Novotny, Y. Basset, and S. E.Miller. 2006. Phylogenetic dispersion of host use in a tropicalinsect herbivore community. Ecology 87(Supplement):S62–S75.
Whitfeld, T. J. S., W. J. Kress, D. L. Erickson, and G. D.Weiblen. 2012a. Change in community phylogenetic struc-ture during tropical forest succession: evidence from NewGuinea. Ecography 35:821–830.
Whitfeld, T. J. S., V. Novotny, S. E. Miller, J. Hrcek, P. Klimes,and G. D. Weiblen. 2012b. Predicting tropical insectherbivore abundance from host plant traits and phylogeny.Ecology 93(Supplement):S211–S222.
Zwickl, D. J., and D. M. Hillis. 2002. Increased taxon samplinggreatly reduces phylogenetic error. Systematic Biology 51:588–598.
SUPPLEMENTAL MATERIAL
Ecological Archives
The Appendix and Supplement are available online: http://dx.doi.org/10.1890/14-0784.1.sm
April 2015 1009ARTHROPOD TROPHIC PHYLOGENETICS
![[MP] 02 - Phylogenetics - biologia.campusnet.unito.it · Molecular Phylogenetics Basis of Molecular Phylogenies Overview ¾Phylogenetics Definitions ¾Genetic Variation and Evolution](https://img.dokumen.tips/doc/110x75/5c6216d809d3f238158b4601/mp-02-phylogenetics-molecular-phylogenetics-basis-of-molecular-phylogenies.jpg)