Embed Size (px)
Citation preview

Ecology, 93(12), 2012, pp. 2719–2727� 2012 by the Ecological Society of America
‘‘Trophic overyielding’’: Phytoplankton diversity promoteszooplankton productivity
MAREN STRIEBEL,1,2,6 GABRIEL SINGER,2,3 HERWIG STIBOR,4,5 AND TOM ANDERSEN1
1Department of Biology, University of Oslo, P.O. Box 1066, Blindern, 0316 Oslo, Norway2WasserCluster Lunz, Dr. Carl-Kupelwieser-Promenade 5, 3293 Lunz am See, Austria
3Department of Limnology, University of Vienna, Althanstrasse 14, 1090 Vienna, Austria4Department Biology II, Ludwig-Maximilians University Munich, Grosshaderner Strasse 2, 82152 Planegg-Martinsried, Germany
5European Institute for Marine Studies, Technopole Brest-Iroise, Plouzane, France
Abstract. Diversity–productivity relationships at the primary producer level have beenextensively studied, especially for terrestrial systems. Here, we explore whether the diversity ofaquatic primary producers (phytoplankton) has effects on higher trophic levels (zooplankton).We investigated the effect of phytoplankton diversity on an artificial zooplankton communityin a laboratory experiment where phytoplankton biomass and elemental composition (carbon-to-phosphorus ratio) were kept constant. Phytoplankton diversity increased the means of bothzooplankton growth rate and abundance while suppressing their variability, and sustainedhigher zooplankton diversity. Likely explanations include resource complementarity effectsamong phytoplankton species as food entities, as well as niche complementarity effects amongDaphnia species as competitors. By affecting the productivity as well as the variability of thenext trophic level, biodiversity of primary producers may have far-reaching consequences inaquatic food webs.
Key words: biodiversity; complementarity; facilitation; plankton; predictability; productivity; reliabil-ity; trophic transfer.
INTRODUCTION
The basic idea of diversity–productivity relationships
dates back to Darwin (1859) who observed that greater
plant diversity leads to greater primary productivity, an
observation that was later experimentally supported by
Tilman et al. (1996) and Hector et al. (1999) in the same
type of grassland system. Until today, grassland
communities remain the ecosystems where most exper-
iments targeting the relationships between diversity and
productivity have been done (Hector et al. 1999, Tilman
et al. 2001, Hooper and Dukes 2004). Consequently, our
current knowledge about diversity–productivity rela-
tionships is much limited to primary producers in
terrestrial systems. This seems a serious shortcoming,
given that 50% of primary production on earth occurs in
aquatic environments (Falkowski et al. 1998) and
considering the high diversity often encountered at the
base of aquatic ecosystems (Hutchinson 1961). Aquatic
communities are also characterized by short generation
times and efficient trophic transfer (Sommer et al. 1986)
along potentially long food chains (Post et al. 2000).
These characteristics turn aquatic ecosystems into the
obvious place to test if diversity at the level of primary
producers has effects on productivity at higher trophic
levels.
Among the mechanisms proposed to explain the
positive effects of diversity on productivity at a single
trophic level are niche complementarity (i.e., resource
use partitioning), facilitative mechanisms and/or sam-
pling effects (Srivastava and Vellend 2005). Niche
complementarity occurs when differentiation in individ-
ual traits allows a diverse community to use resources
more efficiently, thus leading to higher community
productivity. Facilitation describes a positive effect of
a species on the functional capability of another species,
which may again result in better performance of the
mixture compared to monocultures. The sampling effect
refers to the increased probability of including a
particularly productive species when the total number
of species increases. These mechanisms may result in
overyielding; a term used when multi-species assemblag-
es perform better than expected from the performances
of its member species in monoculture (Hector et al.
2002).
When considering only the quantity of resources
available to consumers, overyielding of the primary
producer community may result in a simple bottom-up
driven increased consumer productivity. However, the
increased resource use efficiency in a functionally diverse
primary producer assemblage may also have negative
consequences for consumers by decreasing the stoichio-
metric quality of their food, i.e., increasing the mismatch
in nutrient stoichiometry between autotrophs and
zooplankton consumers (Andersen and Hessen 1991,
Main et al. 1997, Elser et al. 2000). For example, in a
Manuscript received 2 January 2012; revised 19 April 2012;accepted 12 July 2012. Corresponding Editor: E. van Donk.
6 E-mail: [email protected]
2719

phytoplankton community, an increase of functional
diversity in terms of photosynthetic pigments was shown
to not only increase phytoplankton productivity but also
influence its biomass stoichiometry (Striebel et al.
2009a, b). Thus, for a reductionist test of the effect of
primary producer diversity on zooplankton productiv-
ity, food quantity and stoichiometric quality must be
kept constant.
We performed a laboratory experiment with a diverse
zooplankton community (different Daphnia species)
under controlled food conditions where phytoplankton
biodiversity was manipulated while food quantity and
food quality in terms of biomass stoichiometry were
attempted to be maintained constant. Daphnia was
chosen due to its non-selective feeding nature, which
helps to avoid additional difficulties like specific
selection of food.
METHODS
We used an initial zooplankton community composed
of two individuals of each of three Daphnia species
originating from lakes and ponds in Germany, and fed
them with artificial phytoplankton communities of
differing biodiversity. The three zooplankton species
were Daphnia magna, Daphnia similis, and Daphnia
hyalina (all clones from Munich). The zooplankters were
kept in 500 mL Daphnia medium (Kluttgen et al. 1994),
and transferred to fresh medium every third day to
minimize growth of bacteria and algae. A constant
amount of food (0.4 mg C/L) was added every day. We
maintained a constant temperature (228C) and light (100
lmol photons�m�2�s�1) during the entire experiment.
Abundance and biomass (based on carbon measured by
combustion and infrared spectrometry; C-Mat 5500;
Strohlein, Korschenbroich, Germany) for the three
Daphnia species were determined from aliquots at the
beginning and from all experimental units at the end of
the experiment (i.e., after three weeks). Specific carbon-
based growth rates of zooplankters (averages for whole
communities) were calculated as ln ([Cend/Cinit]/[Tend �Tinit]), where Cend is the zooplankton carbon concentra-
tion (in mg) at the end of the experiment, Cinit the
zooplankton carbon concentration (in mg) at the
beginning, and (Tend � Tinit) the duration of the
experiment in days. Daphnia diversity was expressed as
the Shannon diversity number [exp(H ), i.e., the effective
number of species (Jost 2006)] of Daphnia biomass:
expðHÞ ¼ exp �XD
d¼1
pdlnðpdÞ !
with pd ¼Bd
XD
d¼1
Bd
where pd is the relative biomass B of surviving Daphnia
species d, and D is maximally 3.
Artificial phytoplankton communities with identical
total biovolume (equivalent to 0.4 mg C/L) but different
biodiversity (1–10 species) were used as food for our
zooplankton communities. Species were added as equal
biovolume contributions (5.0 3 106 lm3/mL) in all the
artificial phytoplankton communities. The 12 different
phytoplankton strains used in this experiment were pre-
cultivated as monocultures in semi-batch cultures (10%exchange per day) with standardized growth medium(WC-medium after Guillard and Lorenzen 1972) for
months. Biovolume concentrations of all phytoplankton
cultures were determined daily during the experiment
using an electronic particle counter (CASY counter;
Scharfe Systems, Reutlingen, Germany). Artificial phy-
toplankton communities were randomly assembled fromthis total pool of 12 species. We used 10 different
mixtures of 2, 4, 7, and 10 species and all 12
monocultures yielding a total of 52 phytoplankton–food
combinations as replicates for a regression approach (see
Appendix: Table A1 for exact food composition).
Particulate organic carbon (POC) and particulatephosphorus (PP) concentrations of the resulting food
mixtures were determined three times during the
experiment for control purposes. This was done by
filtration of samples onto precombusted and acid-
washed glass-fiber filters (Whatman GF/F) followed
by combustion and infrared spectrometry (C-Mat 5500,Strohlein) to determine POC, and by molybdate reaction
after sulfuric acid digestion (Wetzel and Likens 2003) to
measure PP. Mean food POC was 0.4 6 0.01 mg C/L
(mean 6 SE) and mean food PP was 3.6 6 0.24 lg P/L,
resulting in a mean molar C:P ratio of 115.8 6 3.4
during the experiment.
Since all phytoplankton species were added to multi-species food treatments at known (equal) biovolumes, it
was possible to compute a predicted Daphnia growth
rate for each multi-species diet as the average growth
rate observed for the corresponding monoculture foods.
To describe effects of phytoplankton community diver-
sity on Daphnia growth rate we plotted the observed
Daphnia growth rate against the predicted growth rate.In the same manner, we computed predicted abundances
from monoculture data.
Daphnia diversity was predicted from monoculture
data by first summing up species-specific abundances
across the respective monocultures used in a mixture,
followed by computing exp(H )pred once from the
cumulative distribution
expðHÞpred ¼ exp �XD
d¼1
pcumdlnðpcumdÞ !
with
pcumd ¼
XM
m¼1
Bd;m
XM
m¼1
XD
d¼1
Bd;m
where pcumd is the relative abundance of Daphnia
species d cumulated across M monocultures.
The question of Daphnia species niche preferences was
also pursued in a combined analysis of community
compositions of the phytoplankton treatments and the
MAREN STRIEBEL ET AL.2720 Ecology, Vol. 93, No. 12

surviving Daphnia communities using a dissimilarity-
based approach. For this purpose, pairwise dissimilarity
between two phytoplankton communities was computed
by the Jaccard coefficient (Legendre and Legendre 1998),
i.e., based on presence/absence of the various phyto-
plankton species and assuming equal biomass contribu-
tion. For surviving Daphnia communities, pairwise
dissimilarities were computed based on the abundance
and biomass distributions at the end of experiments by
the Bray-Curtis dissimilarity index (Bray and Curtis
1957). We then tested for existence of an association
between phytoplankton and zooplankton community
compositions using a Mantel test (Manly 2006).
It was evident that the variability in the Daphnia
responses to the food treatment gradient of increasing
phytoplankton species richness decreased systematically
with increasing species richness of the phytoplankton
prey community. Since decreasing variance with increas-
ing mean cannot be alleviated by standard transforma-
tions, we used a more general approach where both
mean and variance can be modeled as linear functions of
the explanatory variables (Rigby and Stasinopoulos
2005) using the GAMLSS package in R (generalized
additive models for location, scale, and shape; R
Development Core Team 2011). We thereby modeled
Daphnia biomass or growth rate as linear functions of
phytoplankton diversity, but with a non-constant
variance log-linearly related to the same explanatory
variable. This gave a model with 4 degrees of freedom
(instead of 3 for a linear regression with a constant
variance), which is fitted by maximum likelihood instead
of ordinary least squares. Competing GAMLSS models
can be compared using the Akaike information criterion
(AIC) in the same manner as ordinary linear models.
RESULTS
The food supply rate (i.e., POC, daily addition of 0.4
mg C/L) and stoichiometric food quality (PP and C:P)
were attempted to be maintained constant across all
food treatments and throughout the duration of the
experiment. While their means did not show any trend
along the food treatment gradient of phytoplankton
diversities, their variances decreased significantly with
increasing phytoplankton species richness within the
implemented GAMLSS models (Appendix: Table A2
and Fig. A1). We found no significant relationship
between Daphnia growth rates and POC, PP, nor molar
C:P ratios (Fig. 1), in agreement with our experimental
planning. Similarly, no relationships of food quantity or
quality indicators were found with Daphnia abundance
or Daphnia diversity (data not shown).
However, Daphnia growth rate was significantly
related to phytoplankton species richness (Fig. 2a) and
increased by 0.0017 6 0.0004 d�1 (mean slope 6 SE) per
phytoplankton species added, while the variance in
growth rate decreased by 14.7% per phytoplankton
species added (95% confidence interval [CI]:
9.5%�19.7%). The model with variable variance was
substantially better (AIC ¼ �304.9) than one with
constant variance (AIC ¼ �281.8). When predicting
Daphnia growth rate for the experiments with higher
phytoplankton species richness from growth on mono-
cultures (Fig. 2b), we found no increase of Daphnia
growth rate with increasing phytoplankton species
richness (slope �0.0003 6 0.00069, P ¼ 0.66), but a
decrease in variance by 8.7% per added species (CI ¼2.1%–14.9%). Also in this case, the model with variable
variance was better (AIC ¼ �268.6) than one with
constant variance (AIC ¼�263.9). Confidence intervals
for the regression coefficient for a variable variance
overlapped for the observed and predicted Daphnia
growth rate models, thus indicating no significant
difference in the variance trend.
Daphnia abundance (Fig. 2c) increased by 7.3 6 2.8
individuals/L per phytoplankton species added, while its
variance decreased by 11.3% per phytoplankton species
added (CI ¼ 5.7% �16.6%). The model with variable
variance was substantially better (AIC¼ 602.3) than one
FIG. 1. (a) Food carbon content, (b) food phosphorus content, and (c) food molar C:P ratios related to Daphnia growth rate.Data for food quantity and quality are mean values obtained from three measurements during the experiment.
December 2012 2721TROPHIC OVERYIELDING

with constant variance (AIC ¼ 614.4). Here too,
predicted Daphnia abundance (Fig. 2d) showed no
increase of the mean Daphnia abundance with increasing
phytoplankton species richness (slope 0.12 6 1.95, P ¼0.95), but a decrease in variance by 17.8% per added
species (CI ¼ 12.2%�23.1%). The model with variable
variance was again better (AIC¼ 564.14) than one with
constant variance (AIC ¼ 592.53.9). Again, confidence
intervals for the regression coefficient for a variable
variance overlapped for the observed and predicted
Daphnia abundance models, thus indicating no signifi-
cant difference in the variance trend.
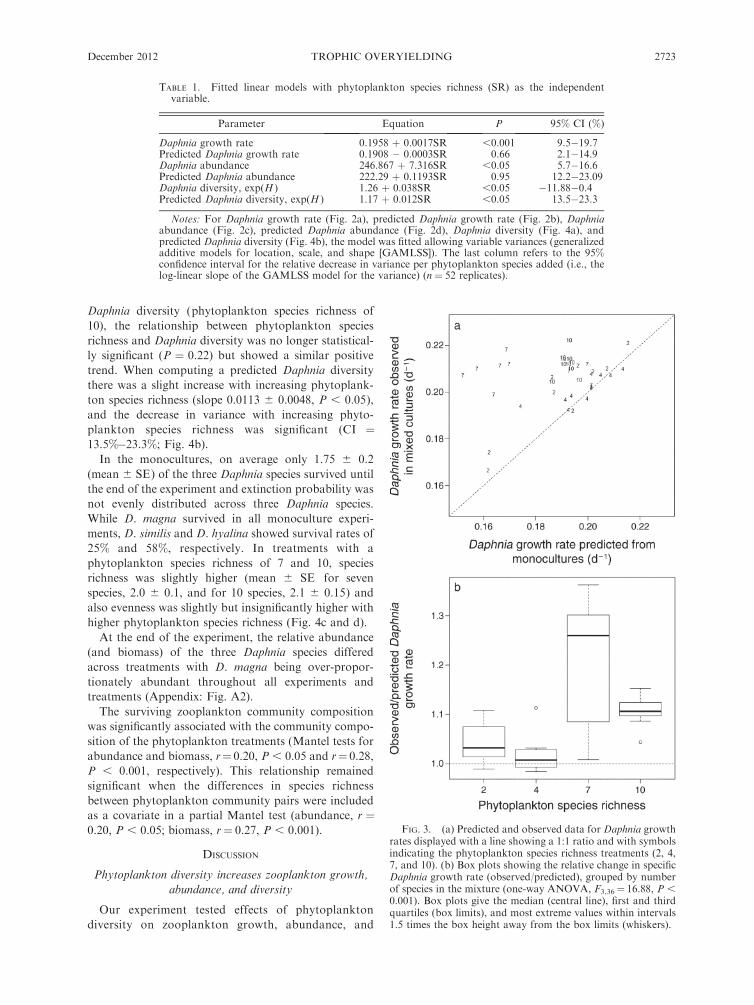
Out of 40, 35 Daphnia growth rates on multi-species
foods were higher than predicted from growth on the
corresponding monoculture diets (Fig. 3a), with the
two- and four-species treatments being closer to the 1:1
line than the seven- and 10-species treatments. We
computed a potential diversity effect on the Daphnia
growth rate as the ratio of observed growth
rate : predicted growth rate. This ratio was significantly
different among the species richness treatments (Fig. 3b;
one-way ANOVA, F3,36 ¼ 16.88, P , 0.001). As
variances were obviously unequal among treatments
(especially the seven-species mixture) we also performed
a nonparametric Kruskal-Wallis test with identical
outcome (v2 ¼ 21.5, P , 0.001). The 95% CI for the
effect sizes (group means) were 0.999–1.087 for two
species, 0.974–1.062 for four species, 1.174–1.262 for
seven species, and 1.061–1.150 for 10 species. Thus,
effect sizes are significantly different from 1 for the
seven- and 10-species mixtures.
Daphnia diversity (exp(H )) significantly increased by
0.038 6 0.016 units per phytoplankton species added
(Fig. 4a). Also here, the model with variable variance
was better (AIC ¼ 42.9) than the one with constant
variance (AIC ¼ 44.6). Excluding the highest value for
FIG. 2. Phytoplankton species richness determines (a) Daphnia growth rate and (c) Daphnia abundance after three weeks ofgrowth. Predicted effects of phytoplankton species richness on (b) Daphnia growth rate and (d) Daphnia abundance are calculatedfrom monoculture data. All data shown were fitted with GAMLSS (generalized additive models for location, scale, and shape)models where the heavy black line represents the conditional expectation and gray lines represent percentiles of the conditionaldistribution. Outermost gray lines correspond to 95% confidence intervals for the fitted conditional distributions. See Table 1 forparameter estimates of the fitted models.
MAREN STRIEBEL ET AL.2722 Ecology, Vol. 93, No. 12
Daphnia diversity (phytoplankton species richness of
10), the relationship between phytoplankton species
richness and Daphnia diversity was no longer statistical-
ly significant (P ¼ 0.22) but showed a similar positive
trend. When computing a predicted Daphnia diversity
there was a slight increase with increasing phytoplank-
ton species richness (slope 0.0113 6 0.0048, P , 0.05),
and the decrease in variance with increasing phyto-
plankton species richness was significant (CI ¼13.5%�23.3%; Fig. 4b).
In the monocultures, on average only 1.75 6 0.2
(mean 6 SE) of the three Daphnia species survived until
the end of the experiment and extinction probability was
not evenly distributed across three Daphnia species.
While D. magna survived in all monoculture experi-
ments, D. similis and D. hyalina showed survival rates of
25% and 58%, respectively. In treatments with a
phytoplankton species richness of 7 and 10, species
richness was slightly higher (mean 6 SE for seven
species, 2.0 6 0.1, and for 10 species, 2.1 6 0.15) and
also evenness was slightly but insignificantly higher with
higher phytoplankton species richness (Fig. 4c and d).
At the end of the experiment, the relative abundance
(and biomass) of the three Daphnia species differed
across treatments with D. magna being over-propor-
tionately abundant throughout all experiments and
treatments (Appendix: Fig. A2).
The surviving zooplankton community composition
was significantly associated with the community compo-
sition of the phytoplankton treatments (Mantel tests for
abundance and biomass, r¼ 0.20, P , 0.05 and r¼ 0.28,
P , 0.001, respectively). This relationship remained
significant when the differences in species richness
between phytoplankton community pairs were included
as a covariate in a partial Mantel test (abundance, r ¼0.20, P , 0.05; biomass, r¼ 0.27, P , 0.001).
DISCUSSION
Phytoplankton diversity increases zooplankton growth,
abundance, and diversity
Our experiment tested effects of phytoplankton
diversity on zooplankton growth, abundance, and
TABLE 1. Fitted linear models with phytoplankton species richness (SR) as the independentvariable.
Parameter Equation P 95% CI (%)
Daphnia growth rate 0.1958 þ 0.0017SR ,0.001 9.5�19.7Predicted Daphnia growth rate 0.1908 � 0.0003SR 0.66 2.1�14.9Daphnia abundance 246.867 þ 7.316SR ,0.05 5.7�16.6Predicted Daphnia abundance 222.29 þ 0.1193SR 0.95 12.2�23.09Daphnia diversity, exp(H ) 1.26 þ 0.038SR ,0.05 �11.88�0.4Predicted Daphnia diversity, exp(H ) 1.17 þ 0.012SR ,0.05 13.5�23.3
Notes: For Daphnia growth rate (Fig. 2a), predicted Daphnia growth rate (Fig. 2b), Daphniaabundance (Fig. 2c), predicted Daphnia abundance (Fig. 2d), Daphnia diversity (Fig. 4a), andpredicted Daphnia diversity (Fig. 4b), the model was fitted allowing variable variances (generalizedadditive models for location, scale, and shape [GAMLSS]). The last column refers to the 95%confidence interval for the relative decrease in variance per phytoplankton species added (i.e., thelog-linear slope of the GAMLSS model for the variance) (n ¼ 52 replicates).
FIG. 3. (a) Predicted and observed data for Daphnia growthrates displayed with a line showing a 1:1 ratio and with symbolsindicating the phytoplankton species richness treatments (2, 4,7, and 10). (b) Box plots showing the relative change in specificDaphnia growth rate (observed/predicted), grouped by numberof species in the mixture (one-way ANOVA, F3,36¼ 16.88, P ,0.001). Box plots give the median (central line), first and thirdquartiles (box limits), and most extreme values within intervals1.5 times the box height away from the box limits (whiskers).
December 2012 2723TROPHIC OVERYIELDING

diversity under constant light conditions. Zooplankton
growth clearly increased with phytoplankton diversity
(Fig. 2a), while it was not related to phytoplankton
biomass or stoichiometry (Fig. 1). Zooplankton growth
rates predicted from monocultures (Fig. 2b) showed no
effect of phytoplankton diversity other than a reduction
in variance due to statistical averaging (Fig. 2b and d).
Similar to zooplankton growth, zooplankton abundance
(Fig. 2c), and Daphnia diversity (Fig. 4a) both increased
with phytoplankton diversity. When using phytoplank-
ton mixtures of more than four species, the Daphnia
communities grew considerably better than predicted
from monocultures (Fig. 3). We interpret this increased
performance of a zooplankton community feeding on a
diverse phytoplankton community (see Plate 1) as trophic
overyielding, i.e., a specific form of overyielding involving
two trophically interacting diverse assemblages. The
main difference from overyielding as defined by Hector
et al. (2010) is that performance is measured at the next
trophic level, i.e., zooplankton growth is considered as
the response function instead of the net primary
productivity of the plant community. Behind this effect,
there could be multiple mechanisms at both trophic
levels. At the phytoplankton level complementarity
among phytoplankton traits with regard to zooplankton
requirements is a likely mechanism; based, for instance,
on the diversity of cell sizes, structures, shapes, and
nutritional content (e.g., fatty acid composition), which
translate into packing density, digestibility, and nutri-
tional quality of phytoplankton species. Multiple phyto-
plankton species, respectively their traits, could also
interact positively to fuel increased function at the next
trophic level, for example in a situation of zooplankton
co-limitation by multiple nutritional components pro-
FIG. 4. Phytoplankton species richness determines (a) Daphnia diversity [exp(H )], (c) Daphnia species richness, and (d) Daphniaevenness. (b) Predicted data for effects of phytoplankton species richness on Daphnia diversity are calculated from monoculturedata. See Table 1 for parameter estimates of the fitted models [panels (a) and (b)]. Data for Daphnia species richness and evennessare displayed as means 6 SE.
MAREN STRIEBEL ET AL.2724 Ecology, Vol. 93, No. 12

vided by different phytoplankton species (Sperfeld et al.
2012). In the light of classically discussed mechanisms for
biodiversity–ecosystem-functioning relationships, we un-
derstand our suggested complementarity at phytoplank-
ton level as inclusive of such potential facilitative
interactions (see also Loreau and Hector 2001). It is also
possible that individual phytoplankton traits translate
into exceptional nutritional value, thereby giving over-
proportional importance to single phytoplankton species
in sustaining zooplankton growth. Further selection of
phytoplankton species during the ingestion process by
zooplankton is possible, but unlikely given the unselec-
tive feeding behavior for Daphnia. Still, such a sampling
or selection effect could indeed play a role in our
experiments, but unfortunately the classical approach
partitioning selection and complementarity (Loreau and
Hector 2001) is not applicable in our situation as we have
no knowledge about phytoplankton species-specific
yields, measured at zooplankton level, for the mixture
food treatments. This would require an idea about the
distribution of ingestion probabilities and knowledge
about actual phytoplankton species-specific absorption
efficiency.
Importantly, these phytoplankton trait-based mecha-
nisms can already beneficially affect single zooplankton
species or even individuals. However, the increased
heterogeneity in zooplankton resource requirements
given by multiple zooplankton species or even just
different life stages of single species may further have
amplified this consumer productivity-enhancing effect
given by phytoplankton traits. Seen from this point of
view, higher phytoplankton diversity is equivalent to
increased resource heterogeneity, i.e., wider niche space,
which can be better exploited by various zooplankters
complementing each other in body sizes, filtration
characteristics and other species- or life-stage-specific
traits. Our results could thus also partly be a conse-
quence of increasingly complementary resource use by
the same (minimally diverse) zooplankton community
along a gradient of increasing resource heterogeneity.
The coexistence of several species competing for several
resources in a heterogeneous environment was predicted
to lead to overyielding (Tilman 1999), and resource
heterogeneity was also empirically shown to lead to
steeper diversity–function relationships (Tylianakis et al.
2008). In our experiment zooplankton diversity showed
a tendency to be maintained to a larger extent in
treatments with higher phytoplankton (Fig. 4a). Evi-
dence for niche separation of the three Daphnia species
along the experimental food gradient of 12 phytoplank-
ton species is given by the increasing trend of mean
predicted diversity with phytoplankton species richness.
This result is also in agreement with the differential
survival of D. similis and D. hyalina in the various
monocultures. The much higher survival rate and
abundances of D. magna at the end of the experiment
may simply be due to higher body size and thus higher
numbers of juvenile offspring. Irrespective of this
competitive advantage of D. magna, a last evidence for
niche separation is provided by the significant relation-
PLATE 1. Diverse phytoplankton community as seen under an inverted microscope. Photo credit: M. Striebel.
December 2012 2725TROPHIC OVERYIELDING

ship of the surviving zooplankton community composi-
tion with the experimental phytoplankton treatments
provided by the Mantel tests. We are confident that
these test results truly reflect an association of commu-
nity compositions between zoo- and phytoplankton, as
results were almost identical when the diversity treat-
ment gradient was accounted for in the respective partial
Mantel tests.
We thus conclude that there is evidence for differences
in Daphnia species traits, which could support comple-
mentarity among Daphnia species as an important
mechanism in our experiment.
Trophic overyielding could thus be based on both a
diverse phytoplankton and a diverse zooplankton
assemblage, whose potentials for complementarity
effects could in fact interact multiplicatively. Our
experimental setup used only one constant zooplankton
assemblage and we are thus unable to separate
complementarity effects based on phytoplankton traits
from those based on zooplankton traits.
The variance in zooplankton growth is affected
by phytoplankton diversity
In our experiment, the variance of the zooplankton
growth rate and the variance of the predicted growth
rate decreased with increasing phytoplankton diversity
(by 14.7% and 8.7% per phytoplankton species added
for growth rate and predicted growth rate, respectively;
Fig. 2a and b). The same pattern existed with respect to
Daphnia abundance; here the variance in observed
abundance decreased by 11.3% per phytoplankton
species added (CI ¼ 5.7–16.6; Fig. 2c) and the variance
in predicted abundance decreased by 17.8% per phyto-
plankton species added (CI ¼ 12.2–23.09, Fig. 2d). A
similar statistical averaging mechanism is also known as
the driver of the ‘‘portfolio effect,’’ which attributes a
higher stability to more diverse communities (Doak et
al. 1998, Tilman 1999). In the context of temporal
variability and stability statistical averaging means that
the coefficient of variation of a group of species is
necessarily less than the average coefficient of variation
of the individual species (Tilman et al. 1998). A temporal
scale was not included in our experiments, but we can
interpret the variance among treatments at the same
diversity level as a measure of ecosystem reliability
(Naeem and Li 1997) or ecosystem predictability, which
is inversely related to temporal and spatial variation of
an ecosystem process (McGrady-Steed et al. 1997).
Then, the observed effect of phytoplankton diversity on
the variability of zooplankton growth suggests a far-
reaching influence of phytoplankton diversity on the
reliability of resource provision along the food chain.
CONCLUSION
Our results show that phytoplankton diversity affects
zooplankton growth. The experiment demonstrated that
when controlling for resource quantity and resource C:P
stoichiometry, phytoplankton diversity per se can be an
important predictor of zooplankton growth rate, thus
constituting an important basal parameter for explain-
ing zooplankton population dynamics. This is in line
with previous studies (Tilman 1999) that have proposed
to include biodiversity in addition to disturbance,
nutrient supply, and climate as major controllers of
population and ecosystem dynamics. Furthermore, we
were able to reveal in an experimental setup what Yachi
and Loreau (1999) showed theoretically; we found (1) a
buffering effect, a reduction in variance in zooplankton
growth and abundance with increasing phytoplankton
diversity, and (2) a performance-enhancing effect, an
increase of the mean growth rate, abundance, and
diversity of zooplankton with increasing phytoplankton
diversity. Thus, by affecting the productivity as well as
the variability of the next trophic level, biodiversity of
primary producers may have far-reaching consequences
within the whole food web. As most experimental
studies dealing with the relationship between diversity
and ecosystem functions cover a narrow range of
richness relative to natural variation due to methodo-
logical constraints on manipulating large numbers of
species (Cottingham et al. 2001), a major future
challenge is to determine how biodiversity dynamics,
ecosystem processes, and abiotic factors interact in
natural and/or large scale systems as first examples
demonstrate (see, e.g., Ptacnik et al. 2008, 2010).
ACKNOWLEDGMENTS
This study was supported by funding from the NorwegianResearch Council (project COMSAT; 196336/S30) and apersonal grant for M. Striebel from the DAAD. We thankMechthild Kredler, Margit Feibel, Angelika Wild, and AchimWeigert for technical support and Sabine Dietrich for helpduring the experiment.
LITERATURE CITED
Andersen, T., and D. O. Hessen. 1991. Carbon, nitrogen, andphosphorus-content of fresh-water zooplankton. Limnologyand Oceanography 36:807–814.
Bray, R. J., and J. T. Curtis. 1957. An ordination of the uplandforest communities of southern Wisconsin. EcologicalMonographs 27:325–349.
Cottingham, K. L., B. L. Brown, and J. T. Lennon. 2001.Biodiversity may regulate the temporal variability ofecological systems. Ecology Letters 4:72–85.
Darwin, C. 1859. On the origin of species by means of naturalselection, or the preservation of favoured races in the strugglefor life. First edition. John Murray, London, UK.
Doak, D. F., D. Bigger, E. K. Harding, M. A. Marvier, R. E.O’Malley, and D. Thomson. 1998. The statistical inevitabilityof stability–diversity relationships in community ecology.American Naturalist 151:264–276.
Elser, J. J., W. F. Fagan, R. F. Denno, D. R. Dobberfuhl, A.Folarin, A. Huberty, S. Interlandi, S. S. Kilham, E.McCauley, K. L. Schulz, E. H. Siemann, and R. W. Sterner.2000. Nutritional constraints in terrestrial and freshwaterfood webs. Nature 408:578–580.
Falkowski, P. G., R. T. Barber, and V. Smetacek. 1998.Biogeochemical controls and feedbacks on ocean primaryproduction. Science 281:200–206.
Guillard, R. R., and C. J. Lorenzen. 1972. Yellow-green algaewith chlorophyllide c. Journal of Phycology 8:10–14.
MAREN STRIEBEL ET AL.2726 Ecology, Vol. 93, No. 12

Hector, A., E. Bazeley-White, M. Loreau, S. Otway, and B.Schmid. 2002. Overyielding in grassland communities: testingthe sampling effect hypothesis with replicated biodiversityexperiments. Ecology Letters 5:502–511.
Hector, A., et al. 1999. Plant diversity and productivityexperiments in European grasslands. Science 286:1123–1127.
Hector, A., et al. 2010. General stabilizing effects of plantdiversity on grassland productivity through populationasynchrony and overyielding. Ecology 91:2213–2220.
Hooper, D. U., and J. S. Dukes. 2004. Overyielding amongplant functional groups in a long-term experiment. EcologyLetters 7:95–105.
Hutchinson, G. E. 1961. The paradox of the plankton.American Naturalist 95:137–145.
Jost, L. 2006. Entropy and diversity. Oikos 113:363–375.Kluttgen, B., U. Dulmer, M. Engels, and H. Ratte. 1994.ADaM, an artificial freshwater for the culture of zooplank-ton. Water Research 28:743–746.
Legendre, P., and L. Legendre. 1998. Numerical ecology. Secondedition. Elsevier Science, Amsterdam, The Netherlands.
Loreau, M., and A. Hector. 2001. Partitioning selection andcomplementarity in biodiversity experiments. Nature413:548.
Main, T. M., D. R. Dobberfuhl, and J. J. Elser. 1997. N:Pstoichiometry and ontogeny of crustacean zooplankton: Atest of the growth rate hypothesis. Limnology and Oceanog-raphy 42:1474–1478.
Manly, B. F. J. 2006. Randomization, bootstrap and MonteCarlo methods in biology. Third edition. Chapmann andHall, London, UK.
McGrady-Steed, J., P. M. Harris, and P. J. Morin. 1997.Biodiversity regulates ecosystem predictability. Nature390:162–165.
Naeem, S., and S. Li. 1997. Biodiversity enhances ecosystemreliability. Nature 390:507–509.
Post, D. M., M. L. Pace, and N. G. J. Hairston. 2000.Ecosystem size determines food-chain length in lakes. Nature405:1047–1049.
Ptacnik, R., T. Andersen, P. Brettum, L. Lepisto, and E.Willen. 2010. Regional species pools control communitysaturation in lake phytoplankton. Proceedings of the RoyalSociety B 277:3755–3764.
Ptacnik, R., A. Solimini, T. Andersen, T. Tamminen, P.Brettum, L. Lepisto, E. Willen, and S. Rekolainen. 2008.Diversity predicts stability and resource use efficiency innatural phytoplankton communities. Proceedings of theNational Academy of Sciences USA 105:5134–5138.
R Development Core Team. 2011. R: a language andenvironment for statistical computing. R Project for Statis-tical Computing, Vienna, Austria. www.R-project.org
Rigby, R. A., and D. M. Stasinopoulos. 2005. Generalizedadditive models for location, scale and shape (with discus-sion). Journal of the Royal Statistical Society 54:507–554.
Sommer, U., Z. M. Gliwicz, W. Lampert, and A. Duncan. 1986.The PEG-model of seasonal succession of planktonic eventsin fresh waters. Archiv fur Hydrobiologie 106:433–471.
Sperfeld, E., D. Martin-Creuzburg, and A. Wacker. 2012.Multiple resource limitation theory applied to herbivorousconsumers: Liebig’s minimum rule vs. interactive co-limita-tion. Ecology Letters 15:142–150.
Srivastava, D. S., and M. Vellend. 2005. Biodiversity-ecosystemfunction research: Is it relevant to conservation? AnnualReview of Ecology, Evolution, and Systematics 36:267–294.
Striebel, M., S. Behl, S. Diehl, and H. Stibor. 2009a. Spectralniche complementarity and carbon dynamics in pelagicecosystems. American Naturalist 174:141–147.
Striebel, M., S. Behl, and H. Stibor. 2009b. The coupling ofbiodiversity and productivity in phytoplankton communities:consequences for biomass stoichiometry. Ecology 90:2025–2031.
Tilman, D. 1999. The ecological consequences of changes inbiodiversity: a search for general principles. Ecology80:1455–1474.
Tilman, D., C. L. Lehman, and C. E. Bristow. 1998. Diversity–stability relationships: statistical inevitability or ecologicalconsequence? American Naturalist 151:277–282.
Tilman, D., P. B. Reich, J. Knops, D. Wedin, T. Mielke, and C.Lehman. 2001. Diversity and productivity in a long-termgrassland experiment. Science 294:843–845.
Tilman, D., D. Wedin, and J. Knops. 1996. Productivity andsustainability influenced by biodiversity in grassland ecosys-tems. Nature 379:718–720.
Tylianakis, J. M., T. A. Rand, A. Kahmen, A.-M. Klein, N.Buchmann, J. Perner, and T. Tscharntke. 2008. Resourceheterogeneity moderates the biodiversity–function relation-ship in real world ecosystems. PLoS Biology 6:e122.
Wetzel, R. G., and G. E. Likens. 2003. Limnological analyses.Springer-Verlag, Berlin, Germany.
Yachi, S., and M. Loreau. 1999. Biodiversity and ecosystemproductivity in a fluctuating environment: the insurancehypothesis. Proceedings of the National Academy of SciencesUSA 96:1463–1468.
SUPPLEMENTAL MATERIAL
Appendix
A table summarizing all experimental treatments and main characteristics of the algae used as food for our experiment; a tableshowing carbon biomass, phosphorus content, and stoichiometry of the phytoplankton communities; a figure showingphytoplankton richness related to POC, POC predicted, PP, PP predicted, C:P, and C:P predicted; and a figure showing averagezooplankton community composition at the outcome of the experiment as stacked bar plots for each phytoplankton diversitytreatment (Ecological Archives E093-252-A1).
December 2012 2727TROPHIC OVERYIELDING