Embed Size (px)
Citation preview

Available online at www.sciencedirect.com
www.elsevier.com/locate/gca
ScienceDirect
Geochimica et Cosmochimica Acta 248 (2019) 185–209
Triple oxygen and hydrogen isotopic study ofhydrothermally altered rocks from the 2.43–2.41 Ga Vetreny
belt, Russia: An insight into the early Paleoproterozoic seawater
D.O. Zakharov ⇑, I.N. Bindeman
Department of Earth Sciences, 1272 University of Oregon, Eugene, OR 97403, USA
Received 25 May 2018; accepted in revised form 6 January 2019; Available online 14 January 2019
Abstract
The early Paleoproterozoic represents a period of rapid changes in Earth systems that could have affected the stable iso-topic composition of seawater. The well-preserved pillow structures, hyaloclastites and komatiitic basalts of the 2.43–2.41 GaVetreny belt, Baltic Shield provide a record of high-temperature water-rock interaction induced by contemporaneous seawa-ter. Here we present results of mineralogical, fluid inclusion, hydrogen, and triple oxygen isotopic analysis of hydrothermalalteration products. Emphasis is given to vein-filling quartz and epidote as they likely formed at high water-rock ratios. Tenminerals pairs, quartz-epidote and quartz-calcite, returned temperatures of isotopic equilibrium between 286 and 387 �C,which compares well to the homogenization temperatures measured for saline fluid inclusions hosted in vein quartz. The com-puted dD and d18O values of equilibrium fluids range between �31 and +12‰, and �1.36 and +3.20‰, respectively, whichoverlap with the isotopic composition of ice-free world seawater and fluids generated at submarine hydrothermal systems.This is the earliest piece of evidence suggesting that early Paleoproterozoic seawater had a dD value close to 0‰. We alsopresent triple oxygen isotopic composition of quartz and epidote that formed in similar facies of hydrothermal alteration fromthe relatively young (6–7 Ma) oceanic crust as sampled by the ODP Hole 504B in the eastern Pacific Ocean. These data showsimilarity to the triple oxygen isotope analyses of the Vetreny belt rocks indicating that the 2.43–2.41 Ga seawater had theD17O value close to that of modern-day seawater. Due to small fractionation at 300–390 �C (aepidote-water � 1), epidotes pre-sent a strong evidence that equilibrium fluids had D017O values close to 0‰. Based on the previously published quartz-watercalibration, the computed D17O values of equilibrium fluids range between �0.11 and �0.03‰, significantly lower than that ofseawater or inferred seawater-derived fluids at low water-rock ratios. This can be explained by multiple factors includingphase separation of fluids or/and presence of low-temperature quartz overgrowths. Both are reflected in the fluid inclusiondata and in situ d18O measurements by ion microprobe (SIMS) presented here. Overall, our study suggests that the d18O,D17O and dD values of the 2.43–2.41 Ga seawater were �1.7 ± 1.1, �0.001 ± 0.011 and 0 ± 20‰ respectively, similar tothe modern values, which reflects the dominant role of submarine hydrothermal alteration in the stable isotopic budget ofseawater throughout Earth’s history.� 2019 Elsevier Ltd. All rights reserved.
Keywords: Precambrian; Paleoproterozoic seawater; Vetreny belt; Baltic Shield; Hydrothermal alteration; Stable isotopes; Triple oxygenisotopes; Snowball Earth glaciation
https://doi.org/10.1016/j.gca.2019.01.014
0016-7037/� 2019 Elsevier Ltd. All rights reserved.
⇑ Corresponding author.E-mail address: [email protected] (D.O. Zakharov).

186 D.O. Zakharov, I.N. Bindeman /Geochimica et Cosmochimica Acta 248 (2019) 185–209
1. INTRODUCTION
The secular variations in the stable isotopic compositionof seawater provides constraints on interactions betweenmajor reservoirs of oxygen and hydrogen, ultimately relat-ing plate tectonics, continental weathering, and tempera-ture of the oceans. Consequently, the d18O and dD valuesof the ancient seawater, especially in the Precambrian, hasbeen an alluring subject for geochemical investigations(Perry, 1967; Knauth and Lowe, 1978; Gregory andTaylor, 1981; Holland, 1984; Shields and Veizer; 2002;Knauth and Lowe, 2003; Robert and Chaussidon, 2006;Furnes et al., 2007; Marin-Carbonne et al., 2012). Detailedstudies of rocks recovered from the modern seafloor(Muehlenbachs and Clayton, 1976; Stakes and O’Neil,1982; Alt et al., 1986, 1995; Alt and Bach, 2006) made a sig-nificant contribution by showing that low- and high-temperature interaction between oceanic crust and seawaterplays a ubiquitous role in the stable isotope budget ofhydrosphere over the course of geologic time. Comparedto fresh unaltered basalt with d18O = 5.5–5.8‰ VSMOW(Hoefs, 2015), the upper 600 m of modern seafloor base-ment composed of pillow basalts attains high d18O values,between 6 and 10‰ due to low-temperature (<100 �C)alteration and submarine weathering. The next 5–6 km ofoceanic crust below that are low in d18O, between 1 and5‰ due to high-temperature hydrothermal alteration gen-erated at mid-ocean ridges (Muehlenbachs and Clayton,1976; Alt et al., 1996). The interaction between ancient sea-water and seafloor rocks is recorded in fragments of pre-served oceanic crust, providing an opportunity to assessquantitatively the temporal changes in the isotopic budgetof Earth’s hydrosphere. Studies of exposed Mesozoic ocea-nic crust including the Samail, Troodos, Josephine ophio-lites (Heaton and Sheppard, 1977; Gregory and Taylor,1981; Schiffman and Smith, 1988) showed that the d18Oof seawater was unlikely to be significantly different fromthe modern-day value. Older ophiolites are rare and areoften altered by metamorphism, hampering the ability tomake accurate determinations of the d18O value of seawa-ter. Several such studies, however, suggested that the d18Ovalue of Paleozoic, Proterozoic and even Archean seawatermust have also been within ±2‰ of the modern-day value(e.g. Holmden and Muehlenbachs, 1993; Fonneland-Jorgensen et al., 2005; Furnes et al., 2007).
On the other hand, Precambrian and early Phanerozoicmarine sediments yield d18O values as much as 10–20‰lower than modern analogues (Veizer et al., 1999; Shieldsand Veizer, 2002; Knauth and Lowe, 2003). To explain this,many authors called for very low d18O values of the Pre-cambrian seawater, between �15 and �10‰, or muchhigher temperatures (up to 80–90 �C) of oceans at constantd18O of seawater, or a combination of the both (Robert andChaussidon, 2006; Jaffres et al., 2007; Veizer and Prokoph,2015). The discrepancy between the sedimentary and ophi-olite records has been the subject of debate for a few dec-ades now (see Jaffres et al., 2007 and references therein).While the argument of poor preservation of the originald18O signal in sedimentary rocks is often invoked, thereare possible explanations for low d18O values of the Pre-
cambrian seawater involving long term secular changes ofthe 18O fluxes in the hydrosphere due to ongoing subduc-tion and changing ocean depth (e.g. Wallmann, 2001;Kasting et al., 2006). Since the low d18O values of ancientmarine sediments are common in Proterozoic and Archeanformations, and the record provided by Precambrian ophi-olites is sparse, it is worth pursuing more accurate and pre-cise determinations of the seawater d18O value from wellpreserved rocks using modern analytical methods.
The coupled behavior of hydrogen and oxygen isotopiccomposition of seawater through geologic time could helpto resolve the controversy (e.g. Hren et al., 2009) but thedD value of seawater in the distant past is difficult toexplore due to poor preservation of the original dD valuesin common hydrous minerals (Kyser and Kerrich, 1991).Additionally, the potential decoupling of the dD and d18Ovalues in the Archean seawater (e.g. due to hydrogen loss;Zahnle et al., 2013) has not yet been explored extensivelyin the rock record (one study by Pope et al., 2012).
The advent of high-precision d17O measurements couldprovide much needed additional constraints on the d18Oof ancient hydrosphere based on mass-dependent fraction-ation of oxygen isotopes. Improved understanding andthe growing number of high-precision studies on mass-dependent equilibrium fractionation of triple oxygen iso-topes in terrestrial reservoirs (Matsuhisa et al., 1978; Packand Herwartz, 2014; Pack et al., 2016; Sharp et al., 2016;Bindeman et al., 2018; Sengupta and Pack, 2018) are nowsufficient to derive the D17O of ancient seawater from mea-surements of minerals that originated in a submarine envi-ronment. Combined analysis of dD and D17O values insubmarine hydrothermally altered rocks should helpresolve the effect of variable water-rock ratios and mightprovide a missing record for future modeling efforts of cou-pled hydrosphere-lithosphere interactions.
In this paper we investigate the products ofhydrothermal alteration of well-preserved komatiiticbasalts from the 2.43–2.41 Ga Vetreny belt of Kareliacraton, Baltic Shield located in the NW part of EuropeanRussia (Fig. 1) using hydrogen and triple oxygen isotopesaided by mineralogical and fluid inclusion studies.Hydrothermally altered rocks offer snapshots of high-temperature interaction with seawater recorded shortlyafter eruption, during the period of cooling of magmas(104–105 years), and are often far less subjected to post-depositional alteration compared to the sedimentaryrecord. Oxygen isotopes bonded in large crystals(>1 mm) of silicate minerals were likely closed to diffu-sion and could be altered only at much higher tempera-tures, exceeding 300 �C (Dodson, 1973). The Vetreny beltrocks likely erupted in a submarine environment provid-ing a rare insight into the 2.43–2.41 Ga seawater, whichexisted in an anoxic environment, shortly after or duringthe earliest Paleoproterozoic snowball Earth glaciationand the Great Oxidation Event (Bekker et al., 2004;Lyons et al., 2014; Gumsley et al., 2017). This formationis well-suited to study ancient water-rock interactions dueto the presence of abundant hydrothermal features pre-served in the pillow section, and hyaloclastites that arealmost untouched by regional metamorphism (see
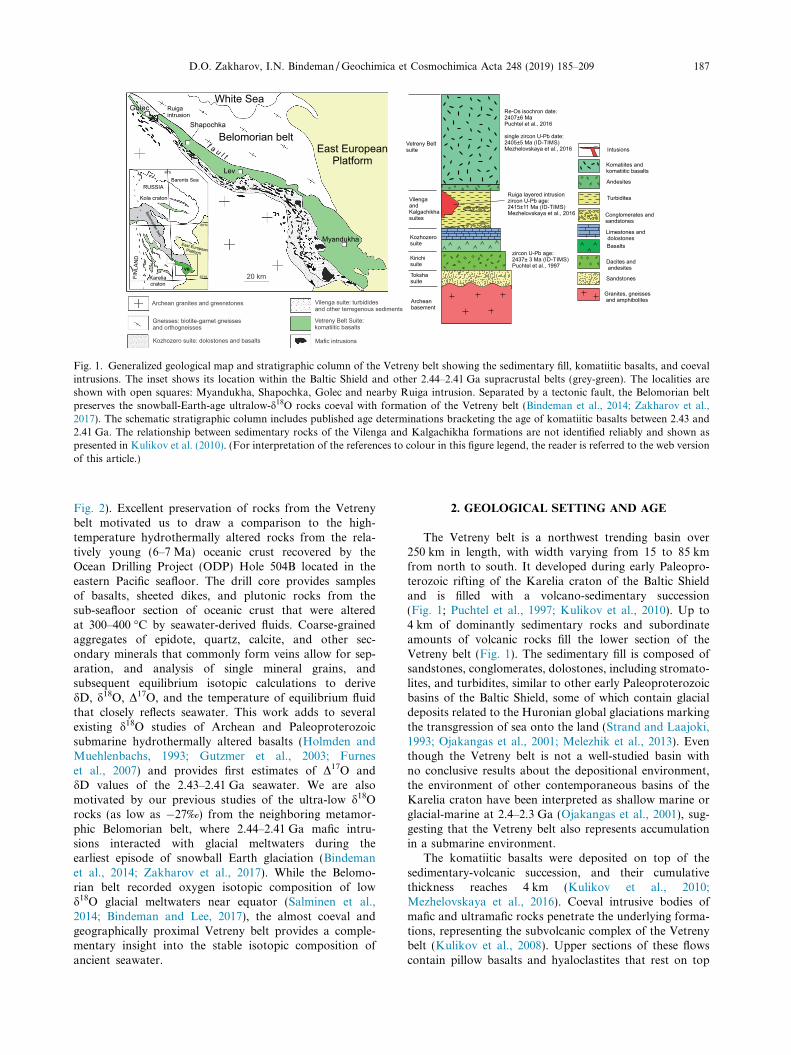
Fig. 1. Generalized geological map and stratigraphic column of the Vetreny belt showing the sedimentary fill, komatiitic basalts, and coevalintrusions. The inset shows its location within the Baltic Shield and other 2.44–2.41 Ga supracrustal belts (grey-green). The localities areshown with open squares: Myandukha, Shapochka, Golec and nearby Ruiga intrusion. Separated by a tectonic fault, the Belomorian beltpreserves the snowball-Earth-age ultralow-d18O rocks coeval with formation of the Vetreny belt (Bindeman et al., 2014; Zakharov et al.,2017). The schematic stratigraphic column includes published age determinations bracketing the age of komatiitic basalts between 2.43 and2.41 Ga. The relationship between sedimentary rocks of the Vilenga and Kalgachikha formations are not identified reliably and shown aspresented in Kulikov et al. (2010). (For interpretation of the references to colour in this figure legend, the reader is referred to the web versionof this article.)
D.O. Zakharov, I.N. Bindeman /Geochimica et Cosmochimica Acta 248 (2019) 185–209 187
Fig. 2). Excellent preservation of rocks from the Vetrenybelt motivated us to draw a comparison to the high-temperature hydrothermally altered rocks from the rela-tively young (6–7 Ma) oceanic crust recovered by theOcean Drilling Project (ODP) Hole 504B located in theeastern Pacific seafloor. The drill core provides samplesof basalts, sheeted dikes, and plutonic rocks from thesub-seafloor section of oceanic crust that were alteredat 300–400 �C by seawater-derived fluids. Coarse-grainedaggregates of epidote, quartz, calcite, and other sec-ondary minerals that commonly form veins allow for sep-aration, and analysis of single mineral grains, andsubsequent equilibrium isotopic calculations to derivedD, d18O, D17O, and the temperature of equilibrium fluidthat closely reflects seawater. This work adds to severalexisting d18O studies of Archean and Paleoproterozoicsubmarine hydrothermally altered basalts (Holmden andMuehlenbachs, 1993; Gutzmer et al., 2003; Furneset al., 2007) and provides first estimates of D17O anddD values of the 2.43–2.41 Ga seawater. We are alsomotivated by our previous studies of the ultra-low d18Orocks (as low as �27‰) from the neighboring metamor-phic Belomorian belt, where 2.44–2.41 Ga mafic intru-sions interacted with glacial meltwaters during theearliest episode of snowball Earth glaciation (Bindemanet al., 2014; Zakharov et al., 2017). While the Belomo-rian belt recorded oxygen isotopic composition of lowd18O glacial meltwaters near equator (Salminen et al.,2014; Bindeman and Lee, 2017), the almost coeval andgeographically proximal Vetreny belt provides a comple-mentary insight into the stable isotopic composition ofancient seawater.
2. GEOLOGICAL SETTING AND AGE
The Vetreny belt is a northwest trending basin over250 km in length, with width varying from 15 to 85 kmfrom north to south. It developed during early Paleopro-terozoic rifting of the Karelia craton of the Baltic Shieldand is filled with a volcano-sedimentary succession(Fig. 1; Puchtel et al., 1997; Kulikov et al., 2010). Up to4 km of dominantly sedimentary rocks and subordinateamounts of volcanic rocks fill the lower section of theVetreny belt (Fig. 1). The sedimentary fill is composed ofsandstones, conglomerates, dolostones, including stromato-lites, and turbidites, similar to other early Paleoproterozoicbasins of the Baltic Shield, some of which contain glacialdeposits related to the Huronian global glaciations markingthe transgression of sea onto the land (Strand and Laajoki,1993; Ojakangas et al., 2001; Melezhik et al., 2013). Eventhough the Vetreny belt is not a well-studied basin withno conclusive results about the depositional environment,the environment of other contemporaneous basins of theKarelia craton have been interpreted as shallow marine orglacial-marine at 2.4–2.3 Ga (Ojakangas et al., 2001), sug-gesting that the Vetreny belt also represents accumulationin a submarine environment.
The komatiitic basalts were deposited on top of thesedimentary-volcanic succession, and their cumulativethickness reaches 4 km (Kulikov et al., 2010;Mezhelovskaya et al., 2016). Coeval intrusive bodies ofmafic and ultramafic rocks penetrate the underlying forma-tions, representing the subvolcanic complex of the Vetrenybelt (Kulikov et al., 2008). Upper sections of these flowscontain pillow basalts and hyaloclastites that rest on top

Fig. 2. Hydrothermal alteration of komatiitic basalts in the Vetreny belt. A – Pillow basalts as exposed in a quarry wall cut with a largecircular saw. Pillows distinctly exhibit alteration of the rinds (green) and less altered cores (brown). The interpillow fills are composed ofquartz, epidote, chlorite, actinolite, calcite, and diopside; B – polished hand specimen of interpillow fill showing hyaloclastitic texture at thepillow rind. The interior of interpillow fills are composed of quartz, calcite, epidote, amphibole, diopside, and garnet (sample VB16 inFig. 3B). C – Hydrothermal breccia with angular fragments of komatiitic basalt (black) surrounded by alteration aggregates of chlorite andamphibole (green) and cemented by white quartz (sample VB13). D – Quartz vein cutting through komatiitc basalt. Quartz (qz), calcite (cc)and epidote (ep) were extracted from the sample and analyzed for d18O, d13C and dD (sample VB8A in Table 1). Homogenization of fluidinclusions in the quartz yields temperature of 358 ± 31 �C. E – Thin section of hydrothermally altered hyaloclastite. Fragments of komatiiticbasalts (brown) are surrounded by chilled margins (black sharp) that are concentrically altered inward (light brown) and cemented by quartz-amphibole-chlorite aggregate with muscovite (sample Mya1 in Fig. 3C); D – komatiitic basalt with spinifex texture formed by splinterycrystals of clinopyroxene enveloped by amphibole and brown groundmass altered to chlorite, albite, epidote, and quartz (sample GO25 inFig. 3A). (For interpretation of the references to colour in this figure legend, the reader is referred to the web version of this article.)
188 D.O. Zakharov, I.N. Bindeman /Geochimica et Cosmochimica Acta 248 (2019) 185–209
of more massive komatiitic basalts, that display por-phyritic, variolitic, and spinifex textures. The rocks areremarkably well-preserved for their age, containing originaldelicate igneous textures, structures resulted from subaque-ous emplacement (Fig. 2), and they even preserve
amorphous volcanic glass identified by transmitted electronspectroscopy (Sharkov et al., 2004), and potentially tracesof microbial life in the upper pillow basalts (Astafievaet al., 2009). Hydrothermal alteration hosted in komatiiticbasalts of the Vetreny belt was likely facilitated by the heat

D.O. Zakharov, I.N. Bindeman /Geochimica et Cosmochimica Acta 248 (2019) 185–209 189
from a large volume of cooling lavas and subvolcanic maficintrusions. Occurrence of pillow structures and ‘‘spilitic”assemblages of secondary minerals similar to thoseobserved in modern-day submarine basalts also suggestshydrothermal alteration in presence of seawater. Moreover,the submarine nature of alteration at the Vetreny belt issupported by the presence of saline fluid inclusions hostedin quartz veins.
The age of the komatiitc basalts is bracketed by multipledeterminations. Andesites of the Kirichi suite that underliethe komatiitic basalts (Fig. 1) were dated to 2437 ± 3 Mausing high-precision ID-TIMS zircon geochronology(MSWD = 0.8; Puchtel et al., 1997). We interpret this ageas the lower limit for the formation of the komatiitic basaltsof the Vetreny belt, while the upper limit is interpreted to be2407 ± 6 Ma as constrained by Re-Os isochron method(MSWD = 6.5) for whole-rock samples, olivine, and chro-mite separates (Puchtel et al., 2016). A single zirconextracted from a differentiated komatiitic basalt flowyielded an identical age of 2405 ± 6 Ma (ID-TIMS;Mezhelovskaya et al., 2016). The subvolcanic mafic layeredintrusion Ruiga located at the Golec locality (Fig. 1) wasdated to 2390 ± 50 Ma using Sm-Nd isochron method(MSWD = 1.6; Kulikov et al., 2008) and to 2415 ± 15 Mausing three discordant zircons (MSWD = 0.7;Mezhelovskaya et al., 2016). Herein we accept that thekomatiitic basalts and associated hydrothermally alteredrocks formed within the interval between 2.43 and 2.41 Ga.
2.1. Influence of 1.9 Ga regional metamorphism
Most parts of the Karelia craton experienced metamor-phic overprint during the Svecofennian period of meta-morphism (1.90–1.85 Ga) with metamorphic grade beingthe highest in the northern part of the craton (Bushminand Glebovitsky, 2008). The Vetreny belt located in theextreme south-east part of the Karelia craton (Fig. 1) isone of the least metamorphosed early Paleoproterozoicstructures of the Baltic Shield. The komatiitic basalts, withoriginal delicate igneous textures and minerals, and coex-isting features of hydrothermal alteration (see Fig. 2) werepreviously categorized as rocks of prehnite-pumpellyitefacies (Bushmin and Glebovitsky, 2008), similar to howmodern-day submarine hydrothermally altered rocks aredescribed to be metamorphosed in zeolite, prehnite-pumpellyite to greenschist facies. The preservation ofentire sections of unaltered differentiated lava flows withfresh volcanic glass and original igneous minerals (seethe description in Puchtel et al., 1996) suggest that thealteration of the hyaloclastites and pillow structuresoccurred by hydrothermal fluids in situ during the erup-tion in subaqueous medium, and not during the regionalmetamorphism. While some rocks have an unmetamor-phosed appearance (Puchtel et al., 1996), some sectionsin the western margin of the belt were subjected to green-schist facies metamorphism (Puchtel et al., 1997; Bushminand Glebovitsky, 2008). Such rocks display signs of defor-mation, schistosity and foliation, and were intentionallyavoided in this study.
3. SAMPLE DESCRIPTION
For this study we collected samples spanning over100 km along the length of the belt from localities Golec,Myandukha, Shapochka and subvolcanic Ruiga intrusion(see Fig. 1). The Myandukha locality is an area with severalnatural outcrops exposed during glacial retreats and in mul-tiple quarries in the vicinity of the town of Severoonezhsk,Russia, and is the southern-most locality studied here. TheGolec locality is a hill with steep slopes that expose the vol-canic flows and subvolcanic intrusion Ruiga in thenorthern-most area of the belt (Kulikov et al., 2008). TheMyandukha and Golec localities are studied here mostextensively because they were either not affected or leastaffected by superimposed greenschist facies metamorphismat 1.90–1.85 Ga (Puchtel et al., 1996, 1997). The rocks stud-ied here show no signs of schistosity or recrystallizationindicating an absence of deformations associated withregional metamorphism.
The most prominent hydrothermal alteration isexpressed in pillow structures and hyaloclastites. Pillowsranging in size from several tens of centimeters to over ameter in diameter are ubiquitously present in multiple quar-ries near the Myandukha locality (Fig. 2A). The pillowrinds are notably colored green compared to brown-greycenters of the pillows, and the voids formed by junctionbetween pillows and brecciated fragments are filled withfine-grained aggregates of quartz, epidote, calcite, amphi-bole, and chlorite (Fig. 2B and C). Herein such aggregatesare referred as interpillow fills. Locally, komatiitic basaltsare intensely dissected by quartz veins, brecciated, andcemented by quartz. In such cases quartz and associatedepidote and calcite occur as coarse crystals (several cm insize), which were separated for oxygen, carbon, and hydro-gen isotopic analyses (Fig. 2D). Hyaloclastitic varieties ofkomatiitic basalts exhibit jointing of small fragments (upto 10 cm) of rock that are altered from rim to center varyingthe color from dark green to dark brown and surroundedby chilled margins (Fig. 2E). Hydrothermally altered mas-sive basalts exhibit relict porphyritic, variolitic and spinifextextures, where most of original igneous minerals arereplaced by epidotes, amphibole, albite, and chlorite(Fig. 2F). The samples of altered gabbros collected fromthe Ruiga intrusion contain amphibole, serpentine, chrolite,talc and relicts of plagioclase, olivine, and pyroxene. Themassive basalts, hyaloclastites, fine-grained interpillow fillsand altered gabbros were analyzed for d18O and dD aswhole rock samples due to difficulty of extracting singlegrains of minerals.
The 6–7 Ma submarine hydrothermally altered rocksfrom the eastern Pacific seafloor were extracted by the Hole504B (ODP legs 83 and 70). Most samples are from leg 83(prefix 83-; see Tables 1 and 2), from depths 995–1000 mbelow the sub-seafloor basement (without sedimentarycover). This interval represents the upper section of sheeteddikes complex, where basaltic rocks are altered to low d18Ovalues at temperatures above 250 �C (Alt et al., 1996). Onesample was extracted from shallower levels (leg 70, depth of378 m; prefix 70-) representing a mid-ocean ridge basalt

Table 1Equilibrium temperatures, d18O and dD of equilibrium fluids based on conventional oxygen and hydrogen isotope analysis.
Sample name d18Oqz, ‰ d18Oep, ‰ dDep, ‰ d18Occ, ‰ d13Ccc, ‰ Computed temperature, �C Computed fluid, ‰
qz-ep1 qz-cc2 d18Ofluid3 dDfluid
4 dDfluid5
Myandukha locality, Vetreny belt
VB8A 8.56 3.08 �51 7.37 0.07 349 375 3.01 �13 �31VB8B 7.83 2.97 �32 387 3.20 9 �12VB14C 5.67 �0.34 �20 4.08 �5.36 321 286 �0.68 16 0VB24 9.27 2.99 �8 308 2.51 26 121321 11.36 7.32 �4.01 79 – –
Golec locality, Vetreny belt
GO4 5.06 �0.06 �23 370 0.04 16 �3GO22 5.13 �0.97 �56 316 �1.36 �21 �36Golec 4.93 �0.25 �119 365 �0.20 �80 �99
Hole ODP 504B, eastern Pacific Ocean
83-90R, 148-149 8.42 3.47 �8 380 3.62 32 1283-90R, 71-72 8.75 2.38 �21 303 1.82 13 �1
Abbreviations: qz – quartz, ep – epidote, cc – calcite.dD values in epidotes with �2 wt.% are highlighted in italic.
1- fractionation factor used from Matthews (1994).2- fractionation factor from Matthews et al. (1983).3- fractionation between water and quartz is computed as recommended in Sharp et al. (2016).4- hydrogen fractionation factor from Chacko et al. (1999).5- hydrogen fractionation factor 1000 ln aepidote-seawater � �20‰ from Graham and Sheppard (1980).
190D.O
.Zak
haro
v,I.N
.Bindem
an/Geochim
icaet
Cosm
ochim
icaActa
248(2019)
185–209

Table 2High-precision triple oxygen isotopic analysis of hydrothermally altered rocks and minerals from the Vetreny belt and ODP Hole 504B.
Sample Material d17O, ‰ SE d18O ‰ SE d017O, ‰ d018O, ‰ D017O, ‰ SE
ODP Hole 504B
70-48R 20-22 Altered basalt 3.297 0.010 6.343 0.003 3.292 6.323 �0.063 0.01083-80R, 106-108 Quartz 4.986 0.011 9.553 0.002 4.974 9.507 �0.070 0.01183-80R, 106-108 Quartz 4.740 0.009 9.089 0.004 4.729 9.048 �0.071 0.00983-90R, 71-72 Altered basalt 1.529 0.011 3.079 0.004 1.528 3.074 �0.102 0.01183-90R, 148-149 Epidote 1.782 0.013 3.465 0.003 1.781 3.459 �0.055 0.01383-90R, 148-149 Quartz 4.478 0.008 8.606 0.004 4.468 8.569 �0.077 0.00983-90R, 148-149 Quartz 4.307 0.007 8.232 0.004 4.297 8.198 �0.052 0.00783-90R, 71-72 Epidote 1.253 0.009 2.409 0.004 1.252 2.406 �0.024 0.01083-90R, 71-72 Epidote 1.219 0.009 2.353 0.003 1.218 2.351 �0.029 0.00983-90R, 71-72 Quartz 4.728 0.008 9.171 0.003 4.717 9.129 �0.126 0.00983-90R, 71-72 Quartz 4.331 0.013 8.320 0.004 4.321 8.285 �0.074 0.013
Vetreny belt
GO-22 Epidote �0.916 0.014 �1.701 0.005 �0.917 �1.703 �0.013 0.015GO-22 Quartz 2.490 0.011 4.795 0.004 2.487 4.783 �0.050 0.011GO-25 Altered basalt 0.700 0.014 1.408 0.004 0.700 1.407 �0.047 0.014GO4 Epidote �0.215 0.005 �0.321 0.003 �0.215 �0.321 �0.045 0.005GO4 Quartz 2.509 0.008 4.851 0.002 2.506 4.839 �0.061 0.008VB-14C Quartz 2.387 0.010 4.629 0.003 2.384 4.619 �0.066 0.010VB-24 Epidote 1.340 0.010 2.572 0.005 1.339 2.569 �0.024 0.010VB-24 Quartz 4.333 0.011 8.326 0.005 4.324 8.291 �0.075 0.011VB-25 Altered basalt 1.596 0.007 3.150 0.003 1.594 3.145 �0.074 0.007VB8A Epidote 1.534 0.011 2.989 0.004 1.532 2.985 �0.051 0.011VB8A Epidote 1.539 0.010 2.986 0.004 1.537 2.982 �0.044 0.010VB8A Epidote 1.139 0.012 2.148 0.008 1.138 2.146 0.000 0.012VB8A Quartz 4.496 0.009 8.696 0.005 4.486 8.659 �0.107 0.009VB8A Quartz 4.493 0.008 8.591 0.003 4.483 8.555 �0.056 0.008VB8A Quartz 4.328 0.012 8.319 0.007 4.318 8.285 �0.077 0.013VB9 Altered basalt 1.445 0.009 2.884 0.003 1.444 2.879 �0.083 0.009
D.O. Zakharov, I.N. Bindeman /Geochimica et Cosmochimica Acta 248 (2019) 185–209 191
(MORB) that underwent modest submarine weathering.The mineralogical, chemical, and isotopic compositionthroughout Hole 504B, including the Legs 70 and 83 canbe found in Alt et al. (1996).
4. METHODS
Powdered samples of fine-grained massive alteredkomatiitic basalts were analyzed using X-ray diffraction(XRD) with several matching samples analyzed by X-rayfluorescence (XRF). The XRD patterns were collected byRigaku Rapid II system (Mo-Ka radiation) at the Univer-sity of Wisconsin, and major element composition wasdetermined using an XRF Axios analyzer at Pomona Col-lege, California. Percentages of mineral phases in the sam-ples were computed by JADE 9.0 software using theRietveld refinement method. Thin sections were examinedunder a petrographic microscope, and analyzed using theCameca SX100 electron microprobe at the University ofOregon. The fine-grained samples were scanned to createelemental maps using grid analysis with following operatingconditions: 40� takeoff angle, beam current 30 nA, 15 kVoperating voltage, beam diameter 10 lm and 0.1 sec counttime for each element per pixel. Spot analyses of selectedminerals were performed under same conditions exceptcount time was 60 seconds per element. Microthermometrymeasurements of fluid inclusions in quartz were conducted
using Fluid Inc. USGS-type heating-cooling stage. Repro-ducibility of each measurement is within ±2 �C.
The D17O and d18O analyses were carried out at theUniversity of Oregon Stable Isotope Lab using a gas-source MAT253 mass spectrometer equipped with a laserfluorination line. For oxygen isotope analyses we usedwhole rock samples (1.2–2 mg) of massive, altered, komati-itic basalts, fine-grained interpillow fills and separated crys-tals of quartz, calcite, and epidote. Mineral separates wereexamined under a binocular for inclusions of other mineralsprior to analysis. Analytical procedures for conventionald18O analyses followed as reported in Bindeman et al.(2014). Triple oxygen isotope analyses carried out usingthe same procedure reported in Zakharov et al. (2017)including the gas chromatographic column for purificationof generated O2. For hydrogen isotope analyses we used acontinuous flow system TC/EA-MAT253 at the Universityof Oregon, following standardization and normalizationprocedures described in Martin et al. (2017). The d18O,dD, D017O are reported relative to the VSMOW (ViennaStandard Mean Oceanic Water). The average precision ofconventional d18O analysis is ±0.1‰. The average precisionof dD analysis by TC/EA is ±1 to 4‰; the precision of H2Odetermination is estimated to be ±0.05 wt.%. The precisionof triple oxygen isotope analysis is ±0.01‰ or better ford018O and ±0.010–0.015‰ for D017O. Carbonates were ana-lyzed for d18O and d13C by reaction with phosphoric acid

192 D.O. Zakharov, I.N. Bindeman /Geochimica et Cosmochimica Acta 248 (2019) 185–209
using GasBench in continuous flow mode with He-gas ascarrier. The precision is ±0.2‰ for d18O and ±0.1‰ ford13C values of carbonates. All analytical precisions arereported as 2 standard errors. The d34S analysis was carriedout at the University of Nevada, Reno, Stable Isotope Labfollowed the procedure reported in Grassineau et al. (2001)with precision of ±0.2‰ reported relative to VCDT(Vienna Canyon Diablo Troilite).
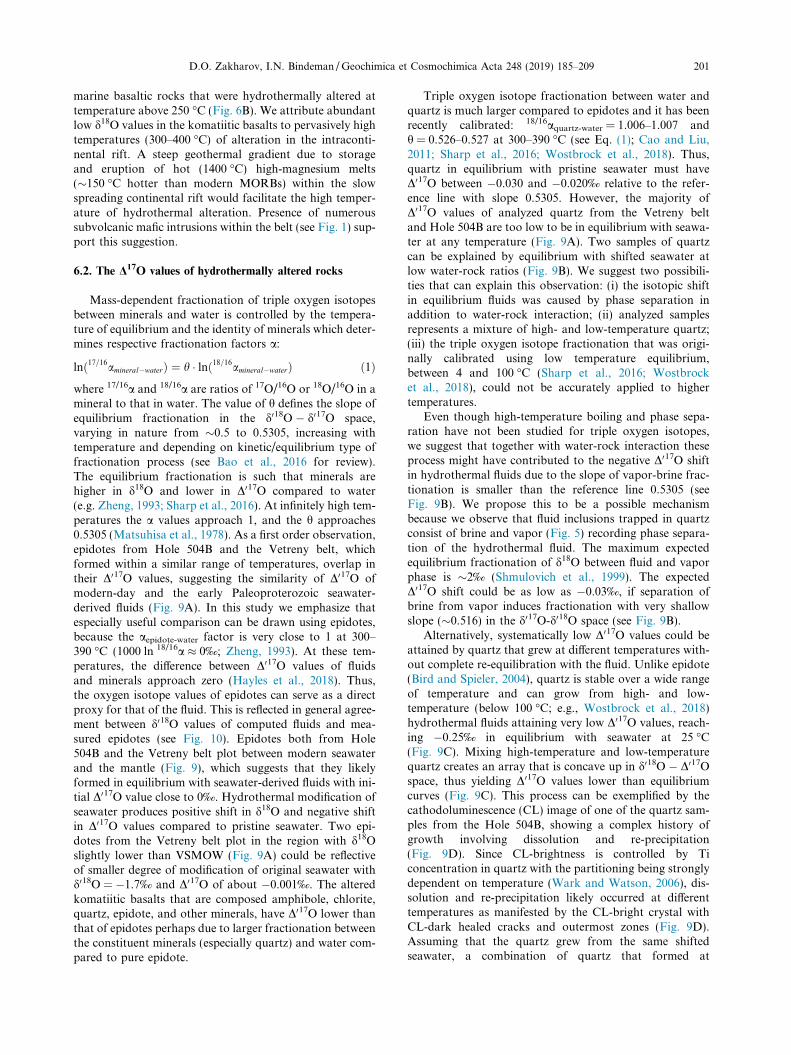
Accuracy of the triple oxygen isotope analyses was mon-itored by analyzing San Carlos olivine (SCO) for whichhigh-precision measurements are published (Pack andHerwartz, 2014; Pack et al., 2016). The SCO yieldedd018O = 5.445 ± 0.088‰ and D017O = �0.081 ± 0.008‰(mean ± standard error, n = 9; Table A1), which agreeswith results published in previous studies (Pack andHerwartz, 2014). However, the more recent analysis ofSCO measured against oxygen extracted directly by fluori-nation of VSMOW and SLAP conducted in two labs (seePack et al., 2016) yields systematic offset of the D017O valueof SCO by about 0.030‰ from our value (Pack andHerwartz, 2014). Since we did not perform fluorination ofVSMOW to calibrate our reference gas we adjusted ourmeasurements within each analytical session to compensatefor the offset given for the composition of SCO (Pack et al.,2016; see Appendix A).
The linearized delta-notation d018O and d017O is usedhere to address the non-linearity of the relationship betweenconventionally expressed d18O and d17O. Following Miller(2002), linearized notation is expressed as:
d0xO = 103ln � (dxO � 10�3 + 1),
where x is either 17 or 18. The value of D017O is used here todescribe 17O-excess from a reference line with a slope of0.5305 (Matsuhisa et al., 1978; Pack and Herwartz, 2014):
D017O = d017O � 0.5305 � d018O.
Additionally, we measured d18O values in situ in twoquartz samples (VB8A and ODP504B 83-90R, 71-72) usingion microprobe. First, polished sections of quartz wereimaged using a FEI Quanta field emission gun scanningelectron microscope equipped with a cathodoluminescencegrayscale detector at the University of Oregon. The d18Owas analyzed from 10-mm-diameter spots using a secondaryion mass spectrometer (SIMS) CAMECA IMS-1280 at theUniversity of Wisconsin. A polished grain of UWQ-1quartz (d18O = 12.33‰) was mounted with the samplesand used as a bracketing standard. The precision duringthe analyses was ±0.4‰ or better (2 standard errors).
5. RESULTS
5.1. Mineralogical compositions
As determined by XRD (Supplementary Table 1), themajor minerals in altered komatiitic basalts are amphibole(50–70 wt.%), chlorite (10–30 wt.%), epidote (5–10 wt.%)and albite (5–10 wt.%). Muscovite, phlogopite, titanite, pre-hnite, quartz and calcite commonly occur in minoramounts. The XRF major elemental data (SupplementaryTable 1) show that altered komatiitic basalts have high
MgO and iron oxide (reported as Fe2O3total), 8–16 and 14–
17 wt.% respectively, with SiO2 content of 45–47 wt.% sim-ilar to composition reported previously (Puchtel et al.,1997). Electron microprobe data shows that phenocrystsof olivine and pyroxene preserve their shapes and are pse-duomorphically altered to Ca-amphiboles (Fig. 3). Thespinifex-textured komatiitic basalts contain original unde-formed pyroxenes, augite, and pigeonite, enveloped inactinolite-epidote rims (Fig. 3A). The groundmass ofaltered komatiitic basalts is altered to fine-grained aggre-gates of albite, chlorite, epidote, mica, quartz, and calcite.The interpillow fills exhibit zoning; the areas adjacent tothe pillow are rich in epidote, quartz, and Ca-amphibole,while the center of interpillow fills contain abundantmedium-grained calcite, epidote, diopside, irregularlyzoned amphibole, and rare grossular (Fig. 3B). Fine-grained veins that dissect and cement hyaloclastite frag-ments of altered komatiitic basalts are composed of fine-grained aggregates of albite, chlorite, muscovite, prehnite,and Ca-amphibole (Fig. 3C). The compositions of epidotes,amphiboles, chlorites, and pyroxenes found in massivealtered komatiitic basalts and veins and interpillow fillsare shown on Fig. 4. Spot analyses of these minerals arereported in Supplementary Table 2. For comparison weshow the compositions of the minerals from modernhydrothermally altered oceanic crust demonstrating a sig-nificant overlap with the compositions of chlorites, amphi-boles and secondary diopside from the Vetreny belt (Fig. 4).The notable difference between Fe3+ content in some epi-dotes from the Vetreny belt and epidotes recovered frommodern oceanic crust is difficult to interpret with certaintybecause of the very complicated relationship between epi-dote composition and thermodynamic parameters. How-ever, the measured epidote compositions are not unusualfor epidotes from hydrothermal systems in general (Birdand Spieler, 2004).
5.2. Microthermometry of fluid inclusions
We conducted a microthermometry study of fluid inclu-sions using two samples of clear vein quartz collected fromMyandukha (VB8A) and Golec (GO22) localities (Fig. 1).The results of measurements are presented on Fig. 5. Mostfluid inclusions are �10 lm in size, fluid-dominated with avapor bubble occupying 10–20 vol.%. We were focused oninclusions with negative crystal shapes, without signs ofstretching or alignment along cracks. Such inclusions likelyexperienced the least amount of modification after the for-mation of quartz. The fluid-dominated inclusions com-monly contain a cubic-shaped daughter mineral, mostlikely halite. Other unidentified daughter minerals are clearand opaque, of cubic and rectangular form, but occur muchmore rarely than halite crystals. The fluid-dominated inclu-sions containing halite homogenize to fluid only, through aseries of transitions: fluid + bubble + crystal ? fluid+ bubble (average temperature 320 �C)? fluid (at �400 �C).Vapor-dominated inclusions are also found within the samesamples. They contain 70–90% vapor and homogenize tovapor. The average homogenization temperatures for bothtypes of inclusions in the samples from Golec (sample

Fig. 3. Elemental distribution maps created for fine-grained hydrothermally altered rocks using EMPA. A – komatiitic basalt (sample GO25)showing original igneous texture with preserved skeletal relicts of pyroxene enveloped by amphibole. Side length of the image is 500 lm; B –internal part of interpillow fill (sample VB16) composed of amphibole, diopside, epidote and garnet cemented by anhedral quartz and calcite;C – fine-grained rind of altered hyaloclastitic fragment. The rock is altered to albite, muscovite, chlorite, amphibole, and quartz. Side of eachsquare is about 300 lm in panels B and C. Mineral abbreviations: (ab) albite, (amph) amphibole, (chl) chlorite, (cc) calcite, (di) diopside, (ep)epidote, (gt) garnet, (px) primary pyroxene, and (qz) quartz.
D.O. Zakharov, I.N. Bindeman /Geochimica et Cosmochimica Acta 248 (2019) 185–209 193
GO22) and Myandukha (VB8A) localities are 304 ± 25 and358 ± 31 �C respectively, with the average value of 331± 22 �C for both samples (mean ± 2 standard errors). Thetotal range of observed temperatures is 228–537 �C, how-ever, some of the high-temperature measurements resultfrom difficulty in seeing complete homogenization invapor-dominated inclusions though vapor + liquid ?vapor.
The presence of multiple daughter minerals in fluid-dominated inclusions indicates high salinity of the fluid.Presence of halite crystals constrains the salinity betweenthe saturation level of 26.3 wt.% equivalent NaCl, and�40 wt.% eq. NaCl as determined by dissolution of halitecrystals at around 320 �C. Presence of other daughter
minerals indicates that the salinity is defined not only byNaCl but by other dissolved salts, consistent with themelting temperatures below the NaCl-H2O eutectic point(�21.2 �C). Measuring salinity in vapor-dominatedinclusions is difficult due to limitations of the optics andthose measurements are not presented here. However, inseveral fluid inclusions the bubble ‘‘jerks” when heated toabout 0 �C suggesting melting of last ice crystal at thattemperature, which would indicate low salinity of theinclusions. In summary, we observe both brine and vaporas trapped inclusions in these samples indicating that thehydrothermal fluid was undergoing phase separation. Thisis a common process in modern submarine hydrothermalsystems at subcritical and supercritical critical temperatures

Fig. 4. Chemical composition of solid-solution minerals from the hydrothermally altered komatiitic basalts. Blue circles represent minerals inmassive altered komatiitic basalts, red circles – in interpillow fills and veins. Filled circles represent data extracted from the elemental maps(Fig. 3) and open diamonds show compositions as determined by EMPA spot analysis (see Methods). Composition of epidotes expressed asthe xFe3+ denoting the Fe3+/(Al + Fe3+) ratio in formula units computed based on 13 anions. The average value xFe3+ = 0.16 was used forcomputing quartz-epidote fractionation factor (Matthews, 1994). Composition of pyroxenes expressed in end-members: Di – diopside, He –hedenbergite, En – enstatite, Fr – ferrosilite, Wo – wollastonite. Pyroxenes in massive komatiitic basalts are primary augites and pigeonites,whereas secondary pyroxenes occurring in interpillow fills are diopsides. Occurrence of both primary and secondary pyroxenes is common inhigh-T hydrothermally altered mafic rocks from modern seafloor (Laverne et al., 1995). Amphiboles and chlorites are plotted on aclassification diagrams of Hey (1954) and Leake et al. (1997), respectively. Transparent white areas in each diagram represents the chemicalcomposition of secondary minerals from recent submarine altered rocks (Laverne et al., 1995; Vanko et al., 1996). (For interpretation of thereferences to colour in this figure legend, the reader is referred to the web version of this article.)
194 D.O. Zakharov, I.N. Bindeman /Geochimica et Cosmochimica Acta 248 (2019) 185–209
(critical point of seawater is 407 �C, 298 bars; Bischoff et al.,1986) as observed directly in near-vent fluids (Foustoukosand Seyfried, 2007 and references therein) or in fluid inclu-sions hosted in hydrothermal minerals from oceanic crustand ophiolites (Nehlig, 1991).
5.3. Conventional d18O, dD and d13C analysis
In total, we analyzed 54 samples for different isotoperatios collected from localities Myandukha, Shapochka,Golec and intrusion Ruiga (Fig. 1), including separates ofquartz, epidote, calcite, and whole rock samples of alteredkomatiitic basalts, gabbros, veins and interpillow fills. The
results of oxygen and hydrogen isotopic analysis are plottedon Fig. 6 and presented in the Supplementary Table 3. Thed18O in whole rock samples of altered komatiitic basaltscontaining abundant amphiboles, chlorites and epidotesranges between 1.03 and 3.54‰ and the dD ranges between�210 and �69‰, containing 2–5 wt.% H2O. The d18O val-ues of altered gabbros from the Ruiga intrusion varybetween 1.63‰ and 3.68‰, with dD values between �187and �161‰ and H2O contents of 2.0–2.5 wt.%. Interpillowfills and fine-grained veins analyzed as whole rocks haved18O varying between 1.81 and 8.67‰ and dD varyingbetween �192 and �96‰. The veins and interpillow fillsare much heavier compared to altered komatiitic basalts

GO22
0
1
2
3
4
5
200 300 400 500
coun
t
liquidvapor
GO22
0
1
2
3
4
−40 −30 −20 −10 0
VB8A
0
1
2
3
4
5
200 300 400 500Th, °C
coun
t
VB8A
0
1
2
3
4
−40 −30 −20 −10 0Tm, °C
GO22
0
1
2
3
4
5
200 300 400 500
coun
t
liquidvapor
GO22
0
1
2
3
4
−40 −30 −20 −10 0
VB8A
0
1
2
3
4
5
200 300 400 500Th, °C
coun
t
VB8A
0
1
2
3
4
−40 −30 −20 −10 0Tm, °C
mean Th = 304 ± 25 °C
mean Th = 358 ± 31 °C
mean Tm = -20 ± 4°
mean Tm = -17 ± 4 °C
VB8A VB8A
G 22O
Fig. 5. Histograms showing the results of fluid inclusion microthermometry. Homogenization (Th, �C) and melting temperatures (Tm, �C)were measured in samples GO22 and VB8A collected at Golec and Myandukha localities, respectively. Examples of vapor-dominatedinclusions and fluid-dominated inclusions with daughter minerals are shown for each sample on the left and right sides of the respective panelimage. Temperatures of homogenization are in good agreement with the temperatures derived from quartz-epidote oxygen isotopeequilibrium (see Table 1). Very low melting temperatures and abundance of halite and other daughter minerals reflect extremely high salinityof the fluid that likely originated from phase separation of seawater.
D.O. Zakharov, I.N. Bindeman /Geochimica et Cosmochimica Acta 248 (2019) 185–209 195
due to presence of quartz. The measurements of pure quartzand epidote separates yield average values d18Oquartz = 6.46± 1.38‰ and d18Oepidote = 1.30 ± 1.84‰ (mean ± se). Pureclear quartz from quartz veins ranges in d18O from 4.40 to9.27‰ with samples from the Golec locality having slightlylower d18O values ranging from 4.40 to 6.17‰, while quartzfrom the Myandukha locality ranges in d18O from 5.66 to9.27‰ (Fig. 6A). The d18O of epidotes from quartz veinsand interpillow fills range between �0.97 and 3.08‰, whilethe dD in most epidotes range between �56‰ and �8‰.One epidote from the Golec locality yielded a low dD valueof �119‰, which we attribute to poor preservation of orig-inal isotopic signature (see Discussion below). Epidotesfrom the Golec locality range in d18O from �0.97 to�0.06‰ and two dD measurements yield values �56 and�23‰. Epidotes from the Myandukha locality range ind18O and dD between �0.35 and 3.11‰ and �51 and�8‰ respectively. Analyzed epidotes have 1.7–2.1 wt.%H2O, which is in broad agreement with their stoichiometry.Water contents of analyzed samples plotted against otherisotopic parameters, and dD plotted against D017O valuesare shown on Fig. 7. We used H2O content to discern pureepidote separates with stoichiometric amounts of water(1.7–2.0 wt.%) that were used to compute dD of the equilib-rium fluids (Fig. 6B). We show fields of d18O and dD valuesof epidotes from ophiolites and modern seafloor rocks that
exhibit significant overlap with the Vetreny belt data(Fig. 6C).
The four samples of calcite intergrown with quartz andepidote from veins and interpillow fills yielded d18Obetween 4.1 and 7.4‰ VSMOW and d13C values betweenof �5.36 and 0.07‰ VPDB. The d13C values of calciteare consistent with carbon being sourced from the mantleand partly from re-mineralized organic matter (Hoefs,2015). One pyrite separate extracted from an interpillow fill(sample VB24) was analyzed for sulfur isotopes yieldingd34S = 0.2‰VCDT, which indicates that sulfur could havebeen derived from the mantle or marine reservoir. Multipleisotope analysis of sulfur isotopes should help distinguish-ing one from another (Seal, 2006).
We used oxygen isotopic equilibrium fractionation todetermine the temperature of hydrothermal alteration andd18O, and dD of the equilibrium fluid. Assuming isotopicequilibrium between measured minerals A and B, the differ-ence d18OA � d18OB � 1000 ln aA-B is temperature-dependent. To derive equilibrium temperatures we appliedthe oxygen isotope calibration from Matthews (1994) forquartz-epidote and from Matthews et al. (1983) forquartz-calcite. We used the average composition of epidotewith Fe3+/(Fe3+ + Al) = 0.16 (formula units; see Fig. 4A)for quartz-epidote fractionation, which is dependent on pis-tasite Ca3Fe2
3+Si3O12(OH) content in epidote (Matthews,

Fig. 6. Oxygen and hydrogen isotopic values of hydrothermally altered rocks from the Vetreny belt and computed isotopic compositions ofhydrothermal fluids. A – Histograms showing the distribution of d18O values in common type of samples. The lowest d18O values areinterpreted to represent equilibrium with the least modified early Paleoproterozoic seawater with the d18O value of �1.7‰. B – d18O and dDvalues plotted for hydrous samples. The water content in epidotes is shown; epidotes with �2.0 wt.% H2O are considered most reliable (seeDiscussion). Computed fluids are shown with triangles based on equilibrium calculations. The shaded and open triangles are computed basedon hydrogen fractionation factors from Graham and Sheppard (1980) and Chacko et al. (1999) respectively. The average equilibrium fluid(blue triangle) is very close to modern seafloor hydrothermal fluids (d18O = +1‰ and dD = 0‰). C – Oxygen and hydrogen isotopiccomposition of hydrothermally altered rocks from the modern seafloor (Kawahata et al., 1987; Kempton et al., 1991) and epidotes frommodern seafloor and ophiolites (Heaton and Sheppard, 1977; Stakes and O’Neil, 1982; Harper et al., 1988). The two epidotes from Hole 504Banalyzed here are shown with open squares. Secondary minerals in equilibrium with seawater at 300 �C are shown with green crosses foramphibole (tremolite), chlorite and epidote, and with dashed lines for quartz and albite (Zheng, 1993; Matthews, 1994; Chacko et al., 1999).Horizontal scatter of the Vetreny belt rocks is comparable to scatter of d18O values in hydrothermally altered rocks from the modern seafloorand can be explained by variable proportions of minerals in equilibrium with seawater. Very large vertical scatter (down to dD = �210‰;panel B) is best explained by secondary hydration of hydrous minerals such as chlorite by local precipitation (blue thick line) while largeepidote crystals preserved their original isotopic integrity and were used to compute the isotopic composition of equilibrium fluids.Fractionation effect of secondary H2O exchange between surface water and chlorite as well as other phyllosilicates is shown with the grey line(Wenner and Taylor, 1974). (For interpretation of the references to colour in this figure legend, the reader is referred to the web version of thisarticle.)
196 D.O. Zakharov, I.N. Bindeman /Geochimica et Cosmochimica Acta 248 (2019) 185–209
1994). Based on 8 individual quartz-epidote measurementsfrom samples collected at Myandukha and Golec localities,the computed equilibrium temperature is between 308 and387 �C (see Table 1). The two samples from the ODP Holeyield computed equilibrium temperatures of 303 and380 �C. Quartz-calcite fractionation in samples (VB8A andVB14C) yielded temperatures of 375 and 286 �C comparableto quartz-epidote equilibrium temperatures from the samesamples. In one sample (#1321; Table 1), quartz-calcite frac-tionation yields temperature of 79 �C, which we considerunrealistically low and possibly related to alteration andthe small (<0.5 mm) grain size of calcite in the sample com-pared to samples VB8A and VB14C. Using a differentquartz-calcite calibration (Sharp and Kirschner, 1994), thesame samples yields elevated temperatures ranging between582 �C and 266 �C.We prefer to rely on quartz-epidote frac-tionation since it yields consistent results for multiple sam-ples and both quartz and epidote are more resistant toalteration (via dissolution, recrystallization) compared tocalcite. Moreover, quartz-epidote calibration (Matthews,1994) yields systematic results consistent with temperaturesand d18O of fluids measured in modern hydrothermal sys-tems (see Pope et al., 2014). The close match of homogeniza-tion temperatures measured in fluid inclusions andtemperatures computed from quartz-epidote equilibrium isa good indicator of preservation of isotopic equilibriumbetween minerals and fluids.
Next, we used quartz-water and epidote-water calibra-tions (Graham and Sheppard, 1980; Zheng, 1993; Chacko
et al., 1999; Sharp et al., 2016) to compute the d18O anddD of the equilibrium fluid based on the temperaturesreturned from d18Oquartz � d18Oepidote measured in coexist-ing mineral pairs, assuming isotope equilibrium. The indi-vidually computed equilibrium temperatures for eachsample, and d18O and dD values of equilibrium fluidsare presented in Table 1 and are plotted in Fig. 6B. Thecomputed equilibrium d18Ofluid values vary between �1.4and +3.2‰. The computed dDfluid range between �80‰and +27‰ based on the calibration from Chacko et al.(1999) and between �99 and +12‰ when the calibrationfrom Graham and Sheppard (1980) is applied. The dDfractionation between epidote and seawater at 330–350 �C is about �20‰ (Graham and Sheppard, 1980), andmight suit this study better since it accounts for the salin-ity of equilibrium fluid. The same procedure was appliedto the 2 samples from Hole 504B (Table 1), with the com-puted equilibrium temperatures, d18Ofluid and dDfluid beingvery similar to those computed for the Vetreny belt. Theuncertainties for equilibrium temperatures and d18Ofluid
are ±15 �C and ±0.7‰, respectively as defined by analyt-ical uncertainties, uncertainties in quartz-water fractiona-tion (Sharp et al., 2016) and the Fe3+ content range(0.16 ± 0.05; Fig. 4) in the epidote. The estimated uncer-tainty of dDfluid is ±11‰ defined by the uncertainty infractionation factor (Chacko et al., 1999), equilibriumtemperature estimates and our dD measurements. Allerror propagations were performed using Monte Carlosimulations.

Fig. 7. Effects of secondary hydration on the dD, d18O, and D017O values of hydrothermally altered rocks from the Vetreny belt. A – dD valuesand water content in analyzed samples. Secondary hydration is manifested by large scatter of dD and negative correlation between dD andH2O wt.%. The reconstructed dD value of pure chlorite that exchanged dD with meteoric water at low temperature is shown. Epidoteseparates however were much less affected by secondary hydration except epidotes with >2.0 wt.% water. The dashed blue line defines anapproximate trend of secondary hydration of epidotes. B – The d18O plotted against H2O wt.% shows no significant trend in samples withwater content above 1 wt.%. The average d18O value of altered komatiitic basalts is shown with the blue dashed line. The d18O values of therocks are controlled by proportion of major minerals in the sample. C – The D017O plotted against the dD of altered komatiitic basalts andepidotes. Despite the drastic change in dD due to secondary H2O exchange, altered komatiitic basalts still retain their original D017O value.Epidotes that are much less susceptible to alteration of hydrogen isotopes and plot near the composition of modern seawater. (Forinterpretation of the references to colour in this figure legend, the reader is referred to the web version of this article.)
D.O. Zakharov, I.N. Bindeman /Geochimica et Cosmochimica Acta 248 (2019) 185–209 197
5.4. Triple oxygen isotope compositions
The d018O and D017O values of 18 samples of quartz, epi-dote and altered whole rocks of the Vetreny belt as well as
samples from the ODP Hole 504B are reported in Table 2.We also report one sample of MORB from Hole 504B, Leg70 that experienced a modest extent of submarine weather-ing or low-temperature alteration with values

Fig. 8. The d018O values of coexisting quartz-epidote pairs areplotted to estimate the average equilibrium fractionation expressedthrough the regression line d018Oquartz = 1000lnaquartz-epidote +d018Oepidote. The quartz-epidote equilibria at 300 and 400 �C areshown with black parallel lines (Matthews, 1994). The regressionline defines the average value of 1000 ln aquartz-epidote = 5.78 ± 0.19(1 standard error). The data points connected with solid black linesrepresent measured duplicates. The inset shows that the estimatedvalue of 1000 ln aquartz-epidote corresponds to the equilibriumtemperature of 333 �C using calibration from Matthews (1994).The propagated uncertainty is ±30 �C (3 standard errors). Theaverage xFe3+ content of epidotes from the Vetreny belt and Hole504B varies between 0.16 and 0.25 playing a minor role comparedto the uncertainty of ±30 �C.
198 D.O. Zakharov, I.N. Bindeman /Geochimica et Cosmochimica Acta 248 (2019) 185–209
d018O = 6.323‰ and D017O = �0.063‰ which is very simi-lar to previously published compositions of fresh andweathered MORBs (Pack and Herwartz, 2014; Senguptaand Pack, 2018).
We used linear regression analysis of coexistingd018Oepidote and d018Oquartz to derive the average value of1000 ln aquartz-epidote and to calculate d018O and D017O ofequilibrium fluids. We estimated the average equilibriumtemperature for all studied samples and their duplicatesas 333 ± 30 �C (mean ± 3 standard errors) based on themean value of 1000 ln aquartz-epidote (Fig. 8). This was doneto address the small variations in the 1000 ln aquartz-epidotegiven by multiple measurements (see Table 2) and to pro-duce a more accurate estimate of equilibrium temperaturesthat vary within a narrow range (Table 1). The measuredd018O and D017O values are displayed in Fig. 9A along withthe computed equilibrium fluids at 333 �C (Fig. 9B) basedon previously published quartz-water triple oxygen isotopefractionation (Sharp et al., 2016; Wostbrock et al., 2018).The computed d018Ofluid and D017Ofluid values range between�0.82 and 4.07‰ and �0.110 and �0.034‰ respectively(Fig. 9B). The average uncertainties of d018Ofluid andD017Ofluid were estimated at ±1.1 and 0.011‰, respectivelyby propagating the following uncertainties through the cal-ibration equation (Wostbrock et al., 2018): analyticaluncertainty, uncertainty of the temperature estimate(±30 �C) and uncertainty given in the fractionation factors.
5.5. CL images and d18O values measured by SIMS
In cathodoluminescence (CL) images, the sample of veinquartz from the Vetreny belt (VB8A) is dark and homoge-
nous in d18O. The SIMS measurements collected from spotsdistributed over 100 mm apart yield average valued18O = 8.2 ± 0.1‰ (n = 20). The quartz crystal from Hole504B (83-90R, 71-72) exhibits zoning in CL images withthe evidence for dissolution, re-precipitation, and healingof cracks (see Fig. 9D). Majority of the crystal is brightin CL images, while healed cracks are dark. The overallrange of d18O values measured by SIMS in this sample isbetween 6.6 and 15.9‰. The CL-bright parts have d18O val-ues of 8.0 ± 0.8‰ (n = 32). The CL-dark healed cracks areabout 8‰ heavier than that, with the average d18O value of15.4 ± 0.5‰ (n = 7).
6. DISCUSSION
6.1. d18O values of hydrothermal fluids
Good agreement between homogenization temperaturesand quartz-epidote equilibrium temperature estimates(Fig. 4; Table 1), as well as the internal agreement ofquartz-epidote estimates (Fig. 9), suggest these tempera-tures can be reliably used to calculate equilibrium fluids.Most of the computed equilibrium fluids from the Vetrenybelt have d18O of 1 ± 2‰, which is not significantly differ-ent from the d18O value modern-day seawater-derivedhydrothermal vent fluids (Shanks, 2001) that are slightlyshifted due to the isotopic exchange during high tempera-ture interaction with rocks (+0.5 to +2‰, Shanks, 2001).Thus, the lower d18O values in the range of equilibrium flu-ids are the closest to seawater due to minimal effect of inter-action with rocks. We suggest that the Vetreny belt rockswere altered at water-rock ratios similar or higher thanmodern-day submarine basalts, and thus, experienced thesame or smaller amount of isotopic shift. Most of the ana-lyzed rocks from the Vetreny belt were collected within pil-low structures and hyaloclastites that contained largevolume of voids, and that became filled in with quartz, epi-dote, amphibole, and other minerals bearing evidence fordirect contact with fluids (Fig. 2B). The high hydrologicpermeability of pillow basalts and hyaloclastites with voidspaces and fractures (10�13–10�11 m2 measured in the Hole504B; Alt et al., 1996) promotes flow of seawater alongthem resulting in alteration at water-rock ratios with mini-mized isotopic shift (DePaolo, 2006). In Fig. 10 we showthe effect of isotopic shift for hydrogen and triple oxygenisotope systems at variable water-rock ratios as calculatedusing the static mass-balance approach (Taylor, 1977).Using these calculations, we estimate that in modernhydrothermal systems the fluids experienced water-rockratios between about 0.5 and 5. At the water-rock ratioof 5, the d18O of fluid is shifted only 0.3‰, which wouldbe very close to the starting composition of seawater. Thelowest computed d18O value at the Vetreny belt is �1.4± 0.7‰, thus we can estimate the d18O value of 2.43–2.41 Ga seawater to be around �1.7 ± 1‰, similar to sea-water of the ice-free world (Shackleton and Kennett, 1975).
In agreement with the computed equilibrium fluids, therange of d18O values and mineral assemblages of alteredkomatiitic basalts and gabbros from the 2.43–2.41 GaVetreny belt are strikingly similar to the low d18O sub-

Fig. 9. A – Triple oxygen isotopic composition of altered basaltic rocks, epidotes, and quartz from the Vetreny belt and recent oceanic crustsampled by the ODP Hole 504B. The main reservoirs of oxygen such as seawater (shown as VSMOW) and MORB (Pack and Herwartz, 2014)are shown. Meteoric water line constructed after Luz and Barkan (2010). Seawater-derived fluids should plot between modern seawater(VSMOW) and the mantle. There is no significant difference between most samples from the 2.43–2.41 Ga Vetreny belt and modern oceaniccrust implying that they formed in equilibrium with seawater-derived fluids that had D017O � 0‰. Due to small fractionation, epidotes mustbe especially reflective of the D017O values of equilibrium fluids. Quartz-VSMOW fractionation curve (solid black line; Sharp et al., 2016)shows that D017O values of quartz are too low to be in equilibrium with pristine seawater or shifted seawater except the two samples thatconnect to the grey line between VSMOW and MORB. The error bars represent 2 standard errors. B – Estimated d018O and D017O ofequilibrium fluids from the Vetreny belt and Hole 504B based on quartz-water fractionation at 333 ± 30 �C. Based on the lowest d018O valuesof epidotes and computed equilibrium fluids (blue cloud), we suggest that pristine 2.43–2.41 Ga seawater had d018O of �1.7‰ and D017O of�0.001‰ (blue diamond) which is similar to the values of seawater in the ice-free world. Measurements of modern seawater (Luz and Barkan,2010) are shown with the open diamond and error bars (2r). Black solid lines and tick marks represent hydrothermal fluids at different water-rock ratios as shown in the right corner. A possible explanation for such low D017O equilibrium fluids might involve phase separation whichwould produce a negative shift in D017O due to kinetic style of fractionation between vapor and brine. C – The low D017O values measured inquartz samples can be also explained by crystal growth at different temperatures without compete re-equilibration with the fluid. For example,a mixture of low-T (25–150 �C) and high-T quartz (400 �C) forms an array of compositions that is concave up in these coordinates. Acomposition with 10% of low-T quartz is shown. The measured samples could be interpreted as a mixture of quartz that formed at 320–400 �Cand low-temperature overgrowths. The ranges of d18O values measured by SIMS are shown with pink vertical bands. The d18O valuesmeasured in the healed cracks (CL-dark) from the Hole 504B quartz crystal are consistent with the low temperature of formation (�150 �C) inequilibrium with seawater-derived fluids. D – The CL-image of the 1 mm-long quartz crystal from the Hole 504B (sample 83-90R 71-72; seeTable 2) which shows that dissolution, re-precipitation, and healing of cracks occurred at different temperatures as manifested by differentbrightness in the image. The d18O values measured by SIMS in CL-bright and CL-dark (healed cracks) parts of the crystal are shown. (Forinterpretation of the references to colour in this figure legend, the reader is referred to the web version of this article.)
D.O. Zakharov, I.N. Bindeman /Geochimica et Cosmochimica Acta 248 (2019) 185–209 199

Fig. 10. The expected isotopic shift of hydrothermalfluids in a closed systemplottedat variablemasswater-rock ratios (W/R)with initial compositionof fluids as shown with curves: modern seawater, 2.43–2.41 Ga seawater and meteoric water with d18O = �15‰. The grey shaded region around thesolid black line represents glacial-interglacial variation for each isotopic parameter. The composition of the 2.43–2.41 Ga seawater is approximated bythe ice-free world seawater (Shackleton andKennett, 1975; Lecuyer et al., 1998; Sengupta and Pack, 2018). The isotopic shift in the fluid is computedfor each isotope using mass balance approach from Taylor (1977): (xwatercwater + (1 � xwater)crock)dfluid = xwatercwaterdwater + (1 � xwater)crock(drock � 1000 ln arock-water), where xwater is the mass fraction of initial water, c is concentration of either hydrogen or oxygen, d is the isotopiccomposition of shifted fluid, initial water and rock (MORB). The water/rock ratio is expressed through xwater/(1 � xwater). The fluid in equilibriumwithMORB is computed based on the values 1000 ln D/Harock-water, 1000 ln
18/16arock-water and hrock-water of�30‰, +2‰ and 0.529, respectively. Thed18O and dD values in modern hydrothermal fluids are shown with pink dashed lines (Shanks, 2001), indicating that water-rock ratios at submarinehydrothermal systems vary between 0.5 and 5 (green shaded area at the bottom plot). Based on high permeability of the studied rocks, we suggest thattheVetreny beltmight represent hydrothermal system that operated at comparable or higherwater-rock ratios. The lowest d018O values of equilibriumfluids and epidotes likely represent seawater valueswithminimal isotopic shift close to the ice-freeworld d18O value of around�1.5‰ (Shackleton andKennett, 1975). The D017O values of equilibrium fluids computed from quartz-water calibration (Sharp et al., 2016) are too low to be explained byshifted fluids as discussed inDiscussion 6.2.Due to small fractionation, theD017Oof epidotesmaybeused as a direct proxy for theD017O in equilibriumfluids.ThehighestD017Ovalueof epidote shouldbe the closest topristine seawater, thus, indicating that the 2.43–2.41 Ga seawater hadD017Overy closeto that of modern seawater. Similarly, the highest dD values of computed equilibrium fluids are very similar to the dD values of modern seawater.(For interpretation of the references to colour in this figure legend, the reader is referred to the web version of this article.)
200 D.O. Zakharov, I.N. Bindeman /Geochimica et Cosmochimica Acta 248 (2019) 185–209
D.O. Zakharov, I.N. Bindeman /Geochimica et Cosmochimica Acta 248 (2019) 185–209 201
marine basaltic rocks that were hydrothermally altered attemperature above 250 �C (Fig. 6B). We attribute abundantlow d18O values in the komatiitic basalts to pervasively hightemperatures (300–400 �C) of alteration in the intraconti-nental rift. A steep geothermal gradient due to storageand eruption of hot (1400 �C) high-magnesium melts(�150 �C hotter than modern MORBs) within the slowspreading continental rift would facilitate the high temper-ature of hydrothermal alteration. Presence of numeroussubvolcanic mafic intrusions within the belt (see Fig. 1) sup-port this suggestion.
6.2. The D17O values of hydrothermally altered rocks
Mass-dependent fractionation of triple oxygen isotopesbetween minerals and water is controlled by the tempera-ture of equilibrium and the identity of minerals which deter-mines respective fractionation factors a:
lnð17=16amineral�waterÞ ¼ h � lnð18=16amineral�waterÞ ð1Þwhere 17/16a and 18/16a are ratios of 17O/16O or 18O/16O in amineral to that in water. The value of h defines the slope ofequilibrium fractionation in the d018O � d017O space,varying in nature from �0.5 to 0.5305, increasing withtemperature and depending on kinetic/equilibrium type offractionation process (see Bao et al., 2016 for review).The equilibrium fractionation is such that minerals arehigher in d18O and lower in D017O compared to water(e.g. Zheng, 1993; Sharp et al., 2016). At infinitely high tem-peratures the a values approach 1, and the h approaches0.5305 (Matsuhisa et al., 1978). As a first order observation,epidotes from Hole 504B and the Vetreny belt, whichformed within a similar range of temperatures, overlap intheir D017O values, suggesting the similarity of D017O ofmodern-day and the early Paleoproterozoic seawater-derived fluids (Fig. 9A). In this study we emphasize thatespecially useful comparison can be drawn using epidotes,because the aepidote-water factor is very close to 1 at 300–390 �C (1000 ln 18/16a � 0‰; Zheng, 1993). At these tem-peratures, the difference between D017O values of fluidsand minerals approach zero (Hayles et al., 2018). Thus,the oxygen isotope values of epidotes can serve as a directproxy for that of the fluid. This is reflected in general agree-ment between d018O values of computed fluids and mea-sured epidotes (see Fig. 10). Epidotes both from Hole504B and the Vetreny belt plot between modern seawaterand the mantle (Fig. 9), which suggests that they likelyformed in equilibrium with seawater-derived fluids with ini-tial D017O value close to 0‰. Hydrothermal modification ofseawater produces positive shift in d18O and negative shiftin D017O values compared to pristine seawater. Two epi-dotes from the Vetreny belt plot in the region with d18Oslightly lower than VSMOW (Fig. 9A) could be reflectiveof smaller degree of modification of original seawater withd018O = �1.7‰ and D017O of about �0.001‰. The alteredkomatiitic basalts that are composed amphibole, chlorite,quartz, epidote, and other minerals, have D017O lower thanthat of epidotes perhaps due to larger fractionation betweenthe constituent minerals (especially quartz) and water com-pared to pure epidote.
Triple oxygen isotope fractionation between water andquartz is much larger compared to epidotes and it has beenrecently calibrated: 18/16aquartz-water = 1.006–1.007 andh = 0.526–0.527 at 300–390 �C (see Eq. (1); Cao and Liu,2011; Sharp et al., 2016; Wostbrock et al., 2018). Thus,quartz in equilibrium with pristine seawater must haveD017O between �0.030 and �0.020‰ relative to the refer-ence line with slope 0.5305. However, the majority ofD017O values of analyzed quartz from the Vetreny beltand Hole 504B are too low to be in equilibrium with seawa-ter at any temperature (Fig. 9A). Two samples of quartzcan be explained by equilibrium with shifted seawater atlow water-rock ratios (Fig. 9B). We suggest two possibili-ties that can explain this observation: (i) the isotopic shiftin equilibrium fluids was caused by phase separation inaddition to water-rock interaction; (ii) analyzed samplesrepresents a mixture of high- and low-temperature quartz;(iii) the triple oxygen isotope fractionation that was origi-nally calibrated using low temperature equilibrium,between 4 and 100 �C (Sharp et al., 2016; Wostbrocket al., 2018), could not be accurately applied to highertemperatures.
Even though high-temperature boiling and phase sepa-ration have not been studied for triple oxygen isotopes,we suggest that together with water-rock interaction theseprocess might have contributed to the negative D017O shiftin hydrothermal fluids due to the slope of vapor-brine frac-tionation is smaller than the reference line 0.5305 (seeFig. 9B). We propose this to be a possible mechanismbecause we observe that fluid inclusions trapped in quartzconsist of brine and vapor (Fig. 5) recording phase separa-tion of the hydrothermal fluid. The maximum expectedequilibrium fractionation of d18O between fluid and vaporphase is �2‰ (Shmulovich et al., 1999). The expectedD017O shift could be as low as �0.03‰, if separation ofbrine from vapor induces fractionation with very shallowslope (�0.516) in the d017O-d018O space (see Fig. 9B).
Alternatively, systematically low D017O values could beattained by quartz that grew at different temperatures with-out complete re-equilibration with the fluid. Unlike epidote(Bird and Spieler, 2004), quartz is stable over a wide rangeof temperature and can grow from high- and low-temperature (below 100 �C; e.g., Wostbrock et al., 2018)hydrothermal fluids attaining very low D017O values, reach-ing �0.25‰ in equilibrium with seawater at 25 �C(Fig. 9C). Mixing high-temperature and low-temperaturequartz creates an array that is concave up in d018O � D017Ospace, thus yielding D017O values lower than equilibriumcurves (Fig. 9C). This process can be exemplified by thecathodoluminescence (CL) image of one of the quartz sam-ples from the Hole 504B, showing a complex history ofgrowth involving dissolution and re-precipitation(Fig. 9D). Since CL-brightness is controlled by Ticoncentration in quartz with the partitioning being stronglydependent on temperature (Wark and Watson, 2006), dis-solution and re-precipitation likely occurred at differenttemperatures as manifested by the CL-bright crystal withCL-dark healed cracks and outermost zones (Fig. 9D).Assuming that the quartz grew from the same shiftedseawater, a combination of quartz that formed at

202 D.O. Zakharov, I.N. Bindeman /Geochimica et Cosmochimica Acta 248 (2019) 185–209
350–400 �C with about 10–40% of low-temperature quartz(25–150 �C) would account for most of the low D017Ovalues. Quartz with minimal amount of low-temperatureovergrowth would then have the lowest d18O and highestD017O values yielding the most accurate equilibrium temper-atures and fluids. Similar results could be obtained withrespect to the low D017O values by changing the composi-tion of equilibrium fluids or/and including multiple sets ofhigh-temperature and low-temperature overgrowths.
In order to gain a better insight, we conducted a prelim-inary in situ analysis by secondary-ion mass spectrometry(SIMS) of quartz from the Hole 504B and Vetreny beltwhich showed that most crystals have d18O = 7–9‰, agree-ing well with our laser fluorination measurements. The CL-dark healed cracks in the quartz crystal from Hole 504B(Fig. 9D) have d18O of 15–16‰ indicating lower equilib-rium temperature (�150 �C) supporting our suggestion thatat least some of the low D017O values in quartz can be aresult of mixing between high- and low-temperature quartz.
Most importantly, the similarity between the values ofancient and recent submarine hydrothermally altered rocks,especially in epidotes, is a convincing evidence that the2.43–2.31 Ga seawater had D017O close to that of modernseawater. The highest D017O and the lowest d018O valuesof epidotes are likely the most reflective of alteration by sea-water at high-water ratios (Fig. 10). We suggest that directmeasurements of D017O values in hydrothermal fluids couldbe useful, providing insights in the subsurface processes athydrothermal systems, and validating the application ofquartz-water calibration.
6.3. Recognizing primary dD values
Hydrogen isotopes in hydrous minerals are much moresusceptible to post-depositional alteration than oxygen iso-topes (see Kyser and Kerrich, 1991). Thus, not surprisingly,the dD values in bulk altered komatiitic basalts and gab-bros display large scatter (between �210 and �50‰) com-pared to the restricted range of d18O values. Meanwhile,most of the coarse crystals of epidotes have much smallerrange of dD values (between �56 and �8‰; Fig. 6B). Weattribute this scatter and occurrence of very low dD valuesin bulk samples to secondary exchange of hydrogen in chlo-rites and other water-rich phyllosilicates at low temperaturewhich causes large negative shifts in dD (Wenner andTaylor, 1974; Kyser and Kerrich, 1991). Chlorite containsup to 13 wt.% H2O and thus, contributes to the dD valueof a whole rock in much larger proportion compared toother less hydrous minerals. This is especially noticeableby the negative correlation between dD and H2O in wholerock samples (Fig. 7). The small grain size (<10 lm) andlarge surface area of chlorite in bulk samples (see Fig. 3)dramatically enhances secondary hydrogen isotopeexchange at low temperatures, which could have occurredat any point between 2.43–2.41 Ga and now (Fig. 7).
We attempted to reconstruct the dD of pure chloriteassuming it is responsible for the low dD values in our sam-ples. These rocks contain at least 8 wt.% chlorite (see Fig. 3and XRD data; Supplementary Table 1) accounting for�1 wt.% H2O in the whole rock. Since there is about
�100‰ fractionation at low temperature (<100 �C)between water and phyllosilicates like serpentine, kaolinite,and chlorite (Wenner and Taylor, 1974; Kyser and Kerrich,1991), we hypothesize that hydrating water had to have dDvalue between �80 and �10‰ to produce values between�180 and �210‰ in the whole rock (Fig. 7). This is in goodagreement with most of the low dD values ranging between1 and 4 wt.% water and chlorite content between 10 and25 wt.%. While modern day local meteoric water with therange of values between �70 and �100‰ (Bowen, 2010)can explain most of the low dD values, we should mentionthe possibility of hydrogen isotope exchange between chlo-rite and meteoric water at any point after the originalhydrothermal alteration including the cold climate of subse-quent Paleoproterozoic snowball Earth episodes.
In this work we are able to rely on large crystals of epi-dotes with 1.7–2.0 wt.% water and consider them as pri-mary recorders of hydrogen isotopic composition ofseawater. Any alteration or addition of chlorite can be rec-ognized by elevated H2O content. For example, one epidoteyields dD of �119‰ and contains a slightly elevatedamount of water (2.1 wt.%) which is the upper limit ofthe accepted range (Fig. 7B), and thus is considered to bean outlier that was either altered or contains inclusions ofchlorite. Epidotes with �2.0 wt.% water are constrainedeven a narrow range of dD values, between �32 and�8‰ (see Fig. 7A). Alteration of the hydrogen isotope sig-nal in hydrothermally altered rocks minimally affects thed18O and D017O values, which makes triple oxygen isotopeanalysis a powerful tool for back tracking the d18O of orig-inal water involved in hydrothermal alteration (Fig. 7C).
6.4. The dD of hydrothermally altered rocks and fluids
Reported values of dD in epidotes from modern oceanfloor (e.g. Stakes and O’Neil, 1982), ophiolites (Heatonand Sheppard, 1977; Harper et al., 1988; Fonneland-Jorgensen et al., 2005), as well as epidotes from Hole504B measured here (Table 1) have very similar ranges ofvalues, between �40 and +5‰. These overlap with therange of dD measured in well-preserved epidotes from theVetreny belt, between �51 and �8‰ (Fig. 6C). The com-puted dD values of hydrothermal fluids range between�36 and +26‰ which is not distinguishable from the mod-ern seawater with dD = 0 ± 20‰, and overlaps with com-puted dD values for the Hole 504B samples (see Table 1).The choice of fractionation factor (Graham andSheppard, 1980; Chacko et al., 1999) creates a discrepancyof about �10–20‰ (see Fig. 6); we favor the fractionationfactor of Graham and Sheppard (1980) because it accountsfor the salinity of equilibrium fluids. The range of com-puted dD values is then between �36 and +12‰. The fourepidotes with water content �2 wt.% have the highest dDvalues (see Fig. 6), constraining the equilibrium fluids tothe range of dD values between �12 and +12‰ (Table 1).These values should be very close to that of pristine seawa-ter as hydrogen is contained in minute amounts in igneousrocks. As indicated by the high salinity of fluid inclusions,phase separation of seawater-derived hydrothermal fluidtook place during the eruption of the komatiitic basalts,

Fig. 11. A – The secular trend of d18O values in seawater as recorded by equilibrium fluids computed from submarine hydrothermally alteredrocks (diamonds and vertical bars) and carbonates (grey circles). The d18O values of equilibrium fluids are from ophiolites: Troodos (Heatonand Sheppard, 1977), Semail (Gregory and Taylor, 1981), Josephine (Alexander et al., 1993), Erquy succession (Lecuyer et al., 1996), Solund-Stavfjord (Fonneland-Jorgensen et al., 2005), Betts Cove (Turchyn et al., 2013) and Bou Azzer (Hodel et al., 2018). The more recent seawateris recorded by dredged and drilled submarine hydrothermally altered rocks from modern seafloor (Alt et al., 1986, 1995; Stakes and O’Neil,1982 and this study). The green bars indicate rough estimates of d18O of seawater based on patterns of distribution of d18O values in sectionsof ancient oceanic crust: 2.0 Ga Pirtuniq ophiolite (Holmden and Muehlenbachs, 1993) and 3.8 Ga Isua belt (Furnes et al., 2007). The Vetrenybelt (purple diamonds), almost contemporaneous with the Ongeluk volcanics (Gutzmer et al., 2001), represents one of the oldest records ofpreserved isotopic equilibrium with seawater. The lowest d18O values of equilibrium fluids suggest that the value of seawater stayed between�1 and 0‰ for the most of the Earth’s history, while the carbonate record shows the secular increase in the d18O value of seawater over thecourse of geologic time (Prokoph et al., 2008). B – The secular trend of dD of seawater as recorded by epidotes, chlorites and antigoritesformed in submarine hydrothermally altered rocks. The evolution of seawater dD values is after Pope et al. (2012) with curves for epidote,chlorite and antigorite going parallel to that with the offset based on the dD values in the recent submarine rocks. The Vetreny belt epidoteshave the dD values very close to modern submarine epidotes, likely reflecting the dD value of �0‰ in the 2.43–2.41 Ga. Since antigorites andchlorites are susceptible to secondary hydrogen isotope exchange at low temperatures (Kyser and Kerrich, 1991), epidotes represent the bestavailable record of dD evolution of seawater. The compilation of antigorites is adopted from Pope et al. (2012) and references therein.Phanerozoic submarine chlorites and epidotes are from the same references as for the d18O values. C – Generalized evolution of atmosphericoxygen in equivalent of present atmospheric level (PAL), relative change in hydrogen escape rates and d18O values of shales withsupercontinent assemblies and episodes of global glaciations imposed (after Zanhle et al., 2013; Lyons et al., 2014; Bindeman et al., 2016).(For interpretation of the references to colour in this figure legend, the reader is referred to the web version of this article.)
D.O. Zakharov, I.N. Bindeman /Geochimica et Cosmochimica Acta 248 (2019) 185–209 203

204 D.O. Zakharov, I.N. Bindeman /Geochimica et Cosmochimica Acta 248 (2019) 185–209
potentially fractionating hydrogen isotopes. However, frac-tionation of hydrogen isotopes between vapor and brine athigh-temperatures (above 200 �C) is only a few ‰ (Horitaand Wesolowski, 1994; Shmulovich et al., 1999; Shanks,2001). The range of computed dD values limits significantcontribution of meteoric water involved in the alterationof Vetreny belt rocks, because meteoric water has distinctlylow dD (as well as d18O) values (see Fig. 6B). We thus con-clude that the dD value of the early Paleoproterozoic sea-water was very close to that that of modern seawaterwithin the range 0 ± 20‰.
6.5. The d18O, D17O and dD of seawater through time
Our multi-isotope study indicates that d18O, D017O anddD values of the early Paleoproterozoic seawater were closeto zero. The results are corroborated by previous d18O stud-ies (Fig. 11) of bulk rock samples from the �3.8 Ga Isuabelt, Greenland (Furnes et al., 2007) and the 2 Ga Purtuniqophiolite, Canada (Holmden and Muehlenbachs, 1993).The more detailed oxygen isotope investigation involvingmineral pairs and fluid inclusion analyses of the 2.43 Gasubmarine Ongeluk volcanics from South Africa(Gutzmer et al., 2001, 2003) also indicate that seawaterhad the d18O value of 0 ± 2‰.
From mass-balance considerations, the oxygen isotopiccomposition of seawater on the time scales of tens of mil-lion years is controlled by inputs from hydrothermal alter-ation at mid-ocean ridges and continental weathering, andto a lesser extent by submarine weathering (Holland,1984; Muehlenbachs, 1998). Faster than modern spreadingrates would not significantly affect the d18O of seawater,while slower rates would lead to negative d18O and positiveD017O values (Holland, 1984; Sengupta and Pack, 2018).Similarly, an increase in input of 18O from continentalweathering throughout geologic time, for example, due togrowth of continental crust, its rapid emergence at theArchean-Proterozoic boundary (Taylor and McLennan,1985; Bindeman et al., 2016; Bindeman et al., 2018), wouldcause negative shifts in the d18O and positive shifts D017O ofseawater (Muehlenbachs, 1998; Sengupta and Pack, 2018).Our results suggest that the constancy of d18O and D017O ofseawater implies that the Paleoproterozoic plate tectonics,particularly spreading at mid-ocean ridges and continentalweathering, operated in a similar way as it does today.These long-term trends may carry short-term (0.01–0.1 Ma) Milankovich-scale variations. The d18O value of0 ± 1‰ of seawater is recorded by Pleistocene marine car-bonates reflecting variations in the ocean temperature,and amount of water locked in continental glacial ice(Imbrie et al., 1984; Schrag et al., 1996). The supposedlylarge amount of continental glacial ice stored on Earth’ssurface during snowball Earth episodes would lead to 2–3‰ higher in d18O oceans; this effect would be counter-balanced by the opposite isotopic effect of sea-ice forma-tion, together not contributing to a significant shift in thed18O of seawater (see discussion in Bindeman and Lee,2017). Our estimated d18O and D017O values of 2.43–2.41 Ga seawater are close to the estimated seawater com-position during warm climate of the ice-free Cenozoic
(Shackleton and Kennett, 1975; Sengupta and Pack,2018). The evidence from the Vetreny belt validates theassumptions made previously that low d18O meteoric water(as low as �35‰) was formed by evaporation of seawaterwith d18O � 0‰. The record of such low d18O meteoricwater is provided by the coeval ultralow d18O Belomorianbelt rocks (Bindeman et al., 2014; Herwartz et al., 2015;Bindeman and Lee, 2017; Zakharov et al., 2017).
Our measurements of well-preserved epidotes from the2.43–2.41 Ga Vetreny belt provide the oldest robust evi-dence for dD � 0‰ in seawater (see Fig. 11B). Previous esti-mates of the hydrogen isotope composition of Precambrianseawater were based on samples containing easily exchange-able water. Such studies used bulk rock dD values in the2.0 Ga chlorite-bearing basalts constraining the dD valueof seawater at 0‰ (Lecuyer et al., 1996), and serpentinesfrom the 3.8 Ga Isua belt suggesting that the early Archeanseawater was about 25‰ lighter in dD (Pope et al., 2012). Asdiscussed in Section 6.4, water-rich phyllosilicates such aschlorite and serpentine are poor recorders of original equi-librium fluids due to susceptibility to secondary isotopeexchange with ambient water at low temperature. Ourresults suggest that the long-term evolution of the hydrogenisotopic composition of seawater is controlled primarily byhydrothermal alteration at mid-ocean ridges, subduction,and water outgassing at subduction zones. The variabilityin the rates of these processes might contribute about±20‰ to the dD of seawater (Lecuyer et al., 1998). Signifi-cant decrease of ocean volume and accompanied increase inthe seawater dD due to net mantle regassing (Kurokawaet al., 2018) must have occurred by 2.43–2.41 Ga as indi-cated by our results. Additionally, in the Archean and earlyPaleoproterozoic oxygen-poor atmosphere, the hydrospherewas likely subjected to intense hydrogen escape, which is oneof the proposed mechanisms that caused atmospheric oxy-genation of our planet (Zahnle et al., 2013). Through waterphotolysis, 1H escape from the planet is greater than deu-terium, causing the dD value of seawater become progres-sively higher with time (Lecuyer et al., 1998; Pope et al.,2012). Our results are most consistent with seawater havingdD values of �0 ± 20‰ at 2.43–2.41 Ga, which suggeststhat most of the hydrogen loss occurred and the Earth’sby the time the Vetreny belt formed (Lecuyer et al., 1998;Zahnle et al., 2013). The isotopic composition of paleo-atmospheric Xe trapped in the quartz veins studied here isalso consistent with most of hydrogen escape occurringprior to 2.43 Ga (Avice et al., 2018).
The sedimentary record, however, suggests different con-clusions: ancient carbonates and cherts show a strongsteady increase in d18O corresponding to about 13‰ from3.5 to 0 Ga (Fig. 11A). This observation implies a signifi-cantly lower d18O value for seawater in the Precambrianocean than the d18O recorded by ancient hydrothermallyaltered rocks (see Jaffres et al., 2007 for details). From amass-balance perspective, these shifts are possible byadjusting sinks and sources of 18O in the ocean. Severalmodels have been proposed to address possible long-termshifts in the sinks and sources of 18O over the geologicaltime scale relating them to the cycling of water through sub-duction zones, mantle degassing, increasing ocean depth
D.O. Zakharov, I.N. Bindeman /Geochimica et Cosmochimica Acta 248 (2019) 185–209 205
and development of pelagic sediments at mid-ocean ridges(Wallmann, 2001, 2004; Kasting et al., 2006; Korenagaet al., 2017). In such case, the high temperature hydrother-mal systems are decoupled from the d18O of seawater andcould not be used to constrain the composition of ancientseawater. However, this would be inconsistent with resultsfrom elsewhere, for example, from low-d18O hydrothermalsystems charged with meteoric water (e.g. Taylor, 1977;Pope et al., 2014). The secular trend of d18O in seawatercould also be explained by much higher temperature ofthe Precambrian ocean (80–90 �C; e.g. Robert andChaussidon, 2006) which is often portrayed as implausiblefor sustaining life. The main argument contradicting thesedimentary record has been the susceptibility of carbon-ates and cherts to recrystallization during diagenesis inopen system, which would alter the d18O (and dD; Hrenet al., 2009) to lower values. Today the argument isstrengthened by a growing body of clumped isotope studiesthat can resolve the effect of diagenetic recrystallization.Well preserved carbonates suggest that the temperature ofocean did not experience significant variations and thed18O of seawater stayed within ±2‰ at least in the earlyPhanerozoic (Eiler, 2011; Cummins et al., 2014) potentiallybridging the gap between the sedimentary record andhydrothermally altered rocks.
7. CONCLUSIONS
1. From the stratigraphic context and geochemical datapresented here, the 2.43–2.41 Ga Vetreny belt rockslikely recorded interaction with contemporaneous sea-water. Based on average homogenization temperaturesof saline fluid inclusions and oxygen isotope thermome-try, komatiitic basalts were hydrothermally altered attemperatures ranging from 300 to 390 �C.
2. Our data are the most consistent with the d18O value ofthe 2.43–2.41 Ga seawater being close to the d18O of sea-water in the pre-Pleistocene ice-free world. This result issupported by similar studies of Paleoproterozoic andArchean submarine hydrothermally altered rocks.
Table A1Analysis of SCO from each analytical session used for monitoring the a
Dateyyyy/mm/dd
d17O SE d18O SE
2017/01/23 2.820 0.015 5.548 0.02017/01/23 2.704 0.008 5.277 0.02017/01/27 2.608 0.013 5.132 0.02017/01/27 3.072 0.015 5.999 0.02017/05/16 2.876 0.008 5.512 0.02017/06/16 2.793 0.008 5.369 0.02017/06/16 2.713 0.009 5.287 0.02017/07/17 2.621 0.007 5.093 0.02017/09/01 2.758 0.012 5.308 0.02017/09/05 2.913 0.010 5.634 0.02017/10/04 3.049 0.011 5.900 0.0
AveragerSE
3. The D017O values measured in quartz and epidotes fromthe Miocene (6–7 Ma) hydrothermally altered oceaniccrust as sampled by ODP Hole 504B are very similarto those measured from the Vetreny belt indicating thatthe seawater had D017O value similar to modern. Due tosmall fractionation at 300–390 �C, epidotes are a gooddirect proxy for the D017O of equilibrium fluids. Quartzhas D017O values lower than expected from equilibriumfractionation (Sharp et al., 2016; Hayles et al., 2018).This could be explained by presence of low-temperature overgrowths and healed cracks in quartzwhich produces mixed compositions with low D017O val-ues (see Fig. 9C).
4. The dD values of large and unaltered epidotes presentedhere provide one of the earliest evidences of seawaterwith dD of 0 ± 20‰, similar to the modern-day valueof seawater. This indicates that if significant increase inthe dD of seawater occurred due to hydrogen escapeand net mantle regassing (e.g., Kurokawa et al., 2018),this must have happened by 2.43–2.41 Ga.
5. Our study verifies the previously made assumptionsabout the plausibility of obtaining ultralow d18O mete-oric waters through hydrological cycle involving evapo-ration of the early Paleoproterozoic seawater withnear-zero d18O, dD and D017O values (Bindeman et al.,2014; Herwartz et al., 2015; Bindeman and Lee, 2017;Zakharov et al., 2017).
ACKNOWLEDGMENTS
We would like to thank Dr. James Palandri for assis-tance in with stable isotope analysis and editorial commentson our manuscript. Dr. Mark Reed for providing the accessto fluid inclusion microthermometry equipment, Kris John-son for building the line for D017O measurements, Dr.Kouki Kitajima and Dr. John Valley for providind thed18O measurements of quartz by SIMS at University ofWisconsin. We also thank Mike Hudak and Genevieve Per-due for proof-reading the manuscript, and Sofia Mezh-elovskaya, Anatoliy Korsakov, Viktoria Kulikova and
ccuracy of analyses.
d017O d018O D017O SE
06 2.816 5.533 �0.120 0.01506 2.700 5.263 �0.091 0.00806 2.604 5.119 �0.111 0.01404 3.067 5.981 �0.106 0.01504 2.872 5.497 �0.044 0.00806 2.789 5.354 �0.052 0.00903 2.709 5.273 �0.088 0.00904 2.617 5.080 �0.078 0.00804 2.754 5.294 �0.055 0.01304 2.909 5.618 �0.071 0.01004 3.044 5.882 �0.076 0.011
2.807 5.445 �0.0810.155 0.292 0.0250.047 0.088 0.008

206 D.O. Zakharov, I.N. Bindeman /Geochimica et Cosmochimica Acta 248 (2019) 185–209
Vyacheslav Kulikov for providing samples for preliminarystudies, and to Andrey Bekker and 3 anonymous reviewersfor helpful comments and suggestions. The funding is pro-vided by NSF grant #1447337. We thank the EvolvingEarth Foundation for awarding funds to conduct the studyby SIMS. We are also grateful to the Jay M. McMurrayfund distributed through Department of Earth Sciences,University of Oregon for the support provided for complet-ing field work in NW Russia.
APPENDIX A
Standardization: San Carlos olivine
San Carlos olivine (SCO) was used as a standard withineach analytical session to monitor accuracy of the analyses.Individual measurements of SCO and dates of each sessionare listed in Table A1. The previously published analysis ofSCO performed using fluorination of VSMOW yieldedd018O = 5.140 and d017O = 2.677 (Pack et al., 2016) and isaccepted here as a point of reference. The raw values ofthe unknowns are listed in Supplementary Table 4. Eachsession was adjusted by the difference between analyzedSCO and composition given in Pack et al. (2016).
APPENDIX B. SUPPLEMENTARY MATERIAL
Supplementary data to this article can be found online athttps://doi.org/10.1016/j.gca.2019.01.014.
REFERENCES
Alexander R. J., Harper G. D. and Bowman J. R. (1993) Oceanicfaulting and fault-controlled subseafloor hydrothermal alter-ation in the sheeted dike complex of the Josephine ophiolite. J.Geophys. Res. Earth 98, 9731–9759.
Alt J. C. and Bach W. (2006) Oxygen isotope composition of asection of lower oceanic crust, ODP Hole 735B. Geochem.
Geophys. Geosyst. 7, 1–18.Alt J. C., Muehlenbachs K. and Honnorez J. (1986) An oxygen
isotopic profile through the upper kilometer of the oceaniccrust, DSDP Hole 504B. Earth Planet. Sci. Lett. 80, 217–229.
Alt J. C., Zuleger E. and Erzinger J. (1995) Mineralogy and stableisotopic compositions of the hydrothermally altered lowersheeted dike complex, hole 504B, leg 140. Proc. Ocean Drill.
Progr. Sci. Results 137, 155–166.Alt J. C., Laverne C., Vanko D. a., Tartarotti P., Teagle D. a. H.,
Bach W., Zuleger E., Ezringer J., Honnorez J., Pezard P. a.,Becker K., Salisbury M. H. and Wilkens R. H. (1996)Hydrothermal alteration of a section of upper oceanic crustin the easter equatorial Pacific: a synthesis of results from Site504 (DSDP Legs 69, 70, and 83, and ODP Legs 111, 137, 140,and 148). Proc. Ocean Drill. Program Sci. Results 148, 417–434.
Astafieva M. M., Rozanov A. Y., Sharkov E. V., Chistyakov A. V.,Bogina M. M. and Hoover R. B. (2009) Volcanic glasses ashabitat for microfossils: evidence from the early Paleoprotero-zoic pillow lavas of Karelia and their modern analogues in theMid-Atlantic Ridge. In Instruments Methods Astrobiol. Planet.
Mission. XII, SPIE Proc. 7441, pp. 1–12.Avice G., Marty B., Burgess R., Hofmann A., Philippot P., Zahnle
K. and Zakharov D. (2018) Evolution of atmospheric xenon
and other noble gases inferred from Archean to Paleoproterzoicrocks. Geochim. Cosmochim. Acta.
Bao H., Cao X. and Hayles J. A. (2016) Triple oxygen isotopes:fundamental relationships and applications. Annu. Rev. EarthPlanet. Sci. 44, 463–492.
Bekker A., Holland H. D., Wang P.-L. L., Rumble D., Stein H. J.,Hannah J. L., Coetzee L. L. and Beukes N. J. (2004) Dating therise of atmospheric oxygen. Nature 427, 117–120.
Bindeman I. N. and Lee J. E. (2017) The possibility of obtainingultra-low-d18O signature of precipitation near equatorial lati-tudes during the Snowball Earth glaciation episodes. Precambr.
Res..Bindeman I. N., Serebryakov N. S., Schmitt A. K., Vazquez J. A.,
Guan Y., Azimov P. Y., Astafiev B. Y., Palandri J. andDobrzhinetskaya L. (2014) Field and microanalytical isotopicinvestigation of ultradepleted in 18O Paleoproterozoic ‘‘slush-ball earth” rocks from Karelia, Russia. Geosphere 10, 308–339.
Bindeman I. N., Bekker A. and Zakharov D. O. (2016) Oxygenisotope perspective on crustal evolution on early Earth: A recordof Precambrian shales with emphasis on Paleoproterozoicglaciations and Great Oxygenation Event. Earth Planet. Sci.
Lett. 437, 101–113. https://doi.org/10.1016/j.epsl.2015.12.029.Bindeman I. N., Zakharov D. O., Palandri J., Greber N. D.,
Retallack G. J., Hofmann A., Dauphas N., Lackey J. S. andBekker A. (2018) Rapid emergence of subaerial landmasses andonset of a modern hydrologic cycle 2.5 billion years ago. Nature
557, 545–557.Bird D. K. and Spieler A. R. (2004) Epidote in geothermal systems.
Rev. Mineral. Geochem. 56, 235–300.Bischoff J. L., Rosenbauer R. J. and Pitzer K. S. (1986) The system
NaCl-H2O: relations of vapor-liquid near the critical temper-ature of water and of vapor-liquid-halite from 300� to 500�C.Geochim. Cosmochim. Acta 50, 1437–1444.
Bowen G. J. (2010) Waterisotopes.org. Gridded maps of theisotopic composition of meteoric precipitation.
Bushmin S. A. and Glebovitsky V. A. (2008) Scheme of mineralfacies of metamorphic rocks. Geol. Ore Dep. 50, 659.
Cao X. and Liu Y. (2011) Equilibrium mass-dependent fraction-ation relationships for triple oxygen isotopes. Geochim. Cos-
mochim. Acta 75, 7435–7445.Chacko T., Riciputi R., Cole R. and Horita J. T. (1999) A new
technique for determining equilibrium hydrogen isotope frac-tionation factors using the ion microprobe: application to theepidote-water system. Geochim. Cosmochim. Acta 63–1, 1–10.
Cummins R. C., Finnegan S., Fike D. A., Eiler J. M. and FischerW. W. (2014) Carbonate clumped isotope constraints onSilurian ocean temperature and seawater d18O. Geochim.
Cosmochim. Acta 140, 241–258.Dodson M. H. (1973) Closure temperature in cooling geochrono-
logical and petrological systems. Contrib. Mineral. Petrol. 40,259–274.
Depaolo D. J. (2006) Isotopic effects in fracture-dominated reactivefluid – rock systems. Geochim. Cosmochim. Acta 70, 1077–1096.
Eiler J. M. (2011) Paleoclimate reconstruction using carbonateclumped isotope thermometry. Quat. Sci. Rev. 30, 3575–3588.
Fonneland-Jorgensen H., Furnes H., Muehlenbachs K. and DilekY. (2005) Hydrothermal alteration and tectonic evolution of anintermediate- to fast-spreading back-arc oceanic crust: lateOrdovician Solund-Stavfjord ophiolite, western Norway. Isl.
Arc 14, 517–541.Foustoukos D. I. and Seyfried W. E. (2007) Fluid phase separation
processes in submarine hydrothermal systems. Rev. Mineral.
Geochemistry 65, 213–239.Furnes H., de Wit M., Staudigel H., Rosing M. and Muehlenbachs
K. (2007) A vestige of Earth’s oldest ophiolite. Science 315,1704–1707.

D.O. Zakharov, I.N. Bindeman /Geochimica et Cosmochimica Acta 248 (2019) 185–209 207
Graham C. M. and Sheppard S. M. F. (1980) Experimentalhydrogen isotope studies, II. Fractionations in the systemsepidote-NaCl-H2O, epidote-CaCl2-H2O and epidote-seawater,and the hydrogen isotope composition of natural epidotes.Earth Planet. Sci. Lett. 49, 237–251.
Grassineau N. V., Mattey D. P. and Lowry D. (2001) Sulfurisotope analysis of sulfide and sulfate minerals by continuousflow-isotope ratio mass spectrometry. Anal. Chem. 73, 220–225.
Gregory R. T. and Taylor H. P. (1981) An oxygen isotope profile ina section of Cretaceous oceanic crust, Samail Ophiolite, Oman:evidence for d18O buffering of the oceans by deep (>5 km)seawater-hydrothermal circulation at mid-ocean ridges. J.
Geophys. Res. Solid Earth 86, 2737–2755.Gumsley A. P., Chamberlain K. R., Bleeker W., Soderlund U., de
Kock M. O., Larsson E. R. and Bekker A. (2017) Timing andtempo of the Great Oxidation Event. Proc. Natl. Acad. Sci. 114,201608824.
Gutzmer J., Pack A., Luders V., Wilkinson J., Beukes N. andNiekerk H. (2001) Formation of jasper and andradite duringlow-temperature hydrothermal seafloor metamorphism, Onge-luk Formation, South Africa. Contrib. Mineral. Petrol. 142, 27–42.
Gutzmer J., Banks D. A., Luders V., Hoefs J., Beukes N. J. andvon Bezing K. L. (2003) Ancient sub-seafloor alteration ofbasaltic andesites of the Ongeluk Formation, South Africa:implications for the chemistry of Paleoproterozoic seawater.Chem. Geol. 201, 37–53.
Harper G. D., Bowman J. and Kuhns R. (1988) A field, chemical,and stable isotope study of subseafloor metamorphism of theJosephine ophilote, California-Oregon. J. Geophys. Res. 93,4625–4656.
Hayles J., Gao C., Cao X., Liu Y. and Bao H. (2018) Theoreticalcalibration of the triple oxygen isotope thermometer. Geochim.
Cosmochim. Acta 235, 237–245. https://doi.org/10.1016/j.gca.2018.05.032.
Heaton T. H. E. and Sheppard S. M. F. (1977) Hydrogen andoxygen isotope evidence for sea-water-hydrothermal alterationand ore deposition, Troodos complex, Cyprus. Geol. Soc.
London Spec. Publ. 7, 42–57.Herwartz D., Pack A., Krylov D., Xiao Y., Muehlenbachs K.,
Sengupta S. and Di Rocco T. (2015) Revealing the climate ofsnowball Earth from D17O systematics of hydrothermal rocks.Proc. Natl. Acad. Sci. 112, 5337–5341.
Horita J. and Wesolowski D. J. (1994) Liquid-vapor fractionationof oxygen and hydrogen isotopes of water from the freezing tothe critical temperature. Geochim. Cosmochim. Acta 58, 3425–3437.
Hey M. H. (1954) A new review of the chlorites. Mineral. Mag. 30,277–292.
Hodel F., Macouin M., Trindade R. I. F., Triantafyllou A., GanneJ., Chavagnac V., Berger J., Rospabe M., Destrigneville C.,Carlut J., Ennih N. and Agrinier P. (2018) Fossil black smokeryields oxygen isotopic composition of Neoproterozoic seawater.Nat. Commun..
Hoefs J. (2015) Stable Isotope Geochemistry, seventh ed. Springer,Berlin, p. 389.
Holland H. D. (1984) The Chemical Evolution of the Atmosphere
and Oceans. Princeton University Press, p. 598.Holmden C. and Muehlenbachs K. (1993) The 18O/16O ratio of 2-
billion-year-old seawater inferred from ancient oceanic crust.Science 259, 1733–1736.
Hren M. T., Tice M. M. and Chamberlain C. P. (2009) Oxygen andhydrogen isotope evidence for a temperate climate 3.42 billionyears ago. Nature 462, 205–208.
Imbrie J., Hays J. D., Martinson D. G., McIntyre A., Mix A. C.,Morley J. J., Pisias N. G., Prell W. L. and Shackleton N. J.
(1984) The orbital theory of Pleistocene climate: support from arevised chronology, of the marine d18O record. In Milankovitch
and Climate, Part 1 (ed. Berger). Springer, New York, pp. 269–305.
Jaffres J. B. D., Shields G. A. and Wallmann K. (2007) The oxygenisotope evolution of seawater: a critical review of a long-standing controversy and an improved geological water cyclemodel for the past 3.4 billion years. Earth-Sci. Rev. 83, 83–122.
Kasting J. F., Howard M. T., Wallmann K., Veizer J., Shields G.and Jaffres J. (2006) Paleoclimates, ocean depth, and the oxygenisotopic composition of seawater. Earth Planet. Sci. Lett. 252,82–93.
Kawahata H., Kusakabe M. and Kikuchi Y. (1987) Strontium,oxygen, and hydrogen isotope geochemistry of hydrothermallyaltered and weathered rocks in DSDP Hole 504B, Costa RicaRift. Earth Planet. Sci. Lett. 85, 343–355.
Kempton P. D., Hawkesworth C. J. and Fowler M. (1991)Geochemistry and isotopic composition of gabbros from layer3 of the Indian Ocean crust, hole 735B. Proc. Ocean Drill.
Program Sci. Results 118, 127–143.Knauth L. P. and Lowe D. R. (1978) Oxygen isotope geochemistry
of cherts from the Onverwacht Group (3.4 billion years),Transvaal, South Africa, with implications for secular varia-tions in the isotopic composition of cherts. Earth Planet. Sci.
Lett. 41, 209–222.Knauth L. P. and Lowe D. R. (2003) High Archean climatic
temperature inferred from oxygen isotope geochemistry ofcherts in the 3.5 Ga Swaziland Supergroup, South Africa. Bull.Geol. Soc. Am. 115, 566–580.
Korenaga J., Planavsky N. J. and Evans D. A. D. (2017) Globalwater cycle and the coevolution of the Earth’s interior andsurface environment. Philos. Trans. R. Soc. A: Math. Eng. Sci.
375, 20150393.Kulikov V. S., Bychkova Y. V., Kulikova V. V., Kostitsyn Y. A.,
Pokrovsky O. S. and Vasilev M. V. (2008) The Ruiga intrusion:a typical example of a shallow-facies Paleoproterozoic peri-dotite-gabbro-komatiite-basaltic association of the VetrenyBelt, Southeastern Fennoscandia. Petrology 16, 531–551.
Kulikov V. S., Bychkova Y. V., Kulikova V. and Ernst R.(2010) The Vetreny Poyas (Windy Belt) subprovince ofsoutheastern Fennoscandia: an essential component of theca. 2.5-2.4 Ga Sumian large igneous provinces. Precambr.
Res. 183, 589–601.Kurokawa H., Foriel J., Laneuville M., Houser C. and Usui T.
(2018) Subduction and atmospheric escape of Earth’s seawaterconstrained by hydrogen isotopes. Earth Planet. Sci. Lett..
Kyser T. K. and Kerrich R. (1991) Retrograde exchange ofhydrogen isotopes between hydrous minerals and water at lowtemperatures. Geochem. Soc. Spec. Publ. 3, 409–422.
Laverne C., Vanko D. A., Tartarotti P. and Alt J. C. (1995)Chemistry and geothermometry of secondary minerals from thedeep sheeted dike complex, Hole 504B. Proc. Ocean Drill.
Program Sci. Results 137/140, 167–189.Leake B., Woolley A., Arps C. E. S., Birch W. D., Gilbert M. G.,
Grice J. D. and Hawthorne F. C., et al. (1997) Nomenclature ofamphiboles: report of the subcommittee on amphiboles of theinternational mineralogical association commission on newminerals and mineral names. Can. Mineral. 82, 1019–1037.
Lecuyer C., Gillet P. and Robert F. (1998) The hydrogen isotopecomposition of seawater and the global water cycle. Chem.
Geol. 145, 249–261.Lecuyer C., Gruau G., Fruh-Green G. L. and Picard C. (1996)
Hydrogen isotope composition of Early Proterozoic seawater.Geology 24, 291–294.
Luz B. and Barkan E. (2010) Variations of 17O/16O and 18O/16O inmeteoric waters. Geochim. Cosmochim. Acta 74, 6276–6286.

208 D.O. Zakharov, I.N. Bindeman /Geochimica et Cosmochimica Acta 248 (2019) 185–209
Lyons T. W., Reinhard C. T. and Planavsky N. J. (2014) The riseof oxygen in Earth’s early ocean and atmosphere. Nature 506,307–315.
Marin-Carbonne J., Chaussidon M. and Robert F. (2012)Micrometer-scale chemical and isotopic criteria (O and Si) onthe origin and history of Precambrian cherts: implications forpaleo-temperature reconstructions. Geochim. Cosmochim. Acta
92, 129–147.Martin E., Bindeman I., Balan E., Palandri J., Seligman A. and
Villemant B. (2017) Hydrogen isotope determination by TC/EAtechnique in application to volcanic glass as a window intosecondary hydration. J. Volcanol. Geoth. Res. 348, 49–61.
Matsuhisa Y., Goldsmith J. R. and Clayton R. N. (1978)Mechanisms of hydrothermal crystallization of quartz at 250�C and 15 kbar. Geochim. Cosmochim. Acta 42, 173–182.
Matthews A. (1994) Oxygen isotope geothermometers for meta-morphic rocks. J. Metamorph. Geol. 12, 211–219.
Matthews A., Goldsmith J. R. and Clayton R. N. (1983) Oxygenisotope fractionations involving pyroxenes: the calibration ofmineral-pair geothermometers. Geochim. Cosmochim. Acta 47,631–644.
Melezhik V. A., Prave A. R., Fallick A. E., Hanski E. J., LeplandA., Kump L. R. and Strauss H. (2013) Reading the archive ofearth’s oxygenation: Volume 3: Global Events and theFennoscandian Arctic Russia – Drilling Early Earth Project.Front Earth Sci. 8.
Mezhelovskaya S. V., Korsakov A. K., Mezhelovskii A. D. andBibikova E. V. (2016) Age range of formation of sedimentaryvolcanogenic complex of the Vetreny belt (the southeast of thebaltic shield). Stratigr. Geol. Correl. 24, 105–117.
Miller M. F. (2002) Isotopic fractionation and the quantification ofD17O anomalies in the oxygen three-isotope system: anappraisal and geochemical significance. Geochim. Cosmochim.
Acta 66, 1881–1889.Muehlenbachs K. (1998) The oxygen isotopic composition of the
oceans, sediments and the seafloor. Chem. Geol. 145, 263–273.Muehlenbachs K. and Clayton R. N. (1976) Oxygen isotope
composition of the oceanic crust and its bearing on seawater. J.Geophys. Res. 81, 4365.
Nehlig P. (1991) Salinity of oceanic hydrothermal fluids: a fluidinclusion study. Earth Planet. Sci. Lett. 102, 310–325.
Ojakangas R. W., Marmo J. S. and Heiskanen K. I. (2001) Basinevolution of the Paleoproterozoic Karelian Supergroup of theFennoscandian (Baltic) shield. Sed. Geol. 141–142, 255–285.
Pack A. and Herwartz D. (2014) The triple oxygen isotopecomposition of the Earth mantle and understanding D17Ovariations in terrestrial rocks and minerals. Earth Planet. Sci.
Lett. 390, 138–145.Pack A., Tanaka R., Hering M., Sengupta S., Peters S. and
Nakamura E. (2016) The oxygen isotope composition of SanCarlos olivine on the VSMOW2-SLAP2 scale. Rapid Commun.
Mass Spectrom. 30, 1495–1504.Perry, Jr, E. C. (1967) The oxygen isotope chemistry of ancient
cherts. Earth Planet. Sci. Lett. 3, 62–66.Pope E. C., Bird D. K. and Rosing M. T. (2012) Isotope
composition and volume of Earth’s early oceans. Proc. Natl.
Acad. Sci. 109, 4371–4376.Pope E. C., Bird D. K. and Arnorsson S. (2014) Stable isotopes of
hydrothermal minerals as tracers for geothermal fluids inIceland. Geothermics 49, 99–110.
Prokoph A., Shields G. A. and Veizer J. (2008) Compilation andtime-series analysis of a marine carbonate d18O, d13C, 87Sr/86Srand d34S database through Earth history. Earth-Sci. Rev. 87,113–133.
Puchtel I. S., Hofmann A. W., Mezger K., Shchipansky A. A.,Kulikov V. S. and Kulikova V. V. (1996) Petrology of a 2.41 Ga
remarkably fresh komatiitic basalt lava lake in Lion Hills,central Vetreny Belt, Baltic Shield. Contrib. Mineral. Petrol.
124, 273–290.Puchtel I. S., Haase K. M., Hofmann A. W., Chauvel C., Kulikov
V. S., Garbe-Schonberg C. D. and Nemchin A. A. (1997)Petrology and geochemistry of crustally contaminated komati-itic basalts from the Vetreny Belt, southeastern Baltic Shield:evidence for an early Proterozoic mantle plume beneath riftedArchean continental lithosphere. Geochim. Cosmochim. Acta
61, 1205–1222.Puchtel I. S., Touboul M., Blichert-Toft J., Walker R. J., Brandon
A. D., Nicklas R. W., Kulikov V. S. and Samsonov A. V.(2016) Lithophile and siderophile element systematics ofEarth’s mantle at the Archean–Proterozoic boundary: evidencefrom 2.4 Ga komatiites. Geochim. Cosmochim. Acta 180, 227–255.
Robert F. and Chaussidon M. (2006) A palaeotemperature curvefor the Precambrian oceans based on silicon isotopes in cherts.Nature 443, 969–972.
Salminen J., Halls H. C., Mertanen S., Pesonen L. J., Vuollo J. andSoderlund U. (2014) Paleomagnetic and geochronologicalstudies on Paleoproterozoic diabase dykes of Karelia, EastFinland-Key for testing the Superia supercraton. Precambr.
Res. 244, 87–99.Schiffman P. and Smith B. M. (1988) Petrology and oxygen isotope
geochemistry of a fossil seawater hydrothermal system withinthe Solea Graben, Northern Troodos Ophiolite, Cyprus. J.
Geophys. Res. 93, 4612–4624.Schrag D. P., Hampt G. and Murray D. W. (1996) Pore fluid
constraints on the temperature and oxygen isotopic composi-tion of the glacial ocean. Science 272, 1930–1932.
Seal R. R. (2006) Sulfur isotope geochemistry of sulfide minerals.Rev. Mineral. Geochem. 61, 633–677.
Sengupta S. and Pack A. (2018) Triple oxygen isotope massbalance for the Earth’s oceans with application to Archeancherts. Chem. Geol. 495, 18–26.
Shackleton N. J. and Kennett J. P. (1975) Paleotemperaturehistory of the cenozoic and the initiation of Antarcticglaciation: oxygen and carbon isotope analyses in DSDPSites 277, 279 and 281. In Initial Reports of the Deep Sea
Drilling Project, p. 29.Shanks W. C. (2001) Stable isotopes in seafloor hydrothermal
systems. Rev. Mineral. Geochem. 43, 469–526.Sharkov E. V., Trubkin N. V., Krassivskaya I. S., Bogatikov O. A.,
Mokhov A. V., Chistyakov A. V. and Evseeva K. A. (2004)Structural and compositional characteristics of the oldestvolcanic glass in the early paleoproterozoic boninite-like lavasof Southern Karelia. Petrology 12, 264–280.
Sharp Z. D. and Kirschner D. L. (1994) Quartz-calcite oxygenisotope thermometry: a calibration based on natural isotopicvariations. Geochim. Cosmochim. Acta 58, 4491–4501.
Sharp Z. D., Gibbons J. A., Maltsev O., Atudorei V., Pack A.,Sengupta S., Shock E. L. and Knauth L. P. (2016) A calibrationof the triple oxygen isotope fractionation in the SiO2-H2Osystem and applications to natural samples. Geochim. Cos-
mochim. Acta 186, 105–119. https://doi.org/10.1016/j.gca.2016.04.047.
Shields G. and Veizer J. (2002) The Precambrian marine carbonateisotope database: version 1.1. Geochem. Geophys. Geosyst. 3, 1–12.
Shmulovich K. I., Landwehr D., Simon K. and Heinrich W. (1999)Stable isotope fractionation between liquid and vapour inwater–salt systems up to 600 �C. Chem. Geol. 157, 343–354.
Stakes D. S. and O’Neil J. R. (1982) Mineralogy and stable isotopegeochemistry of hydrothermally altered oceanic rocks. EarthPlanet. Sci. Lett. 57, 285–304.

D.O. Zakharov, I.N. Bindeman /Geochimica et Cosmochimica Acta 248 (2019) 185–209 209
Strand K. O. and Laajoki K. (1993) Palaeoproterozoic glaciomar-ine sedimentation in an extensional tectonic setting: theHonkala Formation, Finland. Precambr. Res. 64, 253–271.
Taylor H. P. (1977) Water/rock interactions and the origin of H2Oin granitic batholiths: Thirtieth William Smith lecture. J. Geol.Soc. 133, 509–558.
Taylor S. R. and McLennan S. M. (1985) The Continental Crust:
Its Evolution and Composition. Blackwell, Oxford.Turchyn A. V., Alt J. C., Brown S. T., DePaolo D. J., Coggon R.
M., Chi G., Bedard J. H. and Skulski T. (2013) Reconstructingthe oxygen isotope composition of late Cambrian and Creta-ceous hydrothermal vent fluid. Geochim. Cosmochim. Acta 123,440–458.
Vanko D. A., Laverne C., Tartarotti P. and Alt J. C. (1996)Chemistry and origin of secondary minerals from the deepsheeted dikes cored during Leg 148 (Hole 504B). Proc. Ocean
Drill. Program Sci. Results 148, 71–86.Veizer J., Ala D., Azmy K., Bruckschen P., Buhl D., Bruhn F.,
Carden G. a. F., Diener A., Ebneth S., Godderis Y., Jasper T.,Korte C., Pawellek F., Podlaha O. G. and Strauss H. (1999)87Sr/86Sr, d13C and d18O evolution of Phanerozoic seawater.Chem. Geol. 161, 59–88.
Veizer J. and Prokoph A. (2015) Temperatures and oxygen isotopiccomposition of Phanerozoic oceans. Earth-Sci. Rev. 146, 92–104.
Wallmann K. (2001) The geological water cycle and the evolutionof marine d18O values. Geochim. Cosmochim. Acta 65, 2469–2485.
Wallmann K. (2004) Impact of atmospheric CO2 and galacticcosmic radiation on Phanerozoic climate change and the marined18O record. Geochem. Geophys. Geosyst. 5.
Wark D. A. and Watson E. B. (2006) TitaniQ: a titanium-in-quartzgeothermometer. Contrib. Miner. Petrol. 152(6), 743–754.
Wenner D. B. and Taylor H. P. (1974) D/H and O18/O16 studies ofserpentinization of ultramaflc rocks. Geochim. Cosmochim. Acta
38, 1255–1286.Wostbrock J. A. G., Sharp Z. D., Sanchez-Yanez C., Reich M.,
van den Heuvel D. B. and Benning L. G. (2018) Calibration andapplication of silica-water triple oxygen isotope thermometry togeothermal systems in Iceland and Chile. Geochim. Cosmochim.
Acta 234, 84–97. https://doi.org/10.1016/j.gca.2018.05.007.Zahnle K. J., Catling D. C. and Claire M. W. (2013) The rise of
oxygen and the hydrogen hourglass. Chem. Geol. 362, 26–34.Zakharov D. O., Bindeman I. N., Slabunov A. I., Ovtcharova M.,
Coble M. A., Serebryakov N. S. and Schaltegger U. (2017)Dating the Paleoproterozoic snowball Earth glaciations usingcontemporaneous subglacial hydrothermal systems. Geology 45,5–8.
Zheng Y. F. (1993) Calculation of oxygen isotope fractionation inhydroxyl-bearing silicates. Earth Planet. Sci. Lett. 120, 247–263.
Associate editor: Marc Norman