Embed Size (px)
Citation preview
Tribal Tobacco Use Project Survey Report 2013
Findings from
Minnesota American Indian Communities
2
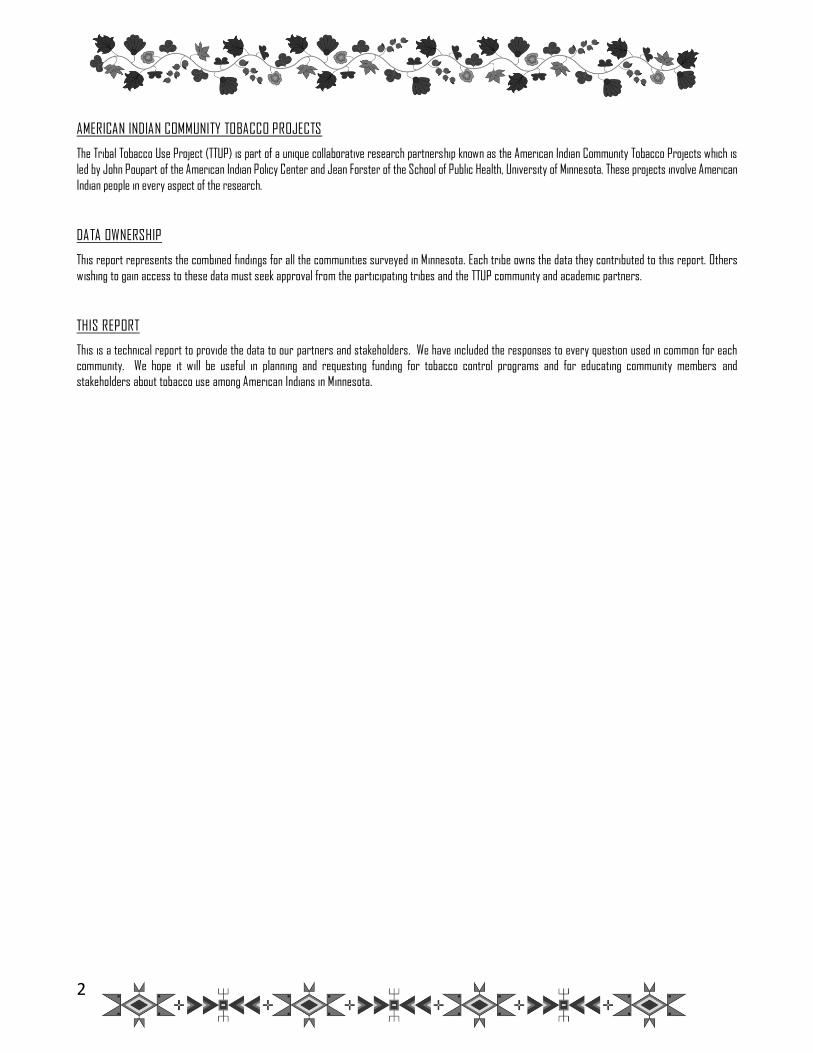
AMERICAN INDIAN COMMUNITY TOBACCO PROJECTS
The Tribal Tobacco Use Project (TTUP) is part of a unique collaborative research partnership known as the American Indian Community Tobacco Projects which is
led by John Poupart of the American Indian Policy Center and Jean Forster of the School of Public Health, University of Minnesota. These projects involve American
Indian people in every aspect of the research.
DATA OWNERSHIP
This report represents the combined findings for all the communities surveyed in Minnesota. Each tribe owns the data they contributed to this report. Others
wishing to gain access to these data must seek approval from the participating tribes and the TTUP community and academic partners.
THIS REPORT
This is a technical report to provide the data to our partners and stakeholders. We have included the responses to every question used in common for each
community. We hope it will be useful in planning and requesting funding for tobacco control programs and for educating community members and
stakeholders about tobacco use among American Indians in Minnesota.
3
TTUP PARTNERSHIP
American Indian Community Oversight Group
John Poupart, MPA, Anishinaabe, Co-Principal Investigator, American Indian Policy Center
Kris Rhodes, MPH, Anishinaabe, American Indian Cancer Foundation
Melanie Peterson-Hickey, PhD, Anishinaabe, Consultant, American Indian Policy Center
Nate Sandman, BAS, Anishinaabe, Fond du Lac Reservation Human Services Division
Joy Dorscher, MD, Anishinaabe, University of Minnesota Duluth Medical School Favian Kennedy, MSW, Health Education Assistance Council
Lead authors
Jean Forster, PhD, MPH, Co-Principal Investigator, University of Minnesota Lisa Skjefte, BA, Anishinaabe, Community Program Specialist, University of Minnesota
Funding support provided by: ClearWay MinnesotaSM (Grant RC-2012-0012)
Project Officer: Joanne D’Silva, MPH
Data management and analysis support provided by:
Tsz Chun “Kelvin” Choi, PhD, University of Minnesota
Darin Erickson, PhD, University of Minnesota
Pamela Jo Johnson, PhD, Medica Research Institute Rose Hilk, MS, University of Minnesota
The information in this report is copyrighted.If you would like to reproduce any of the information in this report, please use the following citation:
American Indian Community Tobacco Projects, Tribal Tobacco Use Project Survey, Findings from Minnesota American Indian Communities, 2013.
For additional copies of this report or more information about the American Indian Community Tobacco Projects: www.sph.umn.edu/epi/aictp
American Indian Community Tobacco Projects
Division of Epidemiology & Community Health
School of Public Health, University of Minnesota
1300 S. 2nd Street, #300 Minneapolis, MN 55454
(612) 624-1818
4
TABLE OF CONTENTS
Key Findings ............................................................................................................................................................................................................................................ 5
Forward……………………………………………………………………………………………………………………………………………………………………………………………………………………………….………………7
Background ............................................................................................................................................................................................................................................ 8
Overview ................................................................................................................................................................................................................................................ 10
Methods ................................................................................................................................................................................................................................................. 10
Results
Part I: Participant Demographics ........................................................................................................................................................................................................ 12
Part II: Patterns of Tobacco Use and Cessation
A. Ceremonial or Sacred Tobacco Use Patterns ...................................................................................................................................................... 15
B. Cigarette Smoking Patterns ................................................................................................................................................................................... 16
C. Other Commercial Tobacco Use ............................................................................................................................................................................ 18
D. Quitting Smoking ..................................................................................................................................................................................................... 19
Part III: Secondhand Smoke Exposure and Attitudes
A. Secondhand Smoke Exposure ............................................................................................................................................................................... 23
B. Attitudes about Secondhand Smoke Policies ....................................................................................................................................................... 25
Part IV: Factors Related to Tobacco Use
A. Social Influences .................................................................................................................................................................................................... 27
B. Risk Perceptions .................................................................................................................................................................................................... 28
C. Health, Physical Activity & Diet ............................................................................................................................................................................. 30
D. Healthcare ............................................................................................................................................................................................................... 31
References ........................................................................................................................................................................................................................................... 33
5
KEY FINDINGS
TRIBAL TOBACCO USE PROJECT SURVEY
MINNESOTA NATIVE COMMUNITIES
Methods
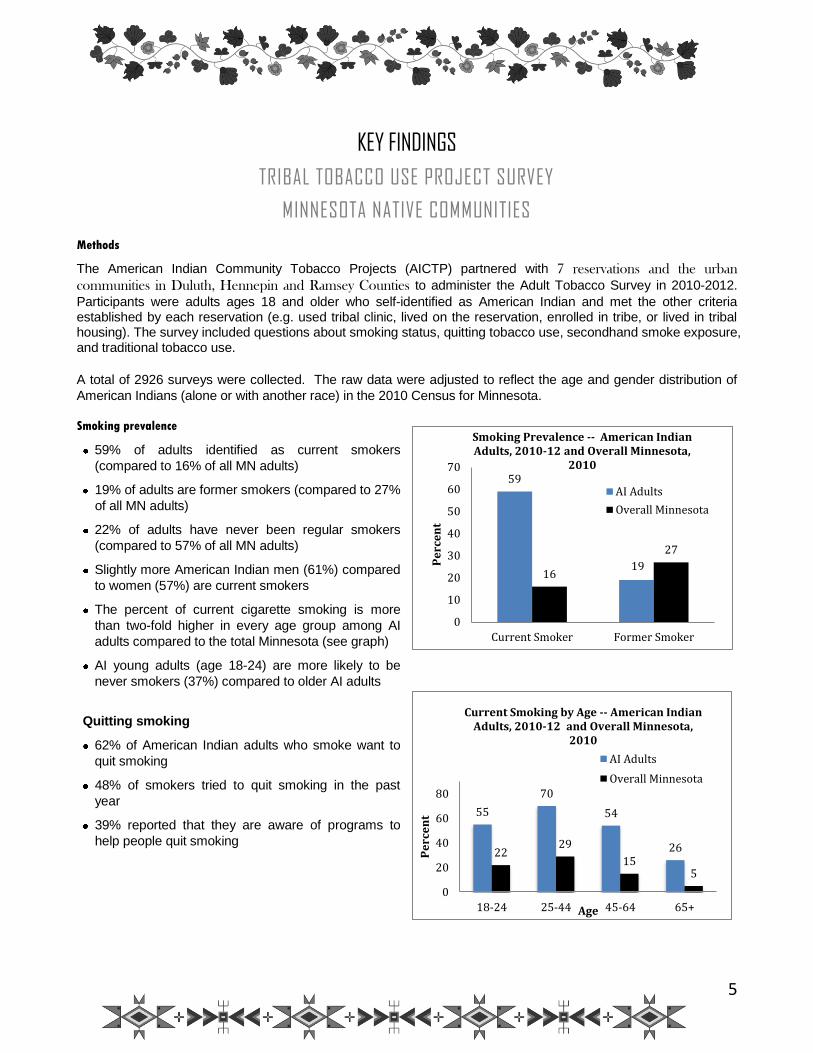
The American Indian Community Tobacco Projects (AICTP) partnered with 7 reservations and the urban
communities in Duluth, Hennepin and Ramsey Counties to administer the Adult Tobacco Survey in 2010-2012.
Participants were adults ages 18 and older who self-identified as American Indian and met the other criteria established by each reservation (e.g. used tribal clinic, lived on the reservation, enrolled in tribe, or lived in tribal housing). The survey included questions about smoking status, quitting tobacco use, secondhand smoke exposure, and traditional tobacco use.
A total of 2926 surveys were collected. The raw data were adjusted to reflect the age and gender distribution of
American Indians (alone or with another race) in the 2010 Census for Minnesota.
Smoking prevalence
59% of adults identified as current smokers
(compared to 16% of all MN adults)
19% of adults are former smokers (compared to 27%
of all MN adults)
22% of adults have never been regular smokers
(compared to 57% of all MN adults)
Slightly more American Indian men (61%) compared
to women (57%) are current smokers
The percent of current cigarette smoking is more
than two-fold higher in every age group among AI
adults compared to the total Minnesota (see graph)
AI young adults (age 18-24) are more likely to be
never smokers (37%) compared to older AI adults
Quitting smoking
62% of American Indian adults who smoke want to
quit smoking
48% of smokers tried to quit smoking in the past
year
39% reported that they are aware of programs to
help people quit smoking
59
19 16
27
0
10
20
30
40
50
60
70
Current Smoker Former Smoker
Pe
rce
nt
Smoking Prevalence -- American Indian Adults, 2010-12 and Overall Minnesota,
2010
AI Adults
Overall Minnesota
55
70
54
26 22 29
15 5
0
20
40
60
80
18-24 25-44 45-64 65+
Pe
rce
nt
Age
Current Smoking by Age -- American Indian Adults, 2010-12 and Overall Minnesota,
2010
AI Adults
Overall Minnesota
6
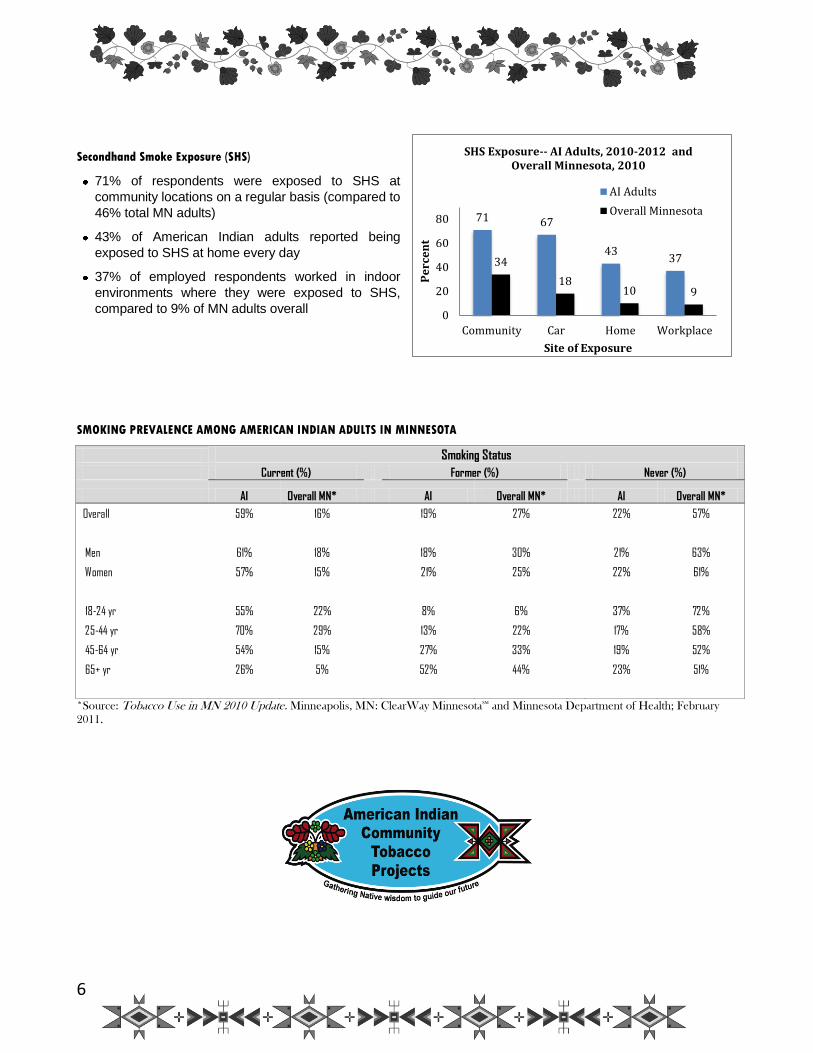
Secondhand Smoke Exposure (SHS)
71% of respondents were exposed to SHS at
community locations on a regular basis (compared to
46% total MN adults)
43% of American Indian adults reported being
exposed to SHS at home every day
37% of employed respondents worked in indoor
environments where they were exposed to SHS,
compared to 9% of MN adults overall
SMOKING PREVALENCE AMONG AMERICAN INDIAN ADULTS IN MINNESOTA
Smoking Status
Current (%) Former (%) Never (%)
AI Overall MN* AI Overall MN* AI Overall MN*
Overall 59% 16% 19% 27% 22% 57%
Men 61% 18% 18% 30% 21% 63%
Women 57% 15% 21% 25% 22% 61%
18-24 yr 55% 22% 8% 6% 37% 72%
25-44 yr 70% 29% 13% 22% 17% 58%
45-64 yr 54% 15% 27% 33% 19% 52%
65+ yr 26% 5% 52% 44% 23% 51%
*Source: Tobacco Use in MN 2010 Update. Minneapolis, MN: ClearWay MinnesotaSM
and Minnesota Department of Health; February
2011.
71 67
43 37 34
18 10 9
0
20
40
60
80
Community Car Home Workplace
Pe
rce
nt
Site of Exposure
SHS Exposure-- AI Adults, 2010-2012 and Overall Minnesota, 2010
AI Adults
Overall Minnesota
7
FORWARD
The American Indian Community Tobacco Projects
made a commitment that American Indian
reservations and urban American Indian
communities would own the products of the Tribal
Tobacco Use Prevalence (TTUP) project survey. The
partnership that hosted the study, the American
Indian Policy Center and the University of Minnesota,
took great care and made assurances in every step
of the process that the integrity of this promise was
maintained. Past research findings involving
American Indian communities were seldom returned
to the people for their use.
When returning the data from this survey to the
Indian communities it is hoped that this action will
serve a useful purpose. It can show the harmful
effects of tobacco abuse and a correlation to the
poor health indicators of the Indian communities.
Further, it may be useful in helping to create effective
social programming involving American Indians.
The findings of the TTUP study indicate that
American Indians are users of tobacco many times
higher than that of the Minnesota’s general
population. To some this may be surprising. The
findings may be significantly important to leaders of
American Indian communities because health related
issues are associated with use of tobacco. One
interesting feature regarding the high rates of
tobacco is that American Indians hold traditional
native tobacco in high esteem; using it in prayers to
the creator and for a variety of ceremonial purposes
specific to their culture.
A retreat to the positive reinforcement found within
Indian cultural values may lead to recovery over the
burdening societal challenges facing American
Indians. The data and information contained in the
TTUP findings can help with this. Prime targets are the poor health indicators among American Indians. But it goes further than that. No matter how mainstream social research, public policy, and program design are meant to improve conditions for American Indians, they likely will remain unworkable unless the fundamental schism between the linear worldview of Western European thought and that of the holistic, cyclical worldview of American Indians is addressed. The sooner we can find resonance between these worldviews, the sooner we may overcome well-intended methods of social institutions that have produced failed policies. Vine Deloria, Jr, a noted legal scholar and author of numerous publications spanning 40 years, said:
“It is impossible to understand American Indians in
their contemporary setting without first gaining some
knowledge of their history as it has been formed and
shaped by the Indian experience with Western
civilization. Many of the customs and traditions of
the past persist in the minds and lives of Indians
today and have been jealously preserved over the
several centuries of contact with non-Indians as the
last remaining values that distinguish Indians from
people around them.” 1
What this means is that American Indians, with new
data, may begin to create responses to social
challenges using the strengths found in the culture of
the people.
- John Poupart
American Indian Policy Center
8
BACKGROUND
The American Indian Community Tobacco Projects
acknowledges the traditional and sacred role of tobacco
for American Indians. American Indian traditions tell us
to honor the Creator with the spiritual use of tobacco.
Some use kinnickinnick (red willow bark with other plants
and bark), or Indian tobacco grown for this purpose.
Others use commercial tobacco purchased from a store
(e.g. pipe tobacco or cigarettes). The word used for
tobacco in the Ojibwe language is asema, in the
Dakota/Lakota language the word is can-sa-sa, and in Ho-
Chunk the word is da-nee. Traditional tobacco is
sometimes smoked in a pipe, burned in a dish or shell for
smudging, put on the ground or buried, or wrapped in
cloth and tied to a tree. Tobacco is used in these ways
during daily prayer, when harvesting food and medicine,
during storms or to give honor to a namesake, clan or
sacred animal. Tobacco also is offered to others as a sign
of respect when asking them to share knowledge or a
prayer, for healing, or during ceremony. We believe these
traditions will help future generations to honor tobacco
and resist tobacco misuse.
Tobacco misuse (also called commercial tobacco use) is
the recreational or addictive use of tobacco (cigarettes,
chewing tobacco, cigars, pipes, snuff). Data from national
samples show American Indian people smoke more than
other populations in the United States and, as a result,
suffer disproportionately from tobacco-related illness and
death. Available data are inadequate to fully understand
and solve these issues in American Indian communities.
This project provides the first ever reliable, statewide
estimate of American Indian adult tobacco prevalence.
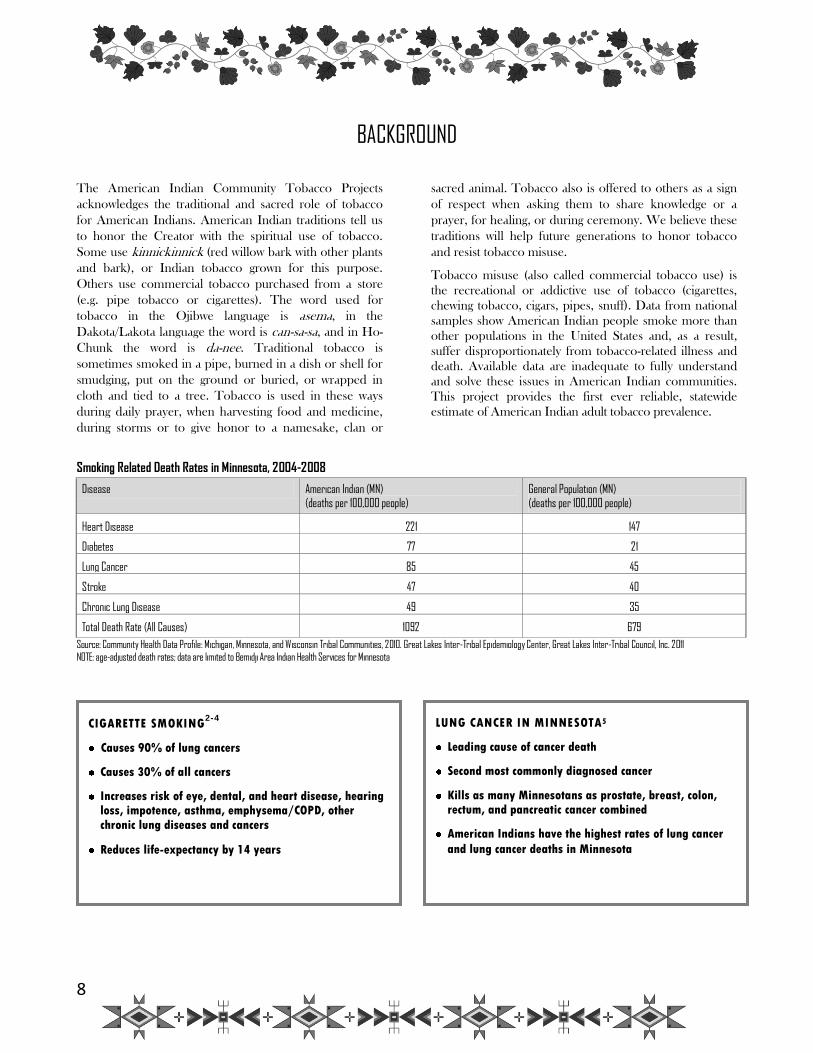
Smoking Related Death Rates in Minnesota, 2004-2008
Disease American Indian (MN) (deaths per 100,000 people)
General Population (MN) (deaths per 100,000 people)
Heart Disease 221 147
Diabetes 77 21
Lung Cancer 85 45
Stroke 47 40
Chronic Lung Disease 49 35
Total Death Rate (All Causes) 1092 679
Source: Community Health Data Profile: Michigan, Minnesota, and Wisconsin Tribal Communities, 2010. Great Lakes Inter-Tribal Epidemiology Center, Great Lakes Inter-Tribal Council, Inc. 2011 NOTE: age-adjusted death rates; data are limited to Bemidji Area Indian Health Services for Minnesota
CIGARETTE SMOKING2-4
Causes 90% of lung cancers
Causes 30% of all cancers
Increases risk of eye, dental, and heart disease, hearing loss, impotence, asthma, emphysema/COPD, other
chronic lung diseases and cancers
Reduces life-expectancy by 14 years
LUNG CANCER IN MINNESOTA5
Leading cause of cancer death
Second most commonly diagnosed cancer
Kills as many Minnesotans as prostate, breast, colon, rectum, and pancreatic cancer combined
American Indians have the highest rates of lung cancer
and lung cancer deaths in Minnesota
9
Approximately 8.6 million people in the United States
suffer from tobacco-related illness including respiratory
and cardiovascular diseases. Another 443,000 people die
prematurely each year from cigarette smoking and
exposure to secondhand smoke.2,3
In Minnesota, age-
adjusted morbidity and mortality from heart disease and
lung cancer are approximately two to three times higher
among American Indians than non-Indians, which may be
explained by higher cigarette smoking.
Several studies show American Indians have higher rates of
commercial tobacco use than any other U.S. racial/ethnic
group, and rates are greatest in Northern Plains and Great
Lakes states, including Minnesota.6-19
Self-reported past 30-
day cigarette use among American Indians ranges from 36-
62% in the published literature compared to an overall US
estimate of 20.6% and Minnesota estimate of 16% for all
racial/ethnic groups.20
However, the majority of these
studies derive their estimates from national telephone
surveys which likely suffer many limitations including
sampling and coverage bias, necessitating improved data
collection.
Secondhand smoke (SHS) is also known as environmental
tobacco smoke. SHS is a complex mixture of gases and
particles from the smoke of a burning cigarette, cigar or
pipe tip (side stream smoke) and also includes exhaled
smoke (mainstream smoke). Over 7,000 chemicals are
found in secondhand smoke, more than 70 of which are
known carcinogens such as arsenic and benzene. Recent
studies indicate secondhand smoke is responsible for 3,000
lung cancer and 62,000 heart disease deaths per year
among non-smokers in the United States.21
Exposure to tobacco smoke – even occasional smoking or
secondhand smoke – causes immediate damage to the body
that can lead to serious illness or death. The 2010 Surgeon
General’s report, How Tobacco Smoke Causes Disease:
The Biology and Behavioral Basis for Smoking-Attributable
Disease, finds that cellular damage and tissue inflammation
from tobacco smoke are immediate, and repeated exposure
weakens the body’s ability to heal the damage. “The
chemicals in tobacco smoke reach your lungs quickly every
time you inhale causing damage immediately,” the Surgeon
General said at the release of the report. “Inhaling even the
smallest amount of tobacco smoke can also damage your
DNA, which can lead to cancer.”22
RESOURCES FOR ADDITIONAL INFORMATION ON COMMERCIAL
TOBACCO USE
American Indian Community Tobacco Projects
call 612-624-1818 or visit http://www.sph.umn.edu/epi/aictp/
ClearWay MinnesotaSM
visit www.clearwaymn.org
National Native Commercial Tobacco Abuse Prevention
Network visit www.KeepItSacred.org
QUITPLAN® call 1-888-354-plan or visit www.quitplan.com
U.S. Centers for Disease Control call 1-800-CDC-INFO or visit
www.cdc.gov/tobacco/index.htm
Tobacco Use in Minnesota: 2010 Update. Minneapolis, MN:
ClearWay MinnesotaSM and Minnesota Department of Health;
February 2011
www.health.state.mn.us/divs/chs/tobacco/mats2010finalfeport.pdf
SECONDHAND SMOKE (SHS) IN THE UNITED STATES2,3
Commercial tobacco smoke contains over 7,000 chemicals, including 70+ cancer-causing
toxins.
SHS causes over 3,000 lung cancer deaths in non-smokers per year.
SHS causes 46,000 heart disease deaths in non-smokers per year.
Between 150,000 and 300,000 children (under 18 months) who are exposed to SHS have lower
respiratory tract infections.
10
OVERVIEW OF THE TRIBAL TOBACCO USE PROJECT (TTUP) The Tribal Tobacco Use Project (TTUP) seeks to fill data
gaps by engaging tribes and American Indian communities
in the surveillance and monitoring of attitudes, behaviors,
and beliefs related to tobacco use among American Indians
in Minnesota. This information will help inform the
development of tobacco prevention and control programs
and policies. The information will also substantiate the need
for continued access to tobacco control resources and
measure rates of commercial tobacco use versus use
according to tribal traditions.
This project is made possible through a unique collaborative
partnership between the American Indian Community
Tobacco Projects (AICTP), the American Indian Policy
Center (AIPC), and an oversight group comprised of
members of the American Indian community across the
state. TTUP is funded by ClearWay MinnesotaSM
, an
independent, non-profit organization dedicated to improving
the health of all Minnesotans by reducing tobacco use and
exposure to secondhand smoke through research, action,
and collaboration.
All project activities emphasize community-based
participatory research (CBPR) and reality-based research
(RBR) principles for working with American Indian
communities. CBPR acknowledges the different ways of
knowing, giving equal weight to scientific expressions of
knowledge and traditional or cultural expressions of
knowledge.23-24
RBR involves American Indian people in
every aspect of research including identification of key topics
or issues; defining terms, strategies, outcomes, and goals;
designing data collection instruments; analyzing data and
other information; developing strategies and activities for
returning the information to the community; and evaluating
the outcome of those activities.25-26
This report is a result of
such community-driven efforts to collect and disseminate
robust tobacco use-related data in a culturally meaningful
way.
METHODS
The results presented here represent the data from 7 reservations, Duluth, Hennepin County and Ramsey County. Four remaining tribes decided not
to participate for various reasons. The areas in the
survey include approximately 56% of the 101,900
American Indians (alone or in combination with
another race reported by the 2010 U.S. Census as
living in Minnesota.
Reservation Sample
The survey protocol for each tribe was tailored to the
needs and context of each community. On each
reservation tribal council approval was obtained for
participation in the survey. Tribes were asked to
designate a list that would result in the most
meaningful and useful data. Three tribes used the list
of users of the tribal clinics on the reservations from
the past three years, further limited by county to
include those who lived on or close to the reservation.
Tribal officials authorized the Bemidji Area office of
the Indian Health Service to generate those lists.
Three tribes approved the use of tribal enrollment lists,
limited by residence on the reservation. On one
reservation, those living in housing owned by the
tribal housing authority were invited to participate. In
each case a random sample or complete census of
American Indian adults from the list (depending upon
community size) was invited to participate in the
survey.
Individuals in each sample were sent an invitation
letter by the tribal clinic or tribe, followed by reminder
postcards, asking individuals to phone a tribal or clinic
location for an appointment. Individuals on the sample
lists were also called, visited at home, recruited by
flyer or intercepted at community events or locations.
Respondents were given a $20 gift card to a local
business for participating in the survey.
Response rates for the reservations and Duluth
varied from 22% to 87%. Reasons for the low
response rates vary by reservation, but included
difficulty scheduling interviewers, long distances
between communities on the reservations, short
survey implementation time (one month for one
reservation), level of involvement of tribal staff, and
difficulty finding listed participants because of their
mobility.
11
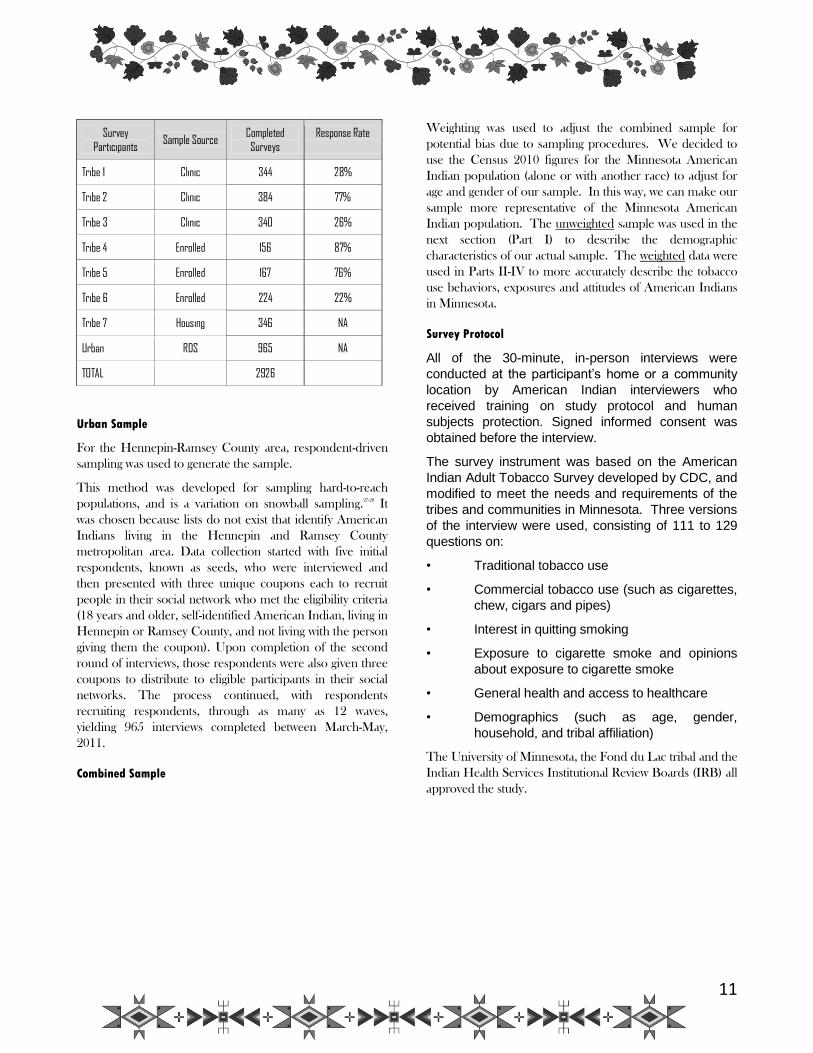
Survey Participants
Sample Source Completed Surveys
Response Rate
Tribe 1 Clinic 344 28%
Tribe 2 Clinic 384 77%
Tribe 3 Clinic 340 26%
Tribe 4 Enrolled 156 87%
Tribe 5 Enrolled 167 76%
Tribe 6 Enrolled 224 22%
Tribe 7 Housing 346 NA
Urban RDS 965 NA
TOTAL 2926
Urban Sample
For the Hennepin-Ramsey County area, respondent-driven
sampling was used to generate the sample.
This method was developed for sampling hard-to-reach
populations, and is a variation on snowball sampling.27-28
It
was chosen because lists do not exist that identify American
Indians living in the Hennepin and Ramsey County
metropolitan area. Data collection started with five initial
respondents, known as seeds, who were interviewed and
then presented with three unique coupons each to recruit
people in their social network who met the eligibility criteria
(18 years and older, self-identified American Indian, living in
Hennepin or Ramsey County, and not living with the person
giving them the coupon). Upon completion of the second
round of interviews, those respondents were also given three
coupons to distribute to eligible participants in their social
networks. The process continued, with respondents
recruiting respondents, through as many as 12 waves,
yielding 965 interviews completed between March-May,
2011.
Combined Sample
Weighting was used to adjust the combined sample for
potential bias due to sampling procedures. We decided to
use the Census 2010 figures for the Minnesota American
Indian population (alone or with another race) to adjust for
age and gender of our sample. In this way, we can make our
sample more representative of the Minnesota American
Indian population. The unweighted sample was used in the
next section (Part I) to describe the demographic
characteristics of our actual sample. The weighted data were
used in Parts II-IV to more accurately describe the tobacco
use behaviors, exposures and attitudes of American Indians
in Minnesota.
Survey Protocol
All of the 30-minute, in-person interviews were
conducted at the participant’s home or a community
location by American Indian interviewers who
received training on study protocol and human
subjects protection. Signed informed consent was
obtained before the interview.
The survey instrument was based on the American
Indian Adult Tobacco Survey developed by CDC, and
modified to meet the needs and requirements of the
tribes and communities in Minnesota. Three versions
of the interview were used, consisting of 111 to 129
questions on:
• Traditional tobacco use
• Commercial tobacco use (such as cigarettes,
chew, cigars and pipes)
• Interest in quitting smoking
• Exposure to cigarette smoke and opinions
about exposure to cigarette smoke
• General health and access to healthcare
• Demographics (such as age, gender,
household, and tribal affiliation)
The University of Minnesota, the Fond du Lac tribal and the
Indian Health Services Institutional Review Boards (IRB) all
approved the study.
12
RESULTS
PART I: PARTICIPANT DEMOGRAPHICS
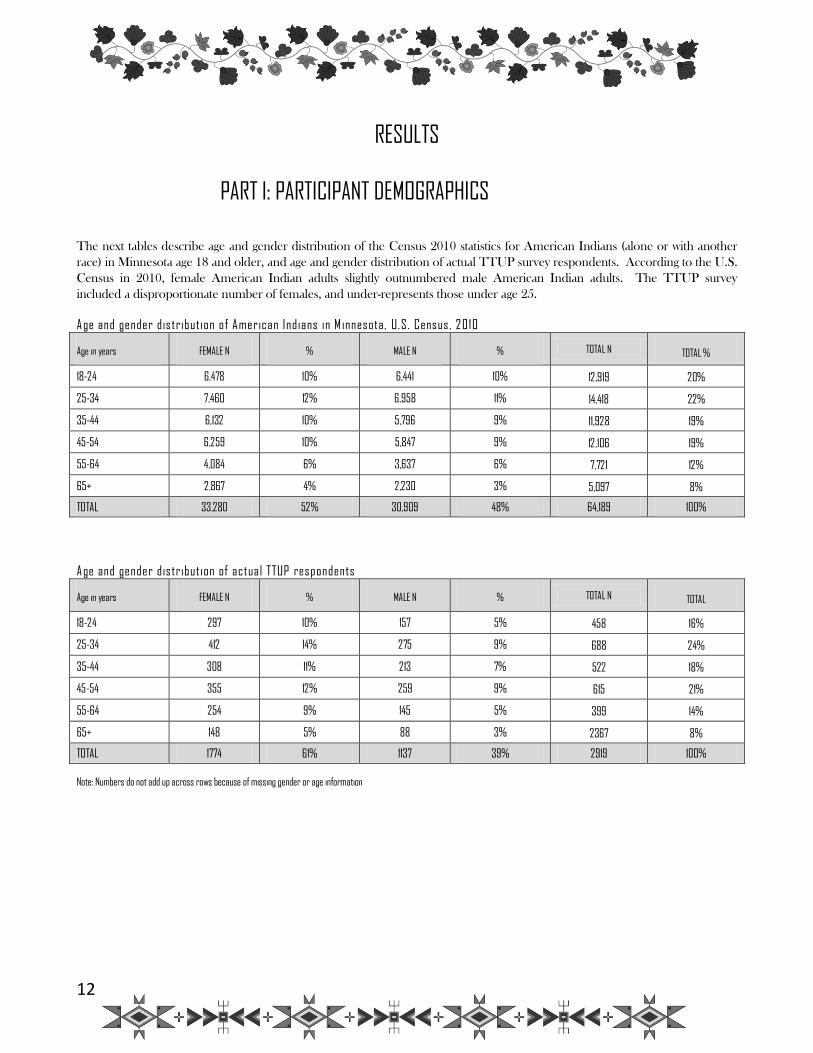
The next tables describe age and gender distribution of the Census 2010 statistics for American Indians (alone or with another
race) in Minnesota age 18 and older, and age and gender distribution of actual TTUP survey respondents. According to the U.S.
Census in 2010, female American Indian adults slightly outnumbered male American Indian adults. The TTUP survey
included a disproportionate number of females, and under-represents those under age 25.
Age and gender distribution of American Indians in M innesota, U.S. Census, 2010
Age in years FEMALE N % MALE N % TOTAL N TOTAL %
18-24 6,478 10% 6,441 10% 12,919 20%
25-34 7,460 12% 6,958 11% 14,418 22%
35-44 6,132 10% 5,796 9% 11,928 19%
45-54 6,259 10% 5,847 9% 12,106 19%
55-64 4,084 6% 3,637 6% 7,721 12%
65+ 2,867 4% 2,230 3% 5,097 8%
TOTAL 33,280 52% 30,909 48% 64,189 100%
Age and gender distribution of actual TTUP respondents
Age in years FEMALE N % MALE N % TOTAL N TOTAL
18-24 297 10% 157 5% 458 16%
25-34 412 14% 275 9% 688 24%
35-44 308 11% 213 7% 522 18%
45-54 355 12% 259 9% 615 21%
55-64 254 9% 145 5% 399 14%
65+ 148 5% 88 3% 2367 8%
TOTAL 1774 61% 1137 39% 2919 100%
Note: Numbers do not add up across rows because of missing gender or age information
13
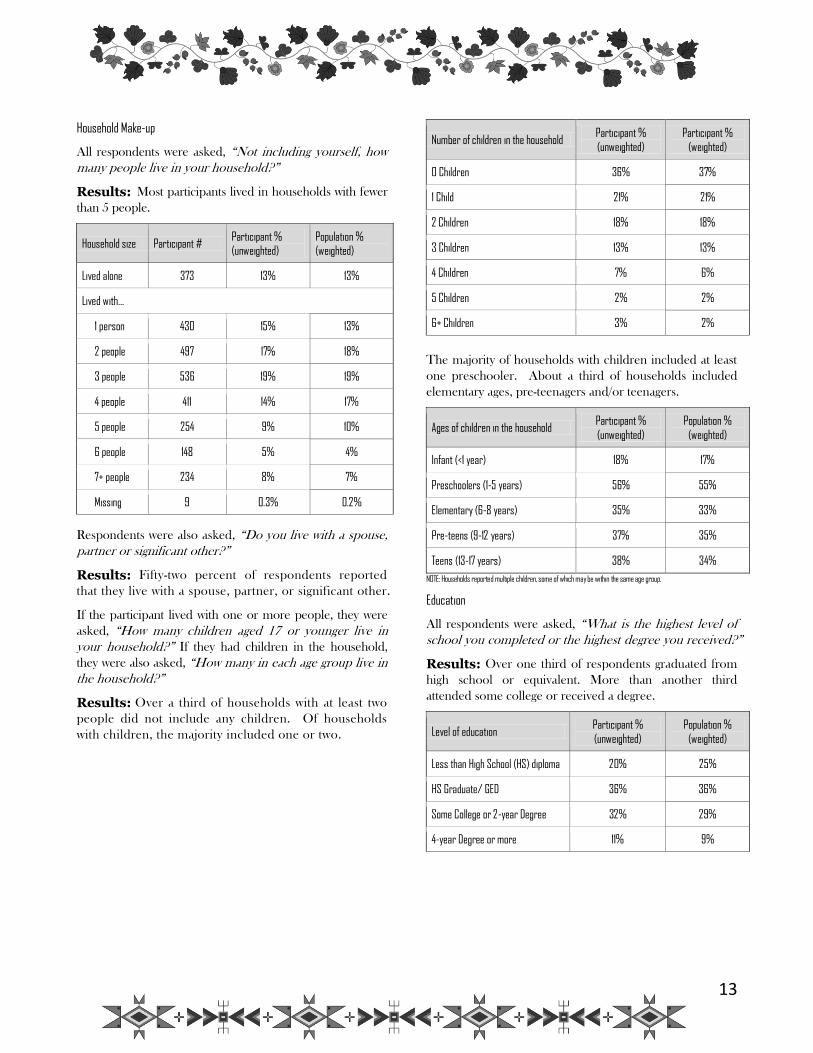
Household Make-up
All respondents were asked, “Not including yourself, how
many people live in your household?”
Results: Most participants lived in households with fewer
than 5 people.
Household size Participant # Participant % (unweighted)
Population % (weighted)
Lived alone 373 13% 13%
Lived with…
1 person 430 15% 13%
2 people 497 17% 18%
3 people 536 19% 19%
4 people 411 14% 17%
5 people 254 9% 10%
6 people 148 5% 4%
7+ people 234 8% 7%
Missing 9 0.3% 0.2%
Respondents were also asked, “Do you live with a spouse,
partner or significant other?”
Results: Fifty-two percent of respondents reported
that they live with a spouse, partner, or significant other.
If the participant lived with one or more people, they were
asked, “How many children aged 17 or younger live in
your household?” If they had children in the household,
they were also asked, “How many in each age group live in
the household?”
Results: Over a third of households with at least two
people did not include any children. Of households
with children, the majority included one or two.
Number of children in the household Participant % (unweighted)
Participant % (weighted)
0 Children 36% 37%
1 Child 21% 21%
2 Children 18% 18%
3 Children 13% 13%
4 Children 7% 6%
5 Children 2% 2%
6+ Children 3% 2%
The majority of households with children included at least
one preschooler. About a third of households included
elementary ages, pre-teenagers and/or teenagers.
Ages of children in the household Participant %
(unweighted)
Population %
(weighted)
Infant (<1 year) 18% 17%
Preschoolers (1-5 years) 56% 55%
Elementary (6-8 years) 35% 33%
Pre-teens (9-12 years) 37% 35%
Teens (13-17 years) 38% 34%
NOTE: Households reported multiple children, some of which may be within the same age group.
Education
All respondents were asked, “What is the highest level of
school you completed or the highest degree you received?”
Results: Over one third of respondents graduated from
high school or equivalent. More than another third
attended some college or received a degree.
Level of education Participant %
(unweighted)
Population %
(weighted)
Less than High School (HS) diploma 20% 25%
HS Graduate/ GED 36% 36%
Some College or 2-year Degree 32% 29%
4-year Degree or more 11% 9%
14
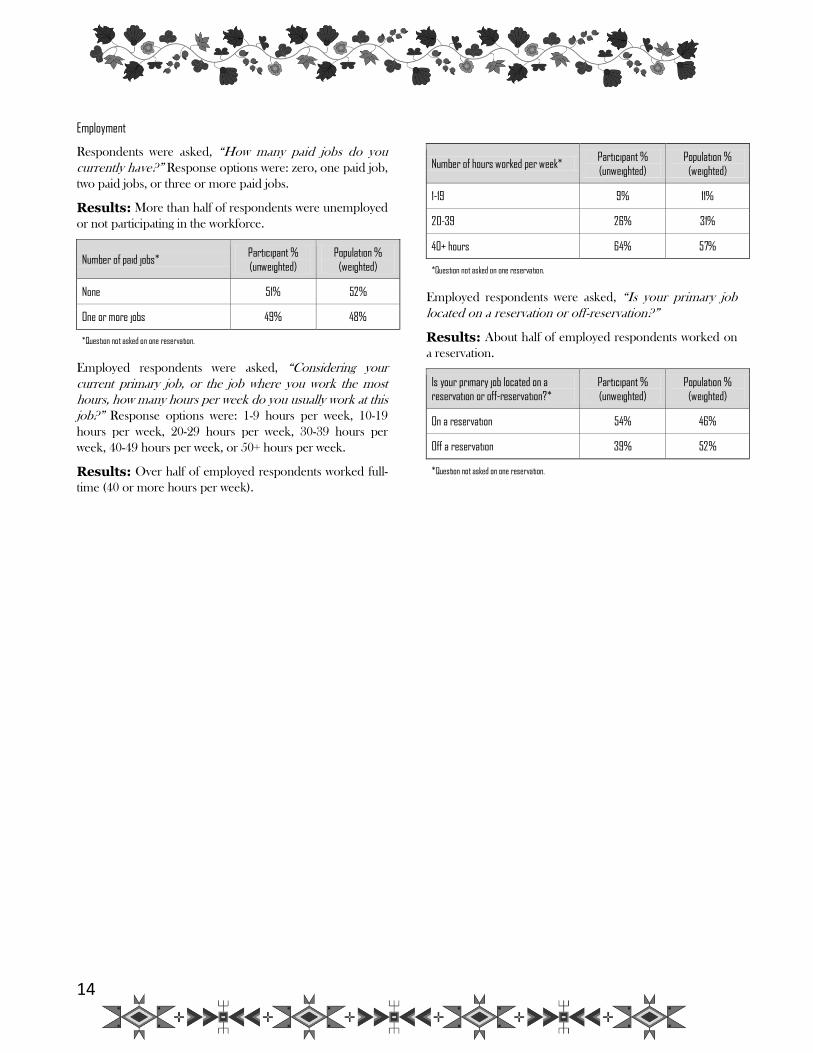
Employment
Respondents were asked, “How many paid jobs do you
currently have?” Response options were: zero, one paid job,
two paid jobs, or three or more paid jobs.
Results: More than half of respondents were unemployed
or not participating in the workforce.
Number of paid jobs* Participant % (unweighted)
Population % (weighted)
None 51% 52%
One or more jobs 49% 48%
*Question not asked on one reservation.
Employed respondents were asked, “Considering your
current primary job, or the job where you work the most
hours, how many hours per week do you usually work at this
job?” Response options were: 1-9 hours per week, 10-19
hours per week, 20-29 hours per week, 30-39 hours per
week, 40-49 hours per week, or 50+ hours per week.
Results: Over half of employed respondents worked full-
time (40 or more hours per week).
Number of hours worked per week* Participant % (unweighted)
Population % (weighted)
1-19 9% 11%
20-39 26% 31%
40+ hours 64% 57%
*Question not asked on one reservation.
Employed respondents were asked, “Is your primary job
located on a reservation or off-reservation?”
Results: About half of employed respondents worked on
a reservation.
Is your primary job located on a reservation or off-reservation?*
Participant % (unweighted)
Population % (weighted)
On a reservation 54% 46%
Off a reservation 39% 52%
*Question not asked on one reservation.
15
PART II: PATTERNS OF TOBACCO USE AND CESSATION These results are weighted by age and gender to be representative of American Indians throughout Minnesota according to the US Census 2010.
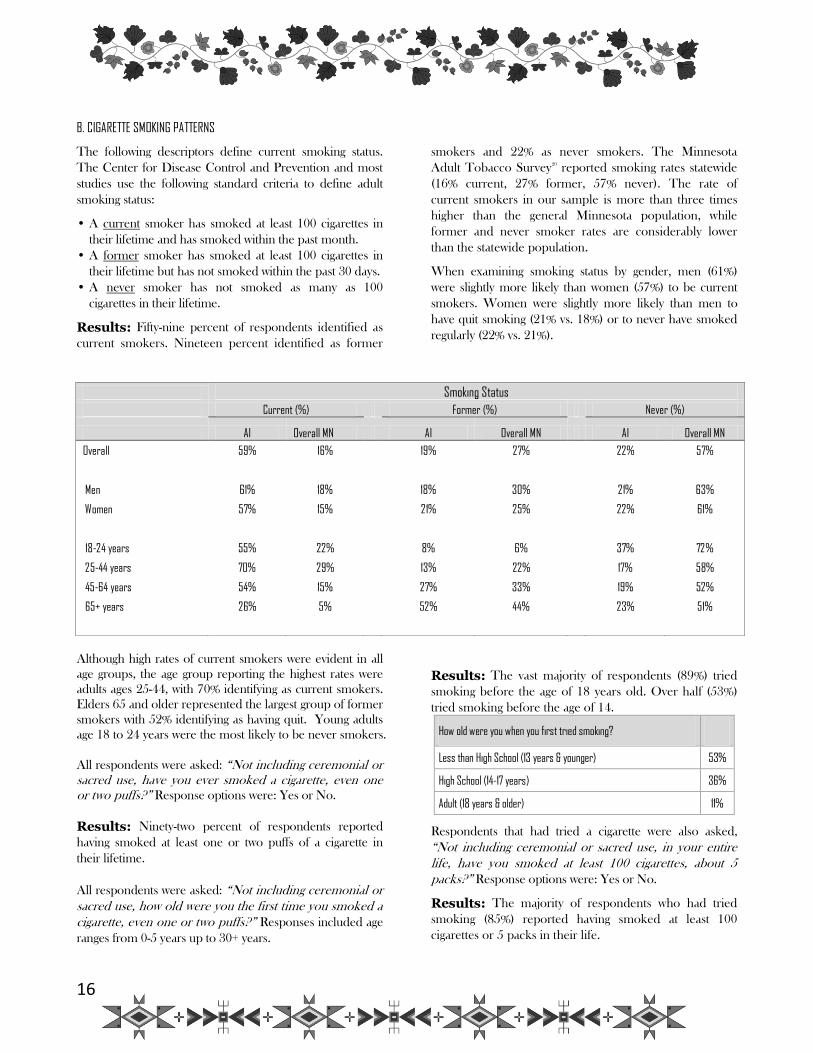
A. CEREMONIAL OR SACRED TOBACCO USE
Tobacco control cannot be addressed in American Indian
communities without first acknowledging the teachings of
the traditional and sacred role of tobacco. This section aims
to describe the use of tobacco for traditional purposes
among the respondents of this survey.
All respondents were asked, “Have you ever used tobacco
for ceremonial prayer or in a sacred way?” Response
options were: Yes or No.
Results: Almost three-fourths of participants (71%)
reported ever having used tobacco for ceremonial prayer or
in a sacred way.
Ever used tobacco for ceremonial prayer or in a sacred
way
Yes 71%
No 27%
Don’t Know/Not Sure/Refused 3%
Respondents who had used tobacco for
ceremonial/traditional reasons in the past year were also
asked, “When you use tobacco for ceremonial prayer or
sacred reasons, what type of tobacco do you usually use?”
Response options were: Natural tobacco plant or mixture of
plants/bark, Cigarettes, or Commercial tobacco in a pouch
or can.
Results: Three-fourths (75%) of those who had used
tobacco for ceremonial/traditional reasons reported they
usually used commercial tobacco (either pouch tobacco or
cigarettes) for ceremonial prayer or sacred purposes.
Sixteen percent usually used traditional tobacco for
ceremonial or sacred use.
What type of tobacco do you usually use for this purpose?
Pouch/Loose commercial tobacco 60%
Cigarettes 15%
Traditional tobacco 16%
Don’t Know/Not Sure/Refused 8%
16
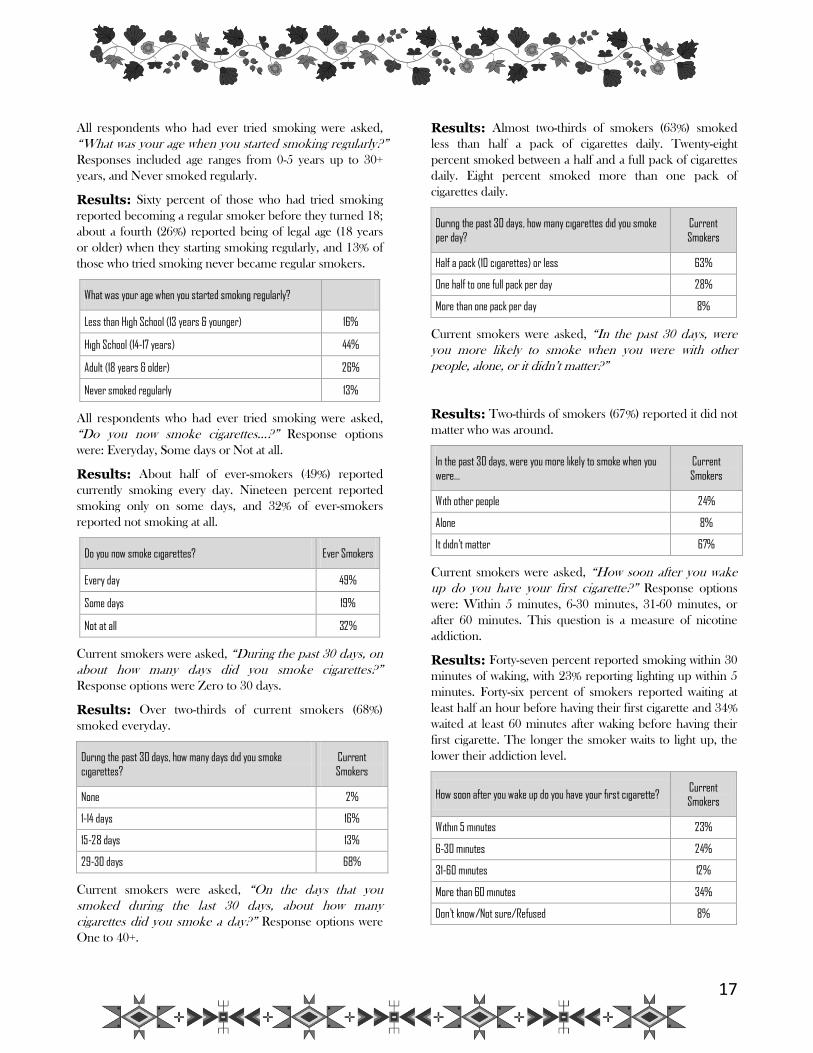
B. CIGARETTE SMOKING PATTERNS
The following descriptors define current smoking status.
The Center for Disease Control and Prevention and most
studies use the following standard criteria to define adult
smoking status:
• A current smoker has smoked at least 100 cigarettes in
their lifetime and has smoked within the past month.
• A former smoker has smoked at least 100 cigarettes in
their lifetime but has not smoked within the past 30 days.
• A never smoker has not smoked as many as 100
cigarettes in their lifetime.
Results: Fifty-nine percent of respondents identified as
current smokers. Nineteen percent identified as former
smokers and 22% as never smokers. The Minnesota
Adult Tobacco Survey20
reported smoking rates statewide
(16% current, 27% former, 57% never). The rate of
current smokers in our sample is more than three times
higher than the general Minnesota population, while
former and never smoker rates are considerably lower
than the statewide population.
When examining smoking status by gender, men (61%)
were slightly more likely than women (57%) to be current
smokers. Women were slightly more likely than men to
have quit smoking (21% vs. 18%) or to never have smoked
regularly (22% vs. 21%).
Smoking Status
Current (%) Former (%) Never (%)
AI Overall MN AI Overall MN AI Overall MN
Overall 59% 16% 19% 27% 22% 57%
Men 61% 18% 18% 30% 21% 63%
Women 57% 15% 21% 25% 22% 61%
18-24 years 55% 22% 8% 6% 37% 72%
25-44 years 70% 29% 13% 22% 17% 58%
45-64 years 54% 15% 27% 33% 19% 52%
65+ years 26% 5% 52% 44% 23% 51%
Although high rates of current smokers were evident in all
age groups, the age group reporting the highest rates were
adults ages 25-44, with 70% identifying as current smokers.
Elders 65 and older represented the largest group of former
smokers with 52% identifying as having quit. Young adults
age 18 to 24 years were the most likely to be never smokers.
All respondents were asked: “Not including ceremonial or
sacred use, have you ever smoked a cigarette, even one
or two puffs?” Response options were: Yes or No.
Results: Ninety-two percent of respondents reported
having smoked at least one or two puffs of a cigarette in
their lifetime.
All respondents were asked: “Not including ceremonial or
sacred use, how old were you the first time you smoked a
cigarette, even one or two puffs?” Responses included age
ranges from 0-5 years up to 30+ years.
Results: The vast majority of respondents (89%) tried
smoking before the age of 18 years old. Over half (53%)
tried smoking before the age of 14.
How old were you when you first tried smoking?
Less than High School (13 years & younger) 53%
High School (14-17 years) 36%
Adult (18 years & older) 11%
Respondents that had tried a cigarette were also asked,
“Not including ceremonial or sacred use, in your entire
life, have you smoked at least 100 cigarettes, about 5
packs?” Response options were: Yes or No.
Results: The majority of respondents who had tried
smoking (85%) reported having smoked at least 100
cigarettes or 5 packs in their life.
17
All respondents who had ever tried smoking were asked,
“What was your age when you started smoking regularly?”
Responses included age ranges from 0-5 years up to 30+
years, and Never smoked regularly.
Results: Sixty percent of those who had tried smoking
reported becoming a regular smoker before they turned 18;
about a fourth (26%) reported being of legal age (18 years
or older) when they starting smoking regularly, and 13% of
those who tried smoking never became regular smokers.
What was your age when you started smoking regularly?
Less than High School (13 years & younger) 16%
High School (14-17 years) 44%
Adult (18 years & older) 26%
Never smoked regularly 13%
All respondents who had ever tried smoking were asked,
“Do you now smoke cigarettes…?” Response options
were: Everyday, Some days or Not at all.
Results: About half of ever-smokers (49%) reported
currently smoking every day. Nineteen percent reported
smoking only on some days, and 32% of ever-smokers
reported not smoking at all.
Do you now smoke cigarettes? Ever Smokers
Every day 49%
Some days 19%
Not at all 32%
Current smokers were asked, “During the past 30 days, on
about how many days did you smoke cigarettes?”
Response options were Zero to 30 days.
Results: Over two-thirds of current smokers (68%)
smoked everyday.
During the past 30 days, how many days did you smoke
cigarettes?
Current
Smokers
None 2%
1-14 days 16%
15-28 days 13%
29-30 days 68%
Current smokers were asked, “On the days that you
smoked during the last 30 days, about how many
cigarettes did you smoke a day?” Response options were
One to 40+.
Results: Almost two-thirds of smokers (63%) smoked
less than half a pack of cigarettes daily. Twenty-eight
percent smoked between a half and a full pack of cigarettes
daily. Eight percent smoked more than one pack of
cigarettes daily.
During the past 30 days, how many cigarettes did you smoke
per day?
Current
Smokers
Half a pack (10 cigarettes) or less 63%
One half to one full pack per day 28%
More than one pack per day 8%
Current smokers were asked, “In the past 30 days, were
you more likely to smoke when you were with other
people, alone, or it didn’t matter?”
Results: Two-thirds of smokers (67%) reported it did not
matter who was around.
In the past 30 days, were you more likely to smoke when you
were…
Current
Smokers
With other people 24%
Alone 8%
It didn’t matter 67%
Current smokers were asked, “How soon after you wake
up do you have your first cigarette?” Response options
were: Within 5 minutes, 6-30 minutes, 31-60 minutes, or
after 60 minutes. This question is a measure of nicotine
addiction.
Results: Forty-seven percent reported smoking within 30
minutes of waking, with 23% reporting lighting up within 5
minutes. Forty-six percent of smokers reported waiting at
least half an hour before having their first cigarette and 34%
waited at least 60 minutes after waking before having their
first cigarette. The longer the smoker waits to light up, the
lower their addiction level.
How soon after you wake up do you have your first cigarette? Current Smokers
Within 5 minutes 23%
6-30 minutes 24%
31-60 minutes 12%
More than 60 minutes 34%
Don’t know/Not sure/Refused 8%
18
Current smokers were asked, “What kind of cigarettes do
you usually smoke?” Response options were: Light/Ultra
Light, Menthol, Natural (no additives), Regular filtered, or
Regular unfiltered.
Results: Half of current smokers (52%) reported
smoking regular filtered cigarettes. Almost one-third (30%)
reported smoking menthol cigarettes. Fourteen percent of
current smokers reported they usually smoked light or ultra
light cigarettes. Four percent reported smoking regular
unfiltered or natural (no additive) cigarettes.
What kind of cigarettes do you usually smoke? Current
Smokers
Regular filtered 52%
Menthol 30%
Light/Ultra light 14%
Regular unfiltered 2%
Natural (no additives) 2%
Current smokers were asked, “Not including ceremonial
or sacred use, do you ever smoke cigarettes that have an
American Indian image or name?” Response options
were: Never, Sometimes, or Usually.
Results: Forty-four percent of current smokers reported
never smoking cigarettes with an American Indian name or
image. Forty-one percent reported they sometimes did.
Twelve percent reported usually smoking cigarettes with
Native American imagery or name.
Do you ever smoke cigarettes that have an American Indian
image or name?
Current
Smokers
Never 44%
Sometimes 41%
Usually 12%
Don’t know/not sure/refused 3%
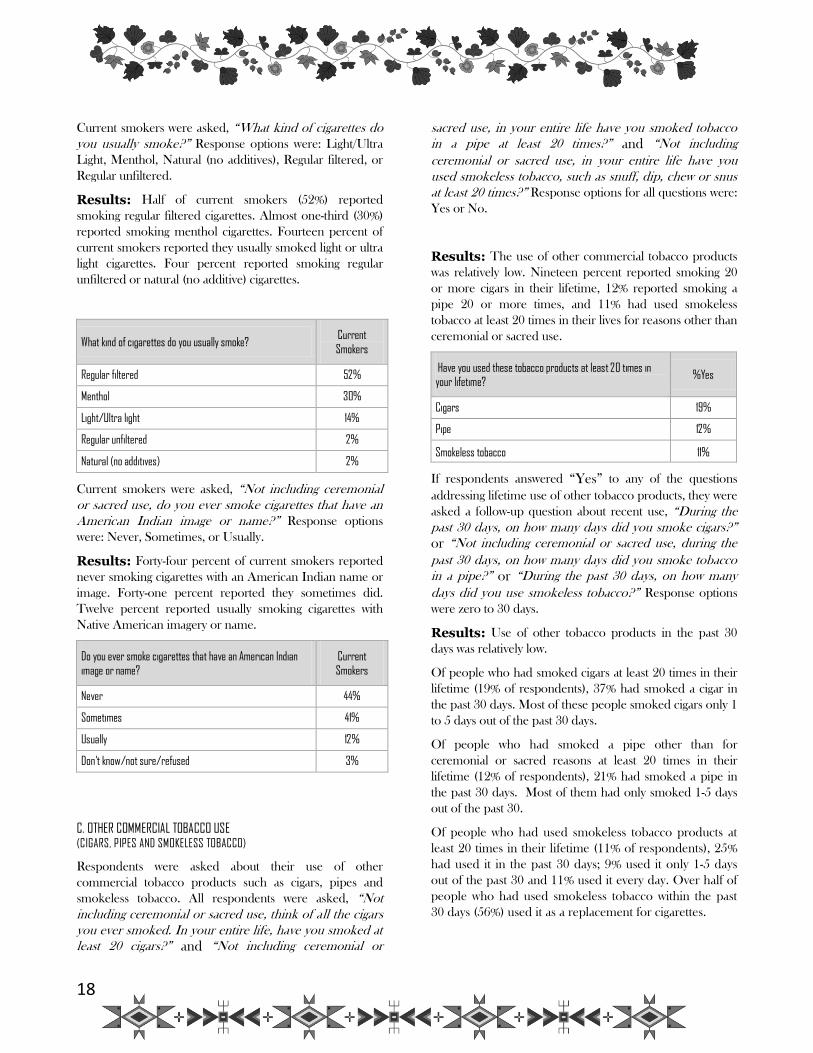
C. OTHER COMMERCIAL TOBACCO USE (CIGARS, PIPES AND SMOKELESS TOBACCO)
Respondents were asked about their use of other
commercial tobacco products such as cigars, pipes and
smokeless tobacco. All respondents were asked, “Not
including ceremonial or sacred use, think of all the cigars
you ever smoked. In your entire life, have you smoked at
least 20 cigars?” and “Not including ceremonial or
sacred use, in your entire life have you smoked tobacco
in a pipe at least 20 times?” and “Not including
ceremonial or sacred use, in your entire life have you
used smokeless tobacco, such as snuff, dip, chew or snus
at least 20 times?” Response options for all questions were:
Yes or No.
Results: The use of other commercial tobacco products
was relatively low. Nineteen percent reported smoking 20
or more cigars in their lifetime, 12% reported smoking a
pipe 20 or more times, and 11% had used smokeless
tobacco at least 20 times in their lives for reasons other than
ceremonial or sacred use.
Have you used these tobacco products at least 20 times in
your lifetime? %Yes
Cigars 19%
Pipe 12%
Smokeless tobacco 11%
If respondents answered “Yes” to any of the questions
addressing lifetime use of other tobacco products, they were
asked a follow-up question about recent use, “During the
past 30 days, on how many days did you smoke cigars?” or “Not including ceremonial or sacred use, during the
past 30 days, on how many days did you smoke tobacco
in a pipe?” or “During the past 30 days, on how many
days did you use smokeless tobacco?” Response options
were zero to 30 days.
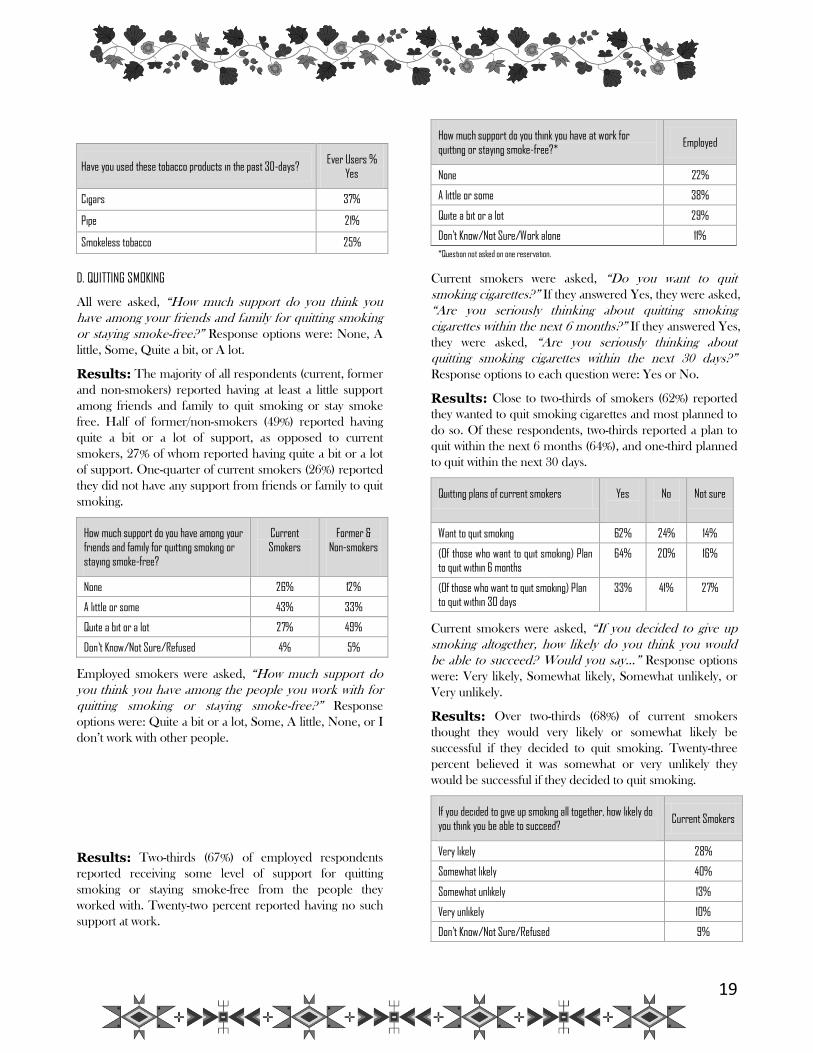
Results: Use of other tobacco products in the past 30
days was relatively low.
Of people who had smoked cigars at least 20 times in their
lifetime (19% of respondents), 37% had smoked a cigar in
the past 30 days. Most of these people smoked cigars only 1
to 5 days out of the past 30 days.
Of people who had smoked a pipe other than for ceremonial or sacred reasons at least 20 times in their
lifetime (12% of respondents), 21% had smoked a pipe in
the past 30 days. Most of them had only smoked 1-5 days
out of the past 30.
Of people who had used smokeless tobacco products at
least 20 times in their lifetime (11% of respondents), 25%
had used it in the past 30 days; 9% used it only 1-5 days
out of the past 30 and 11% used it every day. Over half of
people who had used smokeless tobacco within the past
30 days (56%) used it as a replacement for cigarettes.
19
Have you used these tobacco products in the past 30-days? Ever Users %
Yes
Cigars 37%
Pipe 21%
Smokeless tobacco 25%
D. QUITTING SMOKING
All were asked, “How much support do you think you
have among your friends and family for quitting smoking
or staying smoke-free?” Response options were: None, A
little, Some, Quite a bit, or A lot.
Results: The majority of all respondents (current, former
and non-smokers) reported having at least a little support
among friends and family to quit smoking or stay smoke
free. Half of former/non-smokers (49%) reported having
quite a bit or a lot of support, as opposed to current
smokers, 27% of whom reported having quite a bit or a lot
of support. One-quarter of current smokers (26%) reported
they did not have any support from friends or family to quit
smoking.
How much support do you have among your
friends and family for quitting smoking or
staying smoke-free?
Current
Smokers
Former &
Non-smokers
None 26% 12%
A little or some 43% 33%
Quite a bit or a lot 27% 49%
Don’t Know/Not Sure/Refused 4% 5%
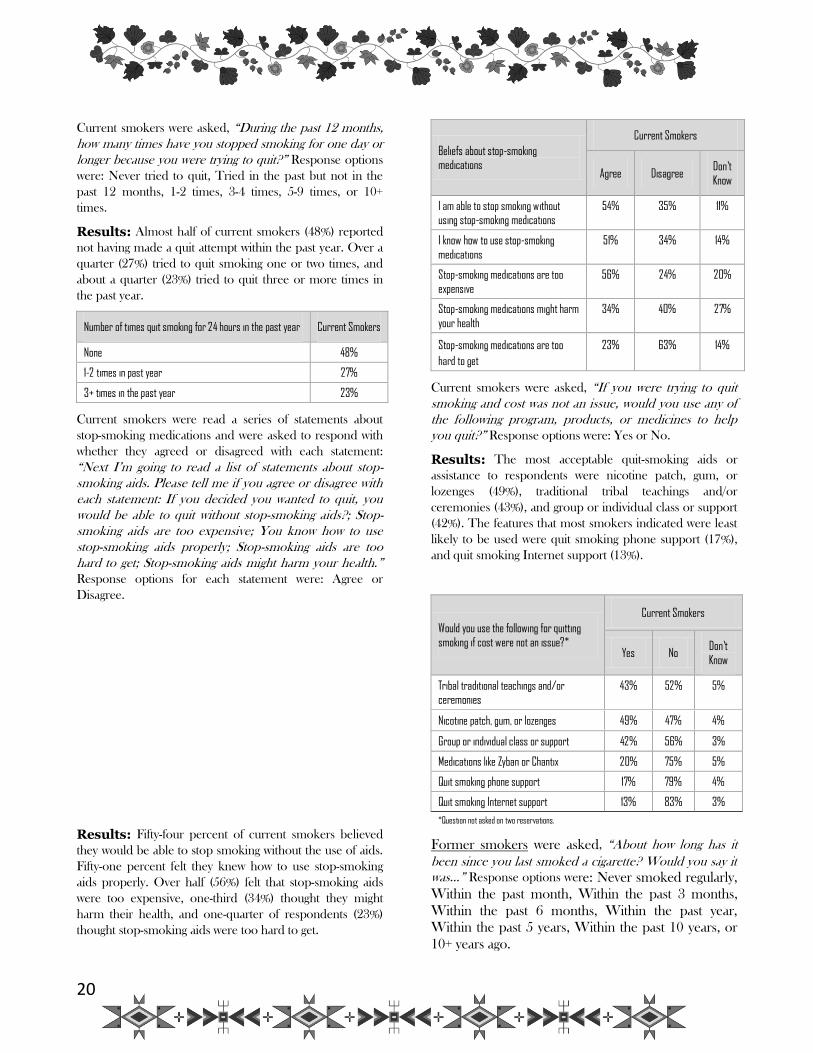
Employed smokers were asked, “How much support do
you think you have among the people you work with for
quitting smoking or staying smoke-free?” Response
options were: Quite a bit or a lot, Some, A little, None, or I
don’t work with other people.
Results: Two-thirds (67%) of employed respondents
reported receiving some level of support for quitting
smoking or staying smoke-free from the people they
worked with. Twenty-two percent reported having no such
support at work.
How much support do you think you have at work for
quitting or staying smoke-free?* Employed
None 22%
A little or some 38%
Quite a bit or a lot 29%
Don’t Know/Not Sure/Work alone 11%
*Question not asked on one reservation.
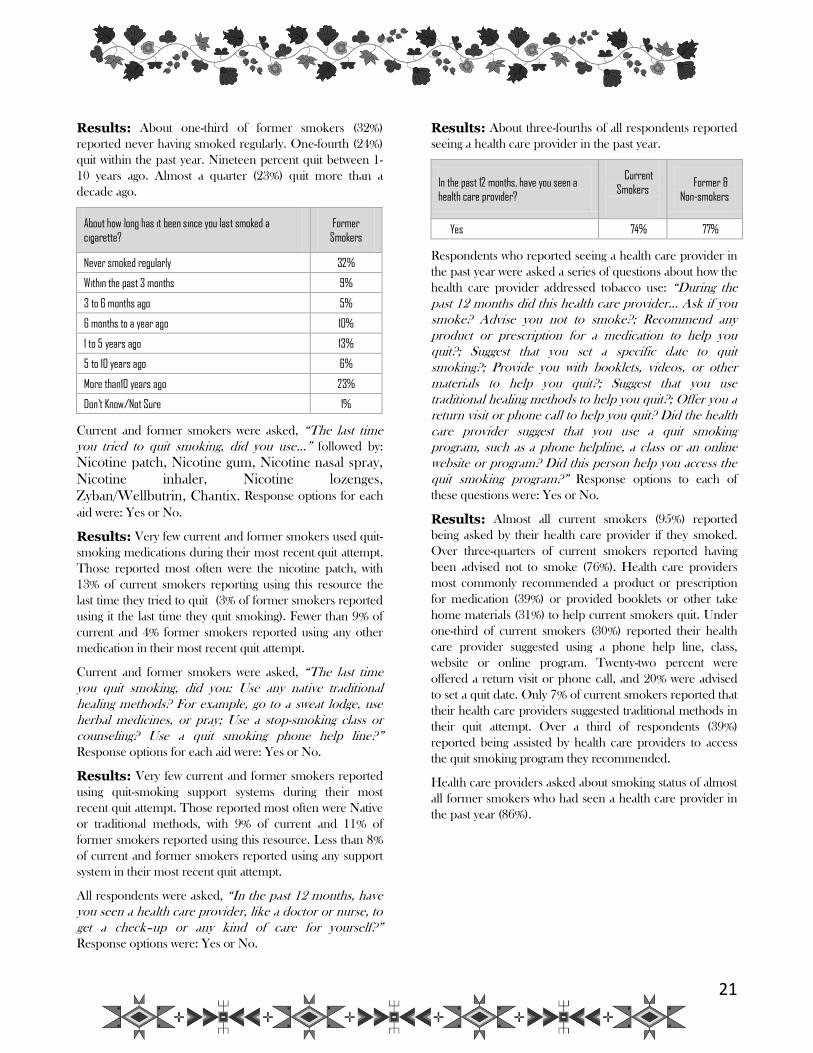
Current smokers were asked, “Do you want to quit
smoking cigarettes?” If they answered Yes, they were asked,
“Are you seriously thinking about quitting smoking
cigarettes within the next 6 months?” If they answered Yes,
they were asked, “Are you seriously thinking about
quitting smoking cigarettes within the next 30 days?”
Response options to each question were: Yes or No.
Results: Close to two-thirds of smokers (62%) reported
they wanted to quit smoking cigarettes and most planned to
do so. Of these respondents, two-thirds reported a plan to
quit within the next 6 months (64%), and one-third planned
to quit within the next 30 days.
Quitting plans of current smokers Yes
No
Not sure
Want to quit smoking 62% 24% 14%
(Of those who want to quit smoking) Plan to quit within 6 months
64% 20% 16%
(Of those who want to quit smoking) Plan to quit within 30 days
33% 41% 27%
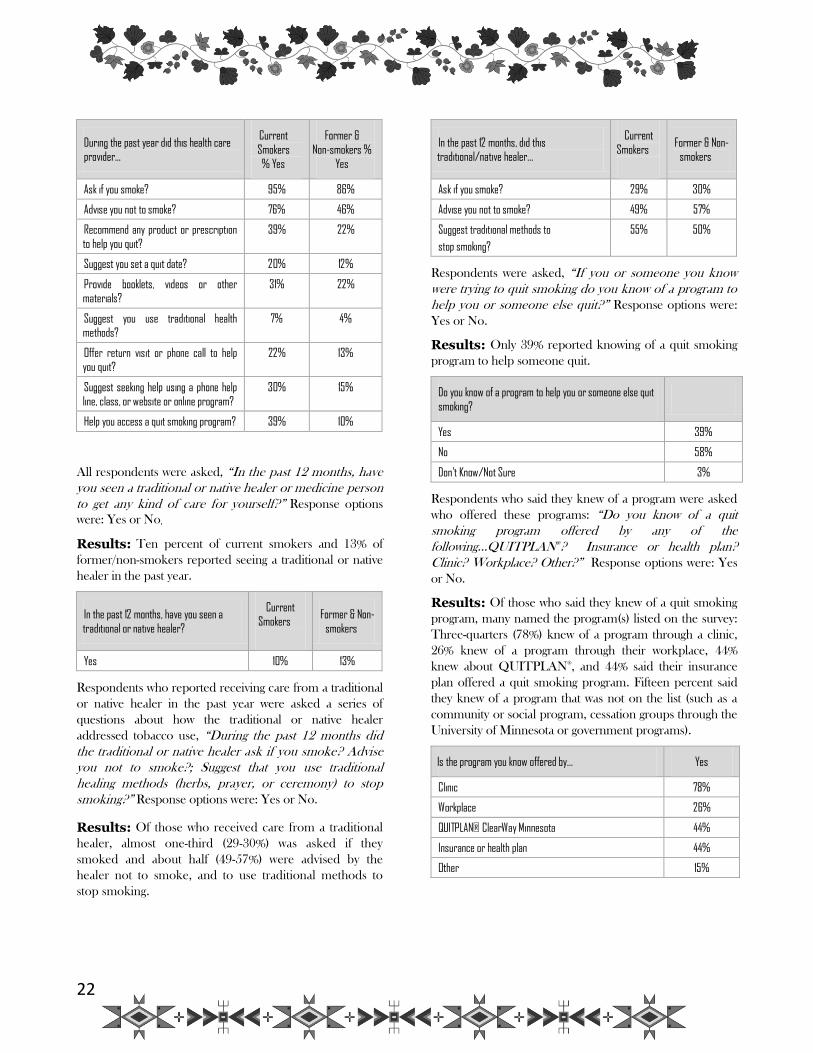
Current smokers were asked, “If you decided to give up
smoking altogether, how likely do you think you would
be able to succeed? Would you say…” Response options
were: Very likely, Somewhat likely, Somewhat unlikely, or
Very unlikely.
Results: Over two-thirds (68%) of current smokers
thought they would very likely or somewhat likely be
successful if they decided to quit smoking. Twenty-three
percent believed it was somewhat or very unlikely they
would be successful if they decided to quit smoking.
If you decided to give up smoking all together, how likely do
you think you be able to succeed? Current Smokers
Very likely 28%
Somewhat likely 40%
Somewhat unlikely 13%
Very unlikely 10%
Don’t Know/Not Sure/Refused 9%
20
Current smokers were asked, “During the past 12 months,
how many times have you stopped smoking for one day or
longer because you were trying to quit?” Response options
were: Never tried to quit, Tried in the past but not in the
past 12 months, 1-2 times, 3-4 times, 5-9 times, or 10+
times.
Results: Almost half of current smokers (48%) reported
not having made a quit attempt within the past year. Over a
quarter (27%) tried to quit smoking one or two times, and
about a quarter (23%) tried to quit three or more times in
the past year.
Number of times quit smoking for 24 hours in the past year Current Smokers
None 48%
1-2 times in past year 27%
3+ times in the past year 23%
Current smokers were read a series of statements about
stop-smoking medications and were asked to respond with
whether they agreed or disagreed with each statement:
“Next I’m going to read a list of statements about stop-
smoking aids. Please tell me if you agree or disagree with
each statement: If you decided you wanted to quit, you
would be able to quit without stop-smoking aids?; Stop-
smoking aids are too expensive; You know how to use
stop-smoking aids properly; Stop-smoking aids are too
hard to get; Stop-smoking aids might harm your health.”
Response options for each statement were: Agree or
Disagree.
Results: Fifty-four percent of current smokers believed
they would be able to stop smoking without the use of aids.
Fifty-one percent felt they knew how to use stop-smoking
aids properly. Over half (56%) felt that stop-smoking aids
were too expensive, one-third (34%) thought they might
harm their health, and one-quarter of respondents (23%)
thought stop-smoking aids were too hard to get.
Beliefs about stop-smoking medications
Current Smokers
Agree Disagree Don’t
Know
I am able to stop smoking without using stop-smoking medications
54% 35% 11%
I know how to use stop-smoking
medications
51% 34% 14%
Stop-smoking medications are too
expensive
56% 24% 20%
Stop-smoking medications might harm
your health
34% 40% 27%
Stop-smoking medications are too
hard to get
23% 63% 14%
Current smokers were asked, “If you were trying to quit
smoking and cost was not an issue, would you use any of
the following program, products, or medicines to help
you quit?” Response options were: Yes or No.
Results: The most acceptable quit-smoking aids or
assistance to respondents were nicotine patch, gum, or
lozenges (49%), traditional tribal teachings and/or
ceremonies (43%), and group or individual class or support
(42%). The features that most smokers indicated were least
likely to be used were quit smoking phone support (17%),
and quit smoking Internet support (13%).
Would you use the following for quitting
smoking if cost were not an issue?*
Current Smokers
Yes No Don’t
Know
Tribal traditional teachings and/or ceremonies
43% 52% 5%
Nicotine patch, gum, or lozenges 49% 47% 4%
Group or individual class or support 42% 56% 3%
Medications like Zyban or Chantix 20% 75% 5%
Quit smoking phone support 17% 79% 4%
Quit smoking Internet support 13% 83% 3%
*Question not asked on two reservations.
Former smokers were asked, “About how long has it
been since you last smoked a cigarette? Would you say it
was…” Response options were: Never smoked regularly,
Within the past month, Within the past 3 months,
Within the past 6 months, Within the past year,
Within the past 5 years, Within the past 10 years, or
10+ years ago.
21
Results: About one-third of former smokers (32%)
reported never having smoked regularly. One-fourth (24%)
quit within the past year. Nineteen percent quit between 1-
10 years ago. Almost a quarter (23%) quit more than a
decade ago.
About how long has it been since you last smoked a
cigarette?
Former
Smokers
Never smoked regularly 32%
Within the past 3 months 9%
3 to 6 months ago 5%
6 months to a year ago 10%
1 to 5 years ago 13%
5 to 10 years ago 6%
More than10 years ago 23%
Don’t Know/Not Sure 1%
Current and former smokers were asked, “The last time
you tried to quit smoking, did you use...” followed by:
Nicotine patch, Nicotine gum, Nicotine nasal spray,
Nicotine inhaler, Nicotine lozenges,
Zyban/Wellbutrin, Chantix. Response options for each
aid were: Yes or No.
Results: Very few current and former smokers used quit-
smoking medications during their most recent quit attempt.
Those reported most often were the nicotine patch, with
13% of current smokers reporting using this resource the
last time they tried to quit (3% of former smokers reported
using it the last time they quit smoking). Fewer than 9% of
current and 4% former smokers reported using any other
medication in their most recent quit attempt.
Current and former smokers were asked, “The last time
you quit smoking, did you: Use any native traditional
healing methods? For example, go to a sweat lodge, use
herbal medicines, or pray; Use a stop-smoking class or
counseling? Use a quit smoking phone help line?”
Response options for each aid were: Yes or No.
Results: Very few current and former smokers reported
using quit-smoking support systems during their most
recent quit attempt. Those reported most often were Native
or traditional methods, with 9% of current and 11% of
former smokers reported using this resource. Less than 8%
of current and former smokers reported using any support
system in their most recent quit attempt.
All respondents were asked, “In the past 12 months, have
you seen a health care provider, like a doctor or nurse, to
get a check–up or any kind of care for yourself?”
Response options were: Yes or No.
Results: About three-fourths of all respondents reported
seeing a health care provider in the past year.
In the past 12 months, have you seen a health care provider?
Current
Smokers
Former & Non-smokers
Yes 74% 77%
Respondents who reported seeing a health care provider in
the past year were asked a series of questions about how the
health care provider addressed tobacco use: “During the
past 12 months did this health care provider… Ask if you
smoke? Advise you not to smoke?; Recommend any
product or prescription for a medication to help you
quit?; Suggest that you set a specific date to quit
smoking?; Provide you with booklets, videos, or other
materials to help you quit?; Suggest that you use
traditional healing methods to help you quit?; Offer you a
return visit or phone call to help you quit? Did the health
care provider suggest that you use a quit smoking
program, such as a phone helpline, a class or an online
website or program? Did this person help you access the
quit smoking program?” Response options to each of
these questions were: Yes or No.
Results: Almost all current smokers (95%) reported
being asked by their health care provider if they smoked.
Over three-quarters of current smokers reported having
been advised not to smoke (76%). Health care providers
most commonly recommended a product or prescription
for medication (39%) or provided booklets or other take
home materials (31%) to help current smokers quit. Under
one-third of current smokers (30%) reported their health
care provider suggested using a phone help line, class,
website or online program. Twenty-two percent were
offered a return visit or phone call, and 20% were advised
to set a quit date. Only 7% of current smokers reported that
their health care providers suggested traditional methods in
their quit attempt. Over a third of respondents (39%)
reported being assisted by health care providers to access
the quit smoking program they recommended.
Health care providers asked about smoking status of almost
all former smokers who had seen a health care provider in
the past year (86%).
22
During the past year did this health care provider...
Current
Smokers
% Yes
Former &
Non-smokers %
Yes
Ask if you smoke? 95% 86%
Advise you not to smoke? 76% 46%
Recommend any product or prescription
to help you quit?
39% 22%
Suggest you set a quit date? 20% 12%
Provide booklets, videos or other materials?
31% 22%
Suggest you use traditional health methods?
7% 4%
Offer return visit or phone call to help you quit?
22% 13%
Suggest seeking help using a phone help
line, class, or website or online program?
30% 15%
Help you access a quit smoking program? 39% 10%
All respondents were asked, “In the past 12 months, have
you seen a traditional or native healer or medicine person
to get any kind of care for yourself?” Response options
were: Yes or No.
Results: Ten percent of current smokers and 13% of
former/non-smokers reported seeing a traditional or native
healer in the past year.
In the past 12 months, have you seen a
traditional or native healer?
Current
Smokers
Former & Non-
smokers
Yes 10% 13%
Respondents who reported receiving care from a traditional
or native healer in the past year were asked a series of
questions about how the traditional or native healer
addressed tobacco use, “During the past 12 months did
the traditional or native healer ask if you smoke? Advise
you not to smoke?; Suggest that you use traditional
healing methods (herbs, prayer, or ceremony) to stop
smoking?” Response options were: Yes or No.
Results: Of those who received care from a traditional
healer, almost one-third (29-30%) was asked if they
smoked and about half (49-57%) were advised by the
healer not to smoke, and to use traditional methods to
stop smoking.
In the past 12 months, did this traditional/native healer…
Current
Smokers
Former & Non-smokers
Ask if you smoke? 29% 30%
Advise you not to smoke? 49% 57%
Suggest traditional methods to
stop smoking?
55% 50%
Respondents were asked, “If you or someone you know
were trying to quit smoking do you know of a program to
help you or someone else quit?” Response options were:
Yes or No.
Results: Only 39% reported knowing of a quit smoking
program to help someone quit.
Do you know of a program to help you or someone else quit
smoking?
Yes 39%
No 58%
Don’t Know/Not Sure 3%
Respondents who said they knew of a program were asked
who offered these programs: “Do you know of a quit
smoking program offered by any of the
following…QUITPLAN®? Insurance or health plan?
Clinic? Workplace? Other?” Response options were: Yes
or No.
Results: Of those who said they knew of a quit smoking
program, many named the program(s) listed on the survey:
Three-quarters (78%) knew of a program through a clinic,
26% knew of a program through their workplace, 44%
knew about QUITPLAN®
, and 44% said their insurance
plan offered a quit smoking program. Fifteen percent said
they knew of a program that was not on the list (such as a
community or social program, cessation groups through the
University of Minnesota or government programs).
Is the program you know offered by… Yes
Clinic 78%
Workplace 26%
QUITPLAN® ClearWay Minnesota 44%
Insurance or health plan 44%
Other 15%
23
PART III: SECONDHAND SMOKE EXPOSURE AND ATTITUDES These results are weighted by age and gender to be representative of American Indians throughout Minnesota according to the US Census 2010.
A. SECONDHAND SMOKE (SHS) EXPOSURE
All respondents were read, “This section is about
secondhand smoke exposure. Secondhand smoke is the
smoke that comes from burning a cigarette or other
tobacco products.”
Respondents were asked, “During the past 30 days, have
you seen or heard any ads or commercials encouraging
smokers to quit or about the dangers of secondhand
smoke?” Response options were: Yes or No.
Results: Eighty-two percent of respondents reported that
they had recently seen or heard an ad or commercial
encouraging smokers to quit or about the dangers of
secondhand smoke.
During the past 30 days, have you seen or heard any
commercials encouraging smokers to quit or about the
dangers of secondhand smoke?
Yes 82%
Current smokers were asked, “About how many times in
the past 12 months has anyone asked you to put out a
cigarette or not light up when you were about to do so?”
Response options were zero times to 10+ times. If the
participant answered one or more times, they were asked
two follow-up questions: “On the most recent occasion you
were asked not to smoke, who was that person? Was it
your…” Response options were: Relative, Friend or
Acquaintance, or a Stranger. These respondents were also
asked, “Was that person younger than you, about your age,
or older than you?”
Results: Almost half of current smokers (48%) reported
they had not been asked to put out or not light up a cigarette
in the past 12 months. Over half (51%) reported that they
had been asked at least once.
[Current smokers} About how many times in the past 12 months has anyone asked you to put out a cigarette or not light
up when you were about to do so?
0 or None 48%
1-2 TIMES 21%
3-4 TIMES 10%
5-9 TIMES 8%
10+ TIMES 12%
Don’t Know/Not Sure/Refused 1%
Current smokers reported that a request to not smoke
around others most likely came from a relative (49%) or
friend/acquaintance (33%). Only 13% reported that a
stranger made this request.
Forty-four percent of current smokers reported that on the
most recent occasion when they were asked not to smoke,
the person making the request was older than them. One-
third (33%) said that the person was younger than they were,
and 21% reported that the person making the request was
about the same age as the smoker.
Respondents were asked, “In the past 12 months, have you
asked someone to put out a cigarette or not light up when
they were about to do so?” Response options were: Yes or
No.
Results: Almost half (44%) reported that in the past 12
months they asked someone to put out a cigarette or not
light up when they were about to do so.
In the past 12 months, have you asked someone to put out a
cigarette or not light up when they were about to?
Yes 44%
Those who had made a request to a smoker to not smoke
were asked, “On the most recent occasion you asked
someone not to smoke, who was that person? Was it a…”
Response options included: Relative, Friend or
Acquaintance, or a Stranger. This question was followed by,
“Was that person younger than you, about your age or
older than you?” Respondents were then asked, “What was
the primary reason you asked that person not to smoke?
Was it because …Smoke is annoying to you; You were
concerned about your health; You were concerned about
the health of a child; You were concerned about the health
of the smoker; You were trying to quit; You were enforcing a
policy; or Some other reason.”
Results: On the most recent occasion respondents asked
someone not to smoke near them, most requests were made
of a relative (51%) or a friend or acquaintance (42%). Few
people made this request of a stranger (5%).
24
Most (43%) of requests to not smoke were made of people
younger than the non-smoker; about one-quarter (26%) were
made of people about the same age as the non-smoker.
Thirty percent of requests to put out a cigarette or not
smoke were made of people older than the non-smoker.
The majority of people that asked someone not to smoke
near them were doing it because of their concern about the
health of a child (44%), followed by their finding smoke to
be annoying (19%). Ten percent were enforcing a policy.
What was the primary reason you asked someone to put out a
cigarette or not light up when they were about to?
Concern about health of a child 44%
Smoke is annoying 19%
Concern about health of smoker 8%
Some other reason (set good example, spiritual reasons) 8%
Enforcing a policy 10%
Trying to quit 2%
Concern about own health 8%
Participants were asked, “Not including ceremonial or
sacred use, during the past 7 days on how many days did
anyone smoke cigarettes, cigars, or pipes anywhere inside
your home? Do not include decks, porches or garages.”
Response options were zero to seven days.
Results: Fifty-seven percent of respondents reported that
there had been no household smoking in the past 7 days.
Twenty-seven percent reported someone had smoked in
their home every day in the past seven days.
During the past 7 days on how many days did anyone smoke
anywhere inside your home?
0 days 57%
1-6 days 15%
7 days 27%
Respondents were asked, “What rules do you have about
smoking inside your home? Would you say smoking is…” Response options were: Allowed everywhere and at anytime
inside your home, Allowed in some places or at some times,
or Not allowed anywhere or at anytime inside your home.
Results: Over half of respondents (57%) reported
household rules establishing smoking as not allowed in their
homes. Nineteen percent reported there were no restrictions
on smoking in their homes. Almost a quarter (23%)
reported household rules that limited smoking in the home
to some places or some times.
What rules do you have about smoking inside your home?
Would you say smoking is…
Not allowed anywhere at any time 57%
Allowed everywhere and at anytime 19%
Allowed in some places or at some times 23%
Don’t Know/Not Sure 1%
Respondents were asked, “During the past 7 days have you
been in a car with someone else that was smoking?” Response options were: Yes, No, I have not been in the car
with someone else in the past 7 days.
Results: Two-thirds of respondents (67%) reported that
they had been in a car with someone else that was smoking
in the past 7 days.
During the past 7 days have you been in a car with someone
else that was smoking?
Yes 67%
Employed respondents were asked, “As far as you know, in
the past 7 days, has anyone smoked inside the place where
you work?” Response options were: Yes or No.
Results: Thirty-seven percent of employed participants
reported there was smoking in their work area.
In the past 7 days, has anyone smoked inside the place where you work?*
Yes 37%
*Question not asked on one reservation.
Respondents were asked, “In the past 7 days, has anyone
smoked near you at any place besides your home,
workplace or car?” Response options were: Yes or No.
Results: Seventy-one percent of participants reported
having been exposed to smoke from others in the past 7
days at places other than their home, workplace or car.
In the past 7 days, has anyone smoked near you at any place
besides your home, workplace or car?*
Yes 71%
*Question not asked on one reservation.
Employed respondents were asked, “Which of the
following best describes smoking rules inside the primary
place where you work? Smoking inside my workplace
is…Allowed in all areas, Allowed in some areas, Not allowed
at all”.
25
Results: Almost all reported there were rules at their
workplace restricting smoking inside: 34% said smoking was
only allowed in some areas, 13% said smoking was allowed
in all areas, and 52% reported that smoking was not allowed
at all.
What are the smoking rules in the area where you work?*
Not allowed at all 52%
Allowed in some areas 34%
Allowed in all areas 13%
Don’t Know/Not Sure 1%
*Question not asked on one reservation.
Employed respondents were asked, “Does your workplace
have an official policy, such as signs, personal contracts, or
written statements about smoking?” Response options
were: Yes or No. This question was followed with, “Is the
policy enforced?” Response options were: Always,
Sometimes, Rarely, or Never.
Results: Fifty-seven percent of participants who are
employed reported that their workplace had an official
policy about smoking. Of participants that had a workplace
policy, 76% said it was always enforced.
Does your workplace have an official policy, such as signs or
written statements about smoking?
Yes 57%
No 38%
Don’t Know/Not Sure 4%
*Question not asked on one reservation.
B. ATTITUDES ABOUT SECONDHAND SMOKE POLICIES
Current smokers were asked, “What effects, if any, do
smoking restrictions at work, home, restaurants, bars or
elsewhere have on your smoking? Would you say
smoking restrictions…Helped you think about quitting,
Helped you cut down on cigarettes, or Helped you make a
quit attempt.
Results: Forty-four percent of current smokers reported
that smoking restrictions resulted in their thinking about
quitting. Almost two thirds (62%) reported that smoking
restrictions at work, home and elsewhere helped them cut
down on cigarettes. One-third (33%) said that smoking
restrictions helped them make a quit attempt.
What effects do smoking restrictions have on your smoking?
Current
Smokers
% Yes
Helped you think about quitting? 44%
Helped you cut down on cigarettes? 62%
Helped you make a quit attempt? 33%
Non-smokers (Former and Never) were asked, “Would you
say that smoking restrictions at work, home, restaurants,
bars or elsewhere help you stay smoke-free?” Response
options were: Yes or No.
Results: Smoking restrictions have helped more than half
former and non-smokers (56%) stay smoke-free.
Would you say smoking restrictions help you stay smoke-
free?
Former
& Non- Smokers
Yes 56%
Respondents were asked a series of questions about whether
they thought smoking should be allowed at a number of
indoor locations within the community, including indoor
work areas, indoor areas of restaurants, indoor areas of
community centers, indoor areas of casinos or bingo halls,
indoor areas of other tribal buildings. Additionally,
respondents were asked if they felt smoking should be
allowed at outdoor community events, like pow-wows. All
questions had the same response options: Allowed in all
areas, Allowed in some areas, or Not allowed at all.
Results: Many participants held strong opinions about
creating and enforcing smoke-free spaces at most reservation
locations, especially at community centers, restaurants,
workplaces, and other tribal buildings. Three percent or less
believed that smoking should be allowed in all areas of these
indoor areas except for casinos and bingo halls.
Eighty-four percent of all participants thought community
centers should be smoke-free. The majority of participants
also thought smoking should not be allowed at all in the
indoor areas of restaurants (74%), workplaces (63%), and
other tribal buildings (73%).
Most respondents supported limiting cigarette smoking at
casinos and bingo halls; 51% thought that smoking should be
limited to certain areas and 28% said smoking should not be
allowed at all in casinos and bingo halls.
26
In the indoor areas of…
do you think smoking should be…
Allowed in
all areas
Allowed in
some areas
Not allowed
at all Don’t Know/Not Sure
Work areas 3% 30% 63% 3%
Restaurants 3% 21% 74% 2%
Community centers 2% 12% 84% 2%
Casinos and bingo halls 19% 51% 28% 2%
Tribal buildings 3% 20% 73% 4%
When questioned about smoking at outdoor community events (like pow-wows), almost half of participants supported limiting
smoking to certain areas (49%). Twenty-one percent supported making these events completely smoke-free.
At outdoor community events (like pow-wows) do you think
smoking should be…
Allowed in
all areas
Allowed in
some areas
Not allowed
at all Don’t Know/
Not Sure
26% 49% 21% 3%
27
PART IV: FACTORS RELATED TO TOBACCO USE These results are weighted by age and gender to be representative of American Indians throughout Minnesota according to the US Census 2010.
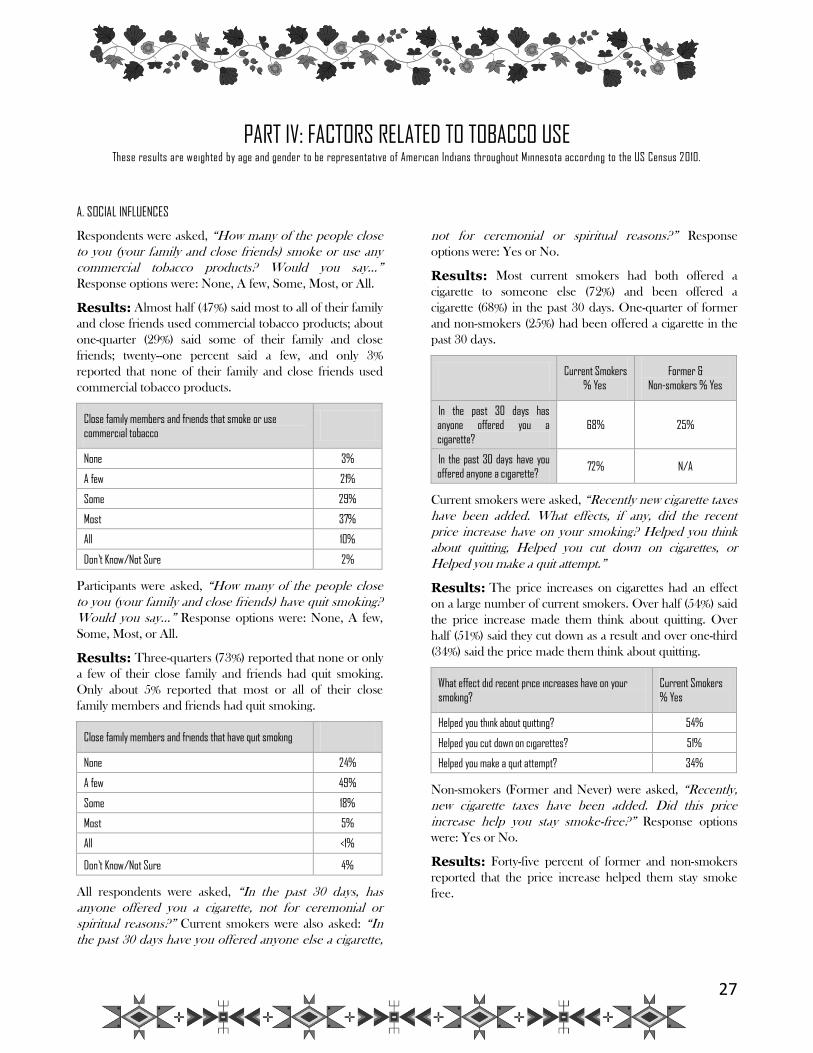
A. SOCIAL INFLUENCES
Respondents were asked, “How many of the people close
to you (your family and close friends) smoke or use any
commercial tobacco products? Would you say…”
Response options were: None, A few, Some, Most, or All.
Results: Almost half (47%) said most to all of their family
and close friends used commercial tobacco products; about
one-quarter (29%) said some of their family and close
friends; twenty--one percent said a few, and only 3%
reported that none of their family and close friends used
commercial tobacco products.
Close family members and friends that smoke or use
commercial tobacco
None 3%
A few 21%
Some 29%
Most 37%
All 10%
Don’t Know/Not Sure 2%
Participants were asked, “How many of the people close
to you (your family and close friends) have quit smoking?
Would you say…” Response options were: None, A few,
Some, Most, or All.
Results: Three-quarters (73%) reported that none or only
a few of their close family and friends had quit smoking.
Only about 5% reported that most or all of their close
family members and friends had quit smoking.
Close family members and friends that have quit smoking
None 24%
A few 49%
Some 18%
Most 5%
All <1%
Don’t Know/Not Sure 4%
All respondents were asked, “In the past 30 days, has
anyone offered you a cigarette, not for ceremonial or
spiritual reasons?” Current smokers were also asked: “In
the past 30 days have you offered anyone else a cigarette,
not for ceremonial or spiritual reasons?” Response
options were: Yes or No.
Results: Most current smokers had both offered a
cigarette to someone else (72%) and been offered a
cigarette (68%) in the past 30 days. One-quarter of former
and non-smokers (25%) had been offered a cigarette in the
past 30 days.
Current Smokers
% Yes
Former &
Non-smokers % Yes
In the past 30 days has
anyone offered you a
cigarette?
68% 25%
In the past 30 days have you
offered anyone a cigarette? 72% N/A
Current smokers were asked, “Recently new cigarette taxes
have been added. What effects, if any, did the recent
price increase have on your smoking? Helped you think
about quitting, Helped you cut down on cigarettes, or
Helped you make a quit attempt.”
Results: The price increases on cigarettes had an effect
on a large number of current smokers. Over half (54%) said
the price increase made them think about quitting. Over
half (51%) said they cut down as a result and over one-third
(34%) said the price made them think about quitting.
What effect did recent price increases have on your
smoking?
Current Smokers
% Yes
Helped you think about quitting? 54%
Helped you cut down on cigarettes? 51%
Helped you make a quit attempt? 34%
Non-smokers (Former and Never) were asked, “Recently,
new cigarette taxes have been added. Did this price
increase help you stay smoke-free?” Response options
were: Yes or No.
Results: Forty-five percent of former and non-smokers
reported that the price increase helped them stay smoke
free.

28
Did recent price increase help you stay smoke-free? Former &
Non-smokers
Yes 45%
No 41%
Don’t Know/Not Sure 13%
All respondents were asked, “In the past 30 days, have you
had at least one drink of any alcoholic beverage such as
beer, wine, or liquor?” Response options were: Yes or No.
Results: Close to two-thirds of former and non-smokers
(63%) had NOT had a drink of alcohol in the past 30 days.
Just under half of current smokers (45%) had NOT had a
drink in the past 30 days.
In the past 30 days have you had least
one drink of an alcoholic beverage?
Current
Smokers
Former &
Non-smokers
Yes 55% 37%
Current smokers that had at least one drink of alcohol in
the past 30 days were asked, “In the past 30 days, would
you say you were… More likely to smoke while drinking,
More likely to smoke while not drinking, or It doesn’t
matter.”
Results: Of the current smokers who reported drinking
alcohol within the past 30 days, 60% said they were more
likely to smoke while drinking. Thirty-five percent reported
that drinking alcohol did not affect their likelihood to
smoke.
Employed respondents were asked, “During the past 30
days, how often did you feel a high level of stress due to
problems at work?” Response options were: None of the
time, A little of the time, Some of the time, Most of the
time, or All of the time.
All respondents were asked, “During the past 30 days,
how often did you feel a high level of stress due to
problems outside of work?” Response options were: None
of the time, A little of the time, Some of the time, Most of
the time, or All of the time.
Results: Fifteen percent of employed individuals
reported feeling a high level of stress all or most of the time
due to problems at work. Half (54%) felt a high level of
stress a little or some of the time, and 29% reported never
feeling a high level of stress due to work.
Nineteen percent of all participants reported high stress all
or most of the time from problems outside of work. Over
one-half (51%) reported high stress a little or some of the
time, and 28% reported never feeling a high level of stress
due to problems outside of work.
During the past 30 days, how often did you
feel a high level of stress due to problems…
At Work*
Outside of
Work*
All or most of the time 15% 19%
A little or some of the time 54% 51%
None of the time 29% 28%
Don’t Know/Not Sure 1% 2%
*Questions not asked on one reservation.
B. RISK PERCEPTIONS
Respondents were asked, “Do you believe there is any
harm in smoking an occasional cigarette?” Response
options were: Yes or No.
Results: Almost three-quarters (73%) believe there is
some harm in smoking an occasional cigarette.
Do you believe there is harm is smoking an occasional
cigarette?
Yes 73%
No 21%
Don’t Know/Not Sure 5%
Respondents were asked, “In your opinion, are any of the
following products less harmful, more harmful or just as
harmful as smoking regular cigarettes? Smokeless
tobacco? Light cigarettes? Menthol cigarettes? Natural
cigarettes (no additives)? Roll your own cigarettes?”
Response options for each question were: Less harmful,
More harmful, or Just as harmful as regular cigarettes.
Results: Most respondents believed that all commercial
tobacco products were just as harmful as, or more harmful
than, smoking regular cigarettes. Three-fourths of
respondents (76%) believed that light cigarettes are as
harmful as regular cigarettes. Over half felt that natural
cigarettes (61%), roll-your-own cigarettes (63%), and
smokeless tobacco (56%) were as harmful as regular
cigarettes. One-third (32%) believed that menthol cigarettes
were more harmful than regular cigarettes, and one-quarter
(24%) believed that roll-your-own cigarettes were more
harmful.
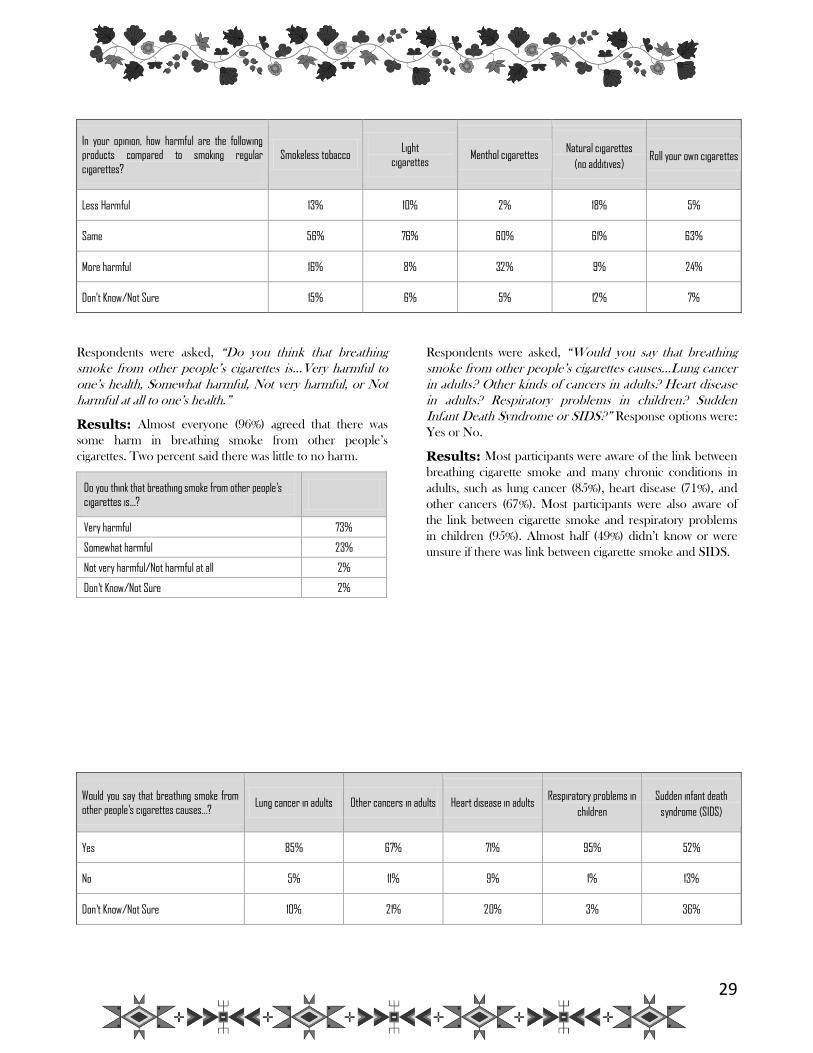
29
In your opinion, how harmful are the following products compared to smoking regular
cigarettes?
Smokeless tobacco Light
cigarettes Menthol cigarettes
Natural cigarettes
(no additives) Roll your own cigarettes
Less Harmful 13% 10% 2% 18% 5%
Same 56% 76% 60% 61% 63%
More harmful 16% 8% 32% 9% 24%
Don't Know/Not Sure 15% 6% 5% 12% 7%
Respondents were asked, “Do you think that breathing
smoke from other people’s cigarettes is…Very harmful to
one’s health, Somewhat harmful, Not very harmful, or Not
harmful at all to one’s health.”
Results: Almost everyone (96%) agreed that there was
some harm in breathing smoke from other people’s
cigarettes. Two percent said there was little to no harm.
Do you think that breathing smoke from other people’s
cigarettes is…?
Very harmful 73%
Somewhat harmful 23%
Not very harmful/Not harmful at all 2%
Don’t Know/Not Sure 2%
Respondents were asked, “Would you say that breathing
smoke from other people’s cigarettes causes…Lung cancer
in adults? Other kinds of cancers in adults? Heart disease
in adults? Respiratory problems in children? Sudden
Infant Death Syndrome or SIDS?” Response options were:
Yes or No.
Results: Most participants were aware of the link between
breathing cigarette smoke and many chronic conditions in
adults, such as lung cancer (85%), heart disease (71%), and
other cancers (67%). Most participants were also aware of
the link between cigarette smoke and respiratory problems
in children (95%). Almost half (49%) didn’t know or were
unsure if there was link between cigarette smoke and SIDS.
Would you say that breathing smoke from
other people’s cigarettes causes…? Lung cancer in adults Other cancers in adults Heart disease in adults
Respiratory problems in
children
Sudden infant death
syndrome (SIDS)
Yes 85% 67% 71% 95% 52%
No 5% 11% 9% 1% 13%
Don’t Know/Not Sure 10% 21% 20% 3% 36%
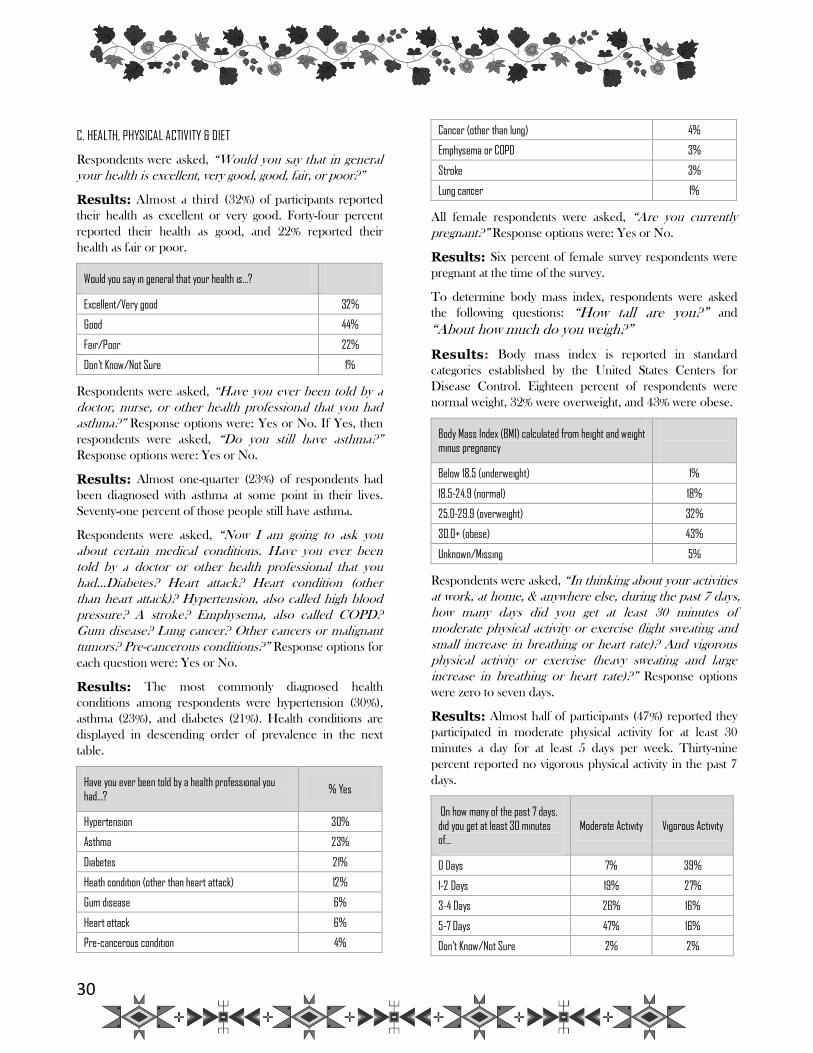
30
C. HEALTH, PHYSICAL ACTIVITY & DIET
Respondents were asked, “Would you say that in general
your health is excellent, very good, good, fair, or poor?”
Results: Almost a third (32%) of participants reported
their health as excellent or very good. Forty-four percent
reported their health as good, and 22% reported their
health as fair or poor.
Would you say in general that your health is…?
Excellent/Very good 32%
Good 44%
Fair/Poor 22%
Don’t Know/Not Sure 1%
Respondents were asked, “Have you ever been told by a
doctor, nurse, or other health professional that you had
asthma?” Response options were: Yes or No. If Yes, then
respondents were asked, “Do you still have asthma?”
Response options were: Yes or No.
Results: Almost one-quarter (23%) of respondents had
been diagnosed with asthma at some point in their lives.
Seventy-one percent of those people still have asthma.
Respondents were asked, “Now I am going to ask you
about certain medical conditions. Have you ever been
told by a doctor or other health professional that you
had…Diabetes? Heart attack? Heart condition (other
than heart attack)? Hypertension, also called high blood
pressure? A stroke? Emphysema, also called COPD?
Gum disease? Lung cancer? Other cancers or malignant
tumors? Pre-cancerous conditions?” Response options for
each question were: Yes or No.
Results: The most commonly diagnosed health
conditions among respondents were hypertension (30%),
asthma (23%), and diabetes (21%). Health conditions are
displayed in descending order of prevalence in the next
table.
Have you ever been told by a health professional you
had…? % Yes
Hypertension 30%
Asthma 23%
Diabetes 21%
Heath condition (other than heart attack) 12%
Gum disease 6%
Heart attack 6%
Pre-cancerous condition 4%
Cancer (other than lung) 4%
Emphysema or COPD 3%
Stroke 3%
Lung cancer 1%
All female respondents were asked, “Are you currently
pregnant?” Response options were: Yes or No.
Results: Six percent of female survey respondents were
pregnant at the time of the survey.
To determine body mass index, respondents were asked
the following questions: “How tall are you?” and “About how much do you weigh?”
Results: Body mass index is reported in standard
categories established by the United States Centers for
Disease Control. Eighteen percent of respondents were
normal weight, 32% were overweight, and 43% were obese.
Body Mass Index (BMI) calculated from height and weight minus pregnancy
Below 18.5 (underweight) 1%
18.5-24.9 (normal) 18%
25.0-29.9 (overweight) 32%
30.0+ (obese) 43%
Unknown/Missing 5%
Respondents were asked, “In thinking about your activities
at work, at home, & anywhere else, during the past 7 days,
how many days did you get at least 30 minutes of
moderate physical activity or exercise (light sweating and
small increase in breathing or heart rate)? And vigorous
physical activity or exercise (heavy sweating and large
increase in breathing or heart rate)?” Response options
were zero to seven days.
Results: Almost half of participants (47%) reported they
participated in moderate physical activity for at least 30
minutes a day for at least 5 days per week. Thirty-nine
percent reported no vigorous physical activity in the past 7
days.
On how many of the past 7 days,
did you get at least 30 minutes
of...
Moderate Activity Vigorous Activity
0 Days 7% 39%
1-2 Days 19% 27%
3-4 Days 26% 16%
5-7 Days 47% 16%
Don’t Know/Not Sure 2% 2%
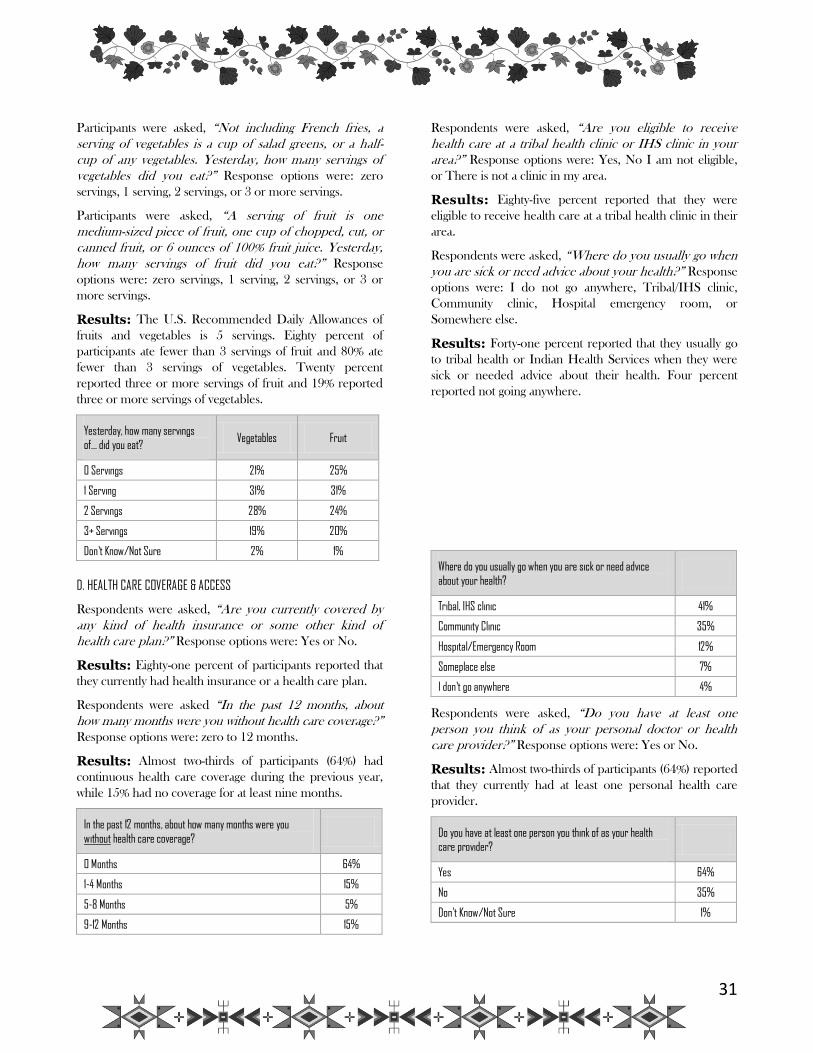
31
Participants were asked, “Not including French fries, a
serving of vegetables is a cup of salad greens, or a half-
cup of any vegetables. Yesterday, how many servings of
vegetables did you eat?” Response options were: zero
servings, 1 serving, 2 servings, or 3 or more servings.
Participants were asked, “A serving of fruit is one
medium-sized piece of fruit, one cup of chopped, cut, or
canned fruit, or 6 ounces of 100% fruit juice. Yesterday,
how many servings of fruit did you eat?” Response
options were: zero servings, 1 serving, 2 servings, or 3 or
more servings.
Results: The U.S. Recommended Daily Allowances of
fruits and vegetables is 5 servings. Eighty percent of
participants ate fewer than 3 servings of fruit and 80% ate
fewer than 3 servings of vegetables. Twenty percent
reported three or more servings of fruit and 19% reported
three or more servings of vegetables.
Yesterday, how many servings
of… did you eat? Vegetables Fruit
0 Servings 21% 25%
1 Serving 31% 31%
2 Servings 28% 24%
3+ Servings 19% 20%
Don’t Know/Not Sure 2% 1%
D. HEALTH CARE COVERAGE & ACCESS
Respondents were asked, “Are you currently covered by
any kind of health insurance or some other kind of
health care plan?” Response options were: Yes or No.
Results: Eighty-one percent of participants reported that
they currently had health insurance or a health care plan.
Respondents were asked “In the past 12 months, about
how many months were you without health care coverage?”
Response options were: zero to 12 months.
Results: Almost two-thirds of participants (64%) had
continuous health care coverage during the previous year,
while 15% had no coverage for at least nine months.
In the past 12 months, about how many months were you
without health care coverage?
0 Months 64%
1-4 Months 15%
5-8 Months 5%
9-12 Months 15%
Respondents were asked, “Are you eligible to receive
health care at a tribal health clinic or IHS clinic in your
area?” Response options were: Yes, No I am not eligible,
or There is not a clinic in my area.
Results: Eighty-five percent reported that they were
eligible to receive health care at a tribal health clinic in their
area.
Respondents were asked, “Where do you usually go when
you are sick or need advice about your health?” Response
options were: I do not go anywhere, Tribal/IHS clinic,
Community clinic, Hospital emergency room, or
Somewhere else.
Results: Forty-one percent reported that they usually go
to tribal health or Indian Health Services when they were
sick or needed advice about their health. Four percent
reported not going anywhere.
Where do you usually go when you are sick or need advice
about your health?
Tribal, IHS clinic 41%
Community Clinic 35%
Hospital/Emergency Room 12%
Someplace else 7%
I don’t go anywhere 4%
Respondents were asked, “Do you have at least one
person you think of as your personal doctor or health
care provider?” Response options were: Yes or No.
Results: Almost two-thirds of participants (64%) reported
that they currently had at least one personal health care
provider.
Do you have at least one person you think of as your health care provider?
Yes 64%
No 35%
Don’t Know/Not Sure 1%
32
Miigwetch to community members across the state who completed this survey.
Without your contribution, this report could not be written.
33
REFERENCES 1 Deloria V, Jr, Lytle CM. American Indians, American Justice. University of Texas
Press, Austin, 1983.
2 Tobacco Use Targeting the Nation’s Leading Killer: At a Glance. CDC, National Center for Chronic Disease Prevention and Health Promotion, 2009.
3 State of Lung Disease in Diverse Communities. American Lung Association, 2007.
4 Prevalence of Heart Disease—United States, 2005. CDC MMWR, 55(6): 113-118, 2007.
5 Minnesota Cancer Facts and Figures 2009. American Cancer Society, January 2009.
6 US Department of Health and Human Services. The Health Consequences of Smoking: A Report of the Surgeon General. Atlanta, Georgia: U.S. Department of Health and
Human Services, Centers for Disease Control and Prevention, National Center for
Chronic Disease Prevention and Health Promotion, Office of Smoking and Health, 2004.
7 McCusker, D. Tobacco Use Among American Indian/Alaska Native Youth in Wisconsin.
Wisconsin Medical Journal, 100(3): 40-2, 2001.
8 Eichner JE et al. Tobacco Use Among American Indians in Oklahoma: An
Epidemiologic View. Public Health Reports, 120: 192-199, 2005.
9 Beauvais F et al. Prevalence of American Indian Adolescent Tobacco Use: 1993-2004.
Substance Use and Misuse, 42(4): 591-601, 2007.
10 Caraballo et al. Tobacco Use Among Racial and Ethnic Population Subgroups of Adolescents in the United States. Preventing Chronic Diseases, 3(2): A39, 2006.
11 Cigarette Smoking Among Adults-United States, 2007. MMWR, 57(45): 1221-1226,
2008.
12 Forster et al. Patterns of Tobacco Use in a Sample of American Indians in
Minneapolis-St. Paul. Nicotine and Tobacco Research, 9(1): S29-S37, 2006.
13 Forster et al Cigarette Smoking Among American Indian Youth in Minneapolis-St.
Paul. American Journal of Preventative Medicine, 35 (6 Suppl): S449-56, 2008.
14 Bea Comparison of Drug Use Rates for Reservation Indian, Non-Reservation Indian
and Anglo Youth. American Indian & Alaska Native Mental Health Research, 5(1): 13-31.
1992.
15 Gilliland FD, Mahler R, Davis SM. Non-Ceremonial Tobacco Use Among Southwestern Rural American Indians: the New Mexico Indian Behavioural Risk Factor Survey.
Tobacco Control, 7: 156-160, 1998.
16 Rith-Najarian SJ et al. Regional Variation in Cardiovascular Disease Risk Factors
Among American Indians and Alaska Natives with Diabetes. Diabetes Care, 25(2): 279-
83, 2002.
17 Denny CH, Holtzman D, Cobb N. Surveillance for Health Behaviors of American
Indians and Alaska Natives: Findings from the Behavioral Risk Factor Surveillance
System, 1997-2000. MMWR Surveillance Summaries, 52(SS-1): 1-13, 2003.
18 Hodge L and Struthers R. Persistent Smoking Among Northern Plains Indians:
Lenient Attitudes, Low Harm Value, and Partiality Toward Cigarette Smoking. Journal of Cultural Diversity, 13(4): 181-185, 2006.
19 Yu M, Stiffman AR, Freedenthal S. Factors Affecting American Indian Adolescent
Tobacco Use. Addictive Behaviors, 30: 889-904, 2005.
20 Tobacco Use in Minnesota: 2010 Update. Minneapolis, MN: ClearWay Minnesota and
Minnesota Department of Health; February 2011.
21 U.S. EPA Respiratory Health Effects of Passive Smoking (Also Known as Exposure to
Secondhand Smoke or Environmental Tobacco Smoke ETS). U.S. Environmental
Protection Agency. Office of Research and Development, Office of Health and
Environmental Assessment, Washington DC, EPA/600/6-9/006F, 1992.
22 How tobacco smoke causes disease: the biology and behavioral basis for smoking-attributable disease: a report of the Surgeon General. – Rockville, MD:
Dept. of Health and Human Services, Public Health Service, Office of Surgeon
General, 2010.
23 Israel BA, Schultz KT, Murphy CJ. Review of Community-Based Research: Assessing
Partnership Approaches to Improve Public Health. Annual Review of Public Health, 19:
173-202, 1998.
24 Leung MW, Yen IH, Minkler M. Community Based Participatory Research: A
Promising Approach for Increasing Epidemiology’s Relevance in the 21st Century.
International Journal of Epidemiology, 33(3): 499-506, 2004.
25 Poupart J, Martinez C. To Build a Bridge: An Introduction to Working with American
Indian Communities, St. Paul, MN, American Indian Policy Center, 2000.
26 Poupart J, Baker L. Research with American Indian Communities: The Value of
Authentic Partnerships. Children and Youth Services Review, 31: 1180-1186, 2009.