Embed Size (px)
Citation preview

Population Profile of Scheduled Tribes in Orissa132
1. Location (Major) : Malkangiri, Koraput, Nowrangapur, Bolangir
2. Language : Parji (Dravidian)
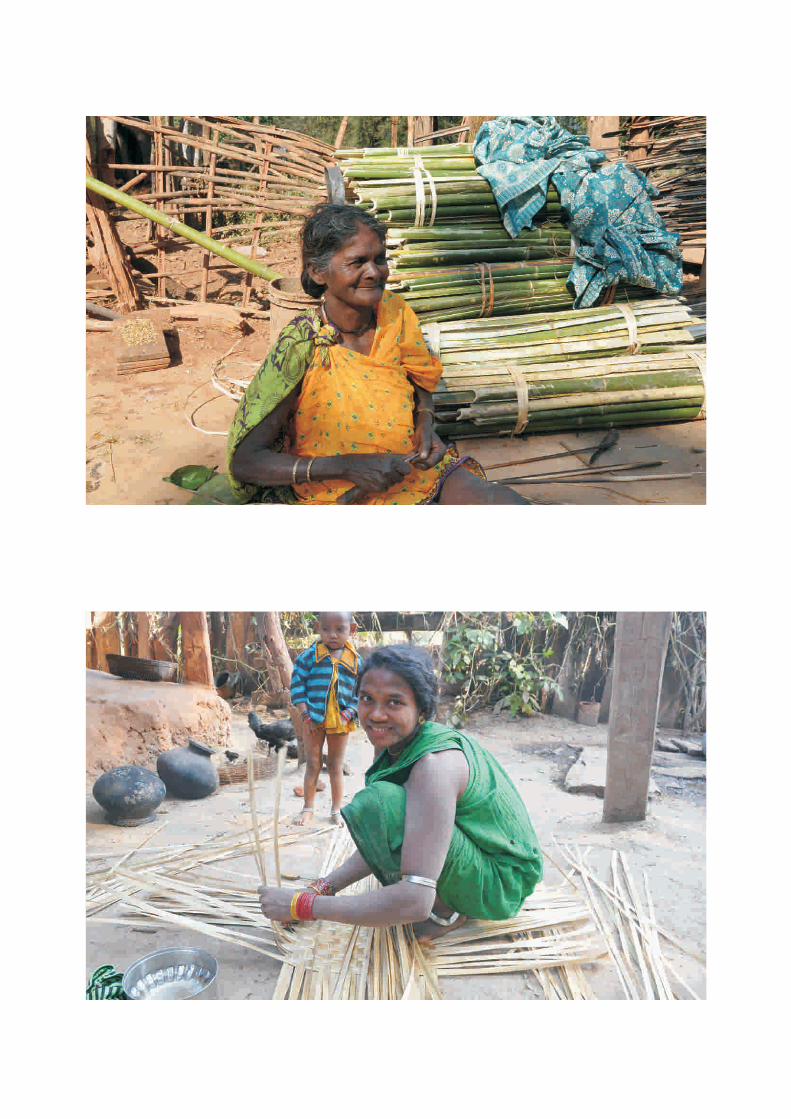
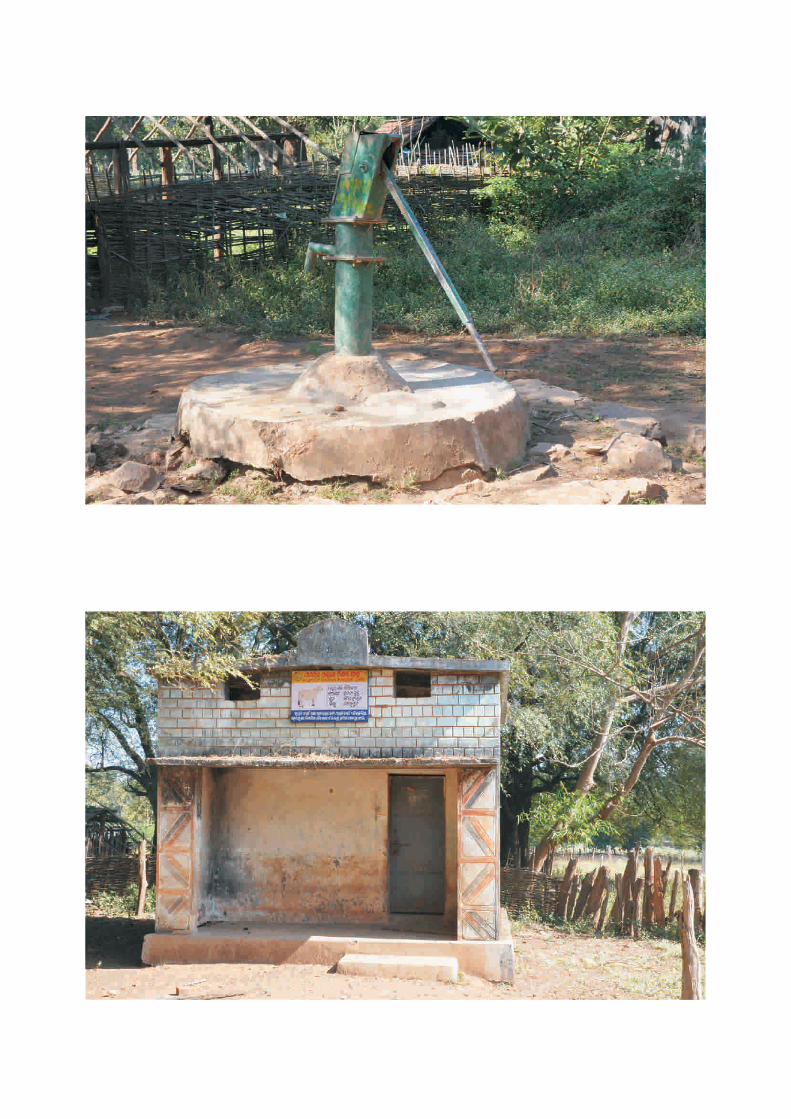
3. Major Occupation : Cultivation, Forest Collection, Basketry & Agrl. Labour
4. Major Festivals & Rituals : Lendi Panda, Ghiapanda, Goesendia Hia,
5. Religion : Autonomous Tribal Religion
6. Other Distinct Socio-Cultural Features :
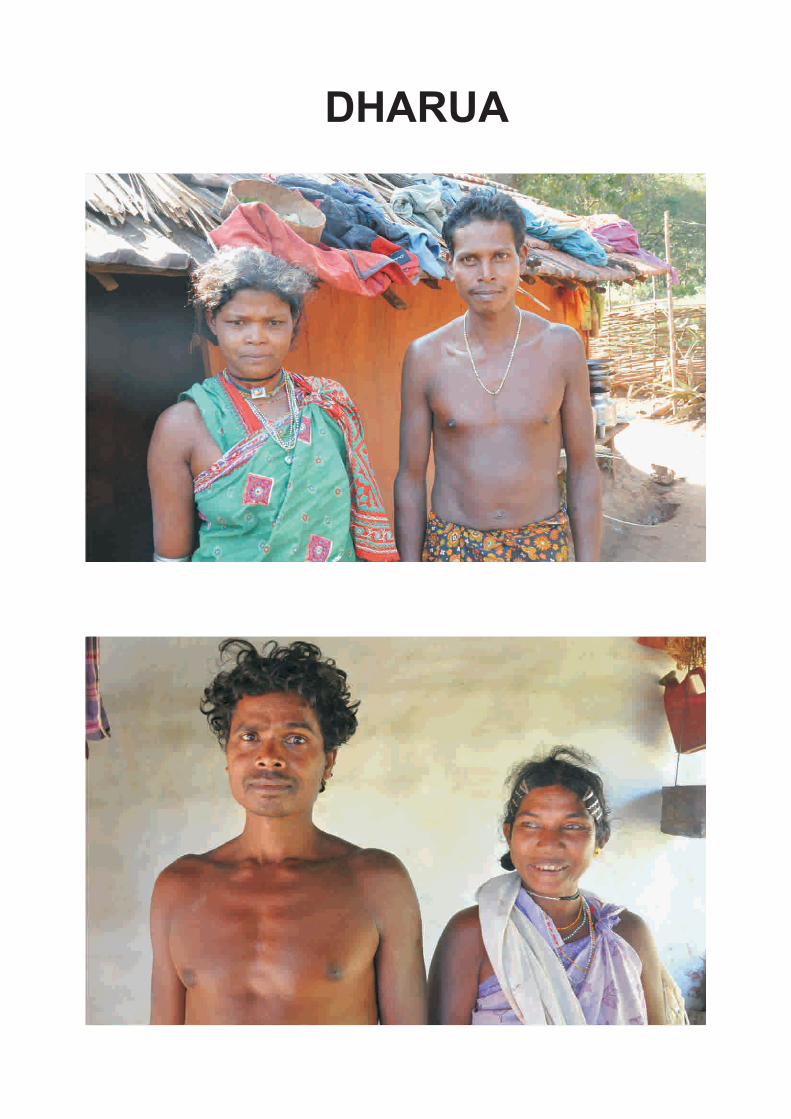
The Dharua is one of the Gondid tribe and otherwise referred to as Dharua Gonds. The tribe is
divided into clans and sub-clans. Each subclan, vansa, is named after a mythological Rishi who
is represented by a totemic animal following the Hindu Puranic traditions. Dharua practise arranged
marriage. They perform sindurdan, the ritual of marrying to a mango tree. In the past, the saying
goes, the tribesmen served as warriors to the kings. They believe in the existence of ancestral
spirits, ghosts and witches. They appease the supernatural agencies by offering food and animal
sacrifices. The Dharua cremate the dead and observe death pollution for three days.
7. Selected Demographic Profile and Parameters :
DHARUA
Sl.No. Parameters Census Year1961 1971 1981 1991 2001 2011
1 Population Total 7210 8791 8612 11512 9247 18151Male 3570 4177 4301 6367 4688 8875Female 3640 4614 4311 5145 4559 9276
2 Decadal Growth Rate 21.93 - 2.05 33.69 19.67 96.293 Sex Ratio 1020 1105 1003 808 972 10454 Literacy Rate Total 4.70 5.00 6.10 7.27 19.60 31.39
Male 8.54 8.38 10.06 11.24 27.84 40.51Female 0.91 0.46 2.13 2.47 11.18 22.75
5 Workers Total Workers Total 3809 2917 4262 6558 4809 9825Male 2488 2613 2696 4006 2757 5125Female 1321 304 1566 2552 2052 4700
Main Workers - - 3471 4941 2831 4062Marginal Workers - - 791 1617 1978 5763

Population Profile of Scheduled Tribes in Orissa 133
* Child Population for 1961 & 1971=0-14 yrs, For 1981 = 0-4 yrs, For 1991 & 2001 = 0-6 yrs** Working Age Group Population for 1961 & 1971=15-44 yrs, For 1981, 1991 & 2001=15-59 yrs
DISTRICTWISE DISTRIBUTION OF POPULATION (1961 - 2011)
Source : Census of India ' 1961, 1971, 1981, 1991, 2001 & 2011
6 WPR 52.83 33.18 49.49 56.97 52.01 54.137 Martial Status Never Married 3787 4425 4245 5483 4448 -
Married 2900 3910 3939 5381 4267 -Widow 483 406 394 589 449 -Divorced or Separated 40 47 29 59 83 -Un-specified - 3 5 - - -
8 Dependency Ratio 1.83 : 1 1.39 : 1 0.85 : 1 0.68 : 1 0.75 : 1 -9 * Child Population Population 3572 4068 1217 2467 1640 3490
Ratio to Total Population 0.50 : 1 0.46 : 1 0.14 : 1 0.21 : 1 0.18 : 1 0.19:110 ** Population in the working age group 2544 3682 4648 6838 5287 -
Sl.No. Name of the Old & New District YEAR1961 1971 1981 1991 2001 2011
1 2 3 4 5 6 7 8 91 Balasore Balasore 01 655 169 20 146 342 Bhadrak - - - - - 03 Bolangir Bolangir 882 489 117 263 433 1214 Sonepur - - - - 85 195 Cuttack Cuttack 96 01 139 352 158 276 Jagatsinghpur - - - - 40 67 Jajpur - - - - - 48 Kendrapara - - - - - 09 Dhenkanal Dhenkanal 77 - 02 16 02 010 Anugul - - - - 40 1111 Ganjam Ganjam - - 02 27 41 3212 Gajapati - - 01 4213 Kalahandi Kalahandi 549 369 215 97 149 2414 Nuapara - - - - 124 24315 Keonjhar Keonjhar - 03 09 - 02 1016 Koraput Koraput 4888 6318 7190 10209 638 843217 Malakangiri - - - - 6029 812818 Nowrangapur - - - - 531 57819 Rayagada - - - - 04 4020 Mayurbhanj Mayurbhanj 533 841 495 371 151 12421 Phulbani Kandhamal - - 42 51 56 522 Boudh - - - - - 023 Puri Puri - - - 02 - 2724 Khurda - - - - 76 1425 Nayagarh - - - - - 026 Sambalpur Sambalpur 83 103 173 74 158 3227 Baragarh - - - - 140 6928 Deogarh - - - - 52 029 Jharsuguda - - - - 86 11930 Sundergarh Sundergarh 101 12 59 30 105 40
Total 7210 8791 8612 11512 9247 18151
DHARUA