Embed Size (px)
Citation preview

Triangulation supports agricultural spread of theTranseurasian languagesMartine Robbeets ( [email protected] )
Max Planck Institute for the Science of Human History https://orcid.org/0000-0002-2860-0230Remco Bouckaert
Department of Computer Science, University of Auckland https://orcid.org/0000-0001-6765-3813Matthew Conte
Department of Archaeology and Art History, Seoul National University,Alexander Savelyev
Institute of Linguistics, Russian Academy of SciencesTao Li
Department of Archaeology, College of History, Wuhan UniversityDeog-Im An
Department of Conservation of Cultural Heritage, Hanseo University,Kenichi Shinoda
National Museum of Nature and ScienceYinqiu Cui
School of Life Sciences, Jilin University https://orcid.org/0000-0003-3702-5773Takamune Kawashima
Hiroshima University MuseumGeonyoung Kim
Department of Archaeology and Art History, Seoul National UniversityJunzo Uchiyama
Sainsbury Institute for the Study of Japanese Arts and CulturesJoanna Dolińska
Max Planck Institute for the Science of Human HistorySo�a Oskolskaya
Institute for Linguistic Studies, Russian Academy of Sciences,Ken-Yōjiro Yamano
Research Center for Buried Cultural Properties, Kumamoto UniversityNoriko Seguchi
Faculty of Social and Cultural Studies, Kyushu University https://orcid.org/0000-0003-0461-6075Hirotaka Tomita
Graduate School of Integrated Sciences of Global Society, Kyushu UniversityHiroto Takamiya

Research Center for the Paci�c Islands, Kagoshima University, ,Hideaki Kanzawa-Kiriyama
National Museum of Nature and ScienceHiroki Oota
Kitasato University School of MedicineHajime Ishida
Graduate School of Medicine, University of the Ryukyus,Ryosuke Kimura
Graduate School of Medicine, University of the RyukyusTakehiro Sato
Department of Bioinformatics and Genomics, Graduate School of Medical Sciences, KanazawaUniversityJae-Hyun Kim
Department of Archaeology and Art History, Donga UniversityRasmus Bjørn
Max Planck Institute for the Science of Human HistoryBingcong Deng
Max Planck Institute for the Science of Human HistorySeongha Rhee
Hanguk University of Foreign StudiesKyou-Dong Ahn
Hanguk University of Foreign StudiesIlya Gruntov
Institute of Linguistics, Russian Academy of Sciences,Olga Mazo
National Research University Higher School of Economics,John Bentley
Department of World Languages and Cultures, Northern Illinois UniversityRicardo Fernandes
Max Planck Institute for the Science of Human HistoryPatrick Roberts
Max Planck Institute for the Science of Human History https://orcid.org/0000-0002-4403-7548Ilona Bausch
Leiden University Institute of Area Studies,Linda Gilaizeau
Max Planck Institute for the Science of Human HistoryMinoru Yoneda
The University of Tokyo https://orcid.org/0000-0003-0129-8921Mitsugu Kugai

Miyakojima City Board of Education, Miyako Island,Raffaela Bianco
Department of Archaeogenetics (DAG), Max-Planck Institute for the Science of Human History (MPI-SHH), JenaFan Zhang
School of Life Sciences, Jilin UniversityMarie Himmel
Max Planck Institute for the Science of Human History,Johannes Krause
Department of Archaeogenetics (DAG), Max-Planck Institute for the Science of Human History (MPI-SHH), Jena https://orcid.org/0000-0001-9144-3920Mark Hudson
Max Planck Institute for the Science of Human History https://orcid.org/0000-0002-9483-9303Chao Ning
Max Planck Institute for the Science of Human History
Biological Sciences - Article
Keywords: Transeurasian languages, agriculture, Early Neolithic
Posted Date: July 15th, 2021
DOI: https://doi.org/10.21203/rs.3.rs-255765/v1
License: This work is licensed under a Creative Commons Attribution 4.0 International License. Read Full License
Version of Record: A version of this preprint was published at Nature on November 10th, 2021. See thepublished version at https://doi.org/10.1038/s41586-021-04108-8.

Triangulation supports agricultural spread of the Transeurasian languages 1
Martine Robbeets1*, Remco Bouckaert1,2, Matthew Conte6, Alexander Savelyev3,1, Tao Li7,1, 2
Deog-Im An 31, Ken-ichi Shinoda11, Yinqiu Cui18,19, Takamune Kawashima8, Geonyoung 3
Kim6, Junzo Uchiyama9,10, Joanna Dolińska1, Sofia Oskolskaya4,1, Ken-Yōjiro Yamano17, 4
Noriko Seguchi12,13, Hirotaka Tomita14,15, Hiroto Takamiya16, Hideaki Kanzawa-Kiriyama11, 5
Hiroki Oota20, Hajime Ishida22, Ryosuke Kimura22, Takehiro Sato21, Jae-Hyun Kim32, 6
Bingcong Deng1, Rasmus Bjørn1, Seongha Rhee5, Kyou-Dong Ahn5, Ilya Gruntov3,30, Olga 7
Mazo30,3, John R. Bentley23, Ricardo Fernandes1,34,35, Patrick Roberts1, Ilona Bausch26,27,28, 8
Linda Gilaizeau1, Minoru Yoneda25, Mitsugu Kugai33, Raffaela A. Bianco1, Fan Zhang18, 9
Marie Himmel1, Johannes Krause1, Mark J. Hudson1,24*, Ning Chao1,29 * 10
*corresponding authors 11
1 Max Planck Institute for the Science of Human History, Jena, Germany 12 2 Centre of Computational Evolution, University of Auckland, Auckland, New Zealand 13 3 Institute of Linguistics, Russian Academy of Sciences, Moscow, Russia 14 4 Institute for Linguistic Studies, Russian Academy of Sciences, Saint Petersburg, Russia 15 5 Hanguk University of Foreign Studies, Seoul, South Korea 16 6 Department of Archaeology and Art History, Seoul National University, Seoul, South Korea 17 7 Department of Archaeology, Wuhan University, Wuhan, China 18 8 Hiroshima University Museum, Higashi-Hiroshima, Japan 19 9 Sainsbury Institute for the Study of Japanese Arts and Cultures, Norwich, UK 20 10 Center for Cultural Resource Studies, Kanazawa University, Japan 21 11 National Museum of Nature and Science, Department of Anthropology, Tsukuba, Japan 22 12 Department of Environmental Changes, Faculty of Social and Cultural Studies, Kyushu University, Fukuoka, 23 Japan 24 13 Department of Anthropology, The University of Montana, Missoula, MT, USA 25 14 Hokkaido Government Board of Education, Sapporo, Japan 26 15 Graduate School of Integrated Sciences of Global Society, Kyushu University, Fukuoka, Japan 27 16 Research Center for the Pacific Islands, Kagoshima University, Kagoshima, Japan 28 17 Research Center for Buried Cultural Properties, Kumamoto University, Japan 29 18 School of Life Sciences, Jilin University, China 30 19 Center for Chinese Frontier Archaeology, Jilin University, China 31 20 Department of Biological Sciences, Graduate School of Science, The University of Tokyo, Tokyo, Japan 32 21 Department of Bioinformatics and Genomics, Graduate School of Medical Sciences, Kanazawa University, 33 Kanazawa, Japan 34 22 Graduate School of Medicine, University of the Ryukyus, Nishihara, Japan 35 23 Department of World Languages and Cultures, Northern Illinois University, USA 36 24 Institut d’Asie Orientale, ENS de Lyon, France 37 25 University Museum, University of Tokyo, Japan 38 26 Leiden University Institute of Area Studies, Netherlands 39 27 Sainsbury Institute for the Study of Japanese Arts and Cultures, Norwich, UK 40 28 Kokugakuin University Museum, Tokyo, Japan 41 29 School of Archaeology and Museology, Peking University, Beijing, China 42 30 National Research University Higher School of Economics, Moscow, Russia 43 31 Department of Conservation of Cultural Heritage, Hanseo University, Seosan, Korea 44 32 Department of Archaeology and Art History, Donga University, Korea 45 33 Miyakojima City Board of Education, Miyako Island, Okinawa, Japan 46 34 School of Archaeology, University of Oxford, Oxford, UK. 47 35 Faculty of Arts, Masaryk University, Brno, Czech Republic. 48 49 50
51
52
53

The origin and early dispersal of speakers of Transeurasian languages, i.e., Japanese, 54
Korean, Tungusic, Mongolic and Turkic, is among the most disputed issues of Eurasian 55
population history. A key problem is the relationship between linguistic dispersals, 56
agricultural expansions and population movements. Here we address this question 57
through ‘triangulating’ genetics, archaeology and linguistics in a unified perspective. 58
We report new, wide-ranging datasets from these disciplines, including the most 59
comprehensive Transeurasian agropastoral and basic vocabulary presented to date, an 60
archaeological database of 255 Neolithic and Bronze Age sites from Northeast Asia, and 61
the first collection of ancient genomes from Korea, the Ryukyu islands and early cereal 62
farmers in Japan, complementing previously published genomes from East Asia. 63
Challenging the traditional ‘Pastoralist Hypothesis’, we show that the common ancestry 64
and primary dispersals of Transeurasian languages can be traced back to the first 65
farmers moving across Northeast Asia from the Early Neolithic onwards, but that this 66
shared heritage has been masked by extensive cultural interaction since the Bronze Age. 67
As well as marking significant progress in the three individual disciplines, by combining 68
their converging evidence, we show that the early spread of Transeurasian speakers was 69
driven by agriculture. 70
71
Introduction 72
Recent breakthroughs in ancient DNA sequencing have made us rethink the connections 73
between human, linguistic and cultural expansions across Eurasia. Compared to western 74
Eurasia1,2,3,4, however, the dynamics in eastern Eurasia remain poorly understood. Northeast 75
Asia, the vast region encompassing Inner Mongolia, the Yellow, Liao and Amur River basins, 76
the Russian Far East, the Korean peninsula and the Japanese Islands, remains especially 77
under-represented in the recent literature. With a few exceptions that are heavily focused on 78
genetics5,6,7,8, truly interdisciplinary approaches to Northeast Asia are scarce. 79
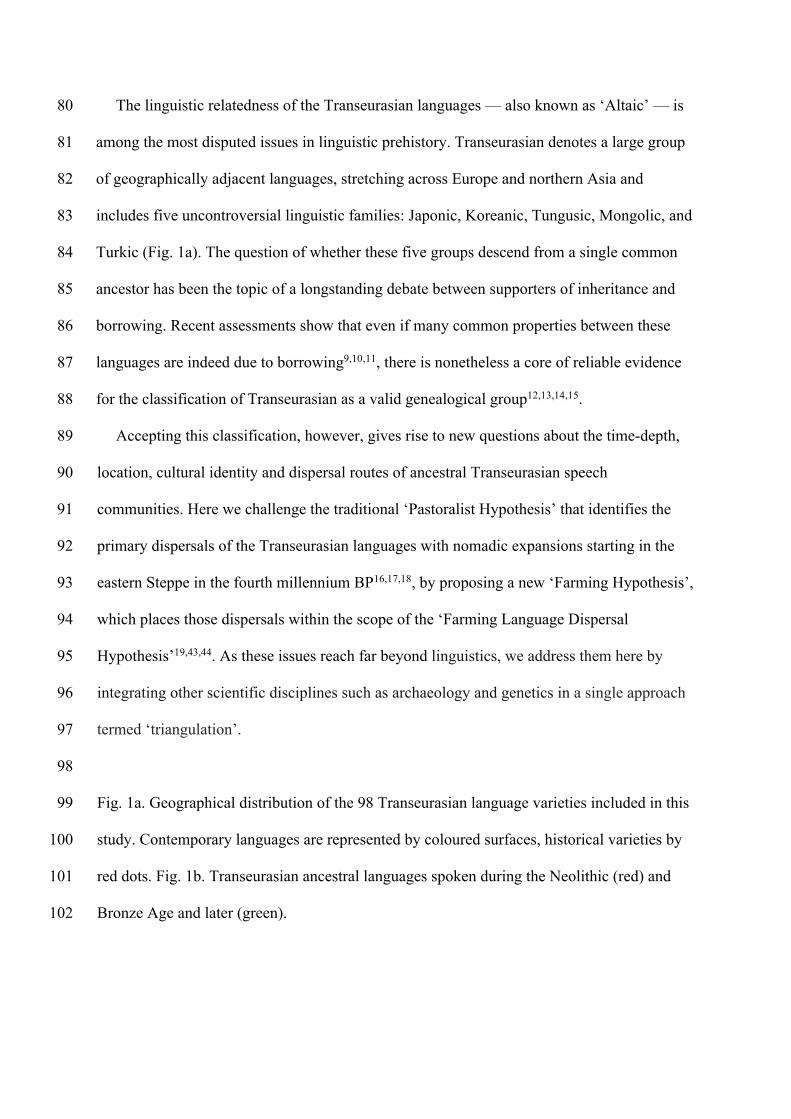
The linguistic relatedness of the Transeurasian languages — also known as ‘Altaic’ — is 80
among the most disputed issues in linguistic prehistory. Transeurasian denotes a large group 81
of geographically adjacent languages, stretching across Europe and northern Asia and 82
includes five uncontroversial linguistic families: Japonic, Koreanic, Tungusic, Mongolic, and 83
Turkic (Fig. 1a). The question of whether these five groups descend from a single common 84
ancestor has been the topic of a longstanding debate between supporters of inheritance and 85
borrowing. Recent assessments show that even if many common properties between these 86
languages are indeed due to borrowing9,10,11, there is nonetheless a core of reliable evidence 87
for the classification of Transeurasian as a valid genealogical group12,13,14,15. 88
Accepting this classification, however, gives rise to new questions about the time-depth, 89
location, cultural identity and dispersal routes of ancestral Transeurasian speech 90
communities. Here we challenge the traditional ‘Pastoralist Hypothesis’ that identifies the 91
primary dispersals of the Transeurasian languages with nomadic expansions starting in the 92
eastern Steppe in the fourth millennium BP16,17,18, by proposing a new ‘Farming Hypothesis’, 93
which places those dispersals within the scope of the ‘Farming Language Dispersal 94
Hypothesis’19,43,44. As these issues reach far beyond linguistics, we address them here by 95
integrating other scientific disciplines such as archaeology and genetics in a single approach 96
termed ‘triangulation’. 97
98
Fig. 1a. Geographical distribution of the 98 Transeurasian language varieties included in this 99
study. Contemporary languages are represented by coloured surfaces, historical varieties by 100
red dots. Fig. 1b. Transeurasian ancestral languages spoken during the Neolithic (red) and 101
Bronze Age and later (green). 102

103
104
105

Linguistics 106
We collected a new dataset of 3193 datapoints representing 254 basic vocabulary concepts 107
for 98 Transeurasian languages, including dialects and historical varieties (SI 1). We applied 108
Bayesian methods to infer a dated phylogeny of the Transeurasian languages (Extended data 109
Fig. 1). Our results indicate a time-depth of 9181 BP (5595 -12793 95%HPD) for the Proto-110
Transeurasian root of the family, 6811 BP (4404-10166 95%HPD) for Proto-Altaic, the unity 111
of Turkic, Mongolic and Tungusic languages, 4491 BP (2599-6373 95%HPD) for Mongolo-112
Tungusic, and 5458 BP (3335-8024 95%HPD) for Japano-Koreanic (Fig. 1b). These dates 113
estimate the time depth of the break-up of a given language family into its subfamilies. 114
We used our lexical dataset to model the expansion of Transeurasian languages in space 115
(SI 3 and 4). As classical methods such as lexicostatistics, the diversity hotspot principle and 116
cultural reconstruction can be impressionistic5,12,13,20, we applied Bayesian phylogeography 117
for the first time to complement previous approaches. 118
In contrast to previously proposed homelands, which range from the Altai16,17,18 to the 119
Yellow River21 to the Greater Khingan Mountains22 to the Amur basin23, we find support for 120
a Transeurasian origin in the West Liao River region in the Early Neolithic. After a primary 121
break-up of the family in the Neolithic, further dispersals took place in the Bronze Age. The 122
ancestor of the Mongolic languages expanded northwards to the Mongolian Plateau, Proto-123
Turkic moved westwards over the Eastern Steppe and the other branches moved eastwards: 124
Proto-Tungusic to the Amur-Ussuri-Khanka region, Proto-Koreanic to the Korean Peninsula 125
and Proto-Japonic over Korea to the Japanese Islands (Fig. 1b). 126
Through a qualitative analysis, examining agropastoral words revealed in the 127
reconstructed vocabulary of the proto-languages (SI 5), we further identified items that are 128
culturally diagnostic for ancestral speech communities in a particular region at a particular 129
time. Common ancestral languages that separated in the Neolithic, such as Proto-130
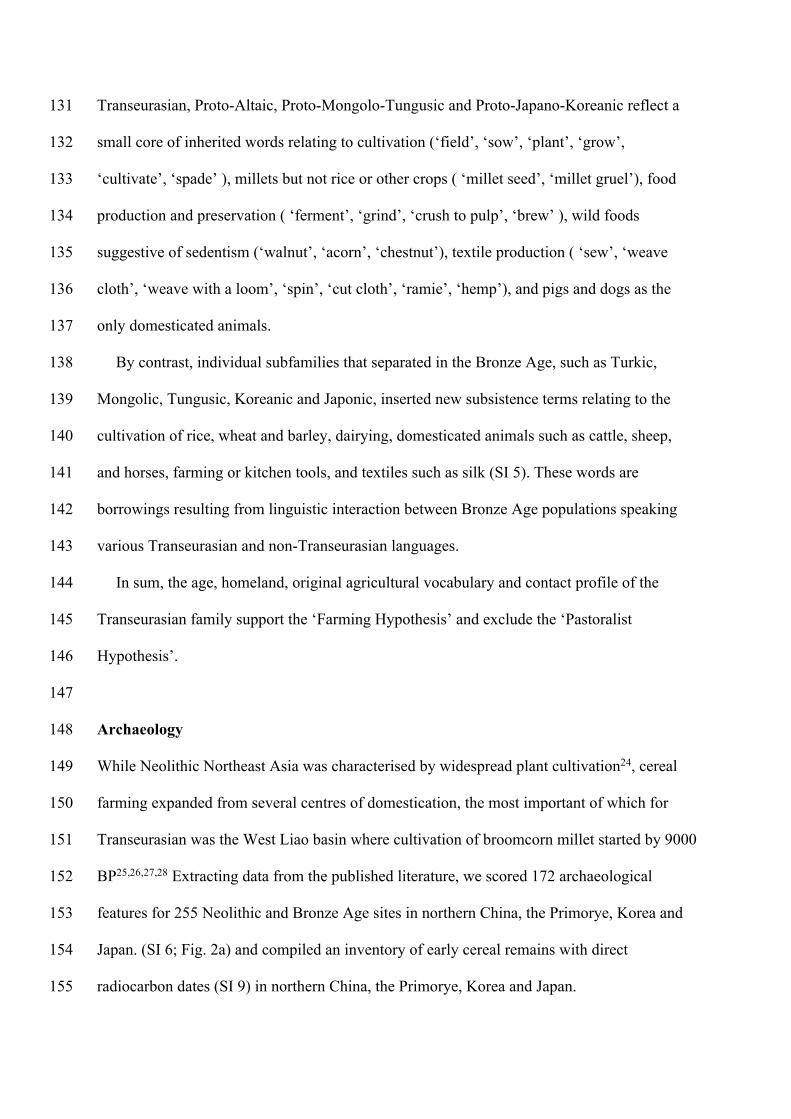
Transeurasian, Proto-Altaic, Proto-Mongolo-Tungusic and Proto-Japano-Koreanic reflect a 131
small core of inherited words relating to cultivation (‘field’, ‘sow’, ‘plant’, ‘grow’, 132
‘cultivate’, ‘spade’ ), millets but not rice or other crops ( ‘millet seed’, ‘millet gruel’), food 133
production and preservation ( ‘ferment’, ‘grind’, ‘crush to pulp’, ‘brew’ ), wild foods 134
suggestive of sedentism (‘walnut’, ‘acorn’, ‘chestnut’), textile production ( ‘sew’, ‘weave 135
cloth’, ‘weave with a loom’, ‘spin’, ‘cut cloth’, ‘ramie’, ‘hemp’), and pigs and dogs as the 136
only domesticated animals. 137
By contrast, individual subfamilies that separated in the Bronze Age, such as Turkic, 138
Mongolic, Tungusic, Koreanic and Japonic, inserted new subsistence terms relating to the 139
cultivation of rice, wheat and barley, dairying, domesticated animals such as cattle, sheep, 140
and horses, farming or kitchen tools, and textiles such as silk (SI 5). These words are 141
borrowings resulting from linguistic interaction between Bronze Age populations speaking 142
various Transeurasian and non-Transeurasian languages. 143
In sum, the age, homeland, original agricultural vocabulary and contact profile of the 144
Transeurasian family support the ‘Farming Hypothesis’ and exclude the ‘Pastoralist 145
Hypothesis’. 146
147
Archaeology 148
While Neolithic Northeast Asia was characterised by widespread plant cultivation24, cereal 149
farming expanded from several centres of domestication, the most important of which for 150
Transeurasian was the West Liao basin where cultivation of broomcorn millet started by 9000 151
BP25,26,27,28 Extracting data from the published literature, we scored 172 archaeological 152
features for 255 Neolithic and Bronze Age sites in northern China, the Primorye, Korea and 153
Japan. (SI 6; Fig. 2a) and compiled an inventory of early cereal remains with direct 154
radiocarbon dates (SI 9) in northern China, the Primorye, Korea and Japan. 155

The main results of our Bayesian analysis (Extended data Fig. 2), which clusters the 255 156
sites according to cultural similarity are visualized in Fig. 2b. We find a cluster of Neolithic 157
cultures in the West Liao basin, from which two branches associated with millet farming 158
separate, a Korean Chulmun branch and a branch of Neolithic cultures covering the Amur, 159
Primorye and Liaodong. This confirms earlier findings about the dispersal of millet 160
agriculture to Korea by 5500 BP and via the Amur to the Primorye by 5000 BP.29,30 161
Our analysis further clusters Bronze Age sites in the West Liao area with Mumun sites in 162
Korea and Yayoi sites in Japan. This mirrors how during the fourth millennium BP, the 163
agricultural package of the Liaodong-Shandong area was supplemented with rice and wheat. 164
These crops were transmitted to the Korean Peninsula by the Early Bronze Age (3300-2800 165
BP) and from there to Japan after 3000 BP (Fig. 2b). 166
While population movements were not linked with monothetic archaeological cultures, 167
Neolithic farming expansions in Northeast Asia were associated with some diagnostic 168
features, such as stone tools33 and textile technology (SI 7).31 Domesticated animals and 169
dairying played an important role in the spread of the Neolithic in western Eurasia but, except 170
for dogs and pigs, our database shows little evidence for animal domestication in Northeast 171
Asia before the Bronze Age (SI 6). The link between agriculture and population migrations is 172
especially clear from similarities between ceramics, stone tools, and domestic and burial 173
architecture between Korea and western Japan32. 174
Building on previous studies, we provided an overview of demographic changes 175
associated with the introduction of millet farming across the regions in our study (Extended 176
data Fig. 3). Having invested in elaborate paddy fields, wet rice farmers tended to stay in one 177
place, absorbing population growth through extra labour, while millet farmers typically 178
adopted a more expansionary settlement pattern.33 Neolithic population densities increased 179

across Northeast Asia prior to a Late Neolithic population crash.34,35 The Bronze Age then 180
saw exponential population increases in China, Korea and Japan. 181
182
Fig. 2a Spatiotemporal distribution of sites included in the archaeological database. 2b 183
Clustering of investigated sites according to cultural similarity in line with Bayesian analysis 184
in Extended data Fig. 2, with indication of the spread of millet and rice in time and space. 185
The distribution of archaeological sites in Fig. 2 is smaller than that of contemporary 186
languages in Fig. 1 because we focus on the early dispersal of the linguistic subgroups in the 187
Neolithic and Bronze Age and on the links between the eastward spread of farming and 188
language dispersal. 189
190
191
Genetics 192
We report genomic analyses of 23 authenticated individuals from the Amur, Korea, Kyushu 193
and the Ryukyus and combined them with published genomes covering the Eastern Steppe, 194
West Liao, Amur and Yellow River regions, Liaodong, Shandong, the Primorye and Japan 195
between 9500 and 300 BP (Fig. 3a; Extended data Fig. 4; SI 11; SI 17). We projected them 196
onto a principal component analysis (PCA) of 149 present-day Eurasian populations and 45 197

East Asian populations (Extended data Fig. 5, 6, 7, 8). Fig. 3b models our key ancient 198
populations as an admixture of five genetic components, whereby Jalainur represents Amur, 199
Yangshao the Yellow River and Rokutsu the Jomon genome while Hongshan and Upper 200
Xiajiadian are composed of Yellow River and Amur genomes (qpAdm admixture of various 201
East Asian genetic components in SI 16). 202
Contemporary Tungusic as well as Nivkh speakers in the Amur form a tight cluster 203
(Extended data Fig. 5). Neolithic hunter-gatherers from Baikal, Primorye and the 204
southeastern Steppe as well as farmers from the West Liao and Amur all project within this 205
cluster (Extended data Fig. 7). Newly-sampled Late Neolithic Angangxi farmers (SI 12) show 206
a high proportion of Amur-like ancestry, while West Liao Neolithic millet farmers show a 207
considerable proportion of Amur-like ancestry with a gradual shift towards the Yellow River 208
genome over time (Extended data Fig. 7, Fig. 3b).6 Amur-like ancestry thus likely represents 209
the original genetic profile of Neolithic hunter-gatherers covering Baikal, Amur, Primorye, 210
the southeastern Steppe and West Liao, continuing in the early farmers from this region. 211
The PCA (Extended data Fig. 7) shows a general trend for Neolithic individuals from 212
Mongolia to harbour high Amur-like ancestry with extensive gene flow from western Eurasia 213
increasing from the Bronze to Middle Ages.36 While the Turkic-speaking Xiongnu,37 Old 214
Uyghur and Türk are extremely scattered, the Mongolic-speaking38 Iron Age Xianbei fall 215
closer to the Amur cluster than the Shiwei, Rouran, Khitan and Middle Mongolian Khanate 216
from Antiquity and the Middle Ages. 217
As Amur-related ancestry can be traced back to speakers of Japanese and Korean, it 218
appears to be the original genetic component common to all speakers of Transeurasian 219
languages. By analysing the first ancient genomes from Korea (SI 12), we find that Jomon 220
ancestry was prevalent on the Peninsula by 6000 BP (Fig. 3b; SI 13). Our PCA (Extended 221

data Fig. 8) shows that all ancient Koreans and Japanese fall on a cline between Jomon and 222
ancient mainland East Asians. 223
Neolithic Ando, Yŏndaedo and Changhang can be modeled as an admixture of Jomon 224
with a high proportion of Hongshan ancestry, while Yokchido on the southern coast of Korea 225
harbours nearly 95% Jomon ancestry. Taejungni can only be modelled as an admixture of 226
Jomon with Upper Xiajiadian ancestry, suggesting another wave of eastward gene-flow into 227
Korea in the Bronze Age (SI 16). We therefore associate the spread of farming to Korea with 228
two waves of Amur and Yellow River gene-flow, modelled by Hongshan for the Neolithic 229
introduction of millet farming and by Upper Xiajiadian for the Bronze Age addition of rice 230
agriculture. 231
Analysing the genomes from Yayoi farmers (SI 12), we found that, like Taejungni, they 232
can be modelled as indigenous Jomon ancestry admixed with Bronze Age Upper Xiajiadian 233
ancestry. Our results support massive migration from Korea into Japan in the Bronze Age. 234
The Nagabaka genomes from Miyako Island (SI 12) represent the first ancient genome-235
wide data from the Ryukyus. Contrary to previous findings that Holocene populations 236
reached the southern Ryukyus from Taiwan or the Philippines39, our results unexpectedly 237
suggest the prehistoric Nagabaka population originated in Jomon cultures to the north 238
(Extended data Fig. 8). The genetic turn-over from Jomon- to Yayoi-like ancestry before the 239
early modern period mirrors the late arrival of agriculture and Ryukyan languages in this 240
region. 241
242
Fig. 3a Ancient genomes located in time and space. (For detailed legend, see Extended data 243
Fig. 4.) Fig. 3b Admixture modelling of the ancient populations from this study and other key 244
populations. 245

246
247
248
Discussion: Triangulation 249
Triangulation of linguistic, archaeological and genetic evidence shows that the origins of the 250
Transeurasian languages can be traced back to the beginning of millet cultivation and the 251
early Amur gene pool in Neolithic Northeast Asia. The spread of these languages involved 252
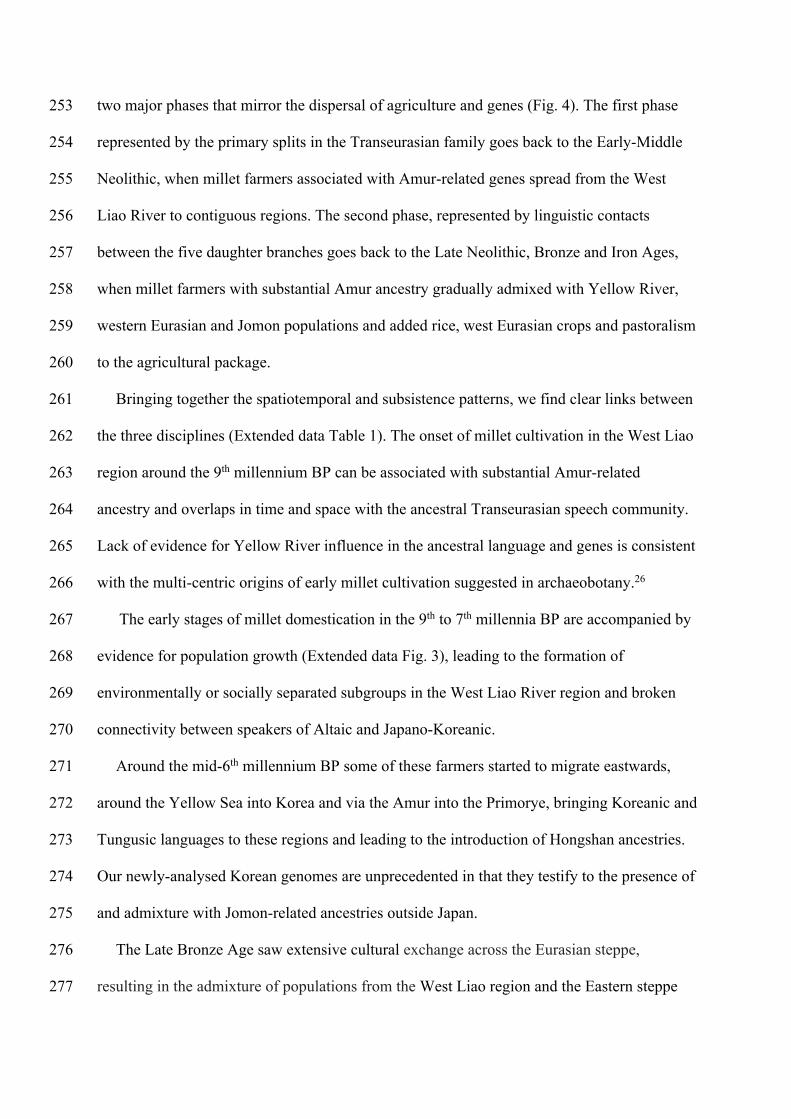
two major phases that mirror the dispersal of agriculture and genes (Fig. 4). The first phase 253
represented by the primary splits in the Transeurasian family goes back to the Early-Middle 254
Neolithic, when millet farmers associated with Amur-related genes spread from the West 255
Liao River to contiguous regions. The second phase, represented by linguistic contacts 256
between the five daughter branches goes back to the Late Neolithic, Bronze and Iron Ages, 257
when millet farmers with substantial Amur ancestry gradually admixed with Yellow River, 258
western Eurasian and Jomon populations and added rice, west Eurasian crops and pastoralism 259
to the agricultural package. 260
Bringing together the spatiotemporal and subsistence patterns, we find clear links between 261
the three disciplines (Extended data Table 1). The onset of millet cultivation in the West Liao 262
region around the 9th millennium BP can be associated with substantial Amur-related 263
ancestry and overlaps in time and space with the ancestral Transeurasian speech community. 264
Lack of evidence for Yellow River influence in the ancestral language and genes is consistent 265
with the multi-centric origins of early millet cultivation suggested in archaeobotany.26 266
The early stages of millet domestication in the 9th to 7th millennia BP are accompanied by 267
evidence for population growth (Extended data Fig. 3), leading to the formation of 268
environmentally or socially separated subgroups in the West Liao River region and broken 269
connectivity between speakers of Altaic and Japano-Koreanic. 270
Around the mid-6th millennium BP some of these farmers started to migrate eastwards, 271
around the Yellow Sea into Korea and via the Amur into the Primorye, bringing Koreanic and 272
Tungusic languages to these regions and leading to the introduction of Hongshan ancestries. 273
Our newly-analysed Korean genomes are unprecedented in that they testify to the presence of 274
and admixture with Jomon-related ancestries outside Japan. 275
The Late Bronze Age saw extensive cultural exchange across the Eurasian steppe, 276
resulting in the admixture of populations from the West Liao region and the Eastern steppe 277

with western Eurasian genetic lineages. Linguistically, this interaction is mirrored in the 278
borrowing of agropastoral vocabulary by Proto-Mongolic and Proto-Turkic speakers, 279
especially relating to wheat and barley cultivation, herding, dairying and horse exploitation. 280
Around 3300 BP farmers from the Liaodong-Shandong area migrated to the Korean 281
peninsula, adding rice, barley and wheat to millet agriculture. This migration aligns with the 282
observed Upper Xiajiadian component in our Bronze Age sample from Korea and is reflected 283
in early borrowings between Japonic and Koreanic languages. 284
In the 3rd millennium BP this agricultural package was transmitted to Kyushu, triggering a 285
transition from small- to full-scale farming, a genetic turn-over from Jomon to Yayoi ancestry 286
and a linguistic shift to Japonic. By adding unique samples from Nagabaka in the southern 287
Ryukyus, we traced the Farming/Language dispersal to the edge of the Transeurasian world. 288
Demonstrating that Jomon ancestry stretched as far south as Miyako Island, our results 289
contradict previous assumptions of a northward expansion by Austronesian populations from 290
Taiwan. Together with the Jomon profile discovered at Yokchido in Korea, our results show 291
that Jomon genomes and material culture did not always overlap. 292
While previous research on the Farming/Language Dispersal hypothesis regarded the 293
Transeurasian zone as beyond the area of agriculture40,41, our research shows that it remains 294
an important model for understanding Eurasian population dispersals. Triangulation of 295
linguistics, archaeology and genetics resolves the competition between the ‘Pastoralist’ and 296
‘Farming’ hypotheses and concludes that the early spread of Transeurasian speakers was 297
driven by agriculture. 298
299
300
301
Fig 4. Integration of linguistic, agricultural and genetic expansions in Northeast Asia. 302

303
304 305
306
References 307
1 Damgaard, P., Martiniano, R., Kamm, J., et al. The first horse herders and the impact of
early bronze age steppe expansions into Asia. Science 360, 6396, eaar7711,
https://doi.org/10.1126/science.aar7711 (2018).
2 Haak, W., Lazaridis, I., Patterson, N., et al. Massive migration from the steppe was a source
for Indo-European languages in Europe. Nature 522 (7555), 207–211,
https://doi.org/10.1038/nature14317 (2015).
3 Allentoft, M., Sikora, M., Sjögren, K., et al. Population genomics of Bronze Age Eurasia.
Nature 522 (7555), 167–172, https://doi.org/10.1038/nature14507 (2015).
4 Ning, C., Wang, C. C., Gao, S., et al. Ancient genomes reveal Yamnaya related ancestry
and a potential source of Indo-European Speakers in Iron Age Tianshan. Curr. Biol. 29 (15),
2526–2532, https://doi.org/10.1016/j.cub.2019.06.044 (2019).

5 Mallory, J., Dybo, A., & Balanovsky, O. The impact of genetics research on archaeology
and linguistics in Eurasia. Russ. J. Genet. 55 (12), 1472–1487 (2019).
6 Ning, C., Li, T., Wang, K., et al. Ancient genomes from northern China suggest links
between subsistence changes and human migration. Nat. Comm. 11, 2700 (2020).
7 Wang, C. C., Yeh, H. Y., Popov, A. N. et al. The genomic formation of human populations
in East Asia. bioRxiv. preprint at https://doi.org/10.1101/2020.03.25.004606 (2020).
8 Yang, M. A., Fan X., Sun B., et al. Ancient DNA indicates human population shifts and
admixture in northern and southern China. Science (2020) doi:10.1126/science.aba0909.
9 Francis-Ratte, A. & Unger, J. M. in The Oxford Guide to the Transeurasian Languages
(Robbeets, M. & Savelyev, A.) 705–714 (Oxford Univ. Press, 2020).
10 Anderson, G. in The Oxford Guide to the Transeurasian Languages (ed Robbeets, M. &
Savelyev, A.) 715–725 (Oxford Univ. Press, 2020).
11 Vajda, E. in The Oxford Guide to the Transeurasian Languages (eds Robbeets, M. &
Savelyev, A.) 726–734 (Oxford Univ. Press, 2020).
12 Starostin, S., Dybo, A. & Mudrak, O. Etymological Dictionary of the Altaic Languages, I–
III (Brill, 2003).
13 Blažek, V. Altaic Languages. History of Research, Survey, Classification and a Sketch of
Comparative Grammar (Masaryk Univ. Press, 2019).
14 Robbeets, M. Is Japanese related to Korean, Tungusic, Mongolic and Turkic? (Turcologica
64.) (Harrassowitz, 2005).
15 Robbeets, M. Diachrony of Verb Morphology: Japanese and the Transeurasian languages.
(Trends in Linguistics Studies and Monographs 291.) (Mouton-De Gruyter, 2015).
16 Menges, Karl. Dravidian and Altaic. Anthropos 72: 129-179 (1977).
17 Miller, Roy Andrew. Archaeological light on Japanese linguistic origins. Asian Pac.
Quart. Soc. Cult. Affairs 22, 1-26 (1990).
18 Dybo, Anna. Language and archeology: some methodological problems. 1. Indo-European
and Altaic landscapes. J. Lang. Relation. 9, 69–92 (2013).
19 Bellwood, P. & Renfrew, C. (eds) Examining the farming/language dispersal hypothesis
(Cambridge: McDonald Institute for Archaeological Research, 2002).
20 Robbeets, M. in The Oxford Guide to the Transeurasian Languages (eds Robbeets, M. &
Savelyev, A.) 772–783 (Oxford Univ. Press),
https://doi.org/10.1093/oso/9780198804628.003.0045 (2020).
21 Starostin, S. in Past Human Migrations in East Asia: Matching Archaeology,

Linguistics and Genetics (eds Sanchez-Mazas, A., Blench, R., Ross, M. D., et al.) 254–262
(Routledge, 2008).
22 Ramstedt, G. J. A Comparison of the Altaic Languages with Japanese. Trans. Asiatic Soc.
Japan. (Second Ser.) 7, 41–54 (1924).
23 Kæmpfer, E. De Beschryving van Japan, benevens eene Beschryving van het Koningryk
Siam (Balthasar Lakeman, 1729).
24 Crawford, G.W. in Handbook of East and Southeast Asian Archaeology (eds Habu, J.,
Lape, P.V. & Olsen, J.W.) 421-435 (Springer, 2018).
25 Stevens, C. & Fuller, D. The spread of agriculture in eastern Asia: archaeological bases for
hypothetical farmer/language dispersals. Lang. Dyn. Chang. 7, 152-186 (2017).
26 Leipe, C., Long, T., Sergusheva E.A. et al. Discontinuous spread of millet agriculture in
eastern Asia and prehistoric population dynamics. Sci. Adv. 5, eaax6225 (2019).
27 Stevens, C., Shelach-Lavi, G., Zhang, H., et al. A model for the domestication of Panicum
miliaceum (common, proso or broomcorn millet) in China. Veg. Hist. Archaeobot. (2020)
https://doi.org/10.1007/s00334-020-00804-z
28 Shelach-Lavi, G., Teng, M., Goldsmith, Y. et al Sedentism and plant cultivation in
northeast China emerged during affluent conditions. PLoS ONE 14, e0218751. (2019)
29 Lee, G.A. in Handbook of East and Southeast Asian Archaeology (eds Habu, J., Lape, P. &
Olsen, J.) 451–481(Springer, 2017).
30 Li, T., Ning, C., Zhushchikhovskaya, I. S., et al. Millet agriculture dispersed from
Northeast China to the Russian Far East: integrating archaeology, genetics and linguistics.
Archaeol. Res. Asia 22, 100177 (2020).
31 Nelson, S.M., Zhushchikhovskaya, I. S, Li, Tao, et al. Tracing population movements in
ancient East Asia through the linguistics and archaeology of textile production. Evol. Hum.
Sci. 2, e5 (2020).
32 Hudson, M.J. Ruins of Identity: Ethnogenesis in the Japanese Islands (Univ. Hawai‘i Press,
1999).
33 Qin, L. & Fuller D.Q in Prehistoric Maritime Cultures and Seafaring (eds Wu, C. &
Rolett, B.) 159-191 (Springer, 2019).
34 Hosner, D., Wagner, M., Tarasov, et al. Spatiotemporal distribution patterns of
archaeological sites in China during the Neolithic and Bronze Age: an overview. Holocene
26, 1576-1593 (2016).
35 Hudson, M.J. & Robbeets, M. Archaeolinguistic evidence for the farming/language
dispersal of Koreanic. Evol. Hum. Sci. 2, e52 (2020).

36 Jeong, C., Wang, K., Wilkin, S., et al. A Dynamic 6,000-Year Genetic History of Eurasia’s
Eastern Steppe. Cell 183, 890-904 (2020) https://doi.org/10.1016/j.cell.2020.10.015
37 Savelyev, A. & Jeong, C. Early nomads of the Eastern Steppe and their tentative
connections in the West. Evol. Human Sci. 2, e20 (2020). doi:10.1017/ehs.2020.18
38 Janhunen, J. in The Mongolic languages (ed Janhunen, J.) 1–29 (Routledge, 2003).
39 Hudson, M.J. in New Perspectives in Southeast Asian and Pacific Prehistory (ed Piper, P.,
H. Matsumura, H. & Bulbeck, D.) 189-199 (Canberra: ANU Press, 2017).
40 Bellwood, P. First Farmers: The Origins of Agricultural Societies (Blackwell, 2005).
41 Heggarty, P. & Beresford-Jones, D. in Encyclopedia of Global Archaeology (ed Smith, C.)
1–9 (Springer, 2014).

Methods 1
1. Linguistics 2
1.1. Bayesian Phylogenetics 3
Combining dictionary search with fieldwork, we collected a comparative dataset including 4
3193 datapoints representing 254 basic vocabulary concepts for 98 Transeurasian languages, 5
including contemporary and historical varieties (SI 1). These concepts are based on a merger 6
of the Leipzig-Jakarta 200 list1 and the Jena 200 list (SI 2). The Turkic and Tungusic basic 7
vocabulary included is based on a revision of recently published datasets.2,3 Cognate coding 8
is supported by an inventory of basic vocabulary etymologies and sound correspondences 9
across the Transeurasian languages presented in SI 2. 10
We performed a Bayesian phylogenetic analysis with cognates encoded as binary data.4 11
Since the data were collected such that at least one cognate was present, the data were 12
ascertained to not contain any sites having all zeros. Ascertainment correction was applied to 13
cater for this.3 14
We considered the following substitution models, which govern the evolutionary process 15
of cognates along branches of a tree: continuous time Markov chain (CTMC), which assumes 16
a constant rate of mutations, covarion, which assumes a slow and fast rate and the model 17
switching between these two states, and the pseudo Dollo covarion model, which is based on 18
the Dollo principle that a cognate can only appear once, but can be lost many times. A 19
detailed description of the CTMC and covarion models3 and of the pseudo Dollo covarion 20
model5 is available in the literature. For all models, we assume each meaning class has its 21
own relative rate to capture the variation between rates of evolution of different words. 22
Though language evolves on average at a constant rate, we find that there can be 23
considerable variation in rates between branches on a tree.3,4 Such variation can be captured 24
using the uncorrelated relaxed clock,6 assuming rates are log-normally distributed. 25

A birth death model is used to describe the generative process of language creation. Since 26
the data contain ancient languages that may be ancestral to current languages, we allow the 27
tree to have ancestral nodes. A fossilised birth death model7, which allows such ancestral 28
nodes, is used as prior on the tree. Language family node ages were informed by age priors 29
(Japonic 150BCE +/- 175, Koreanic 1150CE +/- 175, Turkic 150BCE +/- 175, Mongolian 30
1200CE +/- 50, Tungusic 50CE +/- 275). We found that these node age priors helped reduce 31
uncertainty slightly in the root age distribution. 32
We compared the fit of different models by estimating the marginal likelihoods using 33
nested sampling8 (SI 18) and conclude that the pseudo Dollo covarion model with a relaxed 34
clock has the best fit, and covarion with relaxed clock the next best fit. Both models produce 35
compatible time estimates, though covarion estimates tend to have larger uncertainty (that is, 36
have larger 95% HPD intervals). Time estimates of the CTMC model with relaxed clock are 37
still compatible but even wider, and tend to have a higher mean. 38
All posterior estimates were performed using BEAST v2.69 using adaptive coupled 39
MCMC10. Detailed specification of the models, priors, hyperpriors and settings used to run 40
these models can be found in the BEAST XML files (SI 19). The results of our Bayesian 41
analysis are visualized as a dated phylogenetic tree of the Transeurasian languages (Extended 42
data Fig. 1). 43
44
1.2. Bayesian Phylogeography 45
We assumed that the dispersal of people through Eurasia can be described as a random walk, so is 46
best captured by diffusion on a sphere.11 In order to get an impression about the uncertainty in 47
locating origins by such model, we performed a post-hoc analysis using the posterior tree set 48
from the lexical analysis. We assigned point positions to the tips and randomly sampled trees 49
from the posterior while estimating geographical parameters through MCMC. Even in this 50
relatively restricted set-up, the uncertainty in root location does not allow us to distinguish the 51

different geographical origin hypotheses. The results of our analysis are represented on a map (SI 52
3). 53
54
1.3. Linguistic palaeontology 55
56
We compiled comparative agropastoral vocabularies for each Transeurasian subfamily, i.e., 57
Turkic (SI 5a), Mongolic (SI 5b), Tungusic (SI 5c), Koreanic (SI 5d) and Japonic (SI 5e). We 58
applied linguistic reconstruction, a procedure for inferring an unattested ancestral state of a 59
language on the evidence of data that are available from a later period, to corresponding 60
words (SI 5). 61
In order to distinguish between inherited and borrowed correspondence sets, we used 62
standard criteria based on the phonology, semantics, morphology and distribution of the word 63
involved, as specified in SI 5. Dividing our dataset into inherited versus borrowed subsistence 64
vocabulary, we determined distinctive spatiotemporal and cultural patterns for each category 65
(SI 5). 66
We applied linguistic palaeontology to our subsistence vocabulary, a historical 67
comparative method that enables us to study human prehistory by correlating our linguistic 68
reconstructions with information from archaeology about the culture of the ancient speech 69
communities that used these words. In this way, we drew inferences about the subsistence 70
strategies available to speakers of the different Transeurasian proto-languages in the 71
Neolithic and Bronze Age (SI 5) and identified a plausible location for the homeland of the 72
ancient speech communities involved (SI 4). 73
74
1.4. Diversity hotspot principle 75
In order to estimate the location of the ancient speech communities involved, we combined 76
Bayesian phylogeography and linguistic palaeontology with the diversity hotspot principle. 77

The principle is based on the assumption that the homeland is closest to where one finds the 78
greatest diversity with regard to the deepest subgroups of the language family. We located 79
these areas on the map and took them as an approximation of the area where a certain proto-80
language began to diversify (SI 4). Although this method must contend with certain 81
limitations, taken together with the other techniques for homeland location discussed here, it 82
can give us a reasonably robust estimation of the location of an ancient speech community. 83
84
2. Archaeology 85
2.1. Archaeological database 86
We scored 172 cultural traits for a total of 255 Neolithic-Bronze Age archaeological 87
sites/phases from the West Liao river basin (36), the Amur (Jilin, Heilongjiang and inland 88
Liaoning) (32), the Primorye (4), the Liaodong peninsula (37), the eastern steppes (1), the 89
Shandong peninsula (4), the Yellow River basin (2), the Korean peninsula (58) and the 90
Japanese Islands (85). Sites with several major cultural phases were scored separately. The 91
sites date from 8400-1700 BP and include the Early Neolithic to Bronze Age in northeast 92
China, the Middle Neolithic Zaisanovka culture in the Primorye, the Middle-Late Neolithic 93
Chulmun and Bronze Age Mumun cultures in Korea, and the Late Neolithic/Bronze Age 94
Final Jomon and Yayoi cultures in western Japan. Categories of cultural traits scored 95
comprised ceramics (70), stone tools (38), buildings and houses (9), plant and animal remains 96
(26), shell and bone artefacts (17), and burials (12). Definitions of scored features are found 97
in SI 6 (sheet 2) and further discussion of scoring methods can be found in SI 7. All features 98
were scored as present (1) or absent (0) following published site reports or other literature. 99
The database was used to analyse changes in the distribution of Neolithic and Bronze Age 100
artefacts over time, especially in relation to the spread of agricultural systems in Northeast 101
Asia (SI 7). 102

In addition, the cultural data in our archaeological database were analyzed using Bayesian 103
phylogenetic methods. The cultural data are encoded as a binary alignment, and we applied 104
the same substitution and clock models as for the lexical data. The pseudo Dollo model with 105
relaxed clock fits the data best (SI 20). Since the coefficient of variation of the relaxed clock 106
exceeded 1, which indicates a considerable amount of variation, we also ran the analysis with 107
the standard deviation capped at 1, which only slightly affected time estimates. 108
The large number of sampling dates and uncertainty on number of missing cultures made 109
it hard to apply the fossilised birth death prior, so we opted for the flexible Bayesian skyline 110
plot instead.12 Timing information is based on sampling dates of archaeological finds. Since 111
there is uncertainty in dating of these findings, tip dates were uniformly sampled in these 112
intervals during the MCMC. All analyses were performed in BEAST 2.68 using adaptive 113
coupled MCMC.9 Details on models, priors, hyperpriors and settings can be found in the 114
BEAST XML (SI 21). 115
In line with previous archaeological studies13,14,15, we constrained the clades ‘Xinglongwa-116
Zhabaogou-Hongshan’ and ‘Yabuli-Primorye’ to be monophyletic (SI 8). The results of our 117
Bayesian analysis are visualised as a phylogenetic tree of archaeological cultures in Northeast 118
Asia (Extended data Fig. 2) and interpreted in SI 8. 119
120
2.2 Archaeobotanical database 121
In addition to the database of archaeological features, we also compiled a list of the earliest 122
cereal remains from each region of Northeast Asia directly dated by radiocarbon (SI 9). This 123
list comprises 268 samples (China: 82; Primorye: 12; Korea: 31; Japan (excluding Ryukyus): 124
119; Ryukyu Islands: 24). Radiocarbon dates in this database were re-calibrated using OxCal 125
4.4. Our databases were further supplemented by published datasets for faunal remains16,17, 126
dolmens18, and spindle whorls19. We used kernel density mapping to plot the spread of 127

cereals in this database over time across Northeast Asia. The results are shown in SI 7 and 128
Extended data Fig.10. 129
130
3. Genetics 131
3.1. Laboratory procedures 132
Ancient DNA wet lab work, including the DNA extraction and library preparation was 133
performed in a dedicated ancient DNA clean room facility at the MPI-SHH in Germany and 134
in an ancient DNA lab at Jilin University in China following established protocols.20 A 135
double-stranded library was built with 8-mer index sequences at both P5 and P7 Illumina 136
adapters. Four individuals from China characterised in Jilin were directly shotgun sequenced 137
on the Illumina HiSeq X10 instrument in the 150-bp paired-end sequencing design to obtain 138
an adequate coverage. 54 double-stranded libraries for 33 individuals from Korea and Japan 139
were generated and characterised in the MPI-SHH either by shotgun sequencing or by in-140
solution capture at approximately 1.2 million informative nuclear SNPs. After initial 141
screening the preservation of those libraries, a further 54 single-stranded libraries were built 142
aiming at retrieving more endogenous DNA from the samples and again, those libraries were 143
directly shotgun sequenced and in-solution captured at ca. 1.2 million SNPs (SI 17) and 144
sequenced on the Illumina HiSeq 4000 platform following the manufacturer protocols. 145
146
3.2. Sequence data processing 147
Raw sequencing reads were processed by an automated workflow with the EAGER v1.92.55 148
programme.21 Illumina adapter sequences were trimmed from the sequencing data and 149
overlapping pairs were merged with AdapterRemoval 2.2.0.22 We mapped the merged reads 150
with a minimum of 30 bp to the human reference genome (hs37d5; GRCh37 with decoy 151
sequences) using BWA v0.7.12.23 We removed PCR duplicates by DeDup v0.12.2.17 To 152
minimise the impact of post-mortem DNA damage on genotyping, we masked 2 bp for non-153
UDG libraries and 10 bp for half-UDG libraries on both ends per read using the trimbam 154
function on bamUtils v1.0.13.24 The cleaned reads with both base quality (Phred-scale 155
quality) and mapping quality (Phred-scale mapping quality) over 30 were piled up by 156
SAMtools 1.319 with the mpileup function. We called pseudo-diploid genotypes using the 157
pileupCaller program [https://github.com/stschiff/sequenceTools] against SNPs in the 158
‘1240K’ panel25,26 under the random haploid calling mode. For C/T and G/A SNPs, we used 159
the masked BAM files, and for the rest we used the original unmasked BAM files. 160

161
3.3. Reference datasets 162
We compared our ancient individuals to two sets of world-wide genotype panels, one based 163
on the Affymetrix HumanOrigins Axiom Genome-wide Human Origins 1 array 164
(‘HumanOrigins’; 593,124 autosomal SNPs)27, the ‘1240k’ panel.20,28 We augmented both 165
data sets by adding the Simons Genome Diversity Panel29 and published ancient genomes (SI 166
11). 167
168
3.4. Ancient DNA authentication 169
We applied multiple criteria to confirm the authentication of the newly published ancient 170
genomes from northern China, Korea and Japan. First, we characterized the post-mortem 171
chemical modifications characteristic for ancient DNA using mapDamage v2.0.6.30 Second, 172
we estimated mitochondrial contamination rates for all individuals using Schmutzi v1.5.1.31 173
Third, we measured the nuclear genome contamination rate in males based on X chromosome 174
data as implemented in ANGSD v0.910.32 Since males have only a single copy of the X 175
chromosome, mismatches between bases, aligned to the same polymorphic position, beyond 176
the level of sequencing error are considered as evidence of contamination. 177
178
3.5. Population structure analysis 179
We performed a Principal component analysis (PCA) with the smartpca v1600033 using a set 180
of 2,077 present-day Eurasian individuals from the ‘HumanOrigins’ dataset and the ‘1240k-181
Illumina’ dataset with the option ‘lsqproject: YES’ and ‘shrinkmode: YES’. We used 182
outgroup-f3 statistics34,35 to obtain a measurement of genetic affinity between two populations 183
since their divergence from an African outgroup. We calculated f4 statistics with the ‘f4mode: 184
YES’ function in the admixtools.31 Both f3 and f4 statistics were calculated using qp3Pop v435 185
and qpDstat v755 in the admixtools package. 186
187
3.6. Genetic sexing and uniparental haplogroup assignment 188
We determined the molecular sex of our ancient samples by comparing the ratio of X and Y 189
chromosome coverages to autosomes.36 For females, we would expect an approximately even 190
ratio of X to autosome coverage and a Y ratio of 0. For males we would like to expect 191
roughly half of the coverage on X and Y than autosomes. 192
193
3.7. Admixture modeling with qpAdm 194

We modelled the ancient individuals in this study using the qpWave/qpAdm framework 195
(qpWave v410 and qpAdm v810) in the admixtools v5.1 package.22 We used the following 9 196
populations in ‘1240k’ datasets as outgroup (“OG”): Mbuti, Natufian, Onge, Iran_N, 197
Villabruna, Mixe and, Ami. This set includes an African outgroup (Mbuti), early Holocene 198
Levantine hunter-gatherers (Natufian), Andamanese islanders (Onge), early Neolithic 199
Iranians from the Tepe Ganj Dareh site (Iran_N), late Pleistocene European hunter-gatherers 200
(Villabruna), Central Native Americans (Mixe), and an indigenous group native to Taiwan 201
(Ami). 202
203
4. Triangulation 204
The term ‘triangulation’ is borrowed from a navigational technique that determines a single 205
point in space with the convergence of measurements taken from two other distinct points. 206
In qualitative research it designates a method used to capture different dimensions of the 207
same phenomenon by using evidence from three distinct scientific disciplines. To avoid 208
circularity in the argumentation, data collection, analyses and results are performed or 209
reached within the limits of each individual discipline, independently from the other two. 210
Only in the final phase of the triangulation process are the inferences drawn by the three 211
disciplines mapped on each other by comparing a number of variables describing the 212
phenomenon. The purpose of triangulation is to increase the credibility and validity of the 213
results by evaluating the extent to which the evidence from the three disciplines converges 214
and by identifying correlations, inconsistencies, uncertainties and potential biases across the 215
different perspectives on the investigated phenomena. 216
Building on previous applications of triangulation in anthropology37, we applied the 217
method to the dispersal of the Transeurasian languages, integrating linguistics, archaeology 218
and genetics to contribute to a better understanding of the phenomenon. We collected 219
different datasets and applied the variety of methods described above to draw independent 220
inferences with regard to a number of variables such as location, chronology, migratory 221
dynamics, continuity vs. diffusion, and subsistence patterns (Extended data Table 1). 222

Aligning the evidence offered by the three disciplines, we gained a more balanced and 223
richer understanding of Transeurasian migration than each of the three disciplines could 224
provide us with individually. 225
226
227
1 Haspelmath, M. & Tadmor, U. Loanwords in the World’s Languages: A Comparative
Handbook. (Mouton de Gruyter, 2009).
2 Savelyev, A. & Robbeets, M. Bayesian phylolinguistics infers the internal structure and the
time-depth of the Turkic language family. J. Lang. Evol. 1-15. doi: 10.1093/jole/lzz010
3 Oskolskaya, S., Koile, E. & Robbeets, M. A Bayesian approach to the classification of
Tungusic languages. Diachronica (2021)
4 Bouckaert, R., Bowern, C. & Atkinson, Q. D. The origin and expansion of Pama–Nyungan
languages across Australia. Nature Ecol. Evol. 2(4), 741-749 (2018).
5 Bouckaert, R. & Robbeets, M. Pseudo Dollo models for the evolution of binary characters
along a tree. BioRxiv, 207571 (2018). http://dx.doi.org/10.1101/207571
6 Drummond, A.J., Ho, S.Y., Phillips, M.J., et al. Relaxed phylogenetics and dating with
confidence. PLoS Biol. 4(5), p.e88 (2006).
7 Gavryushkina, A., Welch, D., Stadler, T., et al. Bayesian inference of sampled ancestor
trees for epidemiology and fossil calibration. PLoS Comput. Biol. 10(12), p.e1003919 (2014).
8 Maturana, P.M., Brewer, B.J., Klaere, S., et al. Model selection and parameter inference in
phylogenetics using Nested Sampling. Syst. Biol. 68(2), 219-233 (2019).
9 Bouckaert, R., Vaughan, T.G., Barido-Sottani, J., et al. BEAST 2.5: An advanced software
platform for Bayesian evolutionary analysis. PLoS Comput. Biol., 15(4), p.e1006650 (2019).
10 Mueller, N.F. & Bouckaert, R. Adaptive parallel tempering for BEAST 2. BioRxiv, 603514
(2020).
11 Bouckaert, R. Phylogeography by diffusion on a sphere: whole world phylogeography.
PeerJ, 4, e2406 (2016).
12 Drummond, A.J., Rambaut, A., Shapiro, B.E.T.H. et al. Bayesian coalescent inference of
past population dynamics from molecular sequences. Mol. Biol. Evol. 22(5), 1185-1192
(2005).
13 Shelach, G. & Teng, M. in A Companion to Chinese Archaeology (ed Underhill, A.) 37-54
(Wiley–Blackwell, 2013).

14 Miyamoto, K. The initial spread of early agriculture into Northeast Asia. Asian Archaeol.
3, 1–12 (2014).
15 Li, T., Ning, C., Zhushchikhovskaya, I.S., Hudson, M.J. & Robbeets, M. Millet agriculture
dispersed from Northeast China to the Russian Far East: integrating archaeology, genetics
and linguistics. Archaeol. Res. Asia 22, e100177 (2020).
16 Kōmoto, M. in A Study on the Environmental Change and Adaptation System in
Prehistoric Northeast Asia (ed Kōmoto, M.) 8-34 (Faculty of Letters, Kumamoto Univ.,
2007).
17 An, S. (ed), Nongŏbŭi kogohak (Seoul: Sahoep'yŏngnon, 2013).
18 Nishitani, T. (Ed.) Higashi Ajia ni okeru shisekibo no sōgōteki kenkyū (Dept. of
Archaeology, Kyushu Univ., 1997).
19 Furusawa, Y. in A Study on the Environmental Change and Adaptation System in
Prehistoric Northeast Asia (ed Kōmoto, M.) 86-109 (Faculty of Letters, Kumamoto Univ.,
2007).
20 Dabney, J., Knapp, M., Glocke, I., et al. Complete mitochondrial genome sequence of a
Middle Pleistocene cave bear reconstructed from ultrashort DNA fragments. Proc. Natl.
Acad. Sci. USA 110, 15758–15763 (2013).
21 Peltzer, A., Herbig, A. & Krause, J. EAGER: efficient ancient genome reconstruction.
Genome Biol. 17, 60 (2016).
22 Schubert, M., Lindgreen, S. & Orlando, L. AdapterRemoval v2: rapid adapter trimming,
identification, and read merging. BMC Res. Notes 9, e88 (2016).
23 Li, H., Handsaker, B. Wysoker, A. et al. The Sequence Alignment/Map format and
SAMtools. Bioinformatics 25, 2078–2079 (2009).
24 Jun, G., Wing, M. K., Abecasis, G. R., et al.. An efficient and scalable analysis framework
for variant extraction and refinement from population-scale DNA sequence data. Genome
Res. 25, 918–925 (2015).
25 Mathieson, I., Lazaridis I., Rohland, N. et al. Genome-wide patterns of selection in 230
ancient Eurasians. Nature 528, 499–503 (2015).
26 Haak, W., Lazaridis, I., Patterson, N., et al. Massive migration from the steppe was a
source for Indo-European languages in Europe. Nature 522 (7555), 207–211,
https://doi.org/10.1038/nature14317 (2015).
27 Jeong, C., Balanovsky, O., Lukianova, E. et al. The genetic history of admixture across
inner Eurasia. Nature Ecol. & Evol. 3, 966–976 (2019).

28 Jeong, C., Wilkin S., Amgalantugs, T. et al. Bronze Age population dynamics and the rise
of dairy pastoralism on the eastern Eurasian steppe. Proc. Natl. Acad. Sci. U.S.A. 115,
E11248–E11255 (2018).
29 Mallick S., Li H., Lipson M. et al. The Simons Genome Diversity Project: 300 genomes
from 142 diverse populations. Nature 538, 201–206 (2016).
30 Jónsson, H., Ginolhac, A., Schubert, M., Johnson, P. L. F. & Orlando, L. mapDamage2.0:
fast approximate Bayesian estimates of ancient DNA damage parameters. Bioinformatics 29,
1682–1684 (2013).
31 Renaud, G., Slon, V., Duggan, A. T. & Kelso, J. Schmutzi: estimation of contamination
and endogenous mitochondrial consensus calling for ancient DNA. Genome Biol. 16, 224
(2015).
32 Korneliussen, T. S., Albrechtsen, A. & Nielsen, R. ANGSD: Analysis of Next Generation
Sequencing Data. BMC Bioinformatics 15, 356 (2014).
33 Patterson, N., Price, A. L. & Reich, D. Population structure and eigen analysis. PLoS
Genet. 2, e190 (2006).
34 Raghavan, M., Skoglund P., Graf G. E. et al. Upper Palaeolithic Siberian genome reveals
dual ancestry of Native Americans. Nature 505, 87–91 (2014).
35 Patterson, N., Moorjani P., Luo Y. et al. Ancient Admixture in Human History. Genetics
192, 1065–1093 (2012).
36 Fu, Q., Hajdinjak, M., Moldovan, O. T., et al. An early modern human from Romania with
a recent Neanderthal ancestor. Nature 524, 216–219 (2015).
37 Kirch, P.V. & Green, R. Hawaiki, Ancestral Polynesia: An Essay in Historical
Anthropology (Cambridge Univ. Press, 2001).
Acknowledgements
The research leading to these results has received funding from the European Research
Council (ERC) under the European Union’s Horizon 2020 research and innovation
programme (grant agreement No 646612) granted to Martine Robbeets.

We thank Choongwon Jeong, Elena Savelyeva, Wayne Lawrence, Chuanchao Wang,
Marta Burri, Nikolay Klyuev, Irina Zhushchikhovskaya, Mark Byington, Hiroki Miyagi, Yuri
Vostretsov, Aleksandra Jarosz, Jan-Olof Svantesson, Maria Levy, Julie Lefort, Matthew
Miller, Karina Mishchenkova, Elena Perekhvalskaya, Irina Nikolaeva, Alexander Francis-
Ratte, Ian Joo, Rottar Máté and Thomas Pellard for helping to compile, analyze or interpret
data.
Author contributions
The research was conceptualized by MR. Linguistic datasets were collected by AS, JD, SO,
BD, RB, SR, KDA, IG, OM, JRB and MR. The linguistic database was scored by MR and
analysed by MR and RB. Etymologies were established by MR. The archaeology database
was scored by TL, MC, TK, GK, JU and LG, and analysed by MJH, RB, MR, MC and IB.
The Nagabaka site was excavated by TK and KY under the direction of MJH with advice
from MK and HI. Post-excavation analyses of materials from Nagabaka were analysed by
KY, TK, NS, H Tomita, H Takamiya, JU, PR, RF and MY. YQC shared the Angangxi data,
DIA the ancient Korean data, KS the Yayoi data and HI, RK, TS, HO the modern Ryukyu
data. Ancient DNA data from Korea and Japan were generated by JK and the wet lab works
were carried out by RB and MH. Genetic data analyses were carried out by CN with advice
from Choongwon Jeong and input from HKK and FZ. The writing was done by MR, MJH
and CN.
Competing interests
The authors declare no competing interests.

Data availability
All linguistics and arcahaeological datasets are available through the supplementary
information. For our genetic datasets, the aligned sequences are available through the
European Nucleotide Archive under accession number [to be made available on publication].
Genotype data used in analysis are available at https:// [to be made available on publication].
Any other relevant data are available from the corresponding author upon reasonable request.
Code availability
Readers can access the code underlying our Bayesian analyses of linguistic and cultural
datasets through the supplementary information. The files in SI 19 relate to languages and
those in SI 21 to cultures.
Figure legends
Fig. 1a. Geographical distribution of the 98 Transeurasian language varieties included in this
study. Contemporary languages are represented by coloured surfaces, historical varieties by
red dots. Fig. 1b. Transeurasian ancestral languages spoken during the Neolithic (red) and
Bronze Age and later (green).
03_Eurasia3angle_synthesis_Fig 1ab.jpg
Fig. 2a Spatiotemporal distribution of sites included in the archaeological database. Fig. 2b
Clustering of investigated sites according to cultural similarity in line with Bayesian analysis
in Extended data Fig. 2 with indication of the spread of millet and rice in time and space. The
distributions of archeological sites in Fig. 2 does not match that of contemporary languages in
Fig. 1 because we focus on the early dispersal of the linguistic subgroups in the Neolithic and
Bronze Age and on the links between the eastward spread of farming and language dispersal.

04_Eurasia3angle_synthesis_Fig 2a.jpg
Fig 3a Ancient genomes located in time and space. For detailed legend, see Extended data
Fig. 5. Fig 3b Admixture modelling of the ancient populations from this study and other key
populations.
05_Eurasia3angle_synthesis_Fig 3ab_genomes on map_admix plot
Fig 4. Integration of linguistic, agricultural and genetic expansions in Northeast Asia
06_Eurasia3angle_synthesis_Fig_4_overview map
Extended data legends
Extended data Fig. 1. Dated Bayesian phylogeny of the Transeurasian languages
07_Eurasia3angle_synthesis_Extended data Fig 1_language phylogeny.tree
07_Eurasia3angle_synthesis_Extended data Fig 1_language phylogeny.pdf
Extended data Fig. 2. Bayesian phylogenetic analysis of the archaeological database
08_Eurasia3angle_synthesis_Extended data Fig 2_draft cultural phylogeny.tree
08_Eurasia3angle_synthesis_Extended data Fig 2_draft cultural phylogeny.pdf
Extended data Fig. 3. Demographic changes with agriculture in Neolithic and Bronze Age
Northeast Asia. The left column shows changes following the adoption of millet farming ca.
8000-4000 BP, using quantity of pottery for the West Liao33 and radiocarbon proxy dates for
Korea.140 The right column shows long-term dynamics ca. 8000-2000 BP following the
integration of millet with rice, barley and wheat in the Bronze Age and based on site numbers
for NE China,138 radiocarbon dates for Korea140 and site numbers for Japan.141 For references
see SI 7.
09_Eurasia3angle_synthesis_Extended data Fig 3_demography

Extended data Fig. 4 Ancient genomes located in time and space, including legend
10_Eurasia3angle_synthesis_Extended data Fig 4_legend
Extended data Fig. 5 PCA displaying the genetic structure of present-day Eurasians. PC1
separates Western and Eastern Eurasian populations, PC2 Southern and Northern Eurasian
populations. Transeurasian populations are colored according to subfamily (Turkic in grey,
Mongolic in orange, Tungusic in yellow, Koreanic in pink, Japonic in light grey). Non-
Transeurasian populations are colored according to families. Populations are labeled with
three letters, for a list of abbreviations, see SI 10.
11_Eurasia3angle_synthesis_ Extended data Fig 5_PCA present-day Eurasian.
Extended data Fig. 6 PCA displaying the genetic structure of present-day East Asians.
Populations are labeled with three letters, for a list of abbreviations, see SI 10.
12_Eurasia3angle_synthesis_ Extended data Fig 6_PCA present-day East Asian.
Extended data Fig. 7. Ancient genomes plotted on PCA displaying genetic structure of
present-day Eurasians. For a detailed legend see Extended data Fig. 4.
13_Eurasia3angle_synthesis_ Extended data Fig 7_PCA ancient Eurasian
Extended data Fig. 8. Ancient genomes plotted on PCA displaying genetic structure of
present-day East Asians. For a detailed legend see Extended data Fig. 4.
14_ Eurasia3angle_synthesis_ Extended data Fig 8_PCA_ancient East Asian
Extended data Table 1. Overview of triangulation of spatiotemporal, subsistence and
demographic patterns, integrating linguistic, archaeological and genetic findings

15_Eurasia3angle_synthesis_ Extended data Fig 9_triangulation
Supplementary information legends
SI 1. Comparative dataset including 3193 datapoints representing 254 basic vocabulary
concepts for 98 Transeurasian languages
16_Eurasia3angle_synthesis_SI 1_BV 254.xls
SI 2. Basic vocabulary etymologies across the Transeurasian languages, underlying
semantically equivalent cognate sets scored as (1) in SI 1
17_ Eurasia3angle_synthesis_SI 2_basic etymologies.doc
SI 3. Bayesian phylogeographic analysis modelling the spatiotemporal expansion of the
Transeurasian languages
18_Eurasia3angle_synthesis_SI 3_phylogeography.klm
SI 4. Integration of qualitative assessment methods and Bayesian phylogeography in
identifying the ancestral homelands of Transeurasian
19_Eurasia3angle_synthesis_SI 4_homelands.docx
SI 5. Inherited and borrowed correspondence sets for agropastoral vocabulary across the
Transeurasian languages.
20_Eurasia3angle_synthesis_SI 5_subsistence.docx
SI 5a. Agropastoral vocabulary shared by the Turkic languages
21_Eurasia3angle_synthesis_SI 5a_Turkic.docx
SI 5b. Agropastoral vocabulary shared by the Mongolic languages
22_Eurasia3angle_synthesis_SI 5b_Mongolic.docx
SI 5c. Agropastoral vocabulary shared by the Tungusic languages
23_Eurasia3angle_synthesis_SI 5c_Tungusic.docx
SI 5d. Agropastoral vocabulary shared by the Koreanic languages
24_Eurasia3angle_synthesis_SI 5d_Koreanic.docx
SI 5e. Agropastoral vocabulary shared by the Japonic languages
25_Eurasia3angle_synthesis_SI 5e_Japonic.docx
SI 6. Archaeological database
26_Eurasia3angle_synthesis_SI 6_E3a Matrix.xls
SI 7 Qualitative analysis of the archaeological database
27_Eurasia3angle_synthesis_SI 7_qualitative analysis
SI 8 Interpretation of our Bayesian phylogenetic analysis of the archaeological database in
Extended data Fig. 2.
28_Eurasia3angle_synthesis_SI 8_Bayesian cultural interpretation
SI 9 Early crop remains with direct C14 dates from Northeast Asia. Compiled from published
sources and from the radiocarbon database of the National Museum of Japanese History.
Radiocarbon dates on rice from the Nabatake site (Saga) are omitted since several of the
results from that site published in the early 1980s appear unreliable.
29_Eurasia3angle_synthesis_SI 9_cerealC14.xls
SI 10 List of abbreviations used for present-day Eurasian populations
30_Eurasia3angle_synthesis_SI 10_abbreviations

SI 11 Sample information for newly-generated ancient DNA data and for co-analyses of
published ancient individuals from East Eurasia.
31_Eurasia3angle_synthesis_SI 11_aDNA sample info
SI 12 Archaeological context for ancient DNA samples used in this study
32_Eurasia3angle_synthesis_SI 12_site info
SI 13 Archaeological interpretation of our ancient DNA analyses
33_Eurasia3angle_synthesis_SI 13_ archaeogenetic interpretation
SI 14 Inventory of excavated skeletal remains from Nagabaka
34_Eurasia3angle_synthesis_SI 14_Nagabaka skeletal
SI 15 Isotope analyses of the key samples included in this study
35_Eurasia3angle_synthesis_SI 15_isotope
SI 16 qpAdm admixture modeling of ancient and modern populations in this study
36_Eurasia3angle_synthesis_SI 16_qpAdm
SI 17 Sequencing details and summary of newly generated aDNA from this study
37_Eurasia3angle_synthesis_SI 17_sequencing
SI 18 Substitution model Clock model log ML SD
38_Eurasia3angle_synthesis_SI 18
SI 19 BEAST XML files specifying the models, priors, hyperpriors and settings used to run
the analyses of the linguistic database
39_Eurasia3angle_synthesis_SI 19_XML files_languages
SI 20 Comparison of fit of different models estimating the marginal likelihoods using nested
sampling
40_Eurasia3angle_synthesis_SI 20
SI 21 BEAST XML files specifying the models, priors, hyperpriors and settings used to run
the analyses of the archaeological database
41_Eurasia3angle_synthesis_SI 21_XML files_cultures
SI 22 Results of filtering contaminated samples included in this study, using PCA for
contamination control
42_Eurasia3angle_synthesis_SI 22_filtering contamination

Supplementary Files
This is a list of supplementary �les associated with this preprint. Click to download.
16Eurasia3anglesynthesisSI1BV254.xls
17Eurasia3anglesynthesisSI2basicetymologies.docx
18Eurasia3anglesynthesisSI3phylogeography.txt
19Eurasia3anglesynthesisSI4homelands.pdf
20Eurasia3anglesynthesisSI5agropastoral.docx
21Eurasia3anglesynthesisSI5aTurkic.xlsx
22Eurasia3anglesynthesisSI5bMongolic.xlsx
23Eurasia3anglesynthesisSI5cTungisic.xlsx
24Eurasia3anglesynthesisSI5dKoreanic.xlsx
25Eurasia3anglesynthesisSI5eJaponic.xlsx
26Eurasia3anglesynthesisSI6E3aMatrix.xlsx
27Eurasia3anglesynthesisSI7qualitativeanalysis.docx
28Eurasia3anglesynthesisSI8Bayesianculturalinterpretation.docx
29Eurasia3anglesynthesisSI9cerealC14.xlsx
30Eurasia3anglesynthesisSI10abbreviations.xlsx
31Eurasia3anglesynthesisSI11aDNAsampleinfo.xlsx
32Eurasia3anglesynthesisSI12siteinfo.docx
33Eurasia3anglesynthesisSI13Archaeogeneticinterpretation.docx
34Eurasia3anglesynthesisSI14Nagabakaskeletal.xlsx
35Eurasia3anglesynthesisSI15isotope.docx
36Eurasia3anglesynthesisSI16qpAdm.xlsx
37Eurasia3anglesynthesisSI17sequencing.xlsx
38Eurasia3anglesynthesisSI18.docx
39Eurasia3anglesynthesisSI19XML�leslanguages.zip
40Eurasia3anglesynthesisSI20.docx
41Eurasia3anglesynthesisSI21XML�lescultures.zip
42Eurasia3anglesynthesisSI22�lteringcontamination.xlsx
42Eurasia3anglesynthesisSI22�lteringcontaminationd1.xlsx