Embed Size (px)
Citation preview

Triangle-Mesh Models, Their Generation, and TheirApplication in Image Scaling
(PhD Oral Exam)
Ali Mostafavian(V00709918)
Supervisor: Dr. Michael Adams
January 11, 2019
Ali Mostafavian January 11, 2019 1 / 21

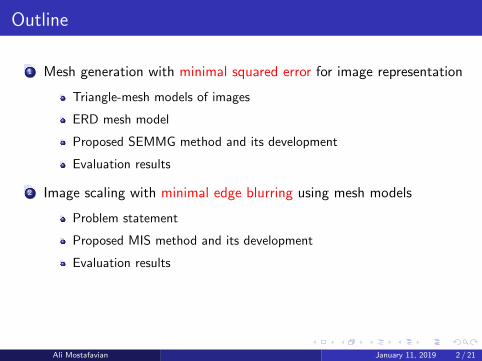
Outline
1 Mesh generation with minimal squared error for image representation
Triangle-mesh models of images
ERD mesh model
Proposed SEMMG method and its development
Evaluation results
2 Image scaling with minimal edge blurring using mesh models
Problem statement
Proposed MIS method and its development
Evaluation results
3 Conclusions
4 Future research
Ali Mostafavian January 11, 2019 2 / 21

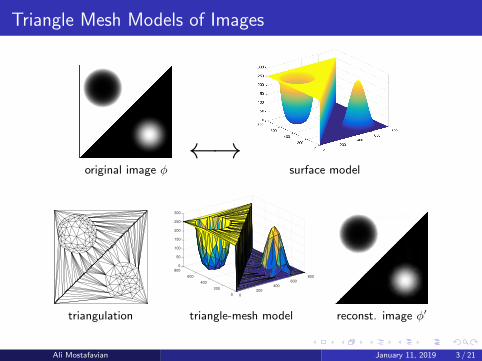
Triangle Mesh Models of Images
original image φ
←→surface model
triangulation
0
800
50
100
600 800
150
200
600400
250
300
400200
200
0 0
triangle-mesh model reconst. image φ′
Ali Mostafavian January 11, 2019 3 / 21

Triangle Mesh Models of Images
original image φ
←→surface model
triangulation
0
800
50
100
600 800
150
200
600400
250
300
400200
200
0 0
triangle-mesh model reconst. image φ′
Ali Mostafavian January 11, 2019 3 / 21

Triangle Mesh Models of Images
original image φ
←→surface model
triangulation
0
800
50
100
600 800
150
200
600400
250
300
400200
200
0 0
triangle-mesh model
reconst. image φ′
Ali Mostafavian January 11, 2019 3 / 21
Triangle Mesh Models of Images
original image φ
←→surface model
triangulation
0
800
50
100
600 800
150
200
600400
250
300
400200
200
0 0
triangle-mesh model reconst. image φ′
Ali Mostafavian January 11, 2019 3 / 21

ERD Mesh Model
Explicit representation of discontinuities (ERD)
Piecewise-linear interpolating function
Based on constrained Delaunay triangulation (CDT)
Using wedges and wedge values
CDT two wedges discontinuity modeling
Ali Mostafavian January 11, 2019 4 / 21

ERD Mesh Model
Explicit representation of discontinuities (ERD)
Piecewise-linear interpolating function
Based on constrained Delaunay triangulation (CDT)
Using wedges and wedge values
CDT
two wedges discontinuity modeling
Ali Mostafavian January 11, 2019 4 / 21

ERD Mesh Model
Explicit representation of discontinuities (ERD)
Piecewise-linear interpolating function
Based on constrained Delaunay triangulation (CDT)
Using wedges and wedge values
CDT two wedges
discontinuity modeling
Ali Mostafavian January 11, 2019 4 / 21

ERD Mesh Model
Explicit representation of discontinuities (ERD)
Piecewise-linear interpolating function
Based on constrained Delaunay triangulation (CDT)
Using wedges and wedge values
CDT two wedges discontinuity modeling
Ali Mostafavian January 11, 2019 4 / 21
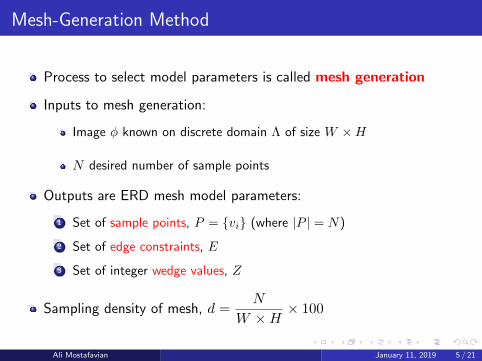
Mesh-Generation Method
Process to select model parameters is called mesh generation
Inputs to mesh generation:
Image φ known on discrete domain Λ of size W ×H
N desired number of sample points
Outputs are ERD mesh model parameters:
1 Set of sample points, P = {vi} (where |P | = N)
2 Set of edge constraints, E
3 Set of integer wedge values, Z
Sampling density of mesh, d =N
W ×H× 100
Ali Mostafavian January 11, 2019 5 / 21

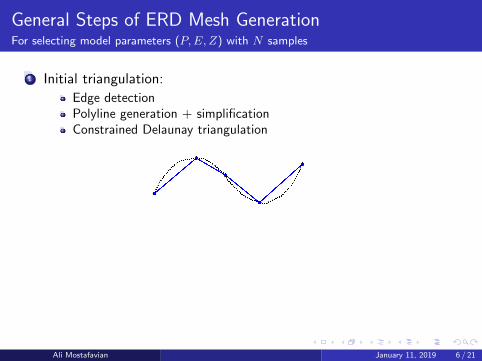
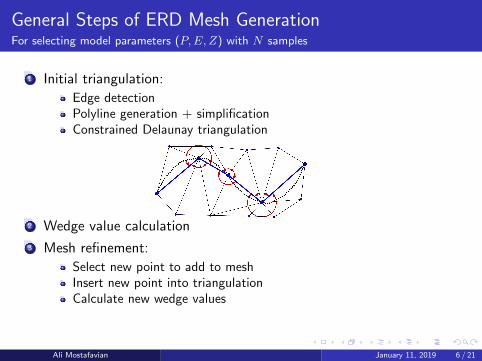
General Steps of ERD Mesh GenerationFor selecting model parameters (P,E,Z) with N samples
1 Initial triangulation:
Edge detectionPolyline generation + simplificationConstrained Delaunay triangulation
2 Wedge value calculation
3 Mesh refinement:
Select new point to add to meshInsert new point into triangulationCalculate new wedge values
4 Repeat step 3 until |P | = N
Ali Mostafavian January 11, 2019 6 / 21

Development of SEMMG Method
Analyzed previous methods (ERDED and ERDGPI)
Identified shortcomings
Developed/applied specific modifications in 3 areas:
1 Edge detection → Otsu thresholding technique is used ⇒ more
effective parameters P and E
2 Wedge-value selection → optimization-based approach is proposed ⇒more effective parameter Z
3 Mesh refinement → centroid-based approach is proposed ⇒ moreeffective parameter P
Combined all modifications ⇒ proposed SEMMG method
Ali Mostafavian January 11, 2019 7 / 21

Evaluation of SEMMG Method
1 Compared to ED, MGH, ERDED, ERDGPI methods:
Test data of 35 images
10 sampling densities from 0.0078125% to 3%
Total of 350 test cases
ED MGH ERDED ERDGPISEMMG outperforms
(% of cases)100% 89% 99% 85%
Average PSNRincrease
8.86 dB 2.25 dB 5.43 dB 2.22 dB
2 Compared to GVS, HWT, BSP, ATM methods:
Average PSNR increase from 1.10 dB to 3.85 dB
65-80% fewer vertices compared to GVS method
10-60% fewer triangles compared to BSP method
Ali Mostafavian January 11, 2019 8 / 21
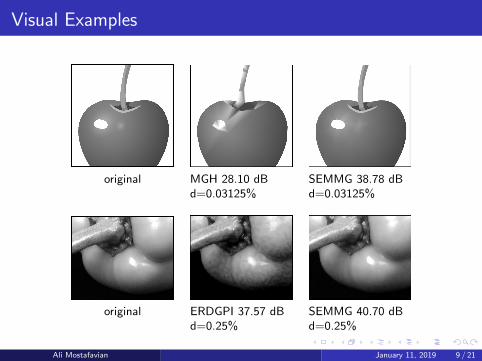
Visual Examples
original MGH 28.10 dBd=0.03125%
SEMMG 38.78 dBd=0.03125%
original ERDGPI 37.57 dBd=0.25%
SEMMG 40.70 dBd=0.25%
Ali Mostafavian January 11, 2019 9 / 21

Application of Mesh Models in Image ScalingProblem Statement
Common distortions: edge blurring/ringing → poor subjective quality
LR image bilinear with k = 4 bicubic with k = 4
Goal: Mesh-based method for producing scaled images withbetter subjective quality and minimal edge blurring
Outcome: MIS method is proposed for scaling grayscale images that areapproximately piecewise smooth
Ali Mostafavian January 11, 2019 10 / 21

Development of Proposed MIS Method
General steps of MIS method to scale an image:
1 raster image → mesh generation → mesh model of image
2 mesh model → mesh transformation → scaled model
3 scaled model → model rasterization → scaled image
SEMMG method not designed for image scaling
SEMMG was used in step 1 to detect distortions/shortcomings inimage scaling
Specific modifications applied to reduce/eliminate distortions
Ali Mostafavian January 11, 2019 11 / 21

Development of Proposed MIS Method Cont’d
Applied modifications to 4 main areas:
1 Wedge-value selection: backfilling-based technique ⇒ more effectiveparameter Z
2 Mesh refinement: modified centroid-based approach ⇒ more effectiveparameter P
3 Model rasterization: subdivision-based approach ⇒ smoother edgecontours
4 Polyline simplification: adaptive polyline simplification (APS) technique⇒ more effective parameter E
Combined all modifications ⇒ proposed MIS method
Ali Mostafavian January 11, 2019 12 / 21

Evaluation of MIS Method
Experimental Comparisons:
Methods with available implementation
MIS method is compared to bilinear, bicubic, DCCI, NEDI, andSRCNN methods
Subjective Evaluation
Objective Evaluations: PSNR, SSIM, PEE metrics
Conceptual Comparisons:
Mesh-based methods with unavailable implementation
Differences/similarities using theoretical analysis
Ali Mostafavian January 11, 2019 13 / 21

Evaluation of MIS Method Cont’dSubjective Evaluation
Between bilinear, bicubic, DCCI, NEDI, SRCNN, and MIS methods
20 LR images and k = 4 → 20 HR images with 19 human subjects ⇒380 rankings
300 pairwise comparisons per subject
Methods ranked from 1st (best) to 6th (worst)
Statistical properties of the 380 ranks:
Bilinear Bicubic DCCI NEDI SRCNN MIS
Mean Rank 5.28 4.78 3.27 3.23 2.44 2.00
Median Rank 6 5 3 3 2 1
Standard Deviation 0.97 1.02 1.06 1.19 1.26 1.75
MIS method achieved best mean rank of 2 and median rank of 1
Ali Mostafavian January 11, 2019 14 / 21

Evaluation of MIS Method Cont’dSubjective Evaluation Cont’d
MIS method ranked 1st in approximately 67% of cases
Ali Mostafavian January 11, 2019 15 / 21

Evaluation of MIS Method Cont’dVisual Examples
LR image
LR zoomed in
bilinear bicubic DCCI
NEDI SRCNN MIS
Ali Mostafavian January 11, 2019 16 / 21

Evaluation of MIS Method Cont’dVisual Examples Cont’d
LR image
LR zoomed in
bilinear bicubic DCCI
NEDI SRCNN MIS
Ali Mostafavian January 11, 2019 17 / 21

Conclusions
2 problems were addressed:
1 Mesh generation with minimal squared errors
The SEMMG method was proposed
Improved meshes in terms of both PSNR and subjective quality
Compared to ED, MGH, ERDED, and ERDGPI methods using 350 testcases:
Outperformed ED in 100% with average PSNR margin of 8.86 dBOutperformed MGH in 89% with average PSNR margin of 2.25 dBOutperformed ERDED in 99% with average PSNR margin of 5.43 dBOutperformed ERDGPI in 85% with average PSNR margin of 2.22 dB
Outperformed GVS, HWT, BSP, and ATM methods with averagePSNR of 3.85, 0.75, 2, and 1.10 dB
65-80% fewer vertices compared to GVS method
10-60% fewer triangles compared to BSP method
Ali Mostafavian January 11, 2019 18 / 21
Conclusions Cont’d
2 Scaling grayscale images with minimal edge blurring using meshmodels
MIS method was proposed for approximately piecewise-smooth images
Improved subjective quality:
Sharper and more accurate edges with minimal blurring/ringing
Compared to bilinear, bicubic, DCCI, NEDI, and SRCNN
Ranked best overall in 67% out of 380 subjective rankings
Gained best mean and median ranks of 2 and 1 out of 6
Flexible functionalities:
Image models that are portable, reusable, and editable
Combination of any affine transformations: translation, rotation,shearing
Almost independent from scale factor
Ali Mostafavian January 11, 2019 19 / 21
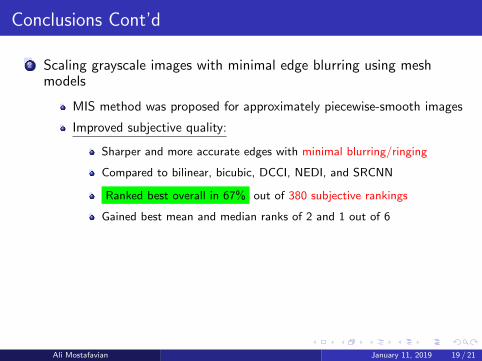
Future Research
Edge detection:more advanced edge detectoredges with sub-pixel accuracybetter detection of junction pointsbetter performance with too small images
Wedge-value selection:direct optimization instead of corner z-value optimization and averagingto reduce the negative impact of averaging
Mesh subdivision:embedding mesh subdivision into the mesh generationselect candidate face/point for insertion based on subdivisioncompute new wedge values at subdivided vertices based on the actualimage function
Color imagesimage model with the same triangulation: scalar z value → 3-tuples(r, g, b), ORimage model with different triangulations: separate triangulation percolor channel
Ali Mostafavian January 11, 2019 20 / 21

THANK YOU
Ali Mostafavian January 11, 2019 21 / 21


![Laplacian Mesh Optimization - Department of …misha/Fall07/Papers/Nealen06.pdfFigure 3: Least squares mesh [Sorkine and Cohen-Or 2004] (mid-dle) and detail preserving triangle shape](https://img.dokumen.tips/doc/110x75/5b249f4f7f8b9a780c8b4b83/laplacian-mesh-optimization-department-of-mishafall07papers-3-least-squares.jpg)

![ADAPTIVE MESH REFINEMENT AND SUPERCONVERGENCE …chenlong/Papers/interfaceProblem.pdfmesh generation methods, the readers are referred to Triangle [28] and Distmesh [25]. When the](https://img.dokumen.tips/doc/110x75/5e69223234b45f25d909abc4/adaptive-mesh-refinement-and-superconvergence-chenlongpapers-mesh-generation-methods.jpg)