Embed Size (px)
Citation preview

ASX ANNOUNCEMENT / MEDIA RELEASE ASX:ABU
25 February 2014
Trial Mining Update: Geological and Grade Control Data Analysis
ABM Resources NL (“ABM” or “The Company”) has compiled and assessed grade control data, geology, and reconciled tonnes and head-grade from trial mining at the Old Pirate high-grade gold deposit located in the Northern Territory.
Analysis of Trial Mining
Table 1. Breakdown of head-grade and tonnes processed per zone.
Mining Zone Average depth / Maximum depth of
trial pit (metres)
Tonnes excavated & processed
(tonnes)
Head-grade (feed-grade)
(g/t Au)*
Feed Ounces
Ounces at 87% in-plant
recovery
OP Central 1.5 / 2.5 3470 18.4 2047 1781
OP Eastside 1.5 / 2.5 507 13.9 227 197
OP South 4 / 5 1205 21.7 842 732
OP Western Limb 3 / 4 2431 9.2 720 626
Golden Hind 4 / 5 2231 25.1 1798 1564
Total 3 / 5 9844 17.8 5634 4900
*Head-grade based on feed-conveyor sampling. Totals may vary due to rounding. Refer to December 2013 quarterly report for sampling technique for head-grade / tails grade and resulting calculations of in-plant recovery.
General update
o Geological observations made during the trial are continuing to generate additional targets that will be followed up as the 2014 field season ramps up.
o Mill clean-out to recover gold in circuit was delayed due to very high rainfall during January and early February. However, contractors and staff have now been mobilised to site to commence this work.
Reconciliation between grade control data, geology and head-grade
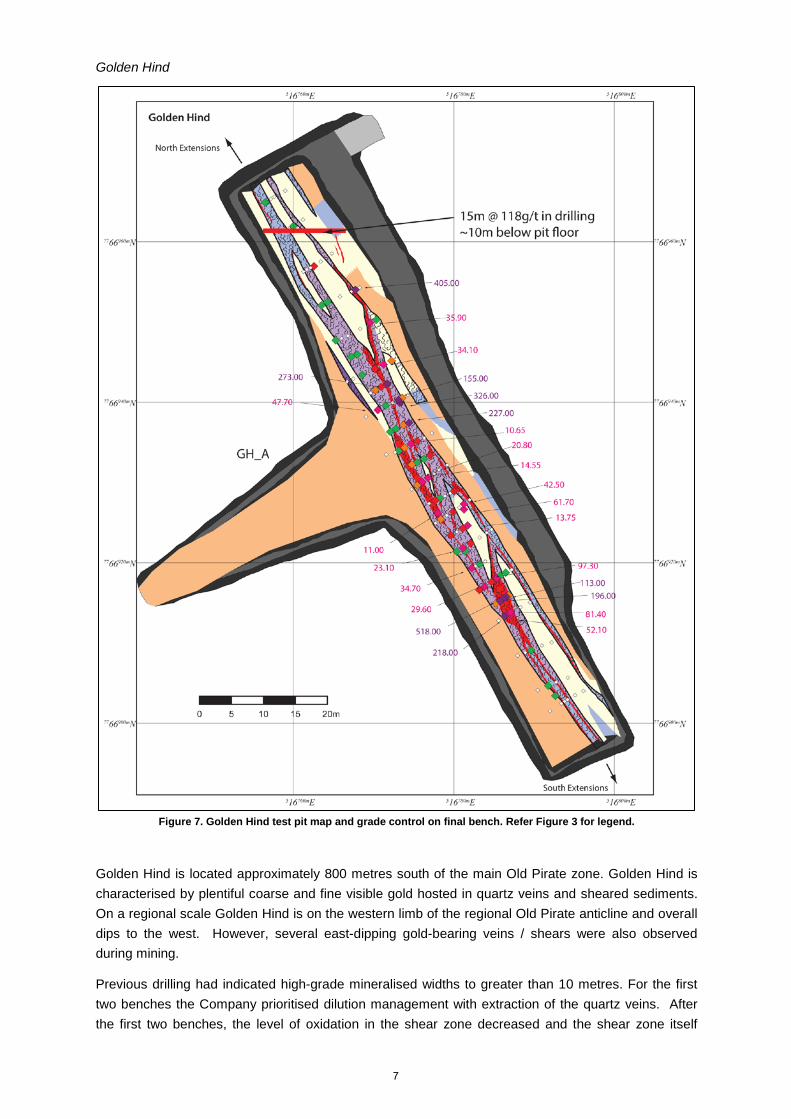
For Stage 1 trial mining, the Company mined 13 pits to depths between 1.5 metres and 5 metres in five representative domains throughout the 1.8 kilometre long Old Pirate mineralised system (Figure 8). Approximately half of the total footprint of known mineralisation was selected for trial work. The five representative pit groupings (Table 1), and the results of the pit mapping, grade control sampling and head-grade to the pilot plant for the five areas are described below. The geology of the mineralised zones was generally as expected, but some local variations were encountered, and these are also detailed below.

Old Pirate Central
A total of 8 individual pits were extracted throughout the Old Pirate Central zone (Figures 1, 2 & 3). The Central zone consists of the previously interpreted main Old Pirate fold nose, the Eastern Limb of the Old Pirate anticline, the Heartland veins and the SE veins.
Drilling through the Old Pirate Central zone has previously generated wide intersections of mineralisation made up of multiple high-grade veins separated by lower grade sediments. Previously the area was interpreted as a relatively simple south plunging fold with the Eastern and Western Limbs converging in this area. On excavation the local scale geology was revealed to have more complexity than this simple fold model. The Eastern Limb is observed as a series of interlinking quartz veins, with individual veins up to 3 metres wide within zones up to 10 metres wide, all hosted within sheared sandstone and shale. The shear zone is striking NNW-SSE, and whilst some shallow plunging folded veins were mapped, the previously interpreted main fold closure was not apparent. The Eastern Limb veins (generally steeply east-dipping) continue along strike to the south beyond what was previously interpreted and are now projected to link to the Old Pirate South area, providing additional near-surface targets.
Grade control sampling to mineralised zone boundaries (weighted to sample width) averaged 23.9g/t gold with a maximum assay of 340g/t gold. A total of 3,470 tonnes of material was extracted and processed as part of the trial mining and achieved an overall head-grade of 18.4g/t gold.
The resource model for the Old Pirate Central area estimated an overall grade of 7.6g/t gold (refer release 04/02/2013). The higher head-grade (compared to resource estimate grade) was achieved partly by selectively mining quartz veins and thus limiting dilution. The Old Pirate Central Zone overall exceeded expectations with higher grade and more total ounces than expected and new potential extensions remain to be tested.
Figure 1. Old Pirate Central (South) test pit geology map with last bench grade control data.
Refer Figure 3 for legend / grid.
2
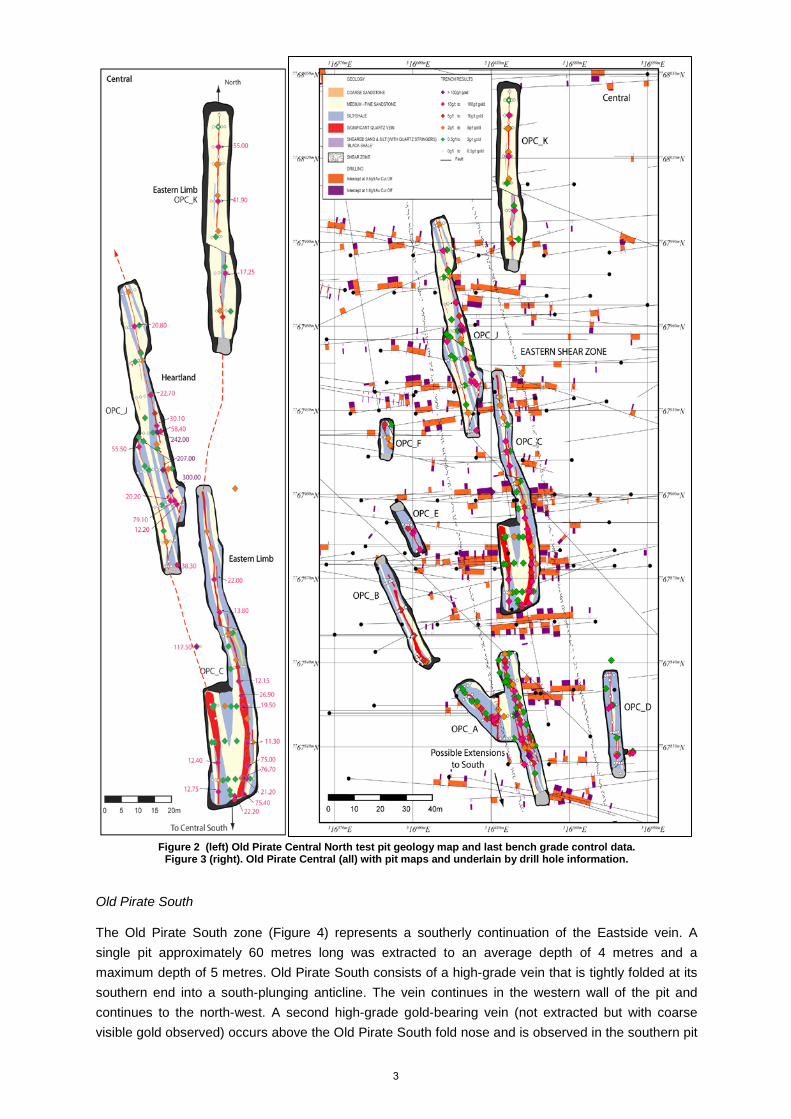
Figure 2 (left) Old Pirate Central North test pit geology map and last bench grade control data.
Figure 3 (right). Old Pirate Central (all) with pit maps and underlain by drill hole information.
Old Pirate South
The Old Pirate South zone (Figure 4) represents a southerly continuation of the Eastside vein. A single pit approximately 60 metres long was extracted to an average depth of 4 metres and a maximum depth of 5 metres. Old Pirate South consists of a high-grade vein that is tightly folded at its southern end into a south-plunging anticline. The vein continues in the western wall of the pit and continues to the north-west. A second high-grade gold-bearing vein (not extracted but with coarse visible gold observed) occurs above the Old Pirate South fold nose and is observed in the southern pit
3

wall and also continues to outcrop to the north-west. The fold nose is plunging south at approximately 18 degrees.
Grade control sampling to mineralised zone boundaries (87 samples) (weighted to sample width) averaged 69.4g/t gold with a maximum value of 1,490g/t gold. With dilution, a total of 1,205 tonnes of material at an average head-grade of 21.7g/t gold was extracted from Old Pirate South. The resource estimation work included Old Pirate South within the Eastside domain (resource estimation grade of 10.4g/t gold Eastside to OP South domain). Overall Old Pirate South exceeded expectation with more consistent high grades than anticipated. The shallow plunging fold nose generates additional near-surface drill targets and the link back to the Central area along a broad shear zone remains to be adequately evaluated.
Figure 4. Old Pirate South test pit geology map with last bench grade control data.
Refer Figure 3 for legend.
4

Old Pirate Eastside
The Old Pirate Eastside vein consists of a single north-south striking vein with occasional local variations in width from 20 centimetres to 1 metre (Figure 5). A total of 4 pits were excavated to an average depth of 1.5 metres and in some areas an extra cut to 2.5 metres was taken. Grade control sampling to mineralised zone boundaries (32 samples) averaged 62.4g/t gold with a maximum value of 472g/t gold. A total of 507 tonnes of material was processed with an average head-grade of 13.9g/t (versus an overall resource estimation grade of 10.4g/t (refer release 04/02/2013)). The higher grade returned (compared to the resource estimation) was largely due to dilution management and the Eastside vein generally performed in line with expectations.
Figure 5 Eastside vein test pit geology map and last bench grade control map.
Refer Figure 3 for legend.
Old Pirate Western Limb
The Old Pirate Western Limb consists of a single vein hosted in a shale unit, striking NNW-SSE and steeply dipping to the west over a length of 600 metres. Approximately 300 metres of the Western Limb was taken in trial mining in a pit averaging 3 metres depth (Figure 6). The main vein width is generally 20 centimetres locally increasing to more than 1 metre.
5

Previous drilling at the Western Limb revealed mineralised zones of 3 to 5 metres true width expanding to greater than 10 metres at depth, which is wider than the main vein observed at surface. At the base of the second bench (2.5 metres below surface) footwall splay quartz veins striking north-south were observed and these may account for the wider mineralised zones observed in drilling, however, the overall impact of splay structures on total contained gold is yet to be established. Grade control sampling to mineralised zone boundaries (222 samples) from the Western Limb averaged 42.9g/t gold with a maximum assay of 613g/t gold. A total of 2,431 tonnes were processed from a mining width of between 0.6m and 1.0m (diluting the narrow vein but still limiting dilution to less than assumed in the resource estimation modelling) with a head-grade of 9.2g/t gold (versus a resource estimation grade of 7.12g/t gold). Overall the Western Limb performed in line with previous surface sampling and modelling for the main vein and the overall continuity and regularity of high grades was above expectations.
Figure 6. Western Limb test pit geology map with final bench grade control data.
6
Golden Hind
Figure 7. Golden Hind test pit map and grade control on final bench. Refer Figure 3 for legend.
Golden Hind is located approximately 800 metres south of the main Old Pirate zone. Golden Hind is characterised by plentiful coarse and fine visible gold hosted in quartz veins and sheared sediments. On a regional scale Golden Hind is on the western limb of the regional Old Pirate anticline and overall dips to the west. However, several east-dipping gold-bearing veins / shears were also observed during mining.
Previous drilling had indicated high-grade mineralised widths to greater than 10 metres. For the first two benches the Company prioritised dilution management with extraction of the quartz veins. After the first two benches, the level of oxidation in the shear zone decreased and the shear zone itself
7

became much more apparent. It was readily observed, during excavation on the third and fourth benches (>2.5 metres), that the sheared shale material either side of the quartz also contained plentiful visible gold, strongly supported by assay results, and the ability to mine to the mineralised contacts improved. At surface and as previously defined by drilling the high-grade gold-bearing material covers a strike length of >80 metres, however, on mining the mineralised strike length observed is 50 to 60 metres. The north-western end of the trial pit generally had low-grade shown in grade control sampling, however, ~10 metres beneath this north-western end is the Company’s highest grade intersection to date from drilling (15m averaging 118g/t gold (refer release 02/10/2012)). Several shallow south-dipping shears and numerous narrow, shallow dipping veins in the walls of the Golden Hind pit, as well as the steep veins and shears seen elsewhere were also observed. These observations, along with other geological features seen in the trial mining pit, indicate Golden Hind will continue to increase in strike as Stage 2 mining progresses and there is a possibility of multiple plunging shoots or stacked zones.
Grade control sampling to mineralised zone boundaries (234 samples) averaged 29.9g/t gold with a peak value of 518g/t gold. A total of 2,231 tonnes of material was processed from Golden Hind and achieved an average head-grade of 25.1g/t gold. This grade is higher than the resource estimation grade (16.35g/t gold (refer release 04/02/2013)). The tonnage extracted was overall less than anticipated due to both not recognising, through oxidation, the sheared material as being gold-bearing until part way through trial mining, and the slightly shorter length of the overall system compared to drilling. The presence of gold in shear zones splaying off to both the east and west, east-dipping structures (along with west-dipping structures) and potential repeats of mineralised zones at depth provide extensional targets at Golden Hind.
General comments
ABM has run preliminary model checks involving the variations to the observed geology and distribution of mineralisation in the top 3 to 5 metres. Overall the global resource estimation (1.88Mt averaging 10.1g/t gold (top cut)) issued in 2012 remains a valid global resource estimation, and the local variations are within the bounds expected for a structurally controlled quartz vein and coarse gold system. This check work and analysis is on-going and the Company may not issue an updated resource estimation until further work, including possible progression to Stage 2 mining is carried out.
As a key part of the trial mining test, the Company was able to minimise dilution and mine to geological boundaries and hence anticipates that it will be able to mine at higher grade and lower tonnes than indicated by the resource model. Due to 1 metre compositing and evenly spaced sampling, the existing resource model has up to 2 metres inherent dilution (e.g >900% on a 20cm vein) built in around narrow high-grade veins. A summary of grade control data and effective mine dilution calculation is shown in Appendix 1. In addition the Company is currently planning shallow follow up drilling on extensional and infill target areas to be carried out in conjunction with sterilisation drilling planned for Stage 2 infrastructure areas.
Mill Clean-Out Update
The area around the Old Pirate project received over 500mm of rain from mid-January to mid-February which made access roads impassable. Conditions have improved considerably in recent days and as a result the Company has mobilised the contractors and staff to site to commence this work. Further updates will be made as information is compiled.
8
Figure 8. Old Pirate Trend. Left – trial pit locations; Right – grade control data, surface sampling and previous drilling.
About ABM Resources
ABM is an exploration Company developing several gold discoveries in the Central Desert region of the Northern Territory of Australia. The Company has a multi-tiered approach to exploration and development with a combination of high-grade potentially short-term production scenarios such as the Old Pirate High-Grade Gold Project, large scale discoveries such as Buccaneer, and regional exploration discoveries such as the Hyperion Gold Project.
In addition, ABM is committed to regional exploration programs throughout its extensive holdings including the alliance with Independence Group NL at the regional Lake Mackay Project, and the recently announced and proposed divestment of the North Arunta Projects to Clancy Exploration Ltd.
9

Figure 9. ABM Project Location Map in Northern Territory.
Signed
Darren Holden – Managing Director
Competent Persons Statement
The information in this announcement relating to previous drill results and mineral resource estimations (announced previously and before 1st December 2013) is based on information compiled by Mr Darren Holden who is a Member of The Australasian Institute of Mining and Metallurgy. Mr Holden is a full time employee of ABM Resources NL and has sufficient experience which is relevant to the style of mineralisation and type of deposit under consideration and to the activity which he is undertaking to qualify as a Competent Person as defined in the 2004 edition of the “Australasian Code for Reporting Exploration Results, Mineral Resources and Ore Reserves”. Mr Holden consents to the inclusion in the documents of the matters based on this information in the form and context in which it appears.
The information in this announcement relating to recent Exploration Results (grade control) is based on information reviewed and compiled by Mr Darren Holden who is a Member of The Australasian Institute of Mining and Metallurgy. Mr Holden is a full time employee of ABM Resources NL and has sufficient experience which is relevant to the style of mineralisation and type of deposit under consideration and to the activity which he is undertaking to qualify as a Competent Person as defined in the 2012 edition of the “Australasian Code for Reporting Exploration Results, Mineral Resources and Ore Reserves”. Mr Holden consents to the inclusion in the documents of the matters based on this information in the form and context in which it appears.
The information that refers to Exploration Results & Mineral Resources in this announcement that was prepared and first disclosed under the JORC Code 2004 has not been updated since to comply with the JORC Code 2012 on the basis that the information has not materially changed since last reported.
10

APPENDIX 1. Grade Control Data summary.
Area
Samples collected from geologically
defined mineralised zones
(>0.5g/t)
Average weight
Average width of sample
Weighted (to width) average grade control assay
(mineralised zones >0.5g/t)
Maximum assay from grade control data
(Au g/t)
Head-grade (Au g/t)
Implied Mining Dilution Factor (head-grade versus grade control grade)
Golden Hind 234 2.33 0.73 29.86 518.00 25.1 19%
Old Pirate Central 131 2.53 0.57 23.92 340.00 18.4 30%
Old Pirate Eastside 32 3.03 0.49 62.37 472.00 13.9 349%
Old Pirate South 87 2.90 0.57 69.39 1490.00 21.7 220%
Old Pirate Western Limb 222 2.74 0.28 42.88 613.00 9.2 366%
Grade control data is a combination of channel sampling (costeans) and longitudinal sampling. Note: Old Pirate Central (Heartland area) included an assay of 1840g/t Au maximum which was a duplicate sample with the original grading 242g/t and the 1840g/t result was discarded in these calculations. Weighted average grade control assays are weighted to sample width so that, for example, a 0.2m wide vein with 100g/t result has the same weighting as a 1m wide vein with a 20g/t result. Head-grades are based on assaying from crushed material from the feed-conveyor. Refer to December 2013 Quarterly report issued 23 January, 2014 for JORC 2012 explanation of head-grade sampling techniques. JORC 2012 statement for grade control data noted below.
11
JORC Code, 2012 Edition – Table 1 report template
Section 1 Sampling Techniques and Data (Criteria in this section apply to all succeeding sections.)
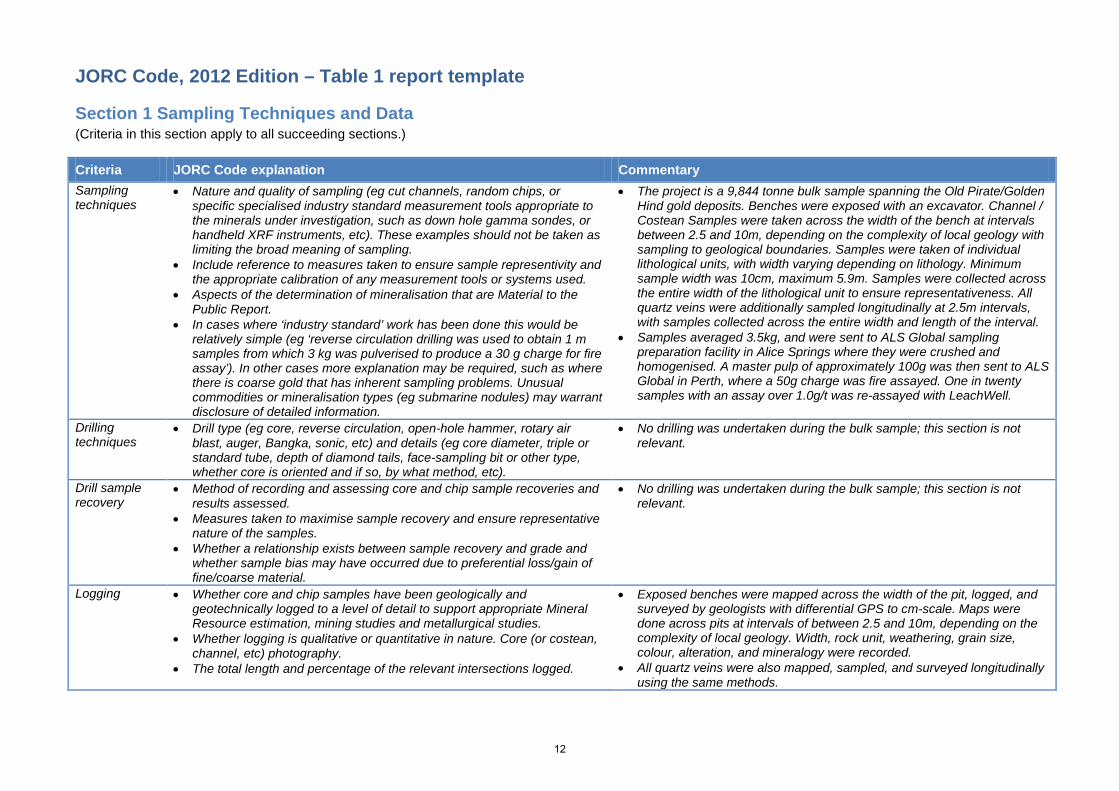
Criteria JORC Code explanation Commentary Sampling techniques
• Nature and quality of sampling (eg cut channels, random chips, or specific specialised industry standard measurement tools appropriate to the minerals under investigation, such as down hole gamma sondes, or handheld XRF instruments, etc). These examples should not be taken as limiting the broad meaning of sampling.
• Include reference to measures taken to ensure sample representivity and the appropriate calibration of any measurement tools or systems used.
• Aspects of the determination of mineralisation that are Material to the Public Report.
• In cases where ‘industry standard’ work has been done this would be relatively simple (eg ‘reverse circulation drilling was used to obtain 1 m samples from which 3 kg was pulverised to produce a 30 g charge for fire assay’). In other cases more explanation may be required, such as where there is coarse gold that has inherent sampling problems. Unusual commodities or mineralisation types (eg submarine nodules) may warrant disclosure of detailed information.
• The project is a 9,844 tonne bulk sample spanning the Old Pirate/Golden Hind gold deposits. Benches were exposed with an excavator. Channel / Costean Samples were taken across the width of the bench at intervals between 2.5 and 10m, depending on the complexity of local geology with sampling to geological boundaries. Samples were taken of individual lithological units, with width varying depending on lithology. Minimum sample width was 10cm, maximum 5.9m. Samples were collected across the entire width of the lithological unit to ensure representativeness. All quartz veins were additionally sampled longitudinally at 2.5m intervals, with samples collected across the entire width and length of the interval.
• Samples averaged 3.5kg, and were sent to ALS Global sampling preparation facility in Alice Springs where they were crushed and homogenised. A master pulp of approximately 100g was then sent to ALS Global in Perth, where a 50g charge was fire assayed. One in twenty samples with an assay over 1.0g/t was re-assayed with LeachWell.
Drilling techniques
• Drill type (eg core, reverse circulation, open-hole hammer, rotary air blast, auger, Bangka, sonic, etc) and details (eg core diameter, triple or standard tube, depth of diamond tails, face-sampling bit or other type, whether core is oriented and if so, by what method, etc).
• No drilling was undertaken during the bulk sample; this section is not relevant.
Drill sample recovery
• Method of recording and assessing core and chip sample recoveries and results assessed.
• Measures taken to maximise sample recovery and ensure representative nature of the samples.
• Whether a relationship exists between sample recovery and grade and whether sample bias may have occurred due to preferential loss/gain of fine/coarse material.
• No drilling was undertaken during the bulk sample; this section is not relevant.
Logging • Whether core and chip samples have been geologically and geotechnically logged to a level of detail to support appropriate Mineral Resource estimation, mining studies and metallurgical studies.
• Whether logging is qualitative or quantitative in nature. Core (or costean, channel, etc) photography.
• The total length and percentage of the relevant intersections logged.
• Exposed benches were mapped across the width of the pit, logged, and surveyed by geologists with differential GPS to cm-scale. Maps were done across pits at intervals of between 2.5 and 10m, depending on the complexity of local geology. Width, rock unit, weathering, grain size, colour, alteration, and mineralogy were recorded.
• All quartz veins were also mapped, sampled, and surveyed longitudinally using the same methods.
12
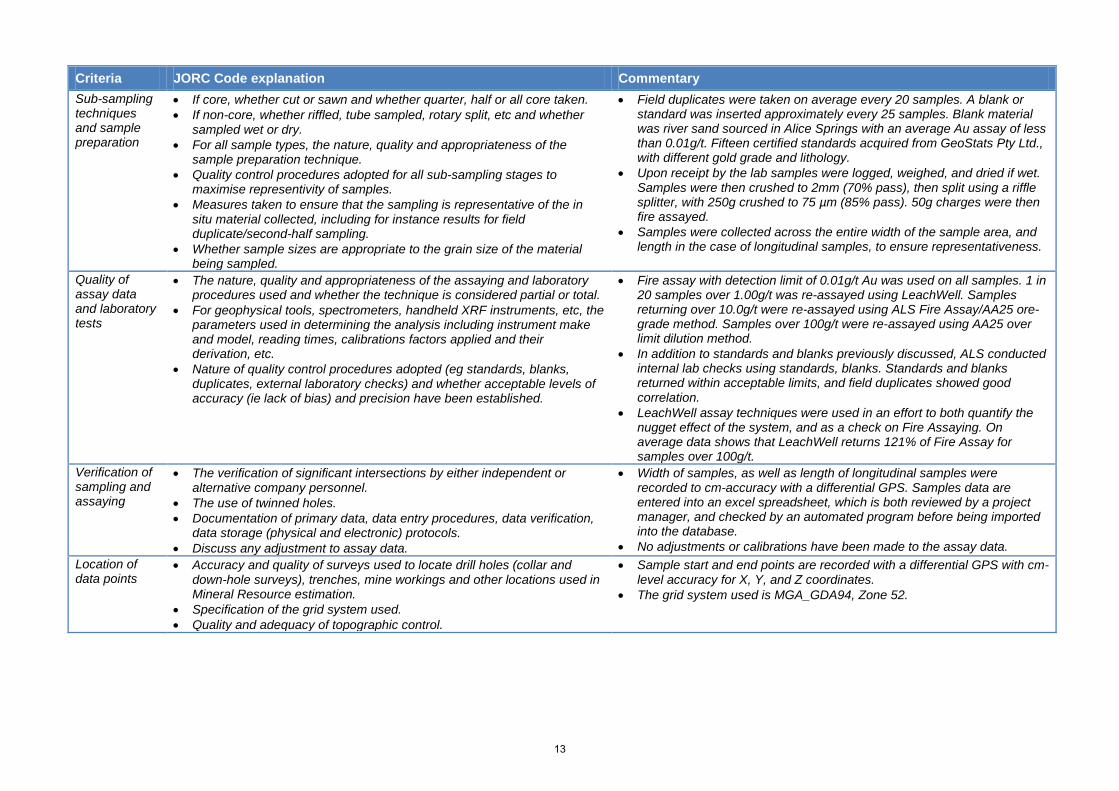
Criteria JORC Code explanation Commentary Sub-sampling techniques and sample preparation
• If core, whether cut or sawn and whether quarter, half or all core taken. • If non-core, whether riffled, tube sampled, rotary split, etc and whether
sampled wet or dry. • For all sample types, the nature, quality and appropriateness of the
sample preparation technique. • Quality control procedures adopted for all sub-sampling stages to
maximise representivity of samples. • Measures taken to ensure that the sampling is representative of the in
situ material collected, including for instance results for field duplicate/second-half sampling.
• Whether sample sizes are appropriate to the grain size of the material being sampled.
• Field duplicates were taken on average every 20 samples. A blank or standard was inserted approximately every 25 samples. Blank material was river sand sourced in Alice Springs with an average Au assay of less than 0.01g/t. Fifteen certified standards acquired from GeoStats Pty Ltd., with different gold grade and lithology.
• Upon receipt by the lab samples were logged, weighed, and dried if wet. Samples were then crushed to 2mm (70% pass), then split using a riffle splitter, with 250g crushed to 75 µm (85% pass). 50g charges were then fire assayed.
• Samples were collected across the entire width of the sample area, and length in the case of longitudinal samples, to ensure representativeness.
Quality of assay data and laboratory tests
• The nature, quality and appropriateness of the assaying and laboratory procedures used and whether the technique is considered partial or total.
• For geophysical tools, spectrometers, handheld XRF instruments, etc, the parameters used in determining the analysis including instrument make and model, reading times, calibrations factors applied and their derivation, etc.
• Nature of quality control procedures adopted (eg standards, blanks, duplicates, external laboratory checks) and whether acceptable levels of accuracy (ie lack of bias) and precision have been established.
• Fire assay with detection limit of 0.01g/t Au was used on all samples. 1 in 20 samples over 1.00g/t was re-assayed using LeachWell. Samples returning over 10.0g/t were re-assayed using ALS Fire Assay/AA25 ore-grade method. Samples over 100g/t were re-assayed using AA25 over limit dilution method.
• In addition to standards and blanks previously discussed, ALS conducted internal lab checks using standards, blanks. Standards and blanks returned within acceptable limits, and field duplicates showed good correlation.
• LeachWell assay techniques were used in an effort to both quantify the nugget effect of the system, and as a check on Fire Assaying. On average data shows that LeachWell returns 121% of Fire Assay for samples over 100g/t.
Verification of sampling and assaying
• The verification of significant intersections by either independent or alternative company personnel.
• The use of twinned holes. • Documentation of primary data, data entry procedures, data verification,
data storage (physical and electronic) protocols. • Discuss any adjustment to assay data.
• Width of samples, as well as length of longitudinal samples were recorded to cm-accuracy with a differential GPS. Samples data are entered into an excel spreadsheet, which is both reviewed by a project manager, and checked by an automated program before being imported into the database.
• No adjustments or calibrations have been made to the assay data. Location of data points
• Accuracy and quality of surveys used to locate drill holes (collar and down-hole surveys), trenches, mine workings and other locations used in Mineral Resource estimation.
• Specification of the grid system used. • Quality and adequacy of topographic control.
• Sample start and end points are recorded with a differential GPS with cm-level accuracy for X, Y, and Z coordinates.
• The grid system used is MGA_GDA94, Zone 52.
13

Criteria JORC Code explanation Commentary Data spacing and distribution
• Data spacing for reporting of Exploration Results. • Whether the data spacing and distribution is sufficient to establish the
degree of geological and grade continuity appropriate for the Mineral Resource and Ore Reserve estimation procedure(s) and classifications applied.
• Whether sample compositing has been applied.
• Spacing of the bulk sample data varied depending on the complexity of local geology. Longitudinal samples were taken every 2.5m along quartz (ore) veins. Samples were taken across the width of exposed benches at spacing of between 2.5 and 10m. Sample length varied based on lithology, with individual lithological units being sampled wherever practicable, and varied between 10cm and 5.9m.
• Sample spacing is sufficient to provide geologic and grade continuity. • No sample compositing has been applied.
Orientation of data in relation to geological structure
• Whether the orientation of sampling achieves unbiased sampling of possible structures and the extent to which this is known, considering the deposit type.
• If the relationship between the drilling orientation and the orientation of key mineralised structures is considered to have introduced a sampling bias, this should be assessed and reported if material.
• As all lithologies were sampled, as well as all exposed ore veins, bias should have been eliminated.
• No drilling was undertaken during the bulk sample, so orientation of drilling relative to mineralised structures is not relevant.
Sample security
• The measures taken to ensure sample security. • Samples were transported from the field camp to the Granites mine by ABM personnel, where they were loaded onto a Toll Express transport, and taken to a secure prep facility in Alice Springs using the laboratory’s standard chain of custody procedure.
Audits or reviews
• The results of any audits or reviews of sampling techniques and data. • ABM conducted an audit of ALS’s Perth lab facility and found everything to be in order.
• QAQC review of lab results showed no significant statistical outliers.
14

Section 2 Reporting of Exploration Results (Criteria listed in the preceding section also apply to this section.)
Criteria JORC Code explanation Commentary Mineral tenement and land tenure status
• Type, reference name/number, location and ownership including agreements or material issues with third parties such as joint ventures, partnerships, overriding royalties, native title interests, historical sites, wilderness or national park and environmental settings.
• The security of the tenure held at the time of reporting along with any known impediments to obtaining a licence to operate in the area.
• The Old Pirate/Golden Hind gold deposit sits on EL28322 in the Northern Territory. The tenement is in good standing and no known impediments exist. ABM has applied for a Mineral Lease covering the deposit.
• The tenement is covered by an access agreement with the Central Land Council.
Exploration done by other parties
• Acknowledgment and appraisal of exploration by other parties. • North Flinders, Normandy NFM, and Newmont Asia Pacific conducted exploration on the property from the early 1990s through 2006, including surface sampling, ground and airborne geophysics, as well as RAB, Air Core, Vacuum, RC, and Diamond drilling. Data collected in this period is reliable and consistent with ABM’s data, fits the overall geologic model, and is used with equal confidence.
Geology • Deposit type, geological setting and style of mineralisation. • The Old Pirate deposit consists of a series of gold-bearing quartz veins ranging from cm to metre-scale. It is a coarse gold system hosted within bedding-parallel quartz veins, and cross-cutting shear veins located in two regional-scale, south-plunging anticlines.
• The Golden Hind deposit, previously thought to be similar to Old Pirate, has now been recognised as shear-hosted. Fine-grained gold occurs within a unit designated as “black shale”; an interbedded sequence of iron-rich sheared sand and siltstones with quartz stringers. Competent, coarse-grained sandstone beds constrain the limits of the shear zone, with shearing occurring in rheologically ‘flexible’ shales and thinner sand beds. Gold is found within the shale lenses, closely associated with thin (0.5 – 2cm) stringers of sheared, boudinaged quartz. Coarse gold is also evident within larger veins that are predominantly located in the hanging walls and foot walls of the system.
Drill hole Information
• A summary of all information material to the understanding of the exploration results including a tabulation of the following information for all Material drill holes: o easting and northing of the drill hole collar o elevation or RL (Reduced Level – elevation above sea level in metres)
of the drill hole collar o dip and azimuth of the hole o down hole length and interception depth o hole length.
• If the exclusion of this information is justified on the basis that the information is not Material and this exclusion does not detract from the
• No drilling was undertaken during the bulk sample, this section is not relevant.
15

Criteria JORC Code explanation Commentary understanding of the report, the Competent Person should clearly explain why this is the case.
Data aggregation methods
• In reporting Exploration Results, weighting averaging techniques, maximum and/or minimum grade truncations (eg cutting of high grades) and cut-off grades are usually Material and should be stated.
• Where aggregate intercepts incorporate short lengths of high grade results and longer lengths of low grade results, the procedure used for such aggregation should be stated and some typical examples of such aggregations should be shown in detail.
• The assumptions used for any reporting of metal equivalent values should be clearly stated.
• For reporting of exploration results, no averaging, truncation, or top-cutting is used.
• LeachWell assaying has a maximum detection limit of 300g/t. Assays above this limit are reported as >300g/t.
Relationship between mineralisation widths and intercept lengths
• These relationships are particularly important in the reporting of Exploration Results.
• If the geometry of the mineralisation with respect to the drill hole angle is known, its nature should be reported.
• If it is not known and only the down hole lengths are reported, there should be a clear statement to this effect (eg ‘down hole length, true width not known’).
• Samples were taken of horizontal exposed faces of veins which were typically steeply-dipping (between 70 and 90 degrees). Width of samples are considered to be close to the true width of mineralisation in these cases.
• In the Old Pirate South pit, veins dipped at approximately 20 degrees to the south in the nose of the anticline. Samples were again taken across the horizontally exposed face of the vein.
Diagrams • Appropriate maps and sections (with scales) and tabulations of intercepts should be included for any significant discovery being reported These should include, but not be limited to a plan view of drill hole collar locations and appropriate sectional views.
• Maps and sections are included with release of exploration results where appropriate.
Balanced reporting
• Where comprehensive reporting of all Exploration Results is not practicable, representative reporting of both low and high grades and/or widths should be practiced to avoid misleading reporting of Exploration Results.
• Exploration results are released comprehensively whenever possible.
Other substantive exploration data
• Other exploration data, if meaningful and material, should be reported including (but not limited to): geological observations; geophysical survey results; geochemical survey results; bulk samples – size and method of treatment; metallurgical test results; bulk density, groundwater, geotechnical and rock characteristics; potential deleterious or contaminating substances.
• All substantive exploration data is released when certified complete.
Further work • The nature and scale of planned further work (eg tests for lateral extensions or depth extensions or large-scale step-out drilling).
• Diagrams clearly highlighting the areas of possible extensions, including the main geological interpretations and future drilling areas, provided this information is not commercially sensitive.
• Extensional targets remain at the Old Pirate and Golden Hind deposits and will be followed up with drilling and trenching. The bulk sample has shown there is substantial gold contained within the system; a Mineral Lease application has been made, and plans for future mining are progressing.
16

APPENDIX 2. Old Pirate Resource Estimation
Old Pirate Trend Overall High-Grade Mineral Resource Estimation February 2013
Category Tonnes Gold Grade
(g/t) (300g/t top-cut)
Gold Grade (g/t)
(uncut)
Ounces Gold
(300g/t top-cut)
Ounces Gold
(uncut)
Indicated 889,000 8.19 8.93 234,100 255,300
Inferred 993,000 11.80 14.67 376,900 468,500
Total 1,882,000 10.10 11.96 611,000 723,800
Mineral Resources estimated at 1g/t cut-off except for the Central zone estimated at a 3g/t cut-off. Totals may vary due to rounding. There is an additional 414,900 tonnes averaging 1.74g/t gold for 23,300 ounces of gold in low-grade Indicated Resource in the Central zone (>1g/t, <3g/t cut-offs).
For further information refer to ASX release dated 04/02/2013.
17