Embed Size (px)
Citation preview

Trends of Mercury Flow over the USwith Emphasis on Florida
Progress Report by
Janja Husar and Rudolf Husar
Submitted to
Thomas Atkeson, Florida DEPMay 2001

Background
Goal:
• Develop a trend database for mercury flow over the US. Special emphasis on mercury flow through fuels, time epoch 1980-2000 and the geographic region of Florida.
Approach:
• Materials flow methodology. Mercury budgeting from the production (mining) through processing, consumption to the disposal in air, land and water.

Review, Summary and Evaluation of Recent Literature
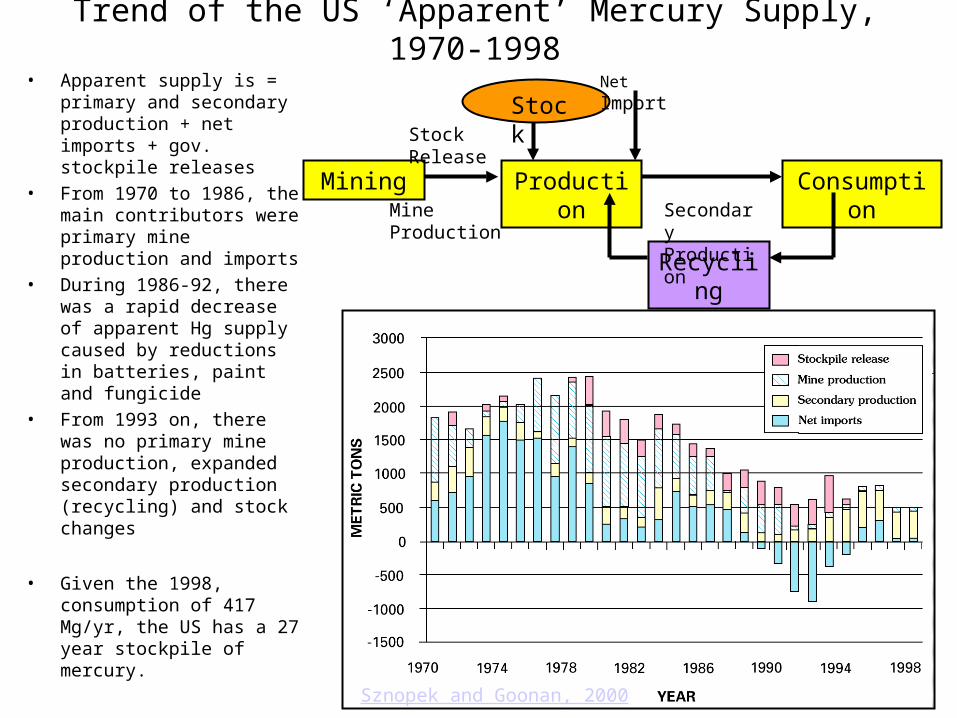
Trend of the US ‘Apparent’ Mercury Supply, 1970-1998
• Apparent supply is = primary and secondary production + net imports + gov. stockpile releases
• From 1970 to 1986, the main contributors were primary mine production and imports
• During 1986-92, there was a rapid decrease of apparent Hg supply caused by reductions in batteries, paint and fungicide
• From 1993 on, there was no primary mine production, expanded secondary production (recycling) and stock changes
• Given the 1998, consumption of 417 Mg/yr, the US has a 27 year stockpile of mercury.
Sznopek and Goonan, 2000
Mining Production Consumption
Recycling
Stock
Mine Production Secondary Production
Net Import
Stock Release

Domestic Flow of Mercury, 1996
Sznopek and Goonan, 2000
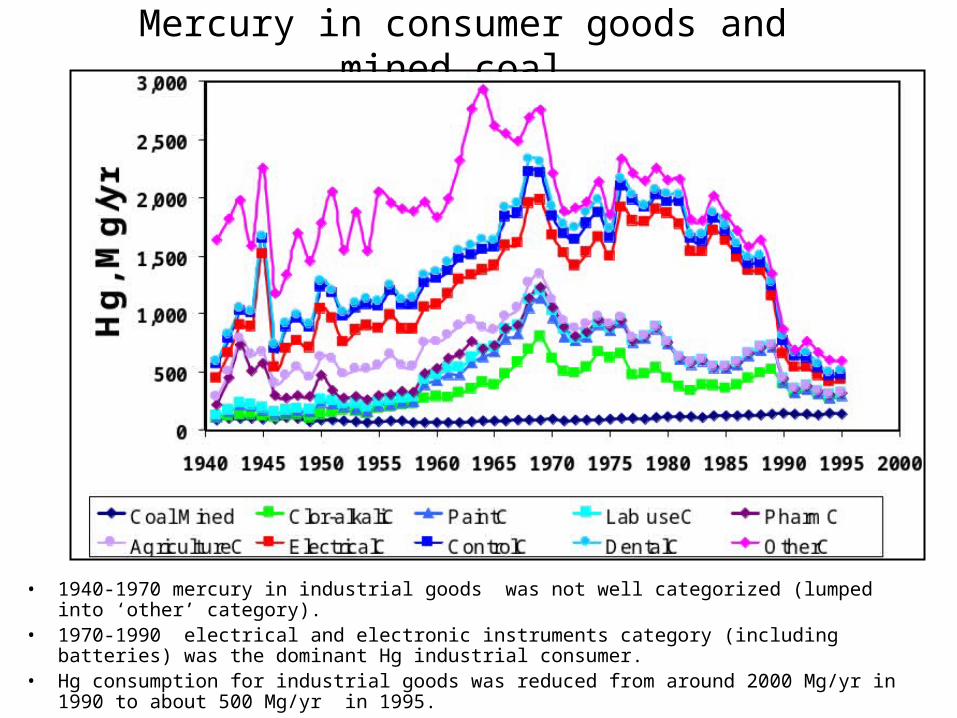
Mercury in consumer goods and mined coal
• 1940-1970 mercury in industrial goods was not well categorized (lumped into ‘other’ category).• 1970-1990 electrical and electronic instruments category (including batteries) was the dominant Hg
industrial consumer.• Hg consumption for industrial goods was reduced from around 2000 Mg/yr in 1990 to about 500
Mg/yr in 1995.

Mercury in US consumer goods and coal in 1990s
• Chlor-alkali and electrical and electronic instruments are still dominant users of mercury.
• Coal mined and consumed in US contributes about 140 Mg/yr
Mercury in consumer goods and coal
0
200
400
600
800
1,000
1990 1991 1992 1993 1994 1995 1996
Hg
, M
g/y
r
Coal Mined Clor-alkaliC PaintC
Lab useC PharmC AgricultureC
ElectricalC ControlC DentalC
OtherC

Mercury Releases to the Atmosphere, 1995Total = 144 Mg/yr
Coal, 66
Oil, 10
Mun. Waste, 27
Med. Waste, 14.6
Haz. Waste, 6.4
Cement, 4.4
Other, 1.3
Industrial, 13.9
Atmospheric Emissions of Mercury
• According to the EPA Report to Congress, atmospheric emissions of mercury are dominated by coal and oil combustion (53%)
EPA Mercury Study Report to Congress, 1997

Mercury Flow through Coal over the US
• Introduction
• Approach

US Coal Production by Region
• Coal production in the US occurred over five major producing regions.• The coal production over the eastern US has remained roughly constant throughout the century.• The sharp increase since the 1980s is due to the addition of western coal.

Mercury Content of US Coals
• Each coal producing region has a well defined range of coal mercury content.
• Evidently the pattern of coal mercury content is highly variable.
• USGS has an extensive database of coal mercury content covering most of the regions.
Regional Hg content
Appalachian 0.20 ppmEastern Interior 0.09 ppmGulf Coast 0.24 ppmRocky Mountains 0.11 ppmGreat Plains 0.12 ppm

Mercury Mobilization by Coal Producing Region
• The mercury mobilization follows the pattern of national coal production.
• Since the beginning of the century there was a slight decline (from 0.18 to 0.14 ppm) of average coal mercury concentration due to shifts in regional production.
• There was a sharp rise since the 1980s. In 1995 the mercury mobilization by coal was 144 Mg/yr.
• This constitutes an upper bound on coal mercury emissions to the atmosphere.
Average Hg in US Coal, ppm

Scrapbook: Ideas…unfinished pieces

Explaining Environmental ChangeThe basic elements of life including carbon, nitrogen, phosphorus, calcium are in constant circulation between the earth’s major environmental compartments: atmosphere, hydrosphere, lithosphere, and biosphere.
These earth’s compartments remain in balance as long as the rate of flow of matter and energy in and out of the compartments is unchanged. Changes in the environmental compartments will occur if the circulation (in and out flow) of the substances is perturbed.
For example, the concentration of CO2 in the atmosphere has been increasing because the rate of input into the atmosphere is larger than the rate of output.
Trace metals, unlike C, N, P and Ca, have a slow and sluggish cycle through the four environmental compartments.
Lead, mercury and other metals tend to accumulate in the lithosphere or parts parts of the biosphere. For example, it is said that once deposited, lead stays in the soil for 400 years.

Sulfur Flow Diagram (Tentative)
Mineral Mining Production Consumption
AirLandWater
S Stocks Exp/Imp Raw
Fuel Mining Refining Combustion
Minerals Flow for GoodsMetals, Frasch, Pyrites
Fuels Flow for EnergyCoal, Oil, Gas
Exp/Imp Proc
Ex/Im Raw Ex/Im Processed
Exp/Imp AirEx/Im Water
S as Pollution S as Goods

US Industrial Sulfur: Supply and Demand Trend
US S Budget
S StocksExp/Imp
0
2
4
6
8
10
12
14
1900 1950 2000 2050
ExportsImports
0
2
4
6
8
10
12
14
1900 1950 2000 2050
US SupplyConsumption
-2
0
2
4
6
8
10
12
1900 1950 2000 2050
Sulfur Stock
Stock Change
0
2
4
6
8
10
12
14
1900 1950 2000 2050
S RecoveredS Mined
US S Supply US S Demand
Source http://minerals.usgs.gov/minerals/pubs/of01-006/sulfur.xls

Total S Mobilized and Recovered
0
2
4
6
8
10
12
14
1900 1950 2000 2050
Mill
ion
Ton
s/yr
CoalSMob OilSMob NGasSMobil
0
2
4
6
8
10
12
14
1900 1950 2000 2050
Mill
ion
To
ns/
yr
PetroleumSRec NatGasSRec MetalSRec
0
2
4
6
8
10
12
14
1900 1950 2000 2050
Mill
ion
To
ns/
yr
Pyrites S Mined Frash S Mined MetalsSMob
0
5
10
15
20
25
30
35
40
1900 1950 2000 2050
S RecoveredTotMobilized
Mobilized in Fuels
Mobilized in Minerals
Recovered from Fuels &
Min.


![Adrian Husar Dacia Romana Ist Antica[1]](https://img.dokumen.tips/doc/110x75/55cf9d1e550346d033ac4fd3/adrian-husar-dacia-romana-ist-antica1-56327cebf2c8b.jpg)

