Embed Size (px)
Citation preview
Atmos. Chem. Phys., 16, 9563–9577, 2016www.atmos-chem-phys.net/16/9563/2016/doi:10.5194/acp-16-9563-2016© Author(s) 2016. CC Attribution 3.0 License.
Trends in normalized difference vegetation index (NDVI) associatedwith urban development in northern West SiberiaIgor Esau1, Victoria V. Miles1, Richard Davy1, Martin W. Miles2, and Anna Kurchatova3
1Nansen Environmental and Remote Sensing Centre/Bjerknes Centre for Climate Research, Bergen, Norway2Uni Research Climate/Bjerknes Centre for Climate Research, Bergen, Norway, Institute of Arctic and Alpine Research,University of Colorado, Boulder, Colorado, USA3Institute of the Earth’s Cryosphere, Tyumen Oil and Gas University, Tyumen, Russia
Correspondence to: Igor Esau ([email protected])
Received: 17 January 2016 – Published in Atmos. Chem. Phys. Discuss.: 18 March 2016Revised: 21 June 2016 – Accepted: 27 June 2016 – Published: 1 August 2016
Abstract. Exploration and exploitation of oil and gas re-serves of northern West Siberia has promoted rapid indus-trialization and urban development in the region. This devel-opment leaves significant footprints on the sensitive northernenvironment, which is already stressed by the global warm-ing. This study reports the region-wide changes in the veg-etation cover as well as the corresponding changes in andaround 28 selected urbanized areas. The study utilizes thenormalized difference vegetation index (NDVI) from high-resolution (250 m) MODIS data acquired for summer months(June through August) over 15 years (2000–2014). The re-sults reveal the increase of NDVI (or “greening”) over thenorthern (tundra and tundra-forest) part of the region. Simul-taneously, the southern, forested part shows the widespreaddecrease of NDVI (or “browning”). These region-wide pat-terns are, however, highly fragmented. The statistically sig-nificant NDVI trends occupy only a small fraction of the re-gion. Urbanization destroys the vegetation cover within thedeveloped areas and at about 5–10 km distance around them.The studied urbanized areas have the NDVI values by 15 to45 % lower than the corresponding areas at 20–40 km dis-tance. The largest NDVI reduction is typical for the newlydeveloped areas, whereas the older areas show recovery ofthe vegetation cover. The study reveals a robust indicationof the accelerated greening near the older urban areas. ManySiberian cities become greener even against the wider brown-ing trends at their background. Literature discussion suggeststhat the observed urban greening could be associated not onlywith special tending of the within-city green areas but also
with the urban heat islands and succession of more produc-tive shrub and tree species growing on warmer sandy soils.
1 Introduction
Significant shifts in the vegetation land cover and biologi-cal productivity manifest rapid climate change in the north-ern high latitudes (Hinzman et al., 2005; Groisman and Gut-man, 2013). As in other polar regions, biomes of northernWest Siberia (Fig. 1), hereafter referred to as NWS, respondto global warming with complex patterns of multidirectionalchanges (Bunn and Goetz, 2006; Lloyd and Bunn, 2007;MacDonald et al., 2008; Walker et al., 2009; Bhatt et al.,2013). Although the patterns are geographically fragmented(Elsakov and Teljatnikov, 2013; Barichivich et al., 2014;Guay et al., 2014), the northern biomes (tundra and forest-tundra) demonstrate widespread increase of the vegetationproductivity (“greening”). Its attribution to tall shrub andgraminoids in tundra ecosystems (Frost and Epstein, 2014)and enhanced tree growth in forest-tundra ecosystems (Ur-ban et al., 2014) suggested that we observe transitions to al-ternative, potentially more productive ecosystems rather thananomalously enhanced biological productivity in response toglobal warming (Kumpula et al., 2012; Macias-Fauria et al.,2012). These environmental shifts have been unfolding for atleast the last 3 decades (Keeling et al., 1996; Myneni et al.,1997) albeit at a slower pace since 2003 (Bhatt et al., 2013).
Simultaneously, the southern biomes (northern and mid-dle taiga forest to the south of about 65◦ N) demonstrate de-
Published by Copernicus Publications on behalf of the European Geosciences Union.
9564 I. Esau et al.: Trends in normalized difference vegetation index
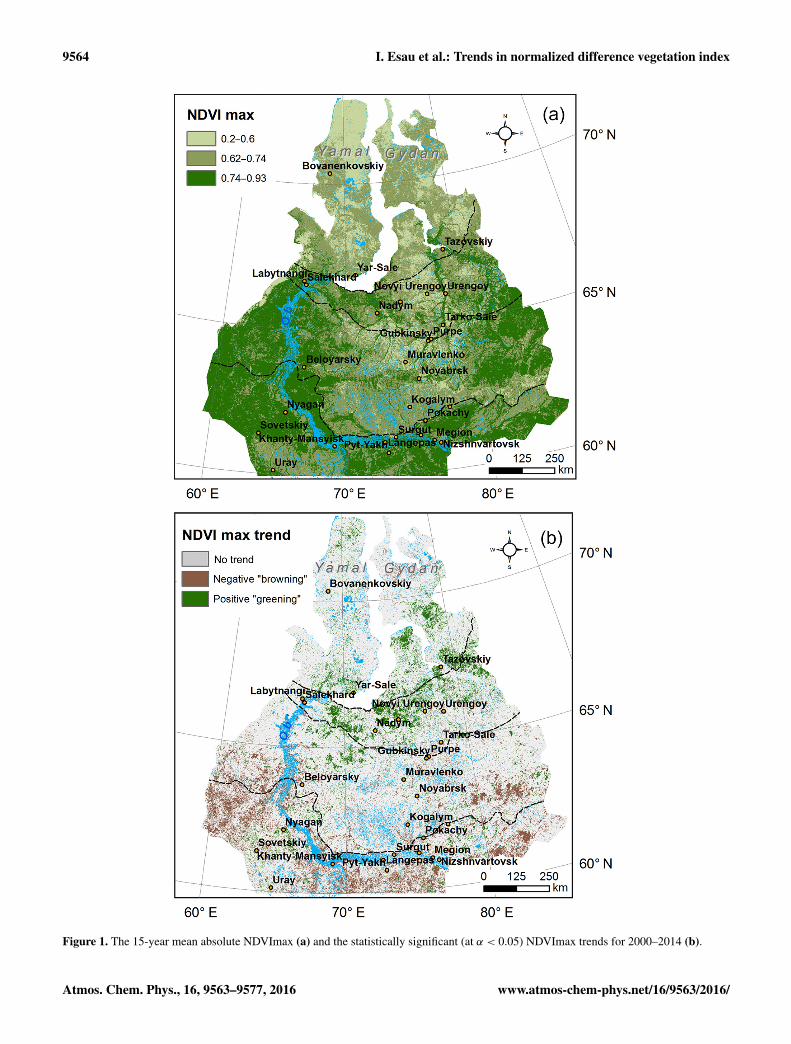
Figure 1. The 15-year mean absolute NDVImax (a) and the statistically significant (at α < 0.05) NDVImax trends for 2000–2014 (b).
Atmos. Chem. Phys., 16, 9563–9577, 2016 www.atmos-chem-phys.net/16/9563/2016/

I. Esau et al.: Trends in normalized difference vegetation index 9565
crease of productivity (“browning”). This browning has beenrobustly associated with decreasing mass of the green leaves,which has been linked to Siberian forest acclimation with-out the transition to an alternative ecosystem (Lapenis et al.,2005; Lloyd and Bunn, 2007). Although the grown trees arestressed by increasing temperatures, other types of vegetationcover (grass- and shrub-lands, mires) and disturbed patcheswith young tree seedlings exhibit greening within the samebioclimatic zone.
The persistent greening trends of the disturbed vegetationcover are the focus of this study. Over the last 30–50 years,exploration of oil and gas reserves promoted rapid industri-alization and urban development of NWS. It makes this partof the circumpolar region particularly interesting for stud-ies of the emerging alternative ecosystems. The developmenthas left significant footprints on the vegetation cover. Thesefootprints were found not only at the development sites butalso across large distances (Walker et al., 2009; Kumpulaet al., 2012). More specifically, Kumpula et al. (2011) re-ported extensive transformation from shrub- to more produc-tive (greener) grass- and sedge-dominated tundra in NWSthat reclaim artificial terrain disturbances at Bovanenkovskiygas field, Yamal peninsula (70◦ N). Similar environmentalshifts towards more productive plant successions on dis-turbed patches were found in studies of post-mined sand andsandy loam quarries around Noyabrsk at 63◦ N (Koronatovaand Milyaeva, 2011). This transformation across open wood-lands and forest-tundra was found to be more ambiguous. A26 % (from 2316 to 1715 g m−2) decrease of the total above-ground biomass has been attributed to enhanced bog for-mation on the background of widespread greening of betterdrained sandy patches (Moskalenko, 2013). A detailed studyby Sorokina (2003) revealed the increased soil temperatureby 1 to 4 K on the disturbed patches within forest, mire andtundra ecosystems. The reclaiming vegetation cover is char-acterized by increasing share of shrubs (from 18.5 to 27.8 %in the forest ecosystems) and grasses (from less than 0.1 to8.8 %) in its above-ground biomass.
Although disturbed patches occupy a relatively small frac-tion in NWS, their contribution to the observed vegetationproductivity changes can be disproportionally significant.For example, for the Yamal peninsula, Elsakov and Tel-jatnikov (2013) concluded that its widely referred green-ing (Macias-Fauria et al., 2012) could be traced to statisti-cally significant changes over just 4.8 % of the total area.Moreover, this greening was linked to shrub growth on thepatches with disturbed permafrost or within the patches ofalready established shrubs (Walker et al., 2009). Barichivichet al. (2014) noted that browning in southern forest biomescould also be partially associated with disturbances.
The reviewed literature widely agrees that the observedtransformation of vegetation cover represents an alterna-tive ecosystem state (Kumpula et al., 2012; Macias-Fauriaet al., 2012) and a new geoecological regime (Raynoldset al., 2014) acclimated to higher temperatures that are
likely to persist. This point of view received strong supportfrom the plot-scale International Arctic Tundra Experiment,which simulated warmer climate conditions in high latitudes(Walker et al., 2006; Elmendorf et al., 2012). The questionremains whether the plot-scale experiments and field stud-ies at a few carefully selected locations, e.g., Vaskiny Dachiin the central Yamal peninsula (Leibman et al., 2015), couldbe extrapolated for assessment of the larger scale transitionto alternative ecosystems. To approach this question, we usean opportunity provided by the above-mentioned intensiveurbanization in NWS. The urbanization created a large num-ber of relatively large-scale (tens of kilometers across) ar-tificial disturbances across all major regional biomes. Thisstudy looks at systematic differences in the apparent vegeta-tion productivity trends between the undisturbed backgroundand the areas disturbed by urbanization and industrial devel-opment.
As in several previously published studies, this study uti-lizes a normalized difference vegetation index (NDVI) de-rived from satellite data products from the Moderate Reso-lution Imaging Spectroradiometer (MODIS) onboard of theEarth Observing System-Terra platform satellite. Studies byFrey and Smith (2007), Epstein et al. (2012), Macias-Fauriaet al. (2012) and others demonstrated that MODIS NDVIcould be successfully used in vegetation productivity assess-ment for Siberian biomes. This study details the previouslyreported NDVI maps of the region and expands them over thelast 15 years (2000–2014) period. The vegetation productiv-ity of emerging alternative ecosystems is calculated at andaround of 28 urbanized areas, hereafter referred to as cities.These 28 cities are located in four northern biomes rangingfrom tundra (Bovanenkovo) to middle taiga forest (Uray).
This paper has the following structure: Data and meth-ods of the study are described in Sect. 2. Section 3 presentsthe analysis and results for both the background changes inNDVI and NDVI in and around the selected cities. Section 4discusses the results in the context on previous research andemphasize the role of the cities. Section 5 outlines conclu-sions.
2 Data and methods
This study is based on analysis of the maximum summerNDVI, which we denote as NDVImax. NDVImax was ob-tained from MODIS NDVI 16-day composites with the250 m spatial resolution (MOD13Q1). The data were down-loaded from the NASA’s Earth Observing System Data andInformation System (EOSDIS) for 15 summers (June–July–August, JJA) covering the period 2000–2014.
www.atmos-chem-phys.net/16/9563/2016/ Atmos. Chem. Phys., 16, 9563–9577, 2016
9566 I. Esau et al.: Trends in normalized difference vegetation index
2.1 The maximum normalized difference vegetationindex, NDVImax
NDVI is defined as a normalized ratio of reflectance factorsin the near infrared (NIR) and red spectral radiation bands
NDVI=ρNIR− ρRED
ρNIR+ ρRED, (1)
where ρNIR and ρRED are the surface bidirectional reflectancefactors for their respective MODIS bands on the TERRAplatform satellite. NDVI exploits the contrast between the redand NIR reflectance of vegetation, as chlorophyll is a strongabsorber of the red light, while the internal structure of leavesreflects highly in the NIR. The greater the difference betweenthe reflectance in the red and NIR portions of the spectrum,the more chlorophyll is found in vegetation canopy. Vegeta-tion generally yields positive NDVI values, which approach+1 with increasing plant chlorophyll content or green above-ground biomass. NDVI with the values below 0.2 generallycorresponds to non-vegetated surfaces, whereas green vege-tation canopies have NDVI greater than 0.3.
NDVI in remote-sensing studies is a popular proxy forgross photosynthesis, and therefore, for vegetation produc-tivity (Goetz et al., 2005). A strength of NDVI is its nor-malization, which makes it relatively insensitive to radio-metric attenuation (e.g., by cloud shadows) present in mul-tiple bands. The main weakness of NDVI is its inherent non-linearity that leads to asymptotic saturation of NDVI overhigher biomass conditions. This saturation, also known asthe NDVI degradation, is particularly strong in the areas withhigher canopy background brightness corresponding to themost productive biomes. By contrast, the biomass accumu-lation in the less productive biomes could be approximatedwith a linear regression model. NDVI typically does not de-grade in tundra (Raynolds et al., 2012), but the degradationshould be empirically taken into account in NDVI interpreta-tions for more southern biomes (D’Arrigo et al., 2000; Zhanget al., 2004).
A remarkably strong correlation (R2= 0.94, p < 0.001)
was found between total above-ground phytomass sampledat the peak of summer and the maximum annual NDVI(NDVImax) in studies of the North America and Eurasiatransects (Raynolds et al., 2012). This strong relationship en-couraged us to use NDVImax in this study. NDVImax is amore conservative characteristic of the vegetation cover thatis linked to the total biomass at the late phenological phases.Moreover, NDVImax eliminates seasonal variations and therelative shifts between phenological phases in different cli-matic zones. Hence, NDVImax is particularly convenient forand frequently used in the environmental studies dealing withlong-term and large-scale changes, including effects of theclimate change.
NDVImax was obtained from MOD13Q1 data product.This product is distributed in adjacent non-overlapping tileswith the side of approximately 10◦ (at the equator) and the Si-
nusoidal (SIN) tile grid projection (Solano et al., 2010). Fivetiles to cover the entire area of interest (total 20 tiles per eachsummer) were downloaded and imported into the ArcGIS ge-ographic information system. Images were combined and re-projected from the original SIN to the Universal TransverseMercator projection (UTM Zone 42N, WGS84 ellipsoid).The data were quality-filtered by the MODIS reliability dataprovided together with the MOD13Q1 product. Only dataof the highest quality, which excluded snow/ice- and cloudcovered pixels, were retained. The NDVI> 0.3 criterion wasused here to exclude water, bare soil and other non-vegetatedpixels from the analysis. The data gaps in the raster mosaicpixels were then filled with information using the nearestneighbor statistical interpolation from the surrounding pixelswith data. Finally, NDVImax maps for each summer wereobtained through identification of the maximum NDVI valuefrom each 16-day composite for each pixel. The analysis op-erates with these NDVImax maps of the 250 m resolutioncovering the 15 year period 2000–2014.
2.2 NDVImax in and around selected cities
The NWS territory provides a unique opportunity for statis-tical study, which compares the effect of recent urbanizationalong with the effect on the climate change on the vegeta-tion land cover in and around cities across several north-ern biomes. Twenty-eight (28) cities, some of them withmore than 100 000 inhabitants (see Table 1), were selected.NDVImax was studied within 40 km buffer zones aroundeach city. Each buffer zone was broken into 8 rings of 5 kmwidth centered at the city core zone. This approach is similarto one used by Zhang et al. (2004).
Let us introduce < NDVImax(t, i,n) > as the NDVImaxvalue in the year t = 1. . .15 for the ring number i = 0. . .8(the ring i = 0 corresponds to the city core and i = 8 –to the most distant background ring) in the city n= 1. . .28that is averaged over all pixels within the ring. This ap-proach does not differentiate between the vegetation pro-ductivity changes and the changes of the vegetation biolog-ical composition (succession). In this sense, it will be in-sensitive to the NDVImax trends due to urban expansion,shifting vegetation disturbances and re-vegetation. As the< NDVImax(t, i,n) > values strongly vary from city to cityand across different biomes, it is convenient to introduce arelative footprint of a city as
F (t, i,n)=< NDVImax(t, i,n) >
< NDVImax(i,n) >(2)
and the relative linear trends, R(i,n), which are computedby the least-squares fit of F (t, i,n) to the first-order poly-nomial for the ring i in the city n, < NDVImax(i,n) > istime-averaged< NDVImax(t, i,n) >. Because the study op-erates with rather short 15-year time series, the years with themaximum and the minimum NDVImax can strongly impactthe trends. These 2 years (2002 and 2014 for the majority
Atmos. Chem. Phys., 16, 9563–9577, 2016 www.atmos-chem-phys.net/16/9563/2016/

I. Esau et al.: Trends in normalized difference vegetation index 9567
Table 1. List of 28 urban and industrial areas (cities) considered in this study. The city population (pop. in thousands inhabitants) is estimatedaccording to the Russian national census for 2010. The mean background NDVImax (nature) is given for the most distant 40 km ring. Therelative trends are given for the time series without the years with the minimum and maximum NDVImax. Statistically significant trends at95 % level are underlined. The biomes are abbreviated as tundra (T); forest-tundra (FT); norther taiga forest (NTF); and middle taiga forest(MTF).
N City Coord. Pop. Biome Mean NDVImax NDVImax trend (nature) Mean NDVImax NDVImax trendname (×1000) (nature) [% dec−1] (city core) (city core) [% dec−1]
1 Beloyarsky 63◦42′ N66◦40′ E
↓49 NTF 0.78 −0.6 % 0.65 +3.0 %
2 Bovanenkovskiy 70◦21′ N68◦32′ E
2–6 T 0.65 +1.4% 0.57 –10 %
3 Gubkinsky 64◦26′ N76◦27′ E
↓26 FT 0.65 −1.1 % 0.53 +1.1 %
4 Khanty-Mansyisk 61◦48′ N69◦10′ E
↑93 MTF 0.78 −2.6 % 0.62 −3.0 %
5 Kogalym 62◦14′ N74◦32′ E
↑61 MTF 0.69 −1.3 % 0.65 −2.0 %
6 Labytnangi 66◦39′ N66◦25′ E
↑26 FT 0.75 −2.0 % 0.60 +6.0 %
7 Langepas 61◦15′ N75◦10′ E
↑43 MTF 0.77 −1.9 % 0.72 +1.4 %
8 Megion 61◦22′ N76◦06′ E
↓49 MTF 0.77 +0.8 % 0.52 +6.9 %
9 Muravlenko 63◦47′ N74◦31′ E
↓33 NTF 0.65 −1.0 % 0.47 −3.6 %
10 Nadym 65◦32′ N72◦31′ E
↓46 NTF 0.71 +1.2 % 0.55 −1.8 %
11 Nefteugansk 61◦55′ N72◦36′ E
↓126 MTF 0.76 −2.1 % 0.56 −3.0 %
12 Nizshnvartovsk 60◦56′ N76◦33′ E
↓266 MTF 0.78 −1.8 % 0.60 –4.7 %
13 Novyi Urengoy 66◦05′ N76◦04′ E
↓116 NTF 0.63 +4.0 % 0.54 +3.8 %
14 Noyabrsk 63◦11′ N75◦27′ E
↓107 MTF 0.69 No change 0.60 +0.6 %
15 Nyagan 62◦08′ N65◦24′ E
↑56 MTF 0.79 −0.7 % 0.59 +4.6 %
16 Pangody 65◦51′ N74◦31′ E
↑11 FT 0.68 +3.6 % 0.49 −2.1 %
17 Pokachy 61◦44′ N75◦35′ E
↑17 MTF 0.74 −1.5 % 0.53 +1.6 %
18 Purpe 64◦29′ N76◦42′ E
↓10 FT 0.67 −0.4 % 0.49 –4.3 %
19 Pyt-Yakh 60◦44′ N72◦49′ E
↑41 MTF 0.81 −2.0 % 0.67 +1.1 %
20 Raduzhnyi 62◦06′ N77◦28′ E
↓43 MTF 0.72 −1.5 % 0.65 −0.3 %
21 Salekhard 66◦31′ N66◦36′ E
↑48 FT 0.75 −0.9 % 0.54 +5.5 %
22 Sovetskiy 61◦21′ N63◦34′ E
↑28 MTF 0.79 −0.6 % 0.57 0.9 %
23 Surgut 61◦15′ N73◦24′ E
↑332 MTF 0.75 −2.4 % 0.53 −0.2 %
24 Tarko-Sale 64◦55′ N77◦47′ E
↑21 FT 0.69 −0.6 % 0.51 –5.9 %
25 Tazovskiy 67◦28′ N78◦42′ E
↓7 NTF 0.73 +1.5 % 0.63 +7.6 %
26 Uray 60◦07′ N64◦46′ E
↑40 MTF 0.76 −0.2 % 0.67 +0.5 %
27 Urengoy 65◦57′ N78◦21′ E
↓11 FT 0.68 −1.0 % 0.55 −2.1 %
28 Yar-Sale 66◦52′ N70◦49′ E
↓7 T 0.66 +3.9 % 0.52 −2.8 %
www.atmos-chem-phys.net/16/9563/2016/ Atmos. Chem. Phys., 16, 9563–9577, 2016
9568 I. Esau et al.: Trends in normalized difference vegetation index
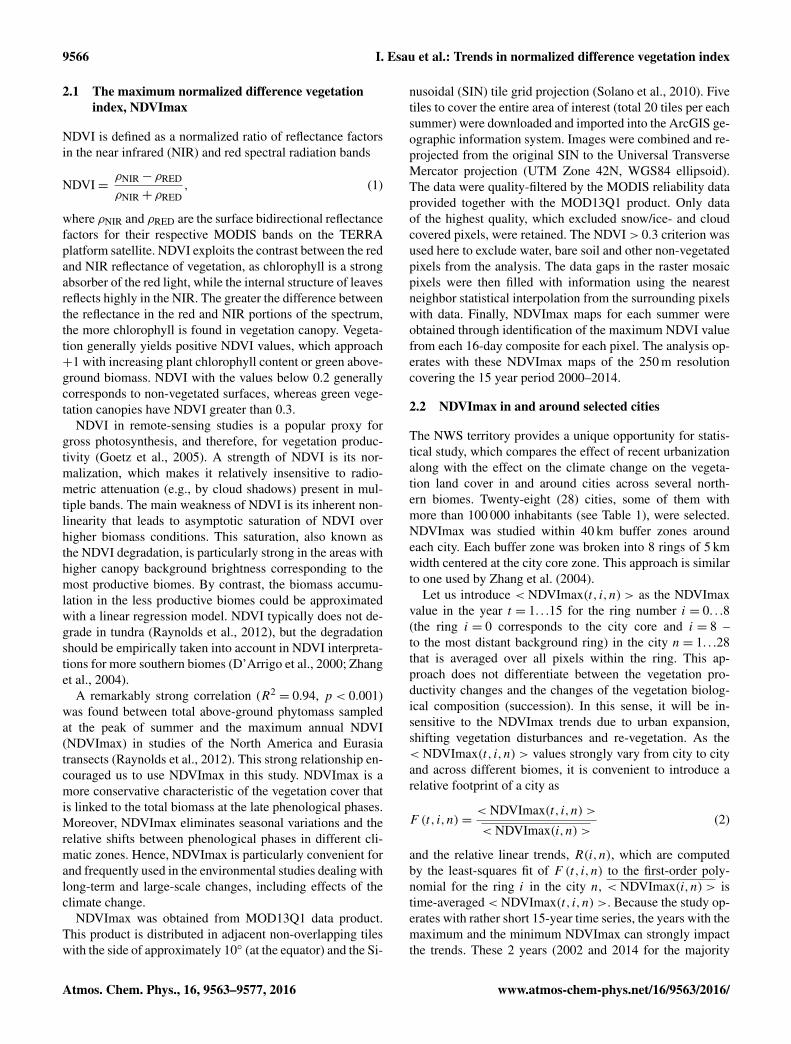
Figure 2. Total fractional areas of NDVImax changes for classes asdefined in Table 2.
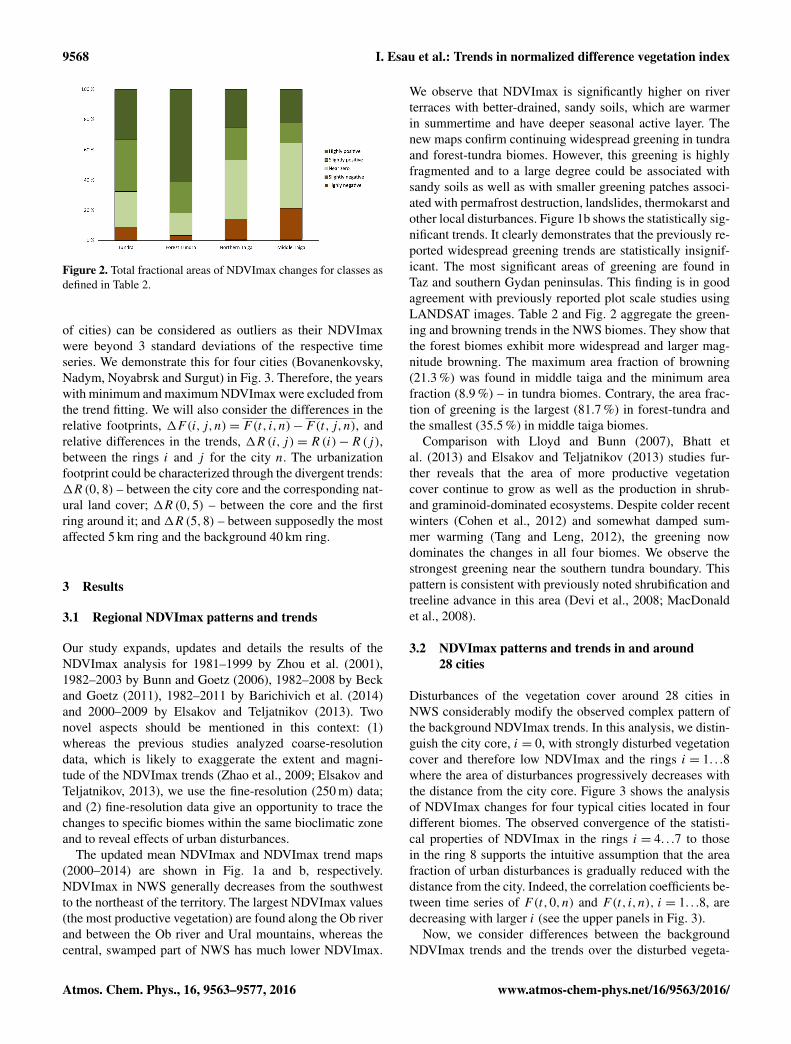
of cities) can be considered as outliers as their NDVImaxwere beyond 3 standard deviations of the respective timeseries. We demonstrate this for four cities (Bovanenkovsky,Nadym, Noyabrsk and Surgut) in Fig. 3. Therefore, the yearswith minimum and maximum NDVImax were excluded fromthe trend fitting. We will also consider the differences in therelative footprints, 1F(i,j,n)= F(t, i,n)−F(t,j,n), andrelative differences in the trends, 1R(i,j)= R(i)−R(j),between the rings i and j for the city n. The urbanizationfootprint could be characterized through the divergent trends:1R(0,8) – between the city core and the corresponding nat-ural land cover; 1R(0,5) – between the core and the firstring around it; and 1R(5,8) – between supposedly the mostaffected 5 km ring and the background 40 km ring.
3 Results
3.1 Regional NDVImax patterns and trends
Our study expands, updates and details the results of theNDVImax analysis for 1981–1999 by Zhou et al. (2001),1982–2003 by Bunn and Goetz (2006), 1982–2008 by Beckand Goetz (2011), 1982–2011 by Barichivich et al. (2014)and 2000–2009 by Elsakov and Teljatnikov (2013). Twonovel aspects should be mentioned in this context: (1)whereas the previous studies analyzed coarse-resolutiondata, which is likely to exaggerate the extent and magni-tude of the NDVImax trends (Zhao et al., 2009; Elsakov andTeljatnikov, 2013), we use the fine-resolution (250 m) data;and (2) fine-resolution data give an opportunity to trace thechanges to specific biomes within the same bioclimatic zoneand to reveal effects of urban disturbances.
The updated mean NDVImax and NDVImax trend maps(2000–2014) are shown in Fig. 1a and b, respectively.NDVImax in NWS generally decreases from the southwestto the northeast of the territory. The largest NDVImax values(the most productive vegetation) are found along the Ob riverand between the Ob river and Ural mountains, whereas thecentral, swamped part of NWS has much lower NDVImax.
We observe that NDVImax is significantly higher on riverterraces with better-drained, sandy soils, which are warmerin summertime and have deeper seasonal active layer. Thenew maps confirm continuing widespread greening in tundraand forest-tundra biomes. However, this greening is highlyfragmented and to a large degree could be associated withsandy soils as well as with smaller greening patches associ-ated with permafrost destruction, landslides, thermokarst andother local disturbances. Figure 1b shows the statistically sig-nificant trends. It clearly demonstrates that the previously re-ported widespread greening trends are statistically insignif-icant. The most significant areas of greening are found inTaz and southern Gydan peninsulas. This finding is in goodagreement with previously reported plot scale studies usingLANDSAT images. Table 2 and Fig. 2 aggregate the green-ing and browning trends in the NWS biomes. They show thatthe forest biomes exhibit more widespread and larger mag-nitude browning. The maximum area fraction of browning(21.3 %) was found in middle taiga and the minimum areafraction (8.9 %) – in tundra biomes. Contrary, the area frac-tion of greening is the largest (81.7 %) in forest-tundra andthe smallest (35.5 %) in middle taiga biomes.
Comparison with Lloyd and Bunn (2007), Bhatt etal. (2013) and Elsakov and Teljatnikov (2013) studies fur-ther reveals that the area of more productive vegetationcover continue to grow as well as the production in shrub-and graminoid-dominated ecosystems. Despite colder recentwinters (Cohen et al., 2012) and somewhat damped sum-mer warming (Tang and Leng, 2012), the greening nowdominates the changes in all four biomes. We observe thestrongest greening near the southern tundra boundary. Thispattern is consistent with previously noted shrubification andtreeline advance in this area (Devi et al., 2008; MacDonaldet al., 2008).
3.2 NDVImax patterns and trends in and around28 cities
Disturbances of the vegetation cover around 28 cities inNWS considerably modify the observed complex pattern ofthe background NDVImax trends. In this analysis, we distin-guish the city core, i = 0, with strongly disturbed vegetationcover and therefore low NDVImax and the rings i = 1. . .8where the area of disturbances progressively decreases withthe distance from the city core. Figure 3 shows the analysisof NDVImax changes for four typical cities located in fourdifferent biomes. The observed convergence of the statisti-cal properties of NDVImax in the rings i = 4. . .7 to thosein the ring 8 supports the intuitive assumption that the areafraction of urban disturbances is gradually reduced with thedistance from the city. Indeed, the correlation coefficients be-tween time series of F(t,0,n) and F(t, i,n), i = 1. . .8, aredecreasing with larger i (see the upper panels in Fig. 3).
Now, we consider differences between the backgroundNDVImax trends and the trends over the disturbed vegeta-
Atmos. Chem. Phys., 16, 9563–9577, 2016 www.atmos-chem-phys.net/16/9563/2016/

I. Esau et al.: Trends in normalized difference vegetation index 9569
Figure 3. The statistical structure of NDVImax, correlations and trends at the city-core and the eight rings in the buffer zones of Bova-nenkovskiy (tundra), Nadym (tundra-forest), Noyabrsk (northern taiga) and Surgut (middle taiga). The distance is given in kilometers fromthe central pixel of each city core. The upper panels for each city show the decay of correlations (extreme years were excluded from the cal-culation) between the NDVImax variations at the city core and in the corresponding distance. The lower panels show bold line with squares– the mean NDVImax; dark gray rectangle – 1 standard deviation of NDVImax for each ring; light gray rectangles – 3 standard deviations;triangles – the years with the maximum (upward-looking triangle) and the minimum (downward-looking triangle) of NDVImax; verticalblack line with white circle – the magnitude of the NDVImax change obtained as the trend multiplied by 15 years; black circle – the same asthe white circle but for the trends obtained when the maximum and the minimum NDVImax were excluded.
Table 2. Fractional areas of the NDVImax changes for 2000–2014 in four NWS biomes
NDVImax change Tundra Forest Tundra Northern Taiga Middle Taiga
Highly negative ≤−0.006 0.28 % 0.18 % 0.73 % 1.05 %Slightly negative −0.006 to −0.003 8.58 % 3.12 % 13.48 % 20.25 %Near zero −0.003 to 0.003 23.56 % 15.01 % 39.19 % 43.18 %Slightly positive 0.003 to 0.006 34.25 % 20.33 % 21.38 % 13.16 %Highly positive 0.006< 33.33 % 61.36 % 25.22 % 22.36 %
tion cover in and around the cities. Figure 4a and c showthat all cities have strongly reduced NDVImax values. Somecities have NDVImax reduced by more than 30 % as com-pared to the background. As it has been already suggested byFig. 3 (for Nadym and, particularly, for Noyabrsk), the clos-est 5 km ring (i = 1) often exhibits higher NDVImax thanthe more distant background. This unusual feature could betraced down to the preferential location of the cities on gen-
erally greener river terraces. So that the greener patches con-tribute more heavily to the mean NDVImax of the inner rings.
Apart from lower NDVImax in the city cores, Fig. 4dreveals two opposite dependences between the vegetationdisturbance and the vegetation productivity. The cities withlarger relative NDVImax reduction (the large negative 1F)demonstrate the accelerated NDVImax recovery (the largepositive 1R). This rapid recovery at the initial stages of the
www.atmos-chem-phys.net/16/9563/2016/ Atmos. Chem. Phys., 16, 9563–9577, 2016

9570 I. Esau et al.: Trends in normalized difference vegetation index
Figure 4. The relative changes 1F(i,j) (x axis) and 1R(i,j) (y axis) given in percentage for (a) the city core (i = 0) and the closest 5 kmring (j = 1); (b) the closest (i = 1) and the most distant background (j = 8) rings; and (c) the city core (i = 0) and the ring (j = 8). Thenumbers were obtained for the time series without the years of the maximum and minimum NDVImax. Panel (d) shows the same as (c) butfor the full 15-year time series. The circle color indicates blue – tundra; cyan – forest-tundra; green – northern taiga; red – middle taiga. Thecircle size indicates the city population in 2005 as shown on panel (d). The gray shading shows the statistical confidence envelopes (99 % –dark gray shading; 95 % – light gray shading).
vegetation succession has been repeatedly noted in severalplot-scale studies (Sorokina, 2003; Archegova, 2007; Ko-ronatova and Milyaeva, 2011) and high-resolution satelliteimage analyses (Kornienko and Yakubson, 2011; Kumpulaet al., 2011). Unfortunately, the majority of these studieshave been published in Russian only. Intercomparison withFig. 4c, where this dependence is less pronounced, suggeststhat the vegetation cover in cities is more resistant to thestress in the extreme warm and cold years. Moreover, the pro-tecting effect of the city is stronger for the northern cities re-sponding with strong greening due to extremely warm sum-mer temperatures.
It is interesting to observe that the effect of cities does notexhibit clear regular dependence on the city population orspecific location. The only visible effect in Fig. 4a could beattributed to the age of the city – the younger northern citiescontinue to destroy vegetation cover as they expand, whereasthe vegetation cover in the established southern cities recov-ers. Figure 4b shows that the disturbances have the largestpositive effect on both the mean NDVImax and its trends inthe forest-tundra biome. Here, 6 out of 7 cities induce theaccelerated greening in the 5-km ring.
Figure 5. Aggregated NDVImax for 5 km (closest to the city core),15 and 40 km (the most distant background) rings around the citiesin the corresponding four biomes.
The biome-averaged impact of the urban disturbances onNDVImax is given in Fig. 5. The analysis shows that the cityfootprint is visible at large distances. Even at the 15 km dis-tance from the city core, NDVImax is systematically higherin the northern biomes and lower in the middle taiga biome.Moreover, NDVImax is also systematically the highest inthe closest 5-km ring where the area of disturbances is thelargest. Figure 6 illustrates the vegetation changes leading to
Atmos. Chem. Phys., 16, 9563–9577, 2016 www.atmos-chem-phys.net/16/9563/2016/

I. Esau et al.: Trends in normalized difference vegetation index 9571
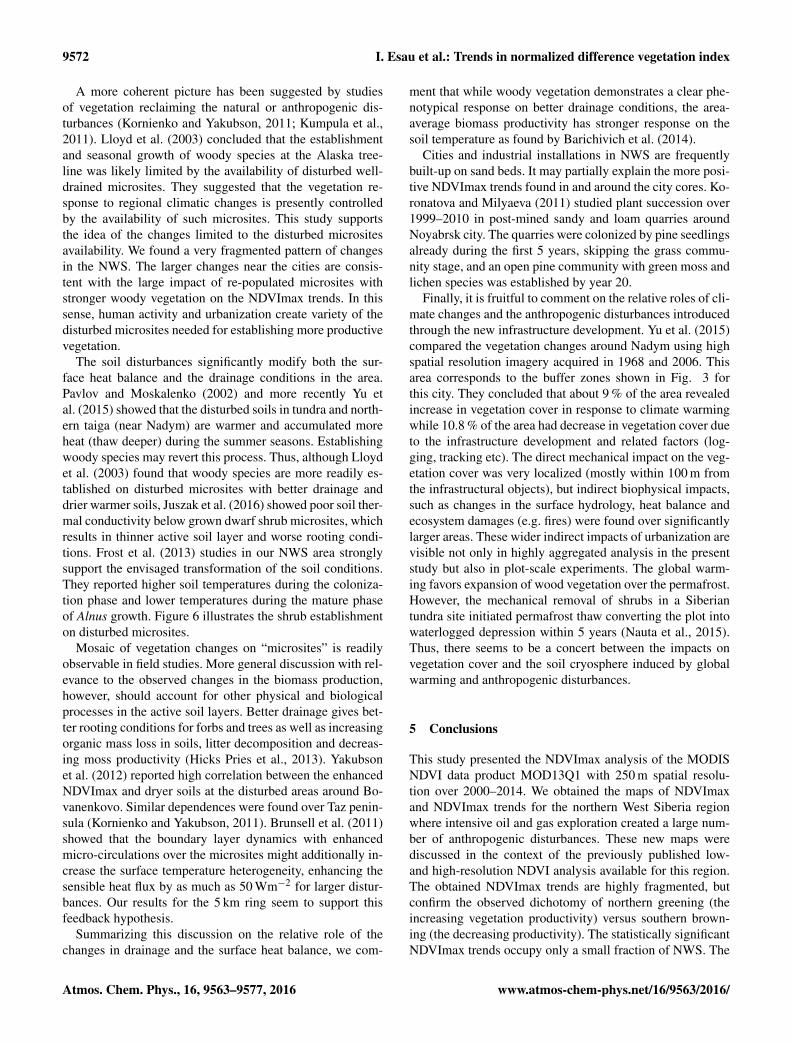
Figure 6. Illustration of the alternative ecosystem development on anthropogenically disturbed patches. The vegetation cover changes alongthe gas pipeline Nadym-Punga.
higher biological productivity of the disturbed land patchesin the northern biomes. The newly established tree seedlingsand shrubs, which are more productive relative to the back-ground in the northern biomes, are less productive relative tothe background of the mature trees in the middle taiga biome.
4 Discussion
The results of the presented high-resolution NDVImax anal-ysis in 2000–2014 show continuing changes in the vegetationland cover and vegetation productivity in NWS. In general,the northern biomes (tundra and forest-tundra north of about65◦ N) and to some degree open swamped areas within theforest biomes demonstrate persistent greening, whereas theforested areas showed similarly persistent browning. Moredetailed analysis has however revealed that the statisticallysignificant changes are highly fragmented. Such changes oc-cupy only a minor fraction of NWS and often could be col-located with natural or anthropogenic disturbances of thevegetation cover. This observation lead Macias-Fauria etal. (2012) and Kumpula et al. (2012) to hypothesize thatthose disturbances help to establish alternative, more pro-ductive ecosystems of graminoids, shrubs and tree seedlings.In this discussion, we consider the major climatological andphysical factors that may support the alternative vegetationcover.
The cold continental climates of the NWS (the Köppen–Geiger climate types Dfc and ET) with relatively highamount of annual precipitation determine a short growingseason and strong dependence of the maximum vegetationproductivity on summer temperatures (Barichivich et al.,2014). This dependence is not of universal character acrossbiomes. The higher spring–summer temperatures (Bhatt etal., 2013; Ippolitov et al., 2014) and larger amount of ac-cumulated snow (Bulygina et al., 2011) favor the tall de-ciduous shrub (Betula nana and different Salix species) intundra and forest-tundra (e.g Sturm et al., 2001; Elmen-dorf et al., 2012). Similarly, grasses (graminoids) respond
on higher spring temperatures with higher biomass produc-tion. It should be emphasized however that the associationsbetween the NDVImax trends and productivity of the spe-cific ecosystems within the arctic biomes remain rather loose(Frey and Smith, 2007; Kornienko and Yakubson, 2011).Moreover, even synthetic NDVImax time series (Guay et al.,2014) are too short and too variable for statistically robustconclusions over the major part of the area.
The response on the observed climate change is differ-ent in the forest biomes. Summertime surface air tempera-tures increased only weakly in central and southern NWS(Shulgina et al., 2011; Ippolitov et al., 2014) likely beingdamped by increasing cloud cover (Tang and Leng, 2012;Esau et al., 2012). The temperature trends in the wintermonths were negative (Cohen et al., 2012; Outten and Esau,2011; Outten et al., 2013). Thus, there were no consistentwarming trends over this territory but rather a few summerheat waves (e.g. in 2002, 2007, 2012) with certain impact onthe forest productivity.
As the reviewed literature discloses, the direct impact ofthe climate factors on the vegetation cannot be establishedunambiguously. Even conclusions derived from the analysisof common data sets differ on the relative role of the cli-mate change and the natural decadal variability. For example,Melnikov et al. (2004) concluded that the climatic trends areonly weakly discernable in the active soil layer data, whereasStreletsky et al. (2012) found a significant increase (up to0.3 m) of the active layer thickness. Moreover, simulationsof the forest biomass productivity with a stand-alone dy-namic vegetation model by Schumann and Shugart (2009)produced no significant productivity change at Siberian for-est sites for the warming below 2 K. At the same time, theobserved biome-wide dichotomy of the grass-covered areagreening versus the tree-covered area browning was repro-duced in the anthropogenic global warming experiments withthe Community Atmospheric Model version 3 with the Lund-Potsdam-Jena dynamic vegetation model (Jeong et al., 2012).
www.atmos-chem-phys.net/16/9563/2016/ Atmos. Chem. Phys., 16, 9563–9577, 2016
9572 I. Esau et al.: Trends in normalized difference vegetation index
A more coherent picture has been suggested by studiesof vegetation reclaiming the natural or anthropogenic dis-turbances (Kornienko and Yakubson, 2011; Kumpula et al.,2011). Lloyd et al. (2003) concluded that the establishmentand seasonal growth of woody species at the Alaska tree-line was likely limited by the availability of disturbed well-drained microsites. They suggested that the vegetation re-sponse to regional climatic changes is presently controlledby the availability of such microsites. This study supportsthe idea of the changes limited to the disturbed micrositesavailability. We found a very fragmented pattern of changesin the NWS. The larger changes near the cities are consis-tent with the large impact of re-populated microsites withstronger woody vegetation on the NDVImax trends. In thissense, human activity and urbanization create variety of thedisturbed microsites needed for establishing more productivevegetation.
The soil disturbances significantly modify both the sur-face heat balance and the drainage conditions in the area.Pavlov and Moskalenko (2002) and more recently Yu etal. (2015) showed that the disturbed soils in tundra and north-ern taiga (near Nadym) are warmer and accumulated moreheat (thaw deeper) during the summer seasons. Establishingwoody species may revert this process. Thus, although Lloydet al. (2003) found that woody species are more readily es-tablished on disturbed microsites with better drainage anddrier warmer soils, Juszak et al. (2016) showed poor soil ther-mal conductivity below grown dwarf shrub microsites, whichresults in thinner active soil layer and worse rooting condi-tions. Frost et al. (2013) studies in our NWS area stronglysupport the envisaged transformation of the soil conditions.They reported higher soil temperatures during the coloniza-tion phase and lower temperatures during the mature phaseof Alnus growth. Figure 6 illustrates the shrub establishmenton disturbed microsites.
Mosaic of vegetation changes on “microsites” is readilyobservable in field studies. More general discussion with rel-evance to the observed changes in the biomass production,however, should account for other physical and biologicalprocesses in the active soil layers. Better drainage gives bet-ter rooting conditions for forbs and trees as well as increasingorganic mass loss in soils, litter decomposition and decreas-ing moss productivity (Hicks Pries et al., 2013). Yakubsonet al. (2012) reported high correlation between the enhancedNDVImax and dryer soils at the disturbed areas around Bo-vanenkovo. Similar dependences were found over Taz penin-sula (Kornienko and Yakubson, 2011). Brunsell et al. (2011)showed that the boundary layer dynamics with enhancedmicro-circulations over the microsites might additionally in-crease the surface temperature heterogeneity, enhancing thesensible heat flux by as much as 50 Wm−2 for larger distur-bances. Our results for the 5 km ring seem to support thisfeedback hypothesis.
Summarizing this discussion on the relative role of thechanges in drainage and the surface heat balance, we com-
ment that while woody vegetation demonstrates a clear phe-notypical response on better drainage conditions, the area-average biomass productivity has stronger response on thesoil temperature as found by Barichivich et al. (2014).
Cities and industrial installations in NWS are frequentlybuilt-up on sand beds. It may partially explain the more posi-tive NDVImax trends found in and around the city cores. Ko-ronatova and Milyaeva (2011) studied plant succession over1999–2010 in post-mined sandy and loam quarries aroundNoyabrsk city. The quarries were colonized by pine seedlingsalready during the first 5 years, skipping the grass commu-nity stage, and an open pine community with green moss andlichen species was established by year 20.
Finally, it is fruitful to comment on the relative roles of cli-mate changes and the anthropogenic disturbances introducedthrough the new infrastructure development. Yu et al. (2015)compared the vegetation changes around Nadym using highspatial resolution imagery acquired in 1968 and 2006. Thisarea corresponds to the buffer zones shown in Fig. 3 forthis city. They concluded that about 9 % of the area revealedincrease in vegetation cover in response to climate warmingwhile 10.8 % of the area had decrease in vegetation cover dueto the infrastructure development and related factors (log-ging, tracking etc). The direct mechanical impact on the veg-etation cover was very localized (mostly within 100 m fromthe infrastructural objects), but indirect biophysical impacts,such as changes in the surface hydrology, heat balance andecosystem damages (e.g. fires) were found over significantlylarger areas. These wider indirect impacts of urbanization arevisible not only in highly aggregated analysis in the presentstudy but also in plot-scale experiments. The global warm-ing favors expansion of wood vegetation over the permafrost.However, the mechanical removal of shrubs in a Siberiantundra site initiated permafrost thaw converting the plot intowaterlogged depression within 5 years (Nauta et al., 2015).Thus, there seems to be a concert between the impacts onvegetation cover and the soil cryosphere induced by globalwarming and anthropogenic disturbances.
5 Conclusions
This study presented the NDVImax analysis of the MODISNDVI data product MOD13Q1 with 250 m spatial resolu-tion over 2000–2014. We obtained the maps of NDVImaxand NDVImax trends for the northern West Siberia regionwhere intensive oil and gas exploration created a large num-ber of anthropogenic disturbances. These new maps werediscussed in the context of the previously published low-and high-resolution NDVI analysis available for this region.The obtained NDVImax trends are highly fragmented, butconfirm the observed dichotomy of northern greening (theincreasing vegetation productivity) versus southern brown-ing (the decreasing productivity). The statistically significantNDVImax trends occupy only a small fraction of NWS. The
Atmos. Chem. Phys., 16, 9563–9577, 2016 www.atmos-chem-phys.net/16/9563/2016/
I. Esau et al.: Trends in normalized difference vegetation index 9573
most significant trends are found on the territories with sandysoils and with larger concentration of soil disturbances. Thus,the new map substantially corrects the previous picture ofthe vegetation cover changes in NWS and suggests strongerresilience of undisturbed vegetation cover to the climatechange on decadal timescales.
It has been proposed that the disturbances might help toestablish alternative, more productive vegetation cover. Weused NDVImax data in and around 28 regional urbanizedand industrial areas to compare the vegetation productivityof the reclaiming and background plant communities acrossall four major biomes. We assumed growing concentrationof disturbances towards the city cores. The results indicatedthat the reclaiming plant communities tend to be more pro-ductive. Only some cities in middle taiga biome, notably thelargest cities of Surgut and Niznevartovsk on the Ob river,exhibit lower productivity in the closest city proximity.
As it was expected, we found NDVImax at the city coresto be 15 to 40 % lower than over the corresponding back-ground. At the same time, many cities have become signifi-cantly greener over the analyzed 15 years. This tendency re-flects both the targeted efforts to create more environmentallyfriendly residential areas and the urban heat island impact onthe active soil layer thickness and drainage.
6 Data availability
MOD13Q1 data are freely available from https://lpdaac.usgs.gov/dataset_discovery/modis/modis_products_table/mod13q1 (last checked on 27 July 2016)and https://daac.ornl.gov/MODIS/MODIS-menu/modis_webservice.html (last checked on 27 July 2016). The pro-cessed data for this study are stored in MS EXEL files. Atpresent they are available from the corresponding author bye-mail request. All data and processed images will be madepublicly available at the project web site http://hiarc.nersc.noand through the ResearchGate (www.researchgate.net) afterthe end of the HIARC project.
www.atmos-chem-phys.net/16/9563/2016/ Atmos. Chem. Phys., 16, 9563–9577, 2016
9574 I. Esau et al.: Trends in normalized difference vegetation index
Appendix A: Statistical significance of inter-city analysis
The NDVImax data in and around the cities are very vari-able. In order to estimate the statistical significance of thedifference of multiple time series, we used a conservative hy-pothesis testing with the Student’s t-criterion. In this analy-sis, two statistical parameters are different at the confidencelevel 95 % (α = 1.96, the light gray shading in Figs. 3 and4) and 99 % (α = 2.58, the dark gray shading) assuming thenormal distribution of the difference errors when√
2N − 1
(σ (k,n)) > α, (A1)
where σ(k,n) is the standard deviation of a parameter in test-ing for the ring k and the city n. We want to stress that theconservative estimation is related to the differences, whichhave significantly larger magnitude than the variations ofNDVImax within each ring. Thus, the differences appear tobe more significant than the trends for each of the rings.There were found no significant trends at levels higher than90 % for any 5-km ring around any city.
Atmos. Chem. Phys., 16, 9563–9577, 2016 www.atmos-chem-phys.net/16/9563/2016/
I. Esau et al.: Trends in normalized difference vegetation index 9575
Acknowledgements. This study was supported by (1) the BelmontForum and the Norwegian Research Council grant HIARC:Anthropogenic Heat Islands in the Arctic: Windows to the Futureof the Regional Climates, Ecosystems, and Societies (no. 247268),(2) the Belmont Forum and the U.S. National Science Foundationgrant Collaborative Research: HIARC: Anthropogenic Heat Islandsin the Arctic: Windows to the Future of the Regional Climates,Ecosystems, and Societies (no. 1535845), and (3) the Centre forClimate Dynamics grant BASIC: Boundary Layers in the ArcticAtmosphere, Seas and Ice Dynamics.
Edited by: V.-M. KerminenReviewed by: A. Colpaert and one anonymous referee
References
Archegova, I. B.: Thermal regime of tundra soils under reclama-tion and restoration of natural vegetation, Eurasian Soil Sci+.,40, 854–859, 2007.
Barichivich, J., Briffa, K. R., Myneni, R., van der Schrier, G.,Dorigo, W., Tucker, C. J., Osborn, T. J., and Melvin, T. M.: Tem-perature and snow-mediated moisture controls of summer pho-tosynthetic activity in northern terrestrial ecosystems between1982 and 2011, Remote Sens., 6, 1390–1431, 2014.
Beck, P. and Goetz, S.: Satellite observations of high northern lat-itude vegetation productivity changes between 1982 and 2008:ecological variability and regional differences, Environ. Res.Lett., 6, 045501, doi:10.1088/1748-9326/6/4/045501, 2011.
Bhatt, U. S., Walker, D. A., Raynolds, M. K., Bieniek, P. A., Ep-stein, H. E., Comiso, J. C., Pinzon, J. E., Tucker, C. J., andPolyakov, I. V.: Recent declines in warming and vegetationgreening trends over pan-Arctic tundra, Remote Sens., 5, 4229–4254, 2013.
Brunsell, N. A., Mechem, D. B., and Anderson, M. C.: Sur-face heterogeneity impacts on boundary layer dynamics via en-ergy balance partitioning, Atmos. Chem. Phys., 11, 3403–3416,doi:10.5194/acp-11-3403-2011, 2011.
Bulygina, O., Groisman, P. Y., Razuvaev, V., and Korshunova, N.,:Changes in snow cover characteristics over Northern Eurasiasince 1966, Environ. Res. Lett., 6, 045204, doi:10.1088/1748-9326/6/4/045204, 2011.
Bunn, A. and Goetz, S.: Trends in Satellite-Observed Circumpo-lar Photosynthetic Activity from 1982 to 2003: The influence ofseasonality, cover type, and vegetation density, Earth Interact.,10, 1–19, 2006.
Cohen, J. L., Furtado, J. C., Barlow, M. A., Alexeev, V. A.,and Cherry, J. E.: Arctic warming, increasing snow cover andwidespread boreal winter cooling, Environ. Res. Lett., 7, 014007,doi:10.1088/1748-9326/7/1/014007, 2012.
d’Arrigo, R. D., Malmstrom, C. M., Jacoby, G. C., Los, S. O., andBunker, D. E.: Correlation between maximum latewood densityof annual tree rings and NDVI based estimates of forest produc-tivity, Int. J. Remote Sens., 21, 2329–2336, 2000.
Devi, N., Hagedorn, F., Moiseev, P., Bugmann, H., Shiyatov, S.,Mazepa, V., and Rigling, R.: Expanding forests and changinggrowth forms of Siberian larch at the Polar Urals treeline dur-ing the 20th century, Glob. Change Biol., 14, 1581–1591, 2008.
Elmendorf, S. C., Henry, G. H. R., Hollister, R. D., Björk, R. G.,Boulanger-Lapointe, N., Cooper, E. J., Cornelissen, J. H. C.,Day, T. A., Dorrepaal, E., Elumeeva, T. G., Gill, M., Gould, W.A., Harte, J., Hik, D. S., Hofgaard, A., Johnson, D. R., John-stone, J. F., Jónsdóttir, I. S., Jorgenson, J. C., Klanderud, K.,Klein, J. A., Koh, S., Kudo, G., Lara, M., Lévesque, E., Mag-nússon, B., May, J. L., Mercado-Diaz, J. A., Michelsen, A., Mo-lau, U., Myers-Smith, I. H., Oberbauer, S. F., Onipchenko, V.G., Rixen, C., Schmidt, N. M., Shaver, G. R., Spasojevic, M. J.,Bórhallsdóttir, B. E., Tolvanen, A., Troxler, T., Tweedie, C. E.,Villareal, S., Wahren, C.-H., Walker, X., Webber, P. J., Welker, J.M., and Wipf, S.: Plot-scale evidence of tundra vegetation changeand links to recent summer warming, Nature Climate Change, 2,453–457, 2012.
Elsakov, V. and Teljatnikov, M.: Effects of interannual climaticfluctuations of the last decade on NDVI in north-eastern Euro-pean Russia and Western Siberia, Contemporary Problems of theEarth’s Remote Sensing, 10, 260–271, 2013.
Epstein, H. E., Raynolds, M. K., Walker, D. A., Bhatt, U. S., Tucker,C. J., and Pinzon, J. E.: Dynamics of aboveground phytomass ofthe circumpolar Arctic tundra during the past three decades, Env-iron. Res. Lett., 7, 015506, doi:10.1088/1748-9326/7/1/015506,2012.
Esau, I., Davy, R., and Outten, S.: Complementary explanation oftemperature response in the lower atmosphere, Environ. Res.Lett., 7, 044026, doi:10.1088/1748-9326/7/4/044026, 2012.
Frey, K. and Smith, L.: How well do we know northern land cover:Comparison of four global vegetation and wetland productswith a new ground-truth database for West Siberia, Global Bio-geochem. Cy., 21, GB1016, doi:10.1029/2006GB002706, 2007.
Frost, G., Epstein, H., Walker, D., Matyshak, G., and Ermokhina,K.: Patterned-ground facilitates shrub expansion in Low Arc-tic tundra, Environ. Res. Lett., 8, 015035, doi:10.1088/1748-9326/8/1/015035, 2013.
Frost, G. V. and Epstein, H. E.: Tall shrub and tree expansion inSiberian tundra ecotones since the 1960s, Glob. Change Biol.,20, 1264–1277, 2014.
Goetz, S. J., Bunn, A. G., Fiske, G. J., and Houghton, R. A.:Satellite-observed photosynthetic trends across boreal NorthAmerica associated with climate and fire disturbance, Proc. Natl.Acad. Sci. USA, 102, 13521–13525, 2005.
Guay, K., Beck, P., Berner, L., Goetz, S., Baccini, A., and Buer-mann, W.: Vegetation productivity patterns at high northern lat-itudes: a multi-sensor satellite data assessment, Glob. ChangeBiol.y, 20, 3147–3158, 2014.
Croisman, P. and Gutman, G. (Eds.): Environmental changes inSiberia: Regional changes and their consequences, Springer,Amsterdam, 2013.
Hicks Pries, C. E. H., Schuur, E. A. G., Vogel, J. G., and Natali, S.M.: Moisture drives surface decomposition in thawing tundra, J.Geophys. Res. Biogeosci., 118, 1133–1143, 2013.
Hinzman, L. D., Bettez, N. D., Bolton, W. R., et al.: Evidence andimplications of recent climate change in northern Alaska andother Arctic regions, Clim. Change, 72, 251–298, 2005.
Ippolitov, I. I., Loginov, S. V., Kharyutkina, E. V., and Moraru,E. I.: Climate variability over the Asian territory of Russia dur-ing 1975–2012, Geography and Natural Resources, 35, 310–318,2014.
www.atmos-chem-phys.net/16/9563/2016/ Atmos. Chem. Phys., 16, 9563–9577, 2016
9576 I. Esau et al.: Trends in normalized difference vegetation index
Jeong, J.-H., Kug, J.-S., Kim, B.-M., Min, S.-K., Linderholm, H.W., Ho, C.-H., Rayner, D., Chen, D., and Jun, S.-Y.: Greening inthe circumpolar high-latitude may amplify warming in the grow-ing season, Clim. Dynam., 38, 1421–1431, 2011.
Juszak, I., Eugster, W., Heijmans, M. M. P. D., and Schaepman-Strub, G.: Contrasting radiation and soil heat fluxes in Arc-tic shrub and wet sedge tundra, Biogeosciences Discuss.,doi:10.5194/bg-2016-41, in review, 2016.
Keeling, C. D., Chin, J. F. S., and Whorf, T. P.: Increased activityof northern vegetation inferred from atmospheric CO2 measure-ments, Nature, 382, 146–149, 1996.
Kornienko, S. and Yakubson, K.: A study of transformation of veg-etation cover in over some areas of Taz peninsula using satelliteimagery, Arctic: Ecology and Economics, 4, 46–57, 2011.
Koronatova, N. and Milyaeva, E.: Plant community succession inpost-mined quarries in the northern-taiga zone of West Siberia,Contemp. Probl. Ecol., 4, 513–518, 2011.
Kumpula, T., Pajunen, A., Kaarlejarvi, E., Forbes, B. C., andStammler, F.: Land use and land cover change in Arctic Rus-sia: Ecological and social implications of industrial development,Global. Environ. Chang., 21, 550–562, 2011.
Kumpula, T., Forbes, F., Stammler, F., and Meschtyb, N.: Dynamicsof a coupled system: Multi-resolution remote sensing in assess-ing social-ecological responses during 25 years of gas field de-velopment in Arctic Russia, Remote Sens., 4, 1046–1068, 2012.
Lapenis, A., Shvidenko, A., Shepaschenko, D., Nilsson, S., andAiyyer, A.: Acclimation of Russian forests to recent changes inclimate, Glob. Change Biol., 11, 2090–2102, 2005.
Leibman, M., Khomutov, A., Gubarkov, A., Mullanurov, D., andDvornikov, Y.: The research station “Vaskiny Dachi”, Central Ya-mal, West Siberia, Russia – A review of 25 years of permafroststudies, Fennia, 193, 3–30, 2015.
Lloyd, A. and Bunn, A.: Responses of the circumpolar boreal for-est to 20th century climate variability, Environ. Res. Lett., 2,045013, doi:10.1088/1748-9326/2/4/045013, 2007.
Lloyd, A., Yoshikawa, K., Fastie, C. L., Hinzman, L., and Fraver,M.: Effects of permafrost degradation on woody vegetation atarctic treeline on the Seward Peninsula, Alaska, PermafrostPeriglac., 14, 93–101, 2003.
MacDonald, G., Kremenetski, K., and Beilman, D.: Climate changeand the northern Russian treeline zone, Phil. Trans. Roy. Soc. B,363, 2283–2299, 2008.
Macias-Fauria, M., Forbes, B., Zetterberg, P., and Kumpula, T.:Eurasian Arctic greening reveals teleconnections, Nature Cli-mate Change, 2, 613–618, 2012.
Melnikov, E. S., Leibman, M. O., Moskalenko, N. G., and Vasiliev,A. A.: Active-layer monitoring in the cryolithozone of WestSiberia, Polar Geography, 28, 267–285, 2004.
Moskalenko, N.: Impact of climate warming on vegetation coverand permafrost in West Siberia northern taiga, Natural Science,5, 144–148, 2013.
Myneni, R. B., Keeling, C. D., Tucker, C. J., Asrar, G., and Nemani,R. R.: Increased plant growth in the northern high latitudes from1981 to 1991, Nature, 386, 698–702, 1997.
Nauta, A. L., Heijmans, M., Blok, D., Limpens, J., Elberling, B.,Gallagher, A., Li, B., Petrov, R. E., Maximov, T. C., van Huis-steden, J., and Berendse, F.: Permafrost collapse after shrub re-moval shifts tundra ecosystem to a methane source, Nature Cli-mate Change, 5, 67–70, 2015.
Outten, S. and Esau, I.: A link between Arctic sea ice and recentcooling trends over Eurasia, Climatic Change, 110, 1069–1075,2011.
Outten, S., Davy, R., and Esau, I.: Eurasian winter cooling: Inter-comparison of Reanalyses and CMIP5 data sets, Atmos. Ocean.Sci. Lett., 6, 324–331, 2013.
Pavlov, A. V. and Moskalenko, N. G.: The thermal regime of soilsin the north of Western Siberia, Permafrost Periglac., 13, 43–51,2002.
Raynolds, M. K., Walker, D. A., Epstein, H. E., Pinzon, J. E., andTucker, C. J.: A new estimate of tundra-biome phytomass fromtrans-Arctic field data and AVHRR NDVI, Remote Sens. Lett.,3, 403–411, 2012.
Raynolds, M. K., Walker, D. A., Ambrosius, K. J., Brown, J., Ev-erett, K. R., Kanevskiy, M., Kofinas, G. P., Romanovsky, V. E.,Shur, Y., and Webber, P. J.: Cumulative geoecological effects of62 years of infrastructure and climate change in ice-rich per-mafrost landscapes, Prudhoe Bay Oilfield, Alaska, Glob. ChangeBiol., 20, 1211–1224, 2014.
Shulgina, T., Genina, E., and Gordov, E.: Dynamics of climaticcharacteristics influencing vegetation in Siberia, Environ. Res.Lett., 6, 045210, doi:10.1088/1748-9326/6/4/045210, 2011.
Shuman, J. K. and Shugart, H. H.: Evaluating the sensitivity ofEurasian forest biomass to climate change using a dynamic veg-etation model, Environ. Res. Lett., 4, 045024, doi:10.1088/1748-9326/4/4/045024, 2009.
Solano, R., Didan, K., Jacobson, A., and Huete, A.: MODIS Veg-etation Index User’s Guide (MOD13 Series), 2010, available at:http://vip.arizona.edu, last access: 27 July 2016.
Sorokina, N.: Anthropological changes in the northern taiga ecosys-tems of West Siberia (Nadym area), PhD thesis, Institute for theEarth’s Cryosphere, 2003
Streletskiy, D., Shiklomanov, N., and Nelson, F.: Permafrost, infras-tructure, and climate change: a GIS-based landscape approach togeotechnical modeling, Arct. Antarct. Alp. Res., 44, 368–380,2012.
Sturm, M., McFadden, J., Liston II, G. F. C., Racine, C., and Holm-gren, J.: Snow–shrub Interactions in Arctic tundra: A hypothesiswith climatic implications, J. Climate, 14, 336–343, 2001.
Urban, M., Forkel, M., Eberle, J., Hüttich, C., Schmullius, C., andHerold, M.: Pan-Arctic climate and land cover trends derivedfrom multi-variate and multi-scale analyses (1981–2012), Re-mote Sens., 6, 2296–2316, 2014.
Tang, Q. and Leng, G.: Damper summer warming accompaniedwith cloud cover increase over Eurasia from 1982 to 2009, Env-iron. Res. Lett., 7, 014004, doi:10.1088/1748-9326/7/1/014004,2012.
Walker, D., Leibman, M., Epstein, H., Forbes, B., Bhatt, U.,Raynolds, M., Comiso, J., Gubarkov, A., Khomutov, A., Jia, G.,Kaarlejarvi, E., Kaplan, J., Kumpula, T., Kuss, P., Matyshak,G., Moskalenko, N., Orekhov, P., Romanovsky, V., Ukraient-seva, N., and Yu, Q.: Spatial and temporal patterns of greennesson the Yamal Peninsula, Russia: interactions of ecological andsocial factors affecting the Arctic normalized difference vege-tation index, Environ. Res. Lett., 4, 045004, doi:10.1088/1748-9326/4/4/045004, 2009.
Walker, M., Wahren, C., Hollister, R., Henryd, G., Ahlquist, L.,Alatalo, J., Bret-Harte, M., Calef, M., Callaghan, T., Carroll, A.,Epstein, H., Jonsdottir, I., Klein, J., Magnusson, B., Molau, U.,
Atmos. Chem. Phys., 16, 9563–9577, 2016 www.atmos-chem-phys.net/16/9563/2016/
I. Esau et al.: Trends in normalized difference vegetation index 9577
Oberbauer, S., Rewa, S., Robinson, C., Shaver, G., Suding, K.,Thompson, C., Tolvanen, A., Totland, Ø, Turner, P. L., Tweedie,C., Webber, P., and Wookey, P.: Plant community responses to ex-perimental warming across the turndra biome, Proc. Natl. Acad.Sci., 5, 1342–1346, 2006.
Yakubson, K., Kornienko, S., Razumov, S., Dubrovin, V., Kritsuk,L., and Yastreba, N.: Geoindicators of the environmental changein areas of intensive oil and gas development and methods oftheir evaluation, Georesources, Geoenergetics, Geopolitics, 2, 1–22, available at: http://oilgasjournal.ru/vol_6/kornienko.swf (lastaccess: 27 July 2016), 2012.
Yu, Q., Epstein, H. E., Engstrom, R., Shiklomanov, N., and Stre-lestskiy, D.: Land cover and land use changes in the oil andgas regions of Northwestern Siberia under changing climaticconditions, Environ. Res. Lett., 10, 124020, doi:10.1088/1748-9326/10/12/124020, 2015.
Zhang, X., Friedl, M. A., Schaaf, C. B., Strahler, A. H., and Schnei-der, A.: The footprint of urban climates on vegetation phenology,Geophys. Res. Lett., 31, L12209, doi:10.1029/2004GL020137,2004.
Zhao, T., Bergen, K., Brown, D., and Shugart, H.: Scale dependencein quantification of land-cover and biomass change over Siberianboreal forest landscapes, Landscape Ecol., 24, 1299–1313, 2009.
Zhou, L., Tucker, C., Kaufmann, R., and Slayback, D.: Variations innorthern vegetation activity inferred from satellite data of vege-tation index during 1981 to 1999, J. Geophys. Res., 106, 20069–20083, 2001.
www.atmos-chem-phys.net/16/9563/2016/ Atmos. Chem. Phys., 16, 9563–9577, 2016