Embed Size (px)
Citation preview

September 27, 2005
By
Jeffrey S. Passel Roberto Suro
Pew Hispanic Center A Pew Research Center Project
www.pewhispanic.org 1615 L Street, NW, Suite 700 • Washington, DC 20036-5610 • Phone: 202-419-3600 • Fax: 202-419-3608
REPORT
RISE, PEAK, AND DECLINE: TRENDS IN U.S. IMMIGRATION 1992–2004

— Contents-1 —
RISE, PEAK, AND DECLINE: TRENDS IN U.S. IMMIGRATION 1992–2004
By Jeffrey S. Passel
Roberto Suro
CONTENTS
EXECUTIVE SUMMARY .................................................................................................................... i
INTRODUCTION............................................................................................................................... 1
THE MIGRATION FLOW PEAKED IN 1999–2000............................................................................ 3
CHANGES IN THE COMPOSITION OF IMMIGRANT FLOWS............................................................. 4 Legal Status......................................................................................................................... 4 National Origins, Race and Ethnicity ................................................................................. 5
CHANGES IN THE DESTINATIONS OF IMMIGRANTS ....................................................................... 8
MEXICO-U.S. MIGRATION AND RELATED FACTORS .................................................................. 10
MEASUREMENT METHODS........................................................................................................... 12 Problems with Existing Measures..................................................................................... 12 Immigration Measures from the Census, ACS and CPS .................................................. 15 Year/Period of Arrival ...................................................................................................... 17 Residence 1 Year Ago ...................................................................................................... 21 Combined Estimates ......................................................................................................... 23
REFERENCES ............................................................................................................................... 26
APPENDIX A. DETAILED TABLES ................................................................................................ 28
LIST OF FIGURES
Figure A. Annual Immigration to the United States based on Census 2000, ACS and CPS Data: 1991–2004...................................................................................................................... i
Figure 1. Annual Immigration to the United States based on Census 2000, ACS and CPS Data:
1991–2004..................................................................................................................... 3 Figure 2. Annual Immigration to the United States by Legal Status based on Census 2000, ACS
and CPS Data: 1991–2004........................................................................................... 5 Figure 3. Annual Immigration to the United States for Hispanics and Non-Hispanic Whites
based on Census 2000, ACS and CPS Data: 1991–2004............................................. 7

— Contents-2 —
Figure 4. Annual Immigration to the United States for Selected Countries or Regions of Birth based on Census 2000, ACS and CPS Data: 1991–2004............................................. 8
Figure 5. Annual Immigration to California, New York and Other Areas based on Census 2000, ACS and CPS Data: 1991–2004 .................................................................................. 9
Figure 6. Mexican Migration to the United States and U.S. Unemployment Rate: 1991–2004 10 Figure 7. Mexican Migration to the United States and Mexican Labor Force Growth: 1991–
2004............................................................................................................................. 12 Figure 8. Immigration by Decade—Number Levels and Percent of U.S. Population: 1821–1830
to 2001–2010 .............................................................................................................. 13 Figure 9. Legal Admissions to the United States by Single Years: Fiscal Years 1820–2004 ..... 14 Figure 10. Annual Immigration to the United States by Data Source and Estimation Method:
1991–2004................................................................................................................... 24 Figure 11. Annual Mexican Immigration to the United States by Data Source and Estimation
Method: 1991–2004................................................................................................... 25
LIST OF TABLES
Summary Table A. Average Annual Immigration for 1992–2004 by Place of Birth, by Legal Status, by State, and by Race/Hispanic Origin based on CPS, ACS and Census 2000 Data ......................................................................................................... 2
Detailed Table 1a. Average Annual Immigration for Calendar Years, 1990–2004, by
Race/Hispanic Origin and by Legal Status based on CPS, ACS and Census 2000 Data..................................................................................................................................... 29
Detailed Table 1b. Average Annual Immigration for Calendar Years, 1990–2004, by Country or Region of Birth based on CPS, ACS and Census 2000 Data ..................................... 31
Detailed Table 1c. Average Annual Immigration for Calendar Years, 1990–2004, by State and Region of Residence based on CPS, ACS and Census 2000 Data ............................. 33
Detailed Table 2a. Average Annual Immigration for Calendar Years, 1990–2004, by Race/Hispanic Origin and by Estimation Method based on CPS, ACS and Census 2000 Data ....................................................................................................... 36
Detailed Table 2b. Average Annual Immigration for Calendar Years, 1990–2004, by Country or Region of Birth and by Estimation Method based on CPS, ACS and Census 2000 Data ............................................................................................................................. 39
Detailed Table 2c. Average Annual Immigration for Calendar Years, 1990–2004, by Legal Status and by Estimation Method based on CPS, ACS and Census 2000 Data ......... 43
Detailed Table 2d1. Average Annual Immigration for Calendar Years, 1990–2004, by Region of Residence and by Estimation Method based on CPS, ACS and Census 2000 Data... 45
Detailed Table 2d2. Average Annual Immigration for Calendar Years, 1990–2004, for the Six Largest Immigration States by Estimation Method based on CPS, ACS and Census 2000 Data ....................................................................................................... 47
Detailed Table 2d3. Average Annual Immigration for Calendar Years, 1990–2004, by Region of Residence for Smaller Immigration States and by Estimation Method based on CPS, ACS and Census 2000 Data........................................................................................ 50

— Contents-3 —
Detailed Table 3. Annual Legal Admissions and Foreign-Born Population, from March Current Population Survey and American Community Survey, by Year: 1991–2005 ........... 53
Detailed Table 4. Immigration to the United States by Decade: 1820–2010 .............................. 54 Detailed Table 5a. Mexico-U.S. Migration and Labor Force and Unemployment for the United
States and Mexico: 1990–2004................................................................................... 55 Detailed Table 5b. Mexico-U.S. Migration and Gross Domestic Product for the United States
and Mexico: 1990–2004 ............................................................................................. 56

— i —
RISE, PEAK, AND DECLINE: TRENDS IN U.S. IMMIGRATION 1992–2004
By Jeffrey S. Passel
Roberto Suro
EXECUTIVE SUMMARY
500
1000
1500
1990 1992 1994 1996 1998 2000 2002 2004
Annual Migration to the U.S.Peaked in 1999–2000
Annual Immigration (in 000s)
Start Peak End
Figure A. Annual Immigration to the United States based on
Census 2000, ACS and CPS Data: 1991–2004
The number of migrants coming to the United States each year, legally and illegally, grew very rapidly starting in the mid-1990s, hit a peak at the end of the decade, and then declined substantially after 2001. By 2004, the annual inflow of foreign-born persons was down 24% from its all-time high in 2000, according to the Pew Hispanic Center analysis of multiple datasets collected by the Census Bureau and other government agencies.
Rather than undergoing a continuous increase in immigrant levels as is commonly perceived, the United States experienced a sharp spike in immigration flows over the past decade that had a distinct beginning, middle and end. From the early 1990s through the middle of the decade, slightly more than 1.1 million migrants came to the United States every year on average. In the peak years of 1999 and 2000, the annual inflow was about 35% higher, topping 1.5 million. By 2002 and 2003, the number coming to the country was back around the 1.1 million mark. This basic pattern of increase, peak and decline is evident for the foreign-born from every region of the world and for both legal and unauthorized migrants.

— ii —
In 2004, migration bounced back to exceed 1.2 million. Whether or not this move portends further increases is impossible to predict. But even with this recent increase in migration, the most recent data show that immigration flows are at levels comparable with those of the mid-1990s and still significantly below the peak levels of 1999–2000.
Both the run-up to the peak and the drop-off in immigration coincide with a variety of conditions known to influence such flows, most notably the performance of the U.S. economy. Immigration grew sharply during the rapid economic and job expansion of the 1990s and then declined as the economy went into a downturn after 2001. Measures of the change in the Mexican labor force—the largest single source of U.S. immigrants by far—follow trends closely related to the pattern of changes in U.S. immigration. In tracking some trends related to migration, this report does not attempt to assess fully the many different factors that may have caused the rise and fall of immigration flows during this period, but rather illustrates changes in a few key macro-level indicators that mirror the pattern of immigration flows.
The simplest and most commonly available measure of migration to the United States is the size of the foreign-born population; it consistently reaches new highs each year. However, in demographic terms, the total number of foreign-born persons living in the United States at any given point in time does not measure, and can even be misleading concerning, the flow of migrants to the U.S.; i.e., the number of people coming to the country from abroad over a specific period of time. It does provide a measure of the foreign-born stock in the country. Likewise, the foreign-born stock provides a useful measure of the cumulative results of immigration (i.e., additions to the foreign-born population) and of two processes that subtract from the foreign-born stock (deaths among the foreign-born and emigration by the foreign-born).
In this report, a variety of data measuring flows are used to assess changes in migration levels from one year to another over the period from 1992 through 2004. During this period, the steady increases in the overall stock of the foreign-born population could create the erroneous impression that immigration flows themselves have been increasing inexorably at an accelerating pace. In fact, this report demonstrates that entries of migrants suddenly and rapidly accelerated in the second half of the 1990s and then decelerated with almost equal speed after 2001. According to our analyses of the available data, no other spike of these dimensions has occurred since the current era of increased immigration flows began in 1970s. Although the historical data are not strictly comparable, several roughly similar spikes occurred during the trans-Atlantic era of migration; the peaks in immigration then were associated with events such as the Irish potato famine, the end of the Civil War, the dramatic economic swings of the 1890s and 1900s, and World War I.
An accurate assessment of whether immigration flows are rising, falling or holding steady is essential to formulating and evaluating public policy on a variety of issues at the local, state and federal levels. Unfortunately, no single source of data adequately measures such flows. Much of the data supplied by immigration authorities is of little use because the data systems are used to measure administrative processes within the immigration bureaucracy and do not reflect the movement of people into the United States. Further, much of the inflow—a majority in recent years—arrives outside the legal channels. In order to assess recent immigration flows, the Pew Hispanic Center examined data from Census 2000 as well as from two yearly surveys conducted by the Census Bureau—the Current Population Survey and the American Community Survey. All three identify the foreign-born and ask when they came to live in the United States. Additionally, the two surveys ask respondents where they lived a year earlier. Altogether, these
— iii —
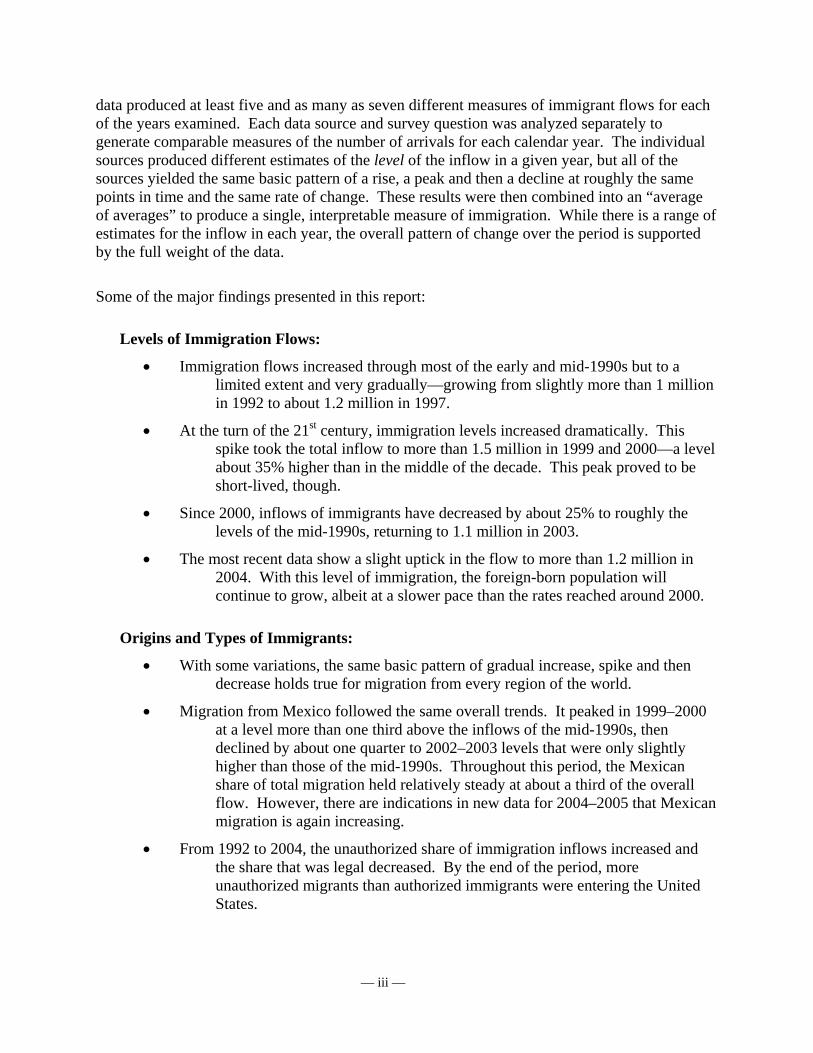
data produced at least five and as many as seven different measures of immigrant flows for each of the years examined. Each data source and survey question was analyzed separately to generate comparable measures of the number of arrivals for each calendar year. The individual sources produced different estimates of the level of the inflow in a given year, but all of the sources yielded the same basic pattern of a rise, a peak and then a decline at roughly the same points in time and the same rate of change. These results were then combined into an “average of averages” to produce a single, interpretable measure of immigration. While there is a range of estimates for the inflow in each year, the overall pattern of change over the period is supported by the full weight of the data.
Some of the major findings presented in this report:
Levels of Immigration Flows:
• Immigration flows increased through most of the early and mid-1990s but to a limited extent and very gradually—growing from slightly more than 1 million in 1992 to about 1.2 million in 1997.
• At the turn of the 21st century, immigration levels increased dramatically. This spike took the total inflow to more than 1.5 million in 1999 and 2000—a level about 35% higher than in the middle of the decade. This peak proved to be short-lived, though.
• Since 2000, inflows of immigrants have decreased by about 25% to roughly the levels of the mid-1990s, returning to 1.1 million in 2003.
• The most recent data show a slight uptick in the flow to more than 1.2 million in 2004. With this level of immigration, the foreign-born population will continue to grow, albeit at a slower pace than the rates reached around 2000.
Origins and Types of Immigrants:
• With some variations, the same basic pattern of gradual increase, spike and then decrease holds true for migration from every region of the world.
• Migration from Mexico followed the same overall trends. It peaked in 1999–2000 at a level more than one third above the inflows of the mid-1990s, then declined by about one quarter to 2002–2003 levels that were only slightly higher than those of the mid-1990s. Throughout this period, the Mexican share of total migration held relatively steady at about a third of the overall flow. However, there are indications in new data for 2004–2005 that Mexican migration is again increasing.
• From 1992 to 2004, the unauthorized share of immigration inflows increased and the share that was legal decreased. By the end of the period, more unauthorized migrants than authorized immigrants were entering the United States.

— iv —
• Declines in legal immigration accounted for the largest part of the drop from the peak flows at the turn of the 21st century. From the peak in 1999–2000 to the trough in 2003, over 60% of the decrease in flow is attributable to lower levels of inflows of legal permanent residents and legal temporary immigrants counted as part of the population.
Destination of New Immigrants:
• The shift of immigrant flows away from states with large foreign-born populations such as California and New York towards new settlement states such as North Carolina and Iowa accelerated during both the peak and the decline that followed.
The Pew Hispanic Center is a nonpartisan research organization supported by The Pew Charitable
Trusts. Its mission is to improve understanding of the U.S. Hispanic population and to chronicle Latinos’ growing impact on the entire nation. The Center does not advocate for or take positions on policy issues. It is a project of the Pew Research Center, a nonpartisan “fact tank” in Washington, D.C., that provides information on the issues, attitudes and trends shaping America and the world.

— 1 —
RISE, PEAK AND DECLINE: TRENDS IN U.S. IMMIGRATION 1992-2004
By Jeffrey S. Passel
Roberto Suro
INTRODUCTION The number of immigrants living in the United States has been increasing steadily since
1970 as measured by the size of the foreign-born population in decennial censuses. Fueled primarily by immigration from Latin America—especially Mexico—and Asia, the foreign-born population grew from 9.6 million in 1970 to 19.8 million in 1990. In the last decade of the 20th century the numbers jumped dramatically by 57% to 31.1 million in Census 2000. Data from the Census Bureau’s Current Population Surveys (CPS) and other sources indicated that much of the growth in the 1990s took place in the second half of the decade. But significant questions remained: How much did the immigration flow increase in the late 1990s? After 2000, did the number of migrants added to the population every year continue to increase, level off or decline? And, more important, is there a basic long-term trend that produces steady year-to-year increases in the flow of migrants? Or, alternatively, are immigration flows variable from year to year and subject to factors, such as the condition of the U.S. economy, that cause them to increase or decline? How the volume of immigration has changed in the face of the dramatic economic swings of the past decade, the reactions to September 11 in terms of popular attitudes and official enforcement efforts, and attempts to tighten U.S. borders and admission procedures is not easy to address with standard measures of immigration.
To address these issues, the Pew Hispanic Center analyzed data from several sources collected by the Census Bureau and developed estimates of the number of foreign-born persons flowing into the country on a yearly basis for 1992 to 2004. (See “Measurement Methods” below.) These figures must be considered approximations of the true level of immigration since they represent averages across several data years, several different measures, and multiple, repeated measures for some of the methodologies used. Although data sources produced different numbers for the flow in a given year, all the sources yielded the same general pattern of change over the period: Immigration flows increased gradually through most of the 1990s, spiked dramatically at the end of the decade and then fell back after 2001 to the levels registered in the mid-1990s.
The spike was significant both in absolute numbers and in percentage change. The peak immigration flows in 1999 and 2000 reached at least 1.5 million people a year (1.8 million by some measures), roughly 400,000 more than the troughs before and after. (See Figure 1 and Summary Table A.) In retrospect, it is now clear that the surge in immigration flows that occurred at the end of the 1990s was a discrete event with a beginning, middle and end. The extremely high flows at the end of the past decade were not the norm, nor part of a long-term trend, but rather the peak of a momentary increase that lasted for only a few years. Thus, even as the United States consistently experiences historically high rates of migration, flows are subject to considerable variation. If levels surge again, the change will mark a new episode in the long saga of immigration into the United States, and so too if they decline sharply.

— 2 —
As will be detailed below, both the increases and decreases in migration flows over the past 15 years coincided with sharp changes in the U.S. economy. Immigration increased rapidly as the United States experienced a record expansion at the end of the 1990s, and the flows dropped after 2001 as the U.S. economy went into a prolonged downturn. As economic growth resumed in 2003 and 2004, migration levels showed signs of increasing again. This same basic pattern held true for migration flows from every region of the world as immigrants came at
Summary Table A. Average Annual Immigration for 1992–2004 by Place of Birth, by Legal Status, by State, and by Race/Hispanic Origin based on CPS, ACS and Census 2000 Data
(In thousands)Variable Average Immigration Amount of Change Percent Changeand Start Peak End Start Peak Start PeakGroup '92-'97 '99-'00 '02-'04 to Peak to End to Peak to End
Place of Birth
U.S., Total 1,139 1,541 1,164 401 -376 35% -24%
Mexico 376 513 402 137 -111 37% -22%Other Latin Amer. 241 319 238 78 -81 32% -25%Asia 307 377 314 69 -63 23% -17%All Other 215 332 211 117 -122 54% -37%
Legal Status#
Total Immigration 1,274 1,577 1,124 303 -452 24% -29%
Legal Permanent 628 647 452 19 -195 3% -30%Unauthorized 486 662 488 176 -174 36% -26%Legal Temporary 160 268 185 108 -83 68% -31%
State of Residence
U.S., Total 1,142 1,541 1,164 399 -377 35% -24%
California 279 331 239 52 -92 19% -28%Other Major States 471 574 425 103 -149 22% -26%New Growth States 216 355 286 139 -70 64% -20%All Other 177 280 215 104 -66 59% -23%
Race/Hispanic Origin
Total Immigration** 1,142 1,540 1,165 398 -375 35% -24%
Hispanic 554 751 576 196 -174 35% -23%Asian* 285 339 283 54 -56 19% -17%White* 217 350 226 133 -124 62% -35%Black* 84 98 78 14 -20 17% -20%
# Status at time of survey.* Non-Hispanic only. See source for definitions.** Total includes American Indian/Alaska Native not shown separately.
Source: Pew Hispanic Center 2005, Detailed Tables 1a-1c. roughly the same pace from countries and regions that were experiencing economic booms and those undergoing hard times. The correlation of U.S. economic trends to migration levels rather than the trends in immigrant-sending countries clearly suggests that the demand for immigrant

— 3 —
labor in the United States is a powerful factor is determining migration flows. Just as the U.S. economy experiences distinct episodes of expansion and contraction, migration levels can also be expected to rise and fall with them.
THE MIGRATION FLOW PEAKED IN 1999–2000 At the start of the 1990s, immigration flows had reached historically high levels of more
than a million people a year. (See Detailed Table 4 and Figures 8–9.) In the early and middle parts of the 1990s, the annual numbers held relatively steady at around 1.1 million people a year. Depending on the measure used, the flows started increasing between 1995 and 1997 towards about 1.2 million per year (Detailed Table 2a).
By 1999, immigration levels had increased substantially to the point where the average inflow during the peak period of immigration—a period encompassing 1999–2000 in most estimates and extending a year in either direction in some—reached at least 1.5 million per year. Again, this figure is “an average of averages” that may actually understate the inflows of immigrants, since about 1.8 million arrived in 1999 according to data from Census 2000 (Detailed Table 2a). The average annual level of immigration during this peak period is about 400,000 greater than during the mid-1990s, or about one third higher (Detailed Table 1a).
500
1000
1500
1990 1992 1994 1996 1998 2000 2002 2004
Annual Migration to the U.S.Peaked in 1999–2000
Annual Immigration (in 000s)
Start Peak End
Figure 1. Annual Immigration to the United States based on
Census 2000, ACS and CPS Data: 1991–2004 Source: Detailed Table 1a.
After 2001, the annual inflow of immigrants slowed a bit and decreased to a level of 1.1 million to 1.2 million per year. Thus, average annual immigration declined by about 300,000 to 400,000 per year or at least 20% below the peak. With the decrease, immigration appears to have returned to roughly the levels of the mid-1990s. However, some data from the most recent

— 4 —
March CPS and the American Community Survey (ACS) give contradictory pictures of current flows; some measures suggest continued lower levels of inflows, but others point to very recent (i.e., late 2004 and 2005) increases in migration from Mexico and Latin America. According to these measures, migration flows could again be approaching 1.3 million a year and moving upward.
All the measures and data sources, however, are consistent in telling the same basic story: Migration flows gradually increased in the mid-1990s, grew very rapidly at the end of the decade, peaked for two or three years and then fell off after 2002, returning to roughly the same levels as before the run-up. (See “Measurement Methods” and Figure 10.)
CHANGES IN THE COMPOSITION OF IMMIGRANT FLOWS Different types of immigrants (grouped for example by legal status, country of origin or
racial/ethnic composition) tended to have similar patterns of change through the upward trend and the subsequent downturn. However, some experienced different trends and certainly not all groups changed at the same rate. Consequently, the changing levels of immigration over the past decade have also resulted in some shifts in the composition of the immigrant inflow. At the end of the 1992–2004 period, the country-of-origin and racial/ethnic mix of the immigrant inflow was basically unchanged from the initial period, notwithstanding a changed mix at the peak. The most notable change over the period was the marked decrease in the share of immigration accounted for by legal permanent residents (i.e., legal immigrants).
Legal Status The mix of legal and unauthorized migrants in the flow changed considerably from 1992
to 2004. The inflow of legal permanent immigrants (LPRs, or “green card” holders) increased only very slightly (3%) from the mid-1990s to the peak around 2000. On the other hand, annual arrivals of both unauthorized migrants and legal temporary migrants (or “legal nonimmigrants”) increased by substantially higher rates. The increase to the peak for unauthorized migrants was 36% and for legal nonimmigrants, 68% (Summary Table A and Detailed Table 1a).
During this period, immigration laws governing admissions did not change in any significant way to affect the number of new arrivals,1 so it is not surprising that the number of legal immigrants did not increase when the other two groups did. Moreover, the very large number of immediate relatives of immigrants who acquired legal status under the Immigration Reform and Control Act of 1986 (IRCA) accounted for a large number of both new arrivals and status adjustments beginning in the early 1990s. By the end of our observation period, the pool of potential immigrants in this group had become smaller. By 2001, increased security requirements leading to processing delays and shrinking ceilings for refugee admissions resulted in fewer admissions of LPRs. In the case of nonimmigrants, the increase during the peak period was fueled, in large part, by an increased demand for temporary workers, especially high-tech workers, and was facilitated by a large increase in the number of visas available. For unauthorized migrants, heightened demand was almost certainly a large factor in the increase as
1 Most of the changes that did occur were designed to permit groups already in the country with either Temporary Protected Status or undocumented status, or on waiting lists, to adjust their status to LPR.

— 5 —
this period coincided with heightened efforts by the federal government to control illegal crossings of the Southern border.
0
250
500
750
1990 1992 1994 1996 1998 2000 2002 2004
Trend Down for LPRs;Unauthorized Exceed LPRs
Start Peak End Annual Immigration (in 000s)
Legal Permanent Residents
UnauthorizedMigrants
Legal TemporaryMigrants
Figure 2. Annual Immigration to the United States by Legal Status
based on Census 2000, ACS and CPS Data: 1991–2004 Source: Detailed Table 1a.
After 2000, annual levels in all three major categories of legal status groups (legal immigrants, unauthorized migrants and legal nonimmigrants) decreased at roughly equal rates—by about 30%. But, because legal immigration had increased less in the run-up to the peak, it ended up at considerably lower annual levels than it had been in the mid-1990s, both in absolute and relative terms. By 2004, the number of legal immigrants arriving in the U.S. was about 30% below the levels of the mid-1990s. While legal immigrants accounted for about five in ten of all new arrivals before the peak, they represented only about four in ten afterwards. For unauthorized migrants, the reverse is true; they represented fewer than four in ten new immigrants before the peak and almost five in ten afterwards. Moreover, in absolute numbers, the flow of legal immigrants had been significantly larger than the flow of unauthorized immigrants in the mid-1990s. Both groups arrived in roughly equal numbers during the peak and immediately afterwards, but, by 2003 and 2004, more unauthorized migrants than legal immigrants arrived each year. The annual numbers of legal immigrants arriving since the peak is actually lower than it was in the mid-1990s while the number of unauthorized migrants in the annual inflow has returned to roughly the same levels.
National Origins, Race and Ethnicity The racial/ethnic composition of the immigrant inflow was almost identical at the end of
the 1992–2004 period as at the beginning (Detailed Table 1a). But, during the peak period of

— 6 —
1999–2000, the representation of white2 immigrants was higher and of Asians lower than either before or afterward. With the exception of a few isolated years, Hispanics made up roughly the same share of annual immigration throughout the entire period—just about half of annual inflows. Thus, the percentage increase to peak and decrease from the peak for Hispanics was about the same as the overall rates of increase and decrease (Summary Table A and Detailed Table 1a). White and Asian immigration moved in opposite directions relative to one another during these periods. White immigration increased by the highest percentage to the peak—about 60%; Asian increase was the smallest—19%. The reverse was true for the decrease from the peak as white immigration decreased most rapidly and Asian the least. As a result, the white share of incoming immigrants was higher at the peak than it had been previously, but by 2002–2004 the overall racial distribution was essentially identical to 1992–1997.
The differences in patterns of change for racial/ethnic groups reflect underlying legal status differences among the race groups and how the changes in admission and arrival patterns by status (described above) played out over the 1992–2004 period. Asian and European countries account for very large shares of legal temporary migrants, especially students, intracompany transfers and high-tech guest workers. Because of historic declines in legal admissions from Europe and, to some degree, Canada, LPR numbers from these areas are relatively low so that the legal temporary migrants account for a large share of all immigrants from these areas. Thus, the patterns of change in white immigration are largely driven by changes in legal temporary migration. Hence, the relatively large increase to the peak and the subsequent decline.
In the case of Asians, most of the migration is by LPRs and refugees, with relatively small shares of both unauthorized and legal temporary migrants. Even though migrants from Asia account for a large share of the legal temporary flow, these migrants are only a small proportion of the total flow from Asia. Thus, the patterns of change for Asian migration during the 1992–2004 period are driven largely by the changing flows of LPRs from Asia. This group did not increase a great deal to the peak, nor did it decrease much. This pattern is reflected in the changing flows from Asia.
The distribution of immigrants by country of birth changed hardly at all over the 12-year period we examine (Detailed Table 1b). Mexicans accounted for roughly a third of the total throughout with the rest of Latin America contributing another fifth. Migrants from Canada and Europe accounted for nearly one seventh of the flow and the rest of the world the remainder. This rough distribution remained remarkably stable as the total annual flow underwent dramatic changes. The basic pattern of increase, peak and decline was apparent in migratory flows from all over the world although some source countries and regions experienced sharper increases and drops than others.
2 The race data in Census 2000 allow for individuals to be assigned to more than one race group. For consistency with historical data and for simplicity of presentation, we assign multiple-race individuals to single races using a hierarchical assignment process. The hierarchy for assignment is: Black, Asian or Pacific Islander, white or “some other race” (assigned as white), and American Indian or Alaska Native. (See Suro et al., 2005.) All references to race groups in this report should be interpreted to refer to non-Hispanics in these groups.

— 7 —
0
250
500
750
1990 1992 1994 1996 1998 2000 2002 2004
Hispanic & White ImmigrantsHit Peaks in 1999-2000
Start Peak End Annual Immigration (in 000s)
White
Hispanic
Figure 3. Annual Immigration to the United States for Hispanics and
Non-Hispanic Whites based on Census 2000, ACS and CPS Data: 1991–2004
Source: Detailed Table 1a.
Mexico represents by far the largest source of immigrants and is sending about 400,000 migrants each year. But Mexican immigration reached a level of at least about 500,000 per year at the peak period of 1999–2000. (See also Figure 4.) These measures, being averages of averages, tend to smooth out peaks and valleys; thus, by some measures, Mexican inflows to the U.S. appear to have exceeded 650,000 per year at the highest levels (Detailed Table 2b). While the data show a clear downturn in Mexican immigration during 2002–2003, some of the most recent data point to the possibility of a sizable increase in Mexican immigration levels by 2004, albeit to levels still lower than the 1999–2000 peaks.
The data for Mexican arrivals also show a localized peak in 1995 (Figure 4 and Detailed Table 1b). It is not clear from the data we examined whether this short-lived uptick represents a problem with reporting by respondents or a real increase. Mexico did experience economic problems in 1994–1995 that could well be associated with short-term increases in migration. Moreover, this one-year increase occurs in four of the five estimation methods (Table 2b), which suggests that the increase was real and not a reporting anomaly. The fact that the one-year peak in 1995 also occurs for immigrants from other Latin American countries further supports the notion of a real increase for the year.

— 8 —
Country Groups Show Similar Trends:Rise, Peak, and Decline
0
200
400
1990 1992 1994 1996 1998 2000 2002 2004
Start Peak End Annual Immigration (in 000s)
Asia
Mexico
Europe &Canada
Other LatinAmerica
Figure 4. Annual Immigration to the United States for Selected
Countries or Regions of Birth based on Census 2000, ACS and CPS Data: 1991–2004
Source: Detailed Table 1b.
Trends from other broad regional aggregations followed much the same trends as Mexican migration (Figure 4 and Detailed Table 1b). The rate of increase to the peak was higher for European/Canadian migrants and lower for Asians. These differences were offset by larger rates of decline from the peak for Europeans and smaller rates for Asians. These patterns lead to a virtually identical distribution of immigrants at the beginning and end of the period. The region of birth differences also largely reflect the legal status differences in composition, as discussed above for race/origin groupings. Individual countries do not necessarily adhere to the same regional patterns. For example, immigration from India registered the sharpest increase prior to the peak of any major source country—a spurt that produced a 77% increase in the annual flow, much higher than even the Mexican migration (Detailed Table 1b). This increase reflects the composition of the migration stream in that India was one of the major beneficiaries of the increased number of visas made available to high-tech workers in the peak period.
CHANGES IN THE DESTINATIONS OF IMMIGRANTS Another significant shift occurred in the destinations of immigrants within the United
States. The well-documented shift of new immigrants away from traditional settlement areas, such as California and New York, and to the so-called “new growth” states3 (Passel et al. 2002,
3 “New growth” designates states other than the six largest immigration states (CA, NY, TX, FL, IL, NJ) where the foreign-born population grew faster during 1990–2000 than in the fastest-growing large state (TX). The 22 new

— 9 —
Kochhar et al. 2005) is quite apparent in these data, as the share going to these two large states dropped from 37% in the mid-1990s to about 30% at the circa-2000 peak (Detailed Table 1c and Figure 5). The changes over time were certainly not uniform among the major receiving states. California and New York lost significant shares of the immigrant inflow between 1992 and 2004. New York was unique among these states in that it did not experience the 1999–2000 peak and actually had less immigration than in 1992–1997; immigration to New York continued to fall after 2000. Florida and Texas received slightly larger shares of the immigrant flow in 2002–2004 than in 1992–1997, unlike the other four large receiving states.
Growth Shifts to Many New Areas;Flows to New York Decrease
0
100
200
300
1990 1992 1994 1996 1998 2000 2002 2004
Start Peak End Annual Immigration (in 000s)
“New Growth”States
CA
NY
OtherStates
Figure 5. Annual Immigration to California, New York and Other
Areas based on Census 2000, ACS and CPS Data: 1991–2004
Source: Detailed Table 1c.
The share of immigration flows settling in the new growth states increased throughout this period. These states received 23% of new immigration during the 1999–2000 peak as compared with 19% in the initial period. Further shifts occurred as immigration levels declined from their peak as the new growth states continued to increase their share of new immigration to 25% of the total. (In the decline, the share going to California and New York dropped a little further to 28% of new arrivals.)
These data point to even further geographic diversification than do many other studies, as states other than the new growth states (the “other states” in Detailed Table 1c) also showed increases in both the share and the number of new immigrants settling there. The “other states”
growth states are: Southeast—DE, NC, SC, GA, KY, TN, AL, MS, AR, OK; Midwest—IN, MN, IA, NE, KS; and Mountain/West—ID, CO, AZ, UT, NV, WA, OR.

— 10 —
share increased to 18% from 16% in the mid-1990s, representing a growth of 59% in the number of new immigrants going to these states. After the peak period, these other states maintained their increased share of new immigrants. Thus, the shifting of immigrant settlement to new destinations is not just a short-lived phenomenon associated with the peak levels of immigration; it continued even as immigration decreased from the 1999–2000 peak.4
MEXICO-U.S. MIGRATION AND RELATED FACTORS The pattern of rise, peak and decline evident in total immigration flows coincides closely
with a similar pattern in the performance of the U.S. economy, and the correlation is particularly strong with the flow from Mexico. During the period of increased migration prior to the peak, U.S. employment increased by 1.59 million in 1993, the first full year of recovery after the 1991 recession; even greater increases in U.S. employment followed and 1.85 million jobs were added in 1998. The annual number of migrants coming from Mexico increased from about 332,000 to 507,000 over the same period. (See Detailed Table 5a.) In 2000, both the U.S. expansion and the growth of Mexican migration reached a peak. That year the U.S. economy added nearly 3.4 million jobs and migration from Mexico crested at an estimated 530,000 new arrivals. In the decline phase, the U.S. economy lost 415,000 jobs in 2002 and, while migration from Mexico continued, it dropped to 378,000.
Mexican Migration Follows Trends inU.S. Employment Rate
0
250
500
1990 1992 1994 1996 1998 2000 2002 200490%
91%
92%
93%
94%
95%
96%
97%
% Employed ofLabor Force
Start Peak End Annual Immigration (in 000s)
Mexico-U.S.Migration
U.S. Employment Rate(Complement of
Unemployment Rate)
Figure 6. Mexican Migration to the United States and
U.S. Unemployment Rate: 1991–2004 Source: Detailed Table 5a.
4 This shift does not mean that immigrants are not continuing to settle in the traditional areas. In fact, for 2002–2004, the six large traditional settlement areas still received 57% of new immigration.

— 11 —
As the U.S. economy regained momentum in 2003 and 2004, the pace of Mexican migration picked up also. Detailed studies of the U.S. labor market during this recovery phase show that there has been heightened demand for low-skilled, low-wage workers largely because the construction industry has been responsible for much of the new job creation while other sectors such as manufacturing have continued to contract (Kochhar 2004 and 2005). Recently arrived Hispanic immigrants have constituted a disproportionate share of the new workers hired into the construction industry, according to these studies.
The annual flow of migrants from Mexico over the 1992–2004 period appears to be more closely correlated to macrotrends in the U.S. economy than in the Mexican economy. Of the variables we examine, changes in the rate of U.S. employment correlate most strongly, at 0.90. (See Detailed Table 5a and Figure 6.) Other U.S. economic variables have correlations of 0.40–0.50 whereas the correlations for Mexican macroeconomic indicators vary from about -0.23 to –0.30. (See Detailed Tables 5a-5b.) These patterns suggest that during this period the “pull” factors have been somewhat more powerful than the “push” factors in determining short-term migration levels.
The Mexican economy underwent a severe crisis in 1995 that produced a dramatic 6.2% drop in the country’s gross domestic product (GDP) that year (Detailed Table 5b). By the time migration levels peaked in 1999 and 2000, the Mexican economy was in a full-blown expansion phase, registering 6.6% GDP growth in 2000. Although the economy recovered quickly, the migration impact of a sharp downturn can stretch out as discouragement gradually produces decisions to seek work in another country. Moreover, the expansion’s impact on migration was somewhat muted because productivity gains in Mexico outpaced job creation. As a result, even when it was growing robustly at the end of the decade, the Mexican economy was not generating enough jobs to absorb all new entrants to the labor market. Following 2001, the Mexican economy experienced a downturn in sync with the U.S. economy. Indeed, with much of its economy linked to the U.S. market under the North American Free Trade Agreement, Mexico’s business cycle now very clearly mirrors trends in the U.S. economy.
Macro-economic trends alone do not determine migration flows. A variety of other factors also influence the number of people moving from one place to another, and these can include everything from border controls in a receiving country to agricultural support policies in a sending country. An overarching factor is the operation of family networks that link migrants to relatives left behind. These networks can greatly facilitate new migration by providing access to housing, information about work opportunities and the comfort of familiar faces in a new land. The annual migration flows to the United States, particularly those from Mexico, suggest that all of these factors, especially family networks, combine to create the conditions for the high and increasing levels of immigration recorded for more than two decades. Specific economic circumstances such as the U.S. boom of the late 1990s and the subsequent downturn can then provide the stimuli for specific and contained fluctuations in migration levels of the sort described here.

— 12 —
0
250
500
1990 1992 1994 1996 1998 2000 2002 2004
-2%
0%
2%
4%
6%
8%
10%
Mexican Migration Less Affected byMexican Labor Force Growth
% Growth in Labor Force Start Peak End
Annual Immigration (in 000s)
Mexico-U.S.Migration
Change in MexicanLabor Force
(Note Reverse Scale -->)
Figure 7. Mexican Migration to the United States and Mexican Labor
Force Growth: 1991–2004 Source: Detailed Table 5a.
MEASUREMENT METHODS Problems with Existing Measures
Although there have been occasions in the past when immigration has been higher in relation to the size of the country’s population, the number of immigrants coming to the United States has reached unprecedented levels in each of the last three decades (Figure 8). Accurate measurement of immigration is important for developing measures of the total U.S. population and for formulating and evaluating public policy on a variety issues at the local, state and federal levels. Unfortunately, the United States does not have very good data on the numbers of new immigrants arriving in the country each year and no single source of data adequately measures such flows. Available data from immigration agencies are generally designed for administrative purposes rather than as measures of the number of people moving into the United States; immigrants arriving outside legal channels have increased numerically and as a share of the total inflow. Some of the serious measurement and tracking issues include:
• Legal immigration is conventionally measured as the number of persons getting legal permanent resident status (“green cards”) in a given year. This number bears little relationship to the demographic concept of immigration, which is the number of people moving into the country during the year. In particular, well over half of those getting green cards are “adjusting status” because they are already in the United States (Detailed Table 3). Further, the total number of green cards each year fluctuates wildly because of processing backlogs and resource allocation decisions

— 13 —
made formerly at the Immigration and Naturalization Service (INS) and now at the Department of Homeland Security (DHS). Thus, the annual number of new-arrival green cards stayed within a fairly narrow range for 1995–2002, averaging about 390,000 per year, with the highest level exceeding the lowest by only about 18%. In 2003–2005, new arrivals dropped slightly to about 360,000 per year. In contrast with the relatively smooth pattern of change in new arrivals, the number of status adjustments varied from a low of 245,000 in 1999 to a peak almost three times as large at 680,000 in 2002.5
In-Flows Increase Since 1960s;Relatively Larger in 19th Century
1.7 2.6 2.3 2.8 5.2 3.7 4.1 2.5
16
14
10
73.80.11.0
0.56.09.00.6
1.5%0.4%0.8%
1.7%2.1%
5.6%
5.7%4.4%
3.4%3.9%
6.5%
11.8%10.5%
11.2%10.0%
4.7%
7.4%7.3%
5.9%
1820s
1840s
1860s
1880s
1900s
1920s
1940s
1960s
1980s
2000s
Unauthorized MigrantsLegal Admissions
Millions of ImmigrantsDuring Decade
Immigration as % ofInitial Population
Figure 8. Immigration by Decade—Number Levels and Percent of
U.S. Population: 1821–1830 to 2001–2010 Source: Detailed Table 4.
Large fluctuations in the number of immigrants arriving in the United States have occurred at various times in the nation’s history, notably during and after the Civil War, coincident with economic swings in the late 19th century, and before and after World War I (Figure 9). From the 1930s through the 1980s, variability in annual admissions decreased substantially. Since then, large swings in admissions have again become the norm. Unlike the situation a century ago, however, the current fluctuations do not seem to reflect real changes in the numbers of people entering the country or the numbers wanting to come. While the pattern of annual flows portrayed in the foregoing analysis is very roughly mirrored in the federal government’s administrative data on the processing of key categories of legal immigrants and
5 Note that the figures in the text refer to fiscal year data published in the Yearbook of Immigration Statistics, whereas the data in Detailed Table 3 are weighted averages of the published data, representing March–February years to be comparable with the CPS data.

— 14 —
visitors, the increases in “green cards” and arrivals of students and other temporary migrants that occurred through the 1990s to 2001 and then the subsequent declines appear to reflect processing backlogs, security delays and other developments that followed the September 11 attacks.
Large Fluctuations in Admissionsin 19th Century
1968
1978
2002
1999
1957
1953
1933
1924
1921
1862
1878
1898
1918
19141907
1882
18731854
0
500
1,000
1810 1820 1830 1840 1850 1860 1870 1880 1890 1900 1910 1920 1930 1940 1950 1960 1970 1980 1990 2000
Annual Legal Admissions (in 000s)
Figure 9. Legal Admissions to the United States by Single Years:
Fiscal Years 1820–2004 Source: Yearbook of Immigration Statistics: 2004, Tables 1 and 4.
• Significant numbers of temporary migrants arrive in the United States each year with legal nonimmigrant visas. The vast majority of legal nonimmigrants are not immigrants per se but visitors who are coming as tourists or for business.6 The largest numbers of temporary migrants who could be considered U.S. residents enter as students (F visas and M visas), highly skilled guest workers (H-1B visas), and intracompany transfers (L visas). The data systems for tracking arrivals and residents have improved to some degree but still do not provide the data needed to measure immigration inflows accurately—specifically, how many people have newly entered the country, how many have left and how many have acquired other statuses.7
• Large numbers of immigrants arrive without authorization. In recent years, estimates suggest that this group is the largest of the three. While techniques have improved substantially to the point where there seems to be broad agreement that the unauthorized population has reached or exceeds 10 million (Passel 2005), the
6 Certainly a small share of the 20+ million annual “visitors” become “immigrants” by overstaying their visas and entering the unauthorized migrant population.
7 See Passel and Fix (2003) and Passel (1997) for a discussion of the needed data and system requirements

— 15 —
available data do not accurately measure year-to-year changes as would be needed to measure inflows.
Measures of the size and composition of the foreign-born population have traditionally drawn on data from the decennial census and two annual surveys conducted by the Census Bureau—March Supplements to the Current Population Survey (CPS) and the American Community Survey (ACS). These data provide an excellent basis for assessing impacts of immigrants. However, comparison of the size of the foreign-born population from one year to the next is not an adequate method for measuring annual changes in size or for measuring inflows. With the number of foreign-born residents reaching 35 million, the standard error (or sampling variability) of the annual change is so large that the year-to-year difference can vary substantially due to random measurement factors. Thus, while the overall trend in foreign-born growth is clear from the annual population totals (Detailed Table 3), it seems unlikely that the annual changes fluctuated between about 84,000 as measured by the 1995–1996 CPS difference to the more than 1.9 million difference between the 1999 and 2000 CPSs. The larger samples of the ACS seem to produce less fluctuation in measured change in the foreign-born population, but other problems remain before year-to-year changes can be converted into inflow estimates.
Annual inflows of new immigrants account for only part of the annual change in the foreign-born population. In demographic terms, there are three components that account for changes in the size of the foreign-born population. The largest is the arrival of new immigrants, now numbering well over 1 million per year. The other two are deaths of immigrants living in the country and outmigration (emigration) of former immigrants. Neither of these flows is small. During the 1990s, deaths of the foreign-born averaged 200,000 to 250,000 per year. This component can be measured directly by vital statistics and its adequacy can be assessed with conventional analysis of mortality data. However, measurement of emigration has been especially problematic. Original estimates for the 1990s were about 275,000 per year (Robinson 2001; Passel 2001). However, new estimates (Van Hook, et al. 2004) suggest that true levels of emigration were probably somewhat higher. Unfortunately, even with current methodological improvements, the available methods and data do not permit development of precise annual estimates of emigration required to convert changes in the foreign-born population into measures of newly arriving immigrants.
Immigration Measures from the Census, ACS and CPS Our goal of measuring trends and patterns in annual immigration—specifically in the
number of foreign-born persons coming to the United States in a given year with the intention of living in the country—and its characteristics thus requires expansion of the data and methods brought to bear on the problem. In assessing immigration levels and trends, we use three sources of data:
(1) The March Supplements to the Current Population Survey, the annual socioeconomic supplement to the U.S. government’s monthly labor force survey, for 1994–2005, with two different weighting schemes, one covering 1994–2001 and the other overlapping to cover 2000–2005;
(2) Sample data from Census 2000; and

— 16 —
(3) The American Community Survey (ACS) national sample for 2000–2004.8
Two different types of data from these sources enter into our measures. The March CPSs and the ACSs include a question asked of all respondents at least 1 year old about residence one year earlier. Thus, the number of foreign-born who lived abroad one year before the survey data provides an assessment of the inflow of immigrants in the year before the survey. The estimates coming from the analyses of this question, particularly from the CPS,9 give figures slightly lower than other measures, but, as we will see, the pattern of change across the 1990s and 2000s is consistent with other measures.
The CPS, Census 2000 and the ACS all ask immigrants when they “came to live in the United States.” While there is some controversy about the interpretation of these data in relation to new arrivals of immigrants,10 their use to assess migration flows is well established and the results track well with other measures. Our approach involves averaging arrival cohorts across several survey years for both the ACS and CPS. It is also necessary to annualize the CPS estimates because the data are only available for arrival in groups of years, not for single years.
Further complications are introduced by the use of CPS data spanning the 1994–2005 period. CPS population figures arise out of a complicated weighting process that uses postcensal population estimates, generated by the Census Bureau and benchmarked to the previous census. In most decades, this switch in weighting from the previous census to a new one introduces only minor discontinuities. However, the Census Bureau underestimated the population count from Census 2000 by almost 5 million persons (Passel 2001) so that CPS data developed with weights based on the 1990 Census differ considerably from similar data developed using weights based on Census 2000. The two groups most affected by the reweighting that occurred officially for March 2002—Asians and Hispanics—are immigrant-dominated populations. Thus, the reweighting process had a marked effect on the size of the foreign-born population as measured by the CPS. Because of the magnitude of the changes introduced by the weighting change, the Census Bureau has released two transitional, overlapping CPS datasets. For March 2001, there is an entire alternative dataset available for producing measures consistent with data from 2002 and later.11 For March 2000, the Census Bureau supplied an alternative set of weights consistent with the regular March supplement and Census 2000 (Passel 2001). Thus, we have two CPS measures for 2000 and 2001 to help assess the impact of the new census results on measures of immigrant inflows.
8 For 2000 and 2001, the ACS was designated as the Census Supplementary Survey. For clarity and conciseness, we refer to both as ACS samples, for 2000 and 2001 respectively.
9 The overlapping sample design of the CPS may affect measures of residence one year earlier because half of the sample housing units stay in the CPS from the previous year. Also, edit and imputation schemes may affect the final data.
10 Redstone and Massey 2003; Myers 2004. 11 This CPS, designated by the Census Bureau as the SCHIP (State Children’s Health Insurance Program)
sample, is completely separate from the regular March 2001 Supplement. The SCHIP sample incorporates the sample expansion introduced in March 2002 and uses the new weighting methods introduced in 2002 as well as population controls based on Census 2000. See below.

— 17 —
Year/Period of Arrival The CPS, the ACS and Census 2000 all include a series of questions asking place of
birth, citizenship and the year that respondents born outside the United States “came to live” in the United States. These questions define the immigrant or foreign-born population as persons born outside the United States who were not US citizens at birth. The estimates in Detailed Tables 2a–2d3 labeled “arrival” are derived from the Census, ACS and CPS questions on the year that respondents came to live in the United States.
Census 2000. The estimates from Census 2000 use the 5-percent Public-Use Microdata Sample (PUMS) as augmented with assignments of legal status (Passel, Van Hook and Bean 2005). The estimates are straightforward tabulations of the foreign-born population for single years of arrival by race/Hispanic origin,12 legal status, country of birth or state of residence. The only estimation required is for the year 2000. Census data for arrivals in 2000 are incomplete because the census enumerates persons at their residence as of April 1, 2000. Persons entering the U.S. after April 1 should not be included in the census count; however, the census enumeration process actually spreads over a period of several months after April 1 as enumerators collect information from persons who failed to respond initially to the Census. Accordingly, we treat the data for persons arriving in 2000 as representing one third of the entrants during the calendar year rather than the one fourth share implied by the Census date. Thus, the estimate from the 2000 PUMS of 589,000 immigrants arriving in 2000 is inflated to the figure of 1,765,000 for the full year shown in Detailed Table 1a.
American Community Surveys, 2000–2004. The detailed data collected in the American Community Survey are basically the same as collected in the sample phase of the Census. The ACS design, however, differs in that the survey consists of non-overlapping samples collected on a monthly basis over the course of the calendar year rather than the traditional census or survey method of collecting all data for a specific reference date. For our ACS-based estimates, we again use tabulations from the PUMS. For 2000–2004, the ACS was not in full production; the sample size will be 250,000 households per month, or 3 million per year, but during testing the ACS had a nominal sample size of 700,000 households over the course of the calendar year. Because only about one third of nonresponses are followed up in the ACS, the actual sample size for each year was about 480,000.13 The ACS, as implemented for these years, covers only the household population, not the whole population, of the United States; accordingly, the ACS figures for immigrants are slightly less than the Census values in 2000 and are a bit lower in other years than the entire U.S. total would be, were it available.
As with the Census-based estimates, we use straightforward tabulations of the foreign-born population by single years of arrival from the ACS as our initial estimates for
12 The race data in Census 2000 allow for individuals to be assigned to more than one race group. For consistency with historical data and for simplicity of presentation, we assign multiple-race individuals to single races using a hierarchical assignment process. The hierarchy for assignment is: Black, Asian or Pacific Islander, white or “some other race” (assigned as white), and American Indian or Alaska Native. (See Suro et al., 2005.)
13 For 2001–2004, data from all ACS households were released in the PUMS. For the Census 2000 Supplementary Survey (C2SS) which represented the ACS for 2000, only about one quarter of the households in the full ACS sample were released in the PUMS.

— 18 —
race/Hispanic groups,14 countries of birth and states of residence. There are several data-driven limitations to the ACS estimates, though. Because of the smaller sample size of the ACS, not all of the countries of birth coded in Census 2000 were available in the ACS; the impact of this limitation is small, however, since all large sending countries are separately identified in the data. We did not generate estimates of inflows by legal status because the status assignments have not been done with ACS data.
The ACS estimates for each year of arrival presented in Detailed Tables 2a–2d3 are an average of the five individual ACS estimates (i.e., from the 2000–2004 ACSs). The principal technical issue in developing these averages is the handling of estimates of the number of immigrants arriving in the year of the survey, because the data are collected throughout the year rather than at the end of the year. Thus, the tabulated ACS data from 2003, for example, do not generate an estimate of the full number of immigrants arriving in 2003. This deficiency affects the estimates for 2000–2004 only, not those for years before 2000. Immigrant arrivals in each year through 1999 are averages of five individual estimates. For the 2000–2003 estimates, the survey conducted in the year of the estimate is dropped from the average; that is, the average estimate for 2000, as shown in Detailed Tables 2a–2d3, is based on four separate estimates from the 2001–2004 ACSs; for 2001, from the three ACSs of 2002–2004; for 2002, from the two ACSs of 2003–2004, and for 2003, from the 2004 ACS alone. The estimate shown for 2004 is obtained by inflating the partial-year data from 2004 to a full-year estimate. The inflation factor for 2004 is the average of factors for 2000–2003 obtained by computing the ratio of the partial-year estimate from the year’s survey to the full-year estimate from the next year’s ACS. For example, the inflation factor for the 2000 ACS is the ratio of immigrant entries in 2000 from the 2000 ACS (a partial year) to immigrant entries in 2000 from the 2001 ACS (a full year).
Current Population Surveys, 1994–2005. The Current Population Survey is the U.S. government’s labor force survey that provides the monthly data used for the official measure of the unemployment rate. Beginning in 1994, the information needed to identify immigrants and to measure immigration (country of birth, citizenship and year of entry) was added to the data collected in the basic CPS and its supplements as part of the redesign process done every decade. The regular monthly CPS is a complex state-based sample of about 50,000 households; each month’s sample overlaps with the previous year and adjacent months to minimize the variance of estimates of month-to-month change in employment. In March of every year, the sample size is increased by augmenting it with CPS households from other months; the data collected are greatly expanded also. The additional data include information on income (by source of income), health insurance, participation in social programs, detailed labor force history and a variety of other items. The CPS universe is the civilian, noninstitutional population; this universe is larger than the ACSs—the household population—but smaller than the Census’s universe—the total population.
Through 2001, the March CPS expansion increased the sample size by about 10% over the regular monthly sample to 55,000 households by doubling the sample of Hispanic households. The weights for the CPS are based on the Census Bureau’s population estimates obtained by updating the previous census. So the population estimates for the March 1994–2001
14 All years of the ACS allow multiple-race responses. Accordingly individuals in the PUMS were classified by race using the same hierarchical methodology as applied to Census 2000.

— 19 —
CPSs are based on the 1990 Census, as corrected for undercount, using detailed national estimates by age, sex and race; national estimates by age, sex and Hispanic origin; and state estimates of the population aged 16 and over. In general, figures for the foreign-born population from these 1990-based CPSs are less than those from 2000-based CPSs.
In the post-2000 redesign of the CPS, the March supplement sample size was increased substantially to about 80,000 households by oversampling households with children and minority households other than Hispanics (which were already oversampled).15 The weighting scheme was also changed. The weights for the post-2000 redesign are based on Census 2000, without a correction for undercount, using the same detailed national categories for age, sex and race; national estimates for age, sex and Hispanic origin; and state estimates but for all ages and with detail by broad age groups, sex and simplified race groups. The redesigned questionnaire, expanded sample and new weighting scheme were introduced for the March 2002 supplement. Beginning in 2003, the race question was changed to allow for multiple responses as in Census 2000 and the ACS; to incorporate these new race data, the weighting categories were adjusted slightly by placing all persons with multiple race responses into a separate weighting group. For March 2001, the Census Bureau tested the entire redesign including the greatly expanded sample (but not the new race question) and released a separate set of CPS data for that year that are consistent with the data for March 2002 and later. In addition, for the March 2000 supplement, the Census Bureau produced a special set of CPS weights consistent with the population as enumerated in Census 2000 rather than the official CPS data for March 2000 which are weighted to a population estimate based on the 1990 Census carried forward to 2000. As a result of the redesign and testing, we have a series of March CPS supplements for 2000–2005 that are consistent with Census 2000 and that overlap for two years with the 1990-based series of 1994–2001.16 We use the CPS supplements to produce two separate series of immigration estimates by race, by country of birth,17 by legal status18 and by state of residence—a 1990-based series and a 2000-based series.
Producing annual estimates of immigrants arriving from the CPS question on year of arrival in the United States is more complicated than the analogous process for Census 2000 and for the ACSs of 2000–2004. Although the CPS collects information on year of arrival for every
15 For details of CPS design, weighting and methods, see U.S. Census Bureau 2000 and 2002. 16 For 1994 and 1995, the official CPS data from the Census Bureau and the Bureau of Labor Statistics (BLS)
have weights and race data that are incorrect and inconsistent with subsequent data because of errors in the collection and editing of the race item. We use a set of weights produce by the author for the Urban Institute that correct the race data and CPS weights (Passel 1996). The error mainly affects data for Asians and American Indians; the correction adds substantially more than 2 million persons to the foreign-born population.
17 We augment the official data on country of birth by editing the data to assign country of birth to about three quarters of the more than 1 million persons reported in the CPSs of 1999 and later as “country of birth unknown” or “some other country.” The Census and ACS data do not include equivalent categories because they incorporate more extensive edits to eliminate such responses (or, more properly, such nonresponses). The data on country of birth collected and released for March 1994 cover only about 30 specific countries, rather than the full complement of countries and regions of birth covered in other CPSs, Census 2000, and the ACS. Accordingly, we do not use data by country of birth from the 1994 CPS.
18 The legal status data use the methodology first created by Passel and Clark (1998) for the Urban Institute and later adapted to Census 2000 (Passel et al. 2004, 2005). The legal status assignments have not been implemented with CPS data for 1994 and 1997 and the assignments for March 2005 have not been completed, so the estimates by legal status developed here exclude those CPSs.

— 20 —
year, the data released to the public group the responses into intervals. Thus, for the period of interest (i.e., 1992 and later), the CPS provides information only for two-year periods of arrival, beginning with even-numbered years; that is, the data responses are coded as arrived in 1992–93, 1994–95, 1996–97, etc. To produce annual estimates of arrivals, we assign each year of the two-year period the same value equal to one half of the estimate for the two-year period. A further complication is introduced because the most recent period of arrival in every CPS is expanded to include the current year of the survey. Also, since all of the coded intervals must begin with an even numbered year and must include at least two full years (according to the Census Bureau’s data disclosure standards), the most recent period of arrival is coded to cover three full years plus the partial year of the survey in odd-numbered years. Since the March CPS interviews are done during the week including March 19, the most recent arrival period shown in even-numbered years covers two full years and 2.5 months (i.e., 1992–94 for the March 1994 CPS; 1994–96 for March 1996, 1996–98 in March 1998, etc.). In odd-numbered years, the most recent period of arrival encompasses three years and 2.5 months (i.e., 1992–95 for the March 1995 CPS; 1994–97 for March 1997, 1996–99 for March 1999, etc.). To estimate annual arrivals by calendar year for these most recent periods, we divide the number of immigrants arriving in the interval by the number of years covered (either 2.208 or 3.208) and assign the average value to each year covered by the interval, including the year of collection. This averaging across periods tends to smooth out the time series of estimates and produce estimates that change in “steps” when compared with the series from the ACS and Census. (Note, for example, in Detailed Tables 2a–2d3, that the 2000-based CPS values for immigrants arriving during 1990–1999 are identical in adjacent years whereas the ACS and Census estimates vary from year to year.)
The CPS-based estimates from the period of arrival data are also averaged across multiple CPSs. Because of sampling variability and attrition of some arrival cohorts due to the combined effects of small sample sizes, emigration and mortality, not all of the CPSs could be used for every estimate year. However, all periods of arrival, with a very few exceptions, draw on data from at least three CPS supplements; the following table details the supplements used to estimate arrivals for each calendar year:
Calendar years Supplements for Supplements for for arrivals 1990-based series 2000-based series
1990–1991 March 1994–96 March 2001–02 1992–1993 March 1994–01 March 2000–01 1994–1995a March 1996–01 March 2000–02 1996–1997a March 1998–01 March 2000–04 1998–1999a March 2000–01 March 2000–03 2000–2001a March 2000–01 March 2002–05 2002–2003a — March 2004–05 2004a — March 2004–05 a Note that for each of these periods, the two March supplements for the specific years are used with the
noted adjustments for partial years. That is, to develop estimates for calendar 1996, for example, the data for average annual arrivals during 1994–96 from the March 1996 CPS are incorporated, but with a weight of 0.208, and the data for average annual arrivals during 1994–97 from the March 1997 CPS are incorporated with a weight of 1.0.

— 21 —
In averaging the annual estimates across multiple CPS observations, each CPS is given an equal weight except that the annualized estimates for the year of the CPS supplement (e.g., the estimate for 2002 based on the March 2002 CPS) are only weighted at 0.208 or a weight equivalent to an observation covering 2.5 out of 12 months.
Because of the multiple averaging involved in developing estimates for calendar year arrivals from CPS data, the CPS-based time series of arrivals tend to be smoother than the other estimates (Detailed Tables 2a–2d3). Because they are averaged across time and CPSs, the increases to peak values tend to start a year earlier than other estimates, the peak values sometimes last a year longer than other estimates, and the declines from the peaks tend to start a year later than in some series. There are substantial differences in the estimates developed from 1990-based CPS weights (the series for 1994–2001 CPS data) and those developed from the 2000-based CPS weights (the series for 2000–2005 CPS data). The 1990-based population estimates were substantially different from the population figures that emerged from Census 2000. Specifically, the 1990-based population estimates understated the Hispanic and Asian populations by a bit more than 10%, with some of the age-sex groups (e.g., Hispanic males ages 20–29) falling as much as 20 to 30% below the Census 2000 counts. Further, the state-level estimates for states that were new destinations for immigrants, especially for Hispanic immigrants, were lower than Census 2000 counts, especially for the minority populations in these states. The introduction of Census 2000-based population data into the weighting process thus led to significantly higher figures for immigrants. The overall foreign-born totals, in Detailed Table 3, show that the 1990-based totals for 2000 and 2001 are about 6% less than the 2000-based figures. The impact of new weights is, of course, much larger for Hispanic and Asian populations and for more recent arrival cohorts. Thus, comparison of the averaged estimates for arrival cohorts in Detailed Table 2a shows that the Hispanic figures for 1990–2001 arrivals run about 20% lower for the 1990-based estimates; for Asians and blacks, the 1990-based estimates also are lower but with more variability than for Hispanics; for white immigrants, the 1990-based estimates are actually slightly larger than the 2000-based series. Whereas some of these differences are substantial, they should not be taken as indicative of flaws in the overall estimates; rather, they demonstrate the degree of error that had built up in the population estimates and data series for the 1990s due to inadequate information about immigrant flows to the United States (Passel 2001).
Residence 1 Year Ago The ACS asks respondents “Where did this person live 1 year ago?” while the CPS asks
“Where did [respondent] live on March 1, [insert previous year]?” This question is asked of respondents more than 1 year old who report living in a different house or apartment on the reference date. We use these data to identify immigrants during a year—defined as foreign-born individuals who report living outside the United States in response to these questions. Census 2000 has a similar question but the reference date is five years before the census (i.e., April 1, 1995) so we do not use these data in this study.
American Community Survey, 2000–2004. The development of estimates from the ACS information on residence one year earlier is very straightforward compared with the year of immigration variables. We first tabulate foreign-born individuals who report living outside the United States a year ago by race, by country of birth and by state of residence using the procedures described above for these variables. The only issue in combining the estimates is the

— 22 —
date of reference for the migration period. Since the ACS data are collected through the calendar year, we assume that, on average, the data were collected at the midpoint of the survey year; for example, we assume that the 2003 ACS data were collected as of July 1, 2003. Thus, the reference period during which migration is assumed to have occurred is July 1 of the year before the survey through June 30 of the year of the survey. To convert these estimates to calendar years, we average estimates from adjacent ACS years with weights of 0.5; for 1999 estimates, we use one half of the value from the 2000 ACS and assume that it applies to the entire calendar year. Likewise for 2004, we assume that the ACS value for migration applies to the whole year. The results of this averaging process are shown as estimates of immigration (labeled as “yr ago”) for 1999–2004 in Detailed Tables 2a–2d3.
Current Population Surveys, 1994–2005. Again, the CPS estimates are somewhat more complex than the ACS estimates, but the overall process is very similar. Again, we first tabulate the number of foreign-born individuals who lived outside the United States one year before the survey from each March CPS Supplement by race, by legal status, by country of birth, and by state. We again have two separate series of estimates—based on the 1994–2001 CPSs for 1990-based weights and on the 2000–2005 CPS for the 2000-based weights. As before, each series is treated separately. Because of the data deficiencies noted above, we do not use country of birth data from the 1994 CPS, and the values for other years have been edited to reduce the number of unknowns; the race data for 1994–95 have been edited to correct Census Bureau processing errors and the data for 2003–05 edited to assign multiracial individuals to single races. We do not have legal status information for the 1994, 1997 and 2005 CPSs, so the annualized estimates for years affected by these surveys draw on less information.
Finally, the CPS data required one further modification. In processing the data, it became apparent that there were serious problems with the residence one year earlier data from the March 1995 CPS. Specifically, the estimated annual immigration based on this survey was only about 55% of the estimated values from the 1994 and 1996 CPSs. However, there was no indication from any other data source (including the year of arrival data) to suggest that the numbers were so low during the period. It appears that an additional question in the March 1995 CPS asking about residence five years earlier may have affected responses to the residence one year ago question. Because of these data problems, we dropped the 1995 data from this analysis.19
The conversion of basic CPS tabulation of immigrants in the year before the survey followed the annualization process described above for averaging ACS data. The reference period of the migration is specified more clearly in the CPS than in the ACS, so the process for developing calendar year estimates is also better specified. Specifically, the annual estimate of immigration for the year before the CPS using the residence one year ago data weights the current CPS for 10 months and the previous CPS for 2 months. For example, the number of immigrants arriving in calendar year 1998 is computed as 10 times the foreign-born population living outside the U.S. one year ago identified in the March 1999 CPS plus twice the number from the March 1998 CPS with the total divided by 12 (i.e., 10+2). If either year is missing (as with 1995 data as just noted or, for example, 1997 data on legal status), an adjustment is made in
19 The March 2005 CPS Supplement also included this question about residence 5 years ago in addition to the question on residence 1 year ago. There are some indications that the residence 1 year ago data from 2005 may be somewhat “out of line” with other data, but the 2005 figures are higher than expected, not substantially lower.

— 23 —
the denominator so that, in essence, the migration rate observed in the available CPS is assumed to apply to the entire calendar year.
Detailed Table 2a–2d3 shows the two separate series of annualized estimates based on CPS data for residence one year ago. Again, the weighting has an impact on the estimates as the 2000-based weights give measures of immigration about 10% higher than the 1990-based weights. There is, however, little overlap in the series as only the 2000 and 2001 CPSs carry two sets of weights. In contrast to the period of arrival estimates, the ACS tends to yield somewhat higher estimates of immigration from the residence one year ago question than the CPS estimates. Because the time reference in the CPS is more specific than in the ACS (i.e., “March 1” versus “1 year ago”), the ACS may pick up more migrants and movers whose actual date of moving occurred slightly more than one year before the interview.20 Alternatively, the ACS-CPS difference may be due to sampling variability or differences in the population estimates used in weighting the surveys.
Combined Estimates To arrive at a single set of immigration values for calendar years 1992–2004, we take a
simple average of the estimates available for each year, but restrict the averaging to estimates based on weights consistent with Census 2000. Specifically, the estimates incorporated into our overall average are: (a) Census 2000 estimates based on year of arrival for 1992–2000; (b) average ACS estimates based on year of arrival for 1992–2004; (c) average CPS 2000-based estimates based on year of arrival for 1992–2004; (d) average ACS estimates based on residence abroad 1 year ago for 1999–2004; (c) average CPS 2000-based estimates based on residence abroad 1 year ago for 1999–2004. In averaging these estimates (most of which are averages themselves), we are trying to address questions surrounding the trend in immigration over this period, not the level of immigration. The different measurement techniques provide somewhat different information about levels of immigration but all show the same trends over time. Thus, the average across methods should not be treated as the single best measure of the number of immigrants entering the country, but rather as an indicator of the relative contributions of different groups (e.g., race, legal status, geography) to immigration and of how these contributions have changed over time.
20 The CPS changed the wording of its question in March 2005 to correspond to the ACS wording. The March 2005 CPS shows much higher levels of immigration in response to this question than does the March 2004 CPS. This difference may represent a real increase, but part of it may be attributable to the response pattern noted in the text.

— 24 —
0
500
1000
1500
1990 1992 1994 1996 1998 2000 2002 2004
1 yr ago (CPS-'90)1 yr ago (CPS-'00)1 yr ago (ACS)Avg arrivals (CPS-'90)Avg arrivals (CPS-'00)Avg arrivals (ACS)Avg arrivals (Census 2000)
All Measures of Annual FlowsShow Similar Trends for 1992–2004
Start Peak End Annual Immigration (in 000s)
Figure 10. Annual Immigration to the United States by Data Source
and Estimation Method: 1991–2004 Source: Detailed Table 2a.
Figure 10 shows the estimated annual level of immigration for all of the series of annual estimates based on different methods; Figure 11 shows the same level of detail, but for immigration from Mexico. The variability across different estimate methods is clear in both figures as the lines show a range of several hundred thousand from highest to lowest for a number of years. The largest high-low differences tend to be in peak immigration years, however. What is also apparent from the figures is that all of the separate estimates series show similar patterns of a relatively low plateau at the beginning, an increase to peak values, followed by a decline from the peak.

— 25 —
0
250
500
1990 1992 1994 1996 1998 2000 2002 2004
1 yr ago (CPS-Old)1 yr ago (CPS-New)1 yr ago (ACS)Avg arrivals (CPS-Old)Avg arrivals (CPS-New)Avg arrivals (ACS)Avg arrivals (Census 2000)
Mexican Migration MeasuresFollow Similar Trends
Start Peak End Annual Immigration (in 000s)
Figure 11. Annual Mexican Immigration to the United States by Data
Source and Estimation Method: 1991–2004 Source: Detailed Table 2b.

— 26 —
REFERENCES Camarota, Steven A. 2004. Economy Slowed, But Immigration Didn't: The Foreign-Born
Population, 2000-2004. Backgrounder. Washington, DC: Center for Immigration Studies. November.
Ellis, Mark and Richard Wright. 1998. “When immigrants are not migrants: Counting arrivals of the foreign born using the US census.” International Migration Review 32:127-144.
Kochhar, Rakesh. 2005. Latino Labor Report, 2004: More Jobs for New Immigrants but at Lower Wages. Washington, DC: Pew Hispanic Center. May 26. (Also, http://pewhispanic.org/files/reports/45.pdf.)
Kochhar, Rakesh. 2004. Latino Labor Report, 2003: Strong but Uneven Gains in Employment. Washington, DC: Pew Hispanic Center. February 23. (Also, http://pewhispanic.org/files/reports/26.pdf.)
Kochhar, Rakesh, Roberto Suro, and Sony Tafoya. 2005. The New Latino South: The Context and Consequences of Rapid Population Growth. Washington, DC: Pew Hispanic Center. August 26. (Also, http://pewhispanic.org/files/reports/50.pdf.)
Myers, Dowell. 2004. “Accuracy of Data Collected by the Census Question on Immigrants' Year of Arrival.” Population Dynamics Research Group, School of Policy, Planning, and Development, University of Southern California, Working Paper No PDRG04-01. January. (Also, http://www-rcf.usc.edu/~dowell/pdf/Year_of_Arrival_Brief10b.pdf.)
Passel, Jeffrey S. 2005. Unauthorized Migrants: Numbers and Characteristics. Washington, DC: Pew Hispanic Center. June 14. (Also, http://pewhispanic.org/files/reports/46.pdf.)
Passel, Jeffrey S. 2001. “An Evaluation of Demographic Analysis.” In Final Report of the Census Monitoring Board, Presidential Members. Washington, DC. September. (Also, www.cmbp.gov)
Passel, Jeffrey S. 1997. Immigration Statistics: No Longer Neglected, But Still Inadequate. Statistical Policy Working Paper 26, Seminar on Statistical Methodology in the Public Service, Office of Information and Regulatory Affairs. Washington, DC: Office of Management and Budget. August.
Passel, Jeffrey S. 1996. “Problem with March 1994 and 1995 CPS Weighting (and Revised Weights).” Research Memorandum for CPS Users. Washington, DC: Urban Institute. November (Revised November 1998).
Passel, Jeffrey S., Randolph Capps, and Michael E. Fix. 2002. The Dispersal of Immigrants in the 1990s. Information Brief No. 2 in Series on Immigrant Families and Workers: Facts and Perspectives. Washington, DC: Urban Institute. November 26. (Also, http://www.urban.org/url.cfm?ID=410589.)
Passel, Jeffrey S. and Rebecca L. Clark. 1998. Immigrants in New York: Their Legal Status, Incomes and Tax Payments. Washington, DC: Urban Institute. April.
Passel, Jeffrey S. and Michael Fix. 2003. “What Do We Need to Know? Implications of Homeland Security for Immigration Data.” Speech delivered at INS and the Department

— 27 —
of Homeland Security: A Farewell Tribute— A Look Ahead, sponsored by the Migration Policy Institute. Washington, DC. February 28.
Passel, Jeffrey S., Jennifer Van Hook, and Frank D. Bean. 2005. Demographic Profile of Unauthorized Migrants and Other Immigrants, Based on Census 2000: Characteristics and Methods. Report to the Census Bureau. Washington, DC: Sabre Systems. August. (Also, http://www.sabresys.com/i_whitepapers.asp.)
Passel, Jeffrey S., Jennifer Van Hook, and Frank D. Bean. 2004. Estimates of Legal and Unauthorized Foreign Born Population for the United States and Selected States, Based on Census 2000. Report to the Census Bureau. Washington, DC: Urban Institute. June 1. (Also, http://www.sabresys.com/i_whitepapers.asp.)
Redstone, Ilana and Douglas S. Massey. 2003. “Coming to Stay: An Analysis of the U.S. Census Question on Year of Arrival.” Paper presented at the Annual Meetings of the Population Association of America. Minneapolis, MN.
Robinson, J. Gregory. 2001. Accuracy and Coverage Evaluation: Demographic Analysis Results. DSSD Census 2000 Procedures and Operations Memorandum Series B-4. Washington, DC: U.S. Census Bureau. March 2. (Also, http://www.census.gov/dmd/www/pdf/Fr4.pdf)
Suro, Roberto, Richard Fry, and Jeffrey S. Passel. 2005. Hispanics and the 2004 Election: Population, Electorate and Voters. Washington, DC: Pew Hispanic Center. June 27. (Also, http://pewhispanic.org/files/reports/48.pdf.)
U.S. Census Bureau. 2002. Current Population Survey: Design and Methodology. Technical Paper 63RV (TP63RV). Washington, DC: U.S. Census Bureau. March. (Also, http://www.census.gov/prod/2002pubs/tp63rv.pdf.)
U.S. Census Bureau. 2000. Current Population Survey: Design and Methodology. Technical Paper 63 (TP63). Washington, DC: U.S. Census Bureau. March. (Also, http://www.census.gov/prod/2000pubs/tp63.pdf.)
Van Hook, Jennifer, Jeffrey S. Passel, Weiwei Zhang, and Frank D. Bean. 2004. Foreign-Born Emigration: New Approaches and Estimates Based on Matched Current Population Survey (CPS) Files. Report to the Census Bureau. Urban Institute: Washington, DC. September. (Also, http://www.sabresys.com/i_whitepapers.asp.) Forthcoming in Demography.

— 28 —
APPENDIX A. DETAILED TABLES
for
RISE, PEAK, AND DECLINE: TRENDS IN U.S. IMMIGRATION 1992–2004
By
Jeffrey S. Passel Roberto Suro

Average Annual Immigration for Calendar Years, 1990-2004, by Race/Hispanic Origin and by Legal Statusbased on CPS, ACS, and Census 2000 Data
(In thousands)Hispanic/Race Groups Legal Status
Total** Hisp. API* White* Black* Total# LPR Undoc. Legal Temp.
Average Annualized Immigration
1990 1,287 687 318 194 87 (na) 800 473 (x)1991 1,060 504 296 188 70 (na) 711 395 (x)1992 1,066 502 298 196 69 (na) 675 394 1611993 1,031 506 268 190 66 (na) 646 401 1611994 1,129 561 266 214 86 (na) 630 519 1581995 1,256 651 286 221 96 (na) 671 581 1541996 1,171 556 287 232 95 1,234 573 503 1571997 1,198 551 307 246 93 1,257 573 517 1671998 1,462 729 334 301 96 1,541 615 668 2581999 1,529 729 344 357 98 1,594 659 656 2792000 1,552 773 334 343 98 1,559 635 667 2572001 1,388 644 318 318 105 1,386 578 549 2602002 1,168 553 292 231 91 1,140 484 450 2062003 1,102 541 276 215 68 1,041 417 451 1732004 1,226 636 282 231 76 1,191 455 562 174
Start '92-'97 1,142 554 285 217 84 1,245 628 486 160Peak '99-'00 1,540 751 339 350 98 1,577 647 662 268End '02-'04 1,165 576 283 226 78 1,124 452 488 185
Change (Amount)
to Peak 398 196 54 133 14 331 19 176 108to End -375 -174 -56 -124 -20 -452 -195 -174 -83
Change (%)
to Peak 35% 35% 19% 62% 17% 27% 3% 36% 68%to End -24% -23% -17% -35% -20% -29% -30% -26% -31%
Calendar Year
Detailed Table 1a.
— 29 —

Average Annual Immigration for Calendar Years, 1990-2004, by Race/Hispanic Origin and by Legal Statusbased on CPS, ACS, and Census 2000 Data
(In thousands)Hispanic/Race Groups Legal Status
Total** Hisp. API* White* Black* Total# LPR Undoc. Legal Temp.
Calendar Year
Detailed Table 1a.
Percent of Total Immigration
1990 100% 53% 25% 15% 7% (na) 62% 37% (x)1991 100% 48% 28% 18% 7% (na) 55% 31% (x)1992 100% 47% 28% 18% 6% (na) 52% 31% 12%1993 100% 49% 26% 18% 6% (na) 50% 31% 12%1994 100% 50% 24% 19% 8% (na) 49% 40% 12%1995 100% 52% 23% 18% 8% (na) 52% 45% 12%1996 100% 47% 25% 20% 8% 100% 46% 41% 13%1997 100% 46% 26% 21% 8% 100% 46% 41% 13%1998 100% 50% 23% 21% 7% 100% 40% 43% 17%1999 100% 48% 22% 23% 6% 100% 41% 41% 18%2000 100% 50% 22% 22% 6% 100% 41% 43% 16%2001 100% 46% 23% 23% 8% 100% 42% 40% 19%2002 100% 47% 25% 20% 8% 100% 42% 39% 18%2003 100% 49% 25% 20% 6% 100% 40% 43% 17%2004 100% 52% 23% 19% 6% 100% 38% 47% 15%
Start '92-'97 100% 49% 25% 19% 7% (x) 55% 43% 14%Peak '99-'00 100% 49% 22% 23% 6% (x) 42% 43% 17%End '02-'04 100% 49% 24% 19% 7% (x) 39% 42% 16%
Change (Amount)
to Peak 100% 49% 13% 33% 4% 100% 6% 53% 33%to End 100% 46% 15% 33% 5% 100% 43% 38% 18%
Change (%)
to Peak (na) 0% -3% 4% -1% (na) -13% 0% 3%to End (na) 1% 2% -3% 0% (na) -3% -1% -2%
Source: Passel (2005), Pew Hispanic Center.
Note: Estimates are weighted averages of annual estimates using 2000-based weights and data on:(a) year of arrival from the Current Population Surveys of March 2000-2005, the AmericanCommunity Surveys of 2000-2004, and Census 2000; and (b) data on residence 1 year agofrom the March Current Population Surveys of 2000-2005 and the American Community Surveys of 2000-2004. Data from March Current Population Surveys for 1994-2001 using 1990-based weights show similar trends but lower levels of arrivals. See text for details.
* Non-Hispanic only. Multiple-race responses from Census 2000, ACS, and 2003-2004 CPS basedon hierarchical assignment as: Black, Asian-Pacific Islander (API), White, and American Indian
** Total includes American Indian/Alaska Native not shown separately.# Legal status at time of survey. Totals do not add because data on temporary migrants are available
only from the Census and CPSs in the 1-3 years following arrival. LPRs, or Legal PermanentResidents, include those arriving as refugees and those who have naturalized.
(x) -- not available. (na) -- not applicable.
— 30 —

Average Annual Immigration for Calendar Years, 1990-2004, by Country or Region of Birth
based on CPS, ACS, and Census 2000 Data(In thousands)
Country of Birth
Total MexicoOther Latin
Amer.
Europe & Can. India Middle
East*Other
Asia All Other
Average Annualized Immigration
1990 1,287 470 296 142 39 27 274 381991 1,060 337 227 143 38 23 257 351992 1,058 329 222 153 39 24 251 391993 1,023 332 218 148 38 24 225 401994 1,129 372 262 162 45 26 217 461995 1,256 443 284 161 50 28 231 591996 1,171 388 235 167 60 32 221 681997 1,198 390 225 180 71 32 230 711998 1,462 507 292 218 83 32 247 831999 1,529 496 312 255 91 42 246 872000 1,552 530 326 241 89 41 245 822001 1,388 437 282 217 84 44 237 862002 1,168 378 244 150 62 36 231 672003 1,102 369 228 143 55 30 220 552004 1,223 459 241 147 73 30 205 69
Start '92-'97 1,139 376 241 162 51 28 229 54Peak '99-'00 1,541 513 319 248 90 41 246 85End '02-'04 1,164 402 238 147 63 32 219 64
Change (Amount)
to Peak 401 137 78 86 39 14 16 31to End -376 -111 -81 -101 -27 -10 -26 -21
Change (%)
to Peak 35% 37% 32% 53% 77% 51% 7% 57%to End -24% -22% -25% -41% -30% -23% -11% -24%
Calendar Year
Detailed Table 1b.
— 31 —

Average Annual Immigration for Calendar Years, 1990-2004, by Country or Region of Birth
based on CPS, ACS, and Census 2000 Data(In thousands)
Country of Birth
Total MexicoOther Latin
Amer.
Europe & Can. India Middle
East*Other
Asia All OtherCalendar Year
Detailed Table 1b.
Percent of Total Immigration
1990 100% 37% 23% 11% 3% 2% 21% 3%1991 100% 32% 21% 13% 4% 2% 24% 3%1992 100% 31% 21% 14% 4% 2% 24% 4%1993 100% 32% 21% 14% 4% 2% 22% 4%1994 100% 33% 23% 14% 4% 2% 19% 4%1995 100% 35% 23% 13% 4% 2% 18% 5%1996 100% 33% 20% 14% 5% 3% 19% 6%1997 100% 33% 19% 15% 6% 3% 19% 6%1998 100% 35% 20% 15% 6% 2% 17% 6%1999 100% 32% 20% 17% 6% 3% 16% 6%2000 100% 34% 21% 15% 6% 3% 16% 5%2001 100% 32% 20% 16% 6% 3% 17% 6%2002 100% 32% 21% 13% 5% 3% 20% 6%2003 100% 34% 21% 13% 5% 3% 20% 5%2004 100% 38% 20% 12% 6% 2% 17% 6%
Start '92-'97 100% 33% 21% 14% 4% 2% 20% 5%Peak '99-'00 100% 33% 21% 16% 6% 3% 16% 5%End '02-'04 100% 35% 20% 13% 5% 3% 19% 5%
Change (Amt.)
to Peak 100% 34% 19% 21% 10% 3% 4% 8%to End 100% 29% 22% 27% 7% 3% 7% 5%
Change (%)
to Peak (na) 0% 0% 2% 1% 0% -4% 1%to End (na) 1% 0% -3% 0% 0% 3% 0%
Source: Passel (2005), Pew Hispanic Center.
Note: Estimates are weighted averages of annual estimates using 2000-based weights and data on: (a) year of arrival from the Current Population Surveys of March 2000-2005, the American Community Surveys of 2000-2004, and Census 2000; and (b) data onresidence 1 year ago from the March Current Population Surveys of 2000-2005 andthe American Community Surveys of 2000-2004. Data from March Current PopulationSurveys for 1994-2001 using 1990-based weights show similar trends but lower levels of arrivals. See text for details.
* "Middle East" for these tabulations is defined as countries in southwestern Asia from Turkeyin the north and west to Iran/Afghanistan in the east and Saudi Arabia/Yemen in the south.
(na) -- not applicable.
— 32 —

Average Annual Immigration for Calendar Years, 1990-2004, by State and Region of Residence based on CPS, ACS, and Census 2000 Data
(In thousands)States
Total Big 6* CA NY TX FL IL NJ New Growth**
South-east
Mid-west
Mtn./West
All Other
North-east/
South
Mid-west/West
Average Annualized Immigration
1990 1,287 936 425 168 129 91 61 60 193 59 29 105 158 90 681991 1,060 758 333 141 104 78 50 51 159 48 25 86 143 80 631992 1,066 727 290 144 104 87 50 53 182 63 28 92 156 88 681993 1,031 693 262 140 105 86 51 48 181 64 26 91 158 90 671994 1,129 761 271 158 111 105 62 54 201 72 32 97 167 90 771995 1,256 833 290 163 134 121 66 58 239 87 35 117 185 98 861996 1,171 741 276 136 128 88 59 54 240 92 38 109 191 102 881997 1,198 741 282 132 126 89 59 53 254 101 41 112 204 110 931998 1,462 875 321 136 154 123 78 64 334 135 52 147 253 140 1131999 1,529 901 330 137 147 157 68 61 355 145 58 152 273 151 1222000 1,552 909 332 128 163 152 72 63 356 136 56 164 287 159 1292001 1,388 818 305 112 138 140 61 61 303 111 50 141 267 153 1152002 1,168 667 230 87 133 110 55 51 269 113 39 117 232 132 1002003 1,102 629 221 90 124 101 51 42 262 120 42 100 211 111 1002004 1,222 695 265 94 126 110 53 46 325 159 47 119 202 99 102
Start '92-'97 1,142 749 279 145 118 96 58 53 216 80 33 103 177 97 80Peak '99-'00 1,541 905 331 133 155 154 70 62 355 140 57 158 280 155 125End '02-'04 1,164 663 239 90 128 107 53 46 286 131 43 112 215 114 100
Change (Amount)
to Peak 399 156 52 -13 37 58 12 9 139 61 24 55 104 58 45to End -377 -241 -92 -42 -27 -47 -17 -16 -70 -9 -14 -46 -66 -41 -25
Change (%)
to Peak 35% 21% 19% -9% 31% 61% 21% 16% 64% 76% 71% 53% 59% 60% 57%to End -24% -27% -28% -32% -17% -30% -24% -26% -20% -7% -25% -29% -23% -26% -20%
Calendar Year
Detailed Table 1c.
— 33 —
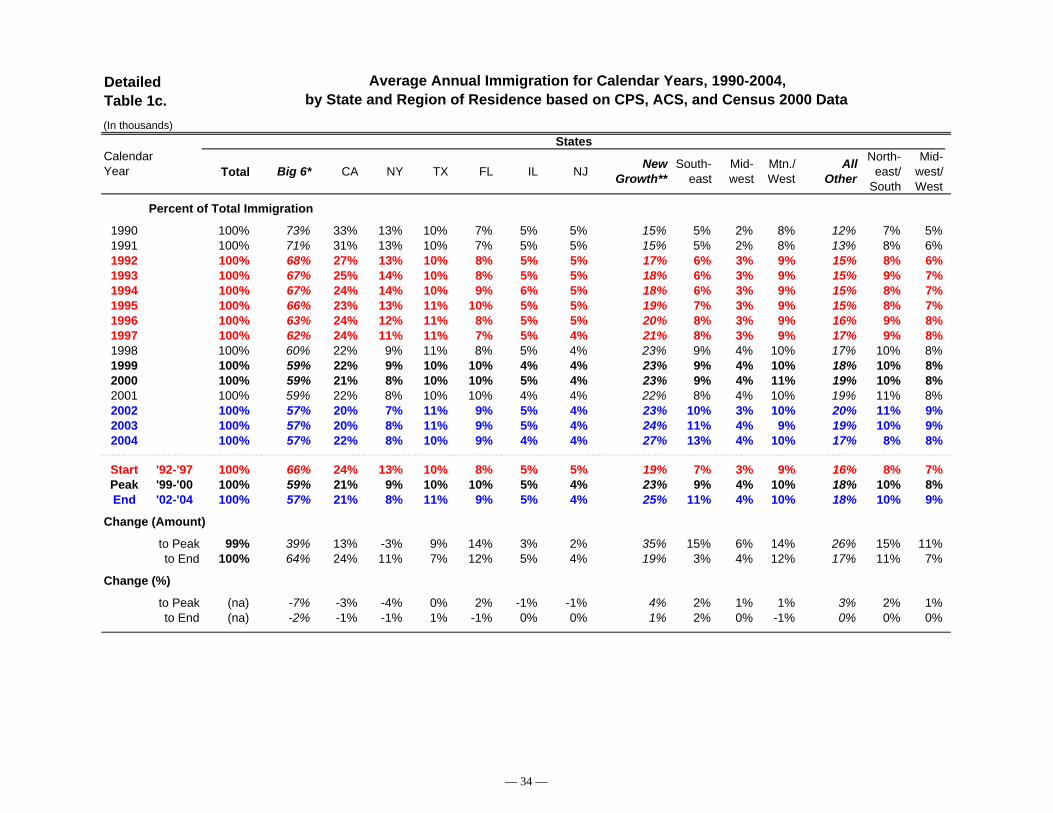
Average Annual Immigration for Calendar Years, 1990-2004, by State and Region of Residence based on CPS, ACS, and Census 2000 Data
(In thousands)States
Total Big 6* CA NY TX FL IL NJ New Growth**
South-east
Mid-west
Mtn./West
All Other
North-east/
South
Mid-west/West
Calendar Year
Detailed Table 1c.
Percent of Total Immigration
1990 100% 73% 33% 13% 10% 7% 5% 5% 15% 5% 2% 8% 12% 7% 5%1991 100% 71% 31% 13% 10% 7% 5% 5% 15% 5% 2% 8% 13% 8% 6%1992 100% 68% 27% 13% 10% 8% 5% 5% 17% 6% 3% 9% 15% 8% 6%1993 100% 67% 25% 14% 10% 8% 5% 5% 18% 6% 3% 9% 15% 9% 7%1994 100% 67% 24% 14% 10% 9% 6% 5% 18% 6% 3% 9% 15% 8% 7%1995 100% 66% 23% 13% 11% 10% 5% 5% 19% 7% 3% 9% 15% 8% 7%1996 100% 63% 24% 12% 11% 8% 5% 5% 20% 8% 3% 9% 16% 9% 8%1997 100% 62% 24% 11% 11% 7% 5% 4% 21% 8% 3% 9% 17% 9% 8%1998 100% 60% 22% 9% 11% 8% 5% 4% 23% 9% 4% 10% 17% 10% 8%1999 100% 59% 22% 9% 10% 10% 4% 4% 23% 9% 4% 10% 18% 10% 8%2000 100% 59% 21% 8% 10% 10% 5% 4% 23% 9% 4% 11% 19% 10% 8%2001 100% 59% 22% 8% 10% 10% 4% 4% 22% 8% 4% 10% 19% 11% 8%2002 100% 57% 20% 7% 11% 9% 5% 4% 23% 10% 3% 10% 20% 11% 9%2003 100% 57% 20% 8% 11% 9% 5% 4% 24% 11% 4% 9% 19% 10% 9%2004 100% 57% 22% 8% 10% 9% 4% 4% 27% 13% 4% 10% 17% 8% 8%
Start '92-'97 100% 66% 24% 13% 10% 8% 5% 5% 19% 7% 3% 9% 16% 8% 7%Peak '99-'00 100% 59% 21% 9% 10% 10% 5% 4% 23% 9% 4% 10% 18% 10% 8%End '02-'04 100% 57% 21% 8% 11% 9% 5% 4% 25% 11% 4% 10% 18% 10% 9%
Change (Amount)
to Peak 99% 39% 13% -3% 9% 14% 3% 2% 35% 15% 6% 14% 26% 15% 11%to End 100% 64% 24% 11% 7% 12% 5% 4% 19% 3% 4% 12% 17% 11% 7%
Change (%)
to Peak (na) -7% -3% -4% 0% 2% -1% -1% 4% 2% 1% 1% 3% 2% 1%to End (na) -2% -1% -1% 1% -1% 0% 0% 1% 2% 0% -1% 0% 0% 0%
— 34 —

Average Annual Immigration for Calendar Years, 1990-2004, by State and Region of Residence based on CPS, ACS, and Census 2000 Data
(In thousands)States
Total Big 6* CA NY TX FL IL NJ New Growth**
South-east
Mid-west
Mtn./West
All Other
North-east/
South
Mid-west/West
Calendar Year
Detailed Table 1c.
Source: Passel (2005), Pew Hispanic Center.
Note: Estimates are weighted averages of annual estimates using 2000-based weights and data on: (a) year of arrival from the Current Population Surveys of March 2000-2005, the American Community Surveys of 2000-2004, and Census 2000; and (b) data on residence 1 year ago from the March Current Population Surveys of 2000-2005 and the American Community Surveys of 2000-2004. Data from March Current Population Surveys for 1994-2001 using 1990-based weights show similar trends but lower levels of arrivals. See text for details.
* The 6 states with the largest immigrant populations: CA, NY, TX, FL, IL, and NJ.** "New Growth States" are states other than the 6 largest immigration states where the foreign-born population grew faster during 1990-2000 than
in the fastest growing large state (TX). The 22 New Growth States are: Southeast -- DE, NC, SC, GA, KY, TN, AL, MS, AR, OK; Mid-West -- IN, MN, IA, NE, KS; and Mountain/West -- ID, CO, AZ, UT, NV, WA, OR.
(na) -- not applicable.
— 35 —

Average Annual Immigration for Calendar Years, 1990-2004, by Race/Hispanic Origin and by Estimation Methodbased on CPS, ACS, and Census 2000 Data
(In thousands)2000-Based 1990-Based 2000-Based '90-Based
CPS (arrival)
ACS (arrival)
Cen. 2000
(arrival)
CPS (yr ago)
ACS (yr ago)
CPS (arrival)
CPS (yr ago)
CPS (arrival)
ACS (arrival)
Cen. 2000
(arrival)
CPS (yr ago)
ACS (yr ago)
CPS (arrival)
CPS (yr ago)
Total Population** Hispanic Population
1990 1,287 1,212 1,307 1,342 (x) (x) 1,171 (x) 687 641 701 720 (x) (x) 520 (x)1991 1,060 1,212 959 1,008 (x) (x) 1,171 (x) 504 641 426 446 (x) (x) 520 (x)1992 1,066 1,077 1,045 1,076 (x) (x) 1,030 (x) 502 544 469 493 (x) (x) 456 (x)1993 1,031 1,077 981 1,036 (x) (x) 1,030 867 506 544 478 497 (x) (x) 456 3631994 1,129 1,207 1,041 1,140 (x) (x) 1,058 867 561 604 505 576 (x) (x) 480 3631995 1,256 1,207 1,205 1,357 (x) (x) 1,051 934 651 604 630 718 (x) (x) 482 4271996 1,171 1,192 1,161 1,161 (x) (x) 1,067 922 556 555 568 546 (x) (x) 462 3881997 1,198 1,192 1,172 1,229 (x) (x) 1,071 817 551 555 546 551 (x) (x) 469 2951998 1,462 1,539 1,388 1,458 (x) (x) 1,242 921 729 799 685 702 (x) (x) 567 3611999 1,529 1,539 1,536 1,817 1,341 1,412 1,329 1,200 729 799 785 909 585 567 627 4942000 1,552 1,595 1,665 1,765 1,310 1,426 1,388 1,209 773 817 844 1,040 576 586 666 4992001 1,388 1,614 1,432 (x) 1,154 1,350 1,405 1,200 644 833 673 (x) 506 564 676 4952002 1,168 1,324 1,244 (x) 958 1,147 (x) (x) 553 677 625 (x) 425 483 (x) (x)2003 1,102 1,274 1,196 (x) 852 1,084 (x) (x) 541 661 615 (x) 394 495 (x) (x)2004 1,226 1,259 1,297 (x) 1,216 1,134 (x) (x) 636 655 676 (x) 667 546 (x) (x)
Start '92-'97 1,142 1,159 1,101 1,166 (x) (x) 1,051 882 554 568 532 563 (x) (x) 467 367Peak '99-'00 1,540 1,567 1,600 1,791 1,325 1,419 1,359 1,204 751 808 814 975 581 577 646 496End '02-'04 1,165 1,285 1,245 (x) 1,009 1,122 (x) (x) 576 664 639 (x) 495 508 (x) (x)
Change (Amount)
to Peak 398 408 499 624 (x) (x) 308 323 196 241 282 411 (x) (x) 179 129to End -375 -281 -355 (x) -317 -297 (x) (x) -174 -144 -176 (x) -86 -68 (x) (x)
Change (%)
to Peak 35% 35% 45% 54% (x) (x) 29% 37% 35% 42% 53% 73% (x) (x) 38% 35%to End -24% -18% -22% (x) -24% -21% (x) (x) -23% -18% -22% (x) -15% -12% (x) (x)
CalendarYear
Average(2000-Based)
Average(2000-Based)
Detailed Table 2a.
— 36 —
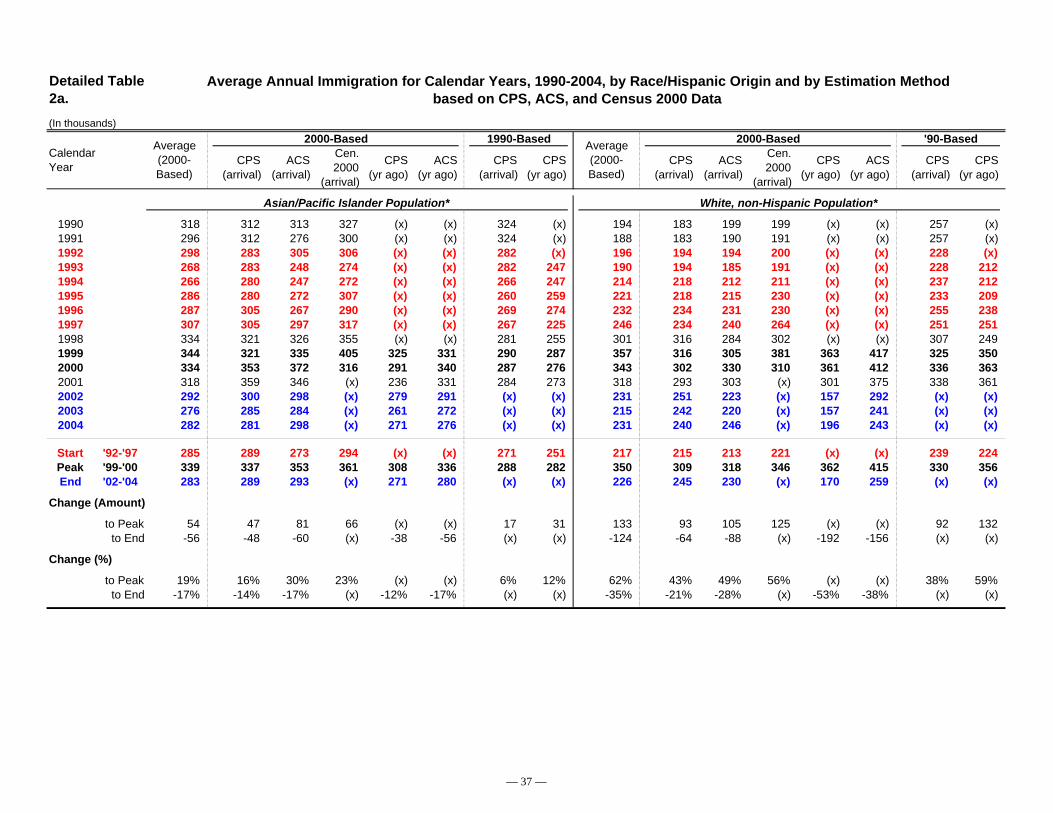
Average Annual Immigration for Calendar Years, 1990-2004, by Race/Hispanic Origin and by Estimation Methodbased on CPS, ACS, and Census 2000 Data
(In thousands)2000-Based 1990-Based 2000-Based '90-Based
CPS (arrival)
ACS (arrival)
Cen. 2000
(arrival)
CPS (yr ago)
ACS (yr ago)
CPS (arrival)
CPS (yr ago)
CPS (arrival)
ACS (arrival)
Cen. 2000
(arrival)
CPS (yr ago)
ACS (yr ago)
CPS (arrival)
CPS (yr ago)
CalendarYear
Average(2000-Based)
Average(2000-Based)
Detailed Table 2a.
Asian/Pacific Islander Population* White, non-Hispanic Population*
1990 318 312 313 327 (x) (x) 324 (x) 194 183 199 199 (x) (x) 257 (x)1991 296 312 276 300 (x) (x) 324 (x) 188 183 190 191 (x) (x) 257 (x)1992 298 283 305 306 (x) (x) 282 (x) 196 194 194 200 (x) (x) 228 (x)1993 268 283 248 274 (x) (x) 282 247 190 194 185 191 (x) (x) 228 2121994 266 280 247 272 (x) (x) 266 247 214 218 212 211 (x) (x) 237 2121995 286 280 272 307 (x) (x) 260 259 221 218 215 230 (x) (x) 233 2091996 287 305 267 290 (x) (x) 269 274 232 234 231 230 (x) (x) 255 2381997 307 305 297 317 (x) (x) 267 225 246 234 240 264 (x) (x) 251 2511998 334 321 326 355 (x) (x) 281 255 301 316 284 302 (x) (x) 307 2491999 344 321 335 405 325 331 290 287 357 316 305 381 363 417 325 3502000 334 353 372 316 291 340 287 276 343 302 330 310 361 412 336 3632001 318 359 346 (x) 236 331 284 273 318 293 303 (x) 301 375 338 3612002 292 300 298 (x) 279 291 (x) (x) 231 251 223 (x) 157 292 (x) (x)2003 276 285 284 (x) 261 272 (x) (x) 215 242 220 (x) 157 241 (x) (x)2004 282 281 298 (x) 271 276 (x) (x) 231 240 246 (x) 196 243 (x) (x)
Start '92-'97 285 289 273 294 (x) (x) 271 251 217 215 213 221 (x) (x) 239 224Peak '99-'00 339 337 353 361 308 336 288 282 350 309 318 346 362 415 330 356End '02-'04 283 289 293 (x) 271 280 (x) (x) 226 245 230 (x) 170 259 (x) (x)
Change (Amount)
to Peak 54 47 81 66 (x) (x) 17 31 133 93 105 125 (x) (x) 92 132to End -56 -48 -60 (x) -38 -56 (x) (x) -124 -64 -88 (x) -192 -156 (x) (x)
Change (%)
to Peak 19% 16% 30% 23% (x) (x) 6% 12% 62% 43% 49% 56% (x) (x) 38% 59%to End -17% -14% -17% (x) -12% -17% (x) (x) -35% -21% -28% (x) -53% -38% (x) (x)
— 37 —

Average Annual Immigration for Calendar Years, 1990-2004, by Race/Hispanic Origin and by Estimation Methodbased on CPS, ACS, and Census 2000 Data
(In thousands)2000-Based 1990-Based 2000-Based '90-Based
CPS (arrival)
ACS (arrival)
Cen. 2000
(arrival)
CPS (yr ago)
ACS (yr ago)
CPS (arrival)
CPS (yr ago)
CPS (arrival)
ACS (arrival)
Cen. 2000
(arrival)
CPS (yr ago)
ACS (yr ago)
CPS (arrival)
CPS (yr ago)
CalendarYear
Average(2000-Based)
Average(2000-Based)
Detailed Table 2a.
Black, non-Hispanic Population*
1990 87 73 94 95 (x) (x) 68 (x)1991 70 73 66 71 (x) (x) 68 (x)1992 69 55 77 76 (x) (x) 62 (x)1993 66 55 69 73 (x) (x) 62 431994 86 101 76 80 (x) (x) 74 431995 96 101 86 101 (x) (x) 76 371996 95 96 95 94 (x) (x) 79 211997 93 96 88 96 (x) (x) 83 461998 96 99 91 97 (x) (x) 83 561999 98 99 110 119 68 95 82 682000 98 120 117 99 70 86 94 572001 105 126 110 (x) 107 79 100 542002 91 93 97 (x) 94 81 (x) (x)2003 68 83 76 (x) 39 75 (x) (x)2004 76 80 77 (x) 77 68 (x) (x)
Start '92-'97 84 84 82 87 (x) (x) 73 38Peak '99-'00 98 109 113 109 69 91 88 62End '02-'04 78 85 84 (x) 70 75 (x) (x)
Change (Amount)
to Peak 14 25 32 22 (x) (x) 16 25to End -20 -24 -30 (x) 1 -16 (x) (x)
Change (%)
to Peak 17% 30% 39% 26% (x) (x) 21% 65%to End -20% -22% -26% (x) 1% -17% (x) (x)
Source: Passel (2005), Pew Hispanic Center.
Note: See text for details of estimation methods.
* Multiple-race responses from Census 2000, ACS, and 2003-2004 CPS based on hierarchical assignment as: Black, Asian-Pacific Islander (API), White, and American Indian.** Total includes American Indian/Alaska Native not shown separately.(x) -- not available.
— 38 —

Average Annual Immigration for Calendar Years, 1990-2004, by Country or Region of Birth and by Estimation Methodbased on CPS, ACS, and Census 2000 Data
(In thousands)2000-Based 1990-Based 2000-Based '90-Based
CPS (arrival)
ACS (arrival)
Cen. 2000
(arrival)
CPS (yr ago)
ACS (yr ago)
CPS (arrival)
CPS (yr ago)
CPS (arrival)
ACS (arrival)
Cen. 2000
(arrival)
CPS (yr ago)
ACS (yr ago)
CPS (arrival)
CPS (yr ago)
Born in Mexico Born in Other Latin America
1990 470 429 483 499 (x) (x) 347 (x) 296 280 305 303 (x) (x) 232 (x)1991 337 429 284 299 (x) (x) 347 (x) 227 280 195 207 (x) (x) 232 (x)1992 329 353 307 328 (x) (x) 305 (x) 222 211 228 228 (x) (x) 206 (x)1993 332 353 314 328 (x) (x) 305 (x) 218 211 217 226 (x) (x) 206 (x)1994 372 400 331 384 (x) (x) 317 (x) 262 292 234 260 (x) (x) 228 (x)1995 443 400 442 486 (x) (x) 317 329 284 292 254 306 (x) (x) 233 1121996 388 384 404 375 (x) (x) 307 274 235 243 228 235 (x) (x) 213 1311997 390 384 396 389 (x) (x) 310 178 225 243 211 223 (x) (x) 217 1281998 507 551 476 494 (x) (x) 373 262 292 328 274 276 (x) (x) 261 1511999 496 551 537 625 352 413 418 302 312 328 322 373 303 236 282 2632000 530 559 569 756 364 400 459 310 326 349 358 374 286 261 281 2572001 437 570 436 (x) 379 364 472 311 282 357 312 (x) 193 267 277 2522002 378 461 427 (x) 301 322 (x) (x) 244 292 269 (x) 192 224 (x) (x)2003 369 452 416 (x) 266 343 (x) (x) 228 280 264 (x) 159 210 (x) (x)2004 459 448 507 (x) 496 384 (x) (x) 241 276 249 (x) 219 219 (x) (x)
Start '92-'97 376 379 366 382 (x) (x) 310 260 241 249 229 246 (x) (x) 217 124Peak '99-'00 513 555 553 691 358 407 438 306 319 338 340 373 294 249 282 260End '02-'04 402 454 450 (x) 354 350 (x) (x) 238 282 261 (x) 190 218 (x) (x)
Change (Amount)
to Peak 137 176 187 309 (x) (x) 128 46 78 90 111 127 (x) (x) 65 136to End -111 -102 -103 (x) -4 -57 (x) (x) -81 -56 -79 (x) -104 -31 (x) (x)
Change (%)
to Peak 37% 46% 51% 81% (x) (x) 41% 17% 32% 36% 49% 52% (x) (x) 30% 110%to End -22% -18% -19% (x) -1% -14% (x) (x) -25% -17% -23% (x) -35% -12% (x) (x)
CalendarYear
Average(2000-Based)
Average(2000-Based)
Detailed Table 2b.
— 39 —
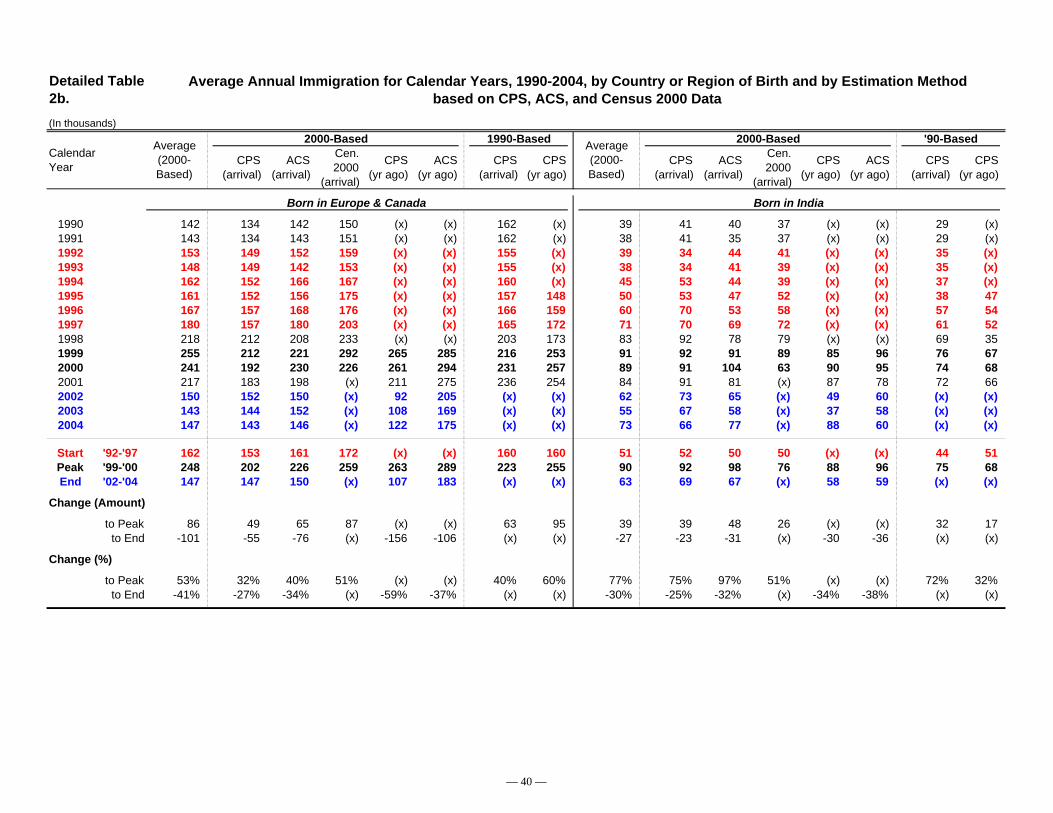
Average Annual Immigration for Calendar Years, 1990-2004, by Country or Region of Birth and by Estimation Methodbased on CPS, ACS, and Census 2000 Data
(In thousands)2000-Based 1990-Based 2000-Based '90-Based
CPS (arrival)
ACS (arrival)
Cen. 2000
(arrival)
CPS (yr ago)
ACS (yr ago)
CPS (arrival)
CPS (yr ago)
CPS (arrival)
ACS (arrival)
Cen. 2000
(arrival)
CPS (yr ago)
ACS (yr ago)
CPS (arrival)
CPS (yr ago)
CalendarYear
Average(2000-Based)
Average(2000-Based)
Detailed Table 2b.
Born in Europe & Canada Born in India
1990 142 134 142 150 (x) (x) 162 (x) 39 41 40 37 (x) (x) 29 (x)1991 143 134 143 151 (x) (x) 162 (x) 38 41 35 37 (x) (x) 29 (x)1992 153 149 152 159 (x) (x) 155 (x) 39 34 44 41 (x) (x) 35 (x)1993 148 149 142 153 (x) (x) 155 (x) 38 34 41 39 (x) (x) 35 (x)1994 162 152 166 167 (x) (x) 160 (x) 45 53 44 39 (x) (x) 37 (x)1995 161 152 156 175 (x) (x) 157 148 50 53 47 52 (x) (x) 38 471996 167 157 168 176 (x) (x) 166 159 60 70 53 58 (x) (x) 57 541997 180 157 180 203 (x) (x) 165 172 71 70 69 72 (x) (x) 61 521998 218 212 208 233 (x) (x) 203 173 83 92 78 79 (x) (x) 69 351999 255 212 221 292 265 285 216 253 91 92 91 89 85 96 76 672000 241 192 230 226 261 294 231 257 89 91 104 63 90 95 74 682001 217 183 198 (x) 211 275 236 254 84 91 81 (x) 87 78 72 662002 150 152 150 (x) 92 205 (x) (x) 62 73 65 (x) 49 60 (x) (x)2003 143 144 152 (x) 108 169 (x) (x) 55 67 58 (x) 37 58 (x) (x)2004 147 143 146 (x) 122 175 (x) (x) 73 66 77 (x) 88 60 (x) (x)
Start '92-'97 162 153 161 172 (x) (x) 160 160 51 52 50 50 (x) (x) 44 51Peak '99-'00 248 202 226 259 263 289 223 255 90 92 98 76 88 96 75 68End '02-'04 147 147 150 (x) 107 183 (x) (x) 63 69 67 (x) 58 59 (x) (x)
Change (Amount)
to Peak 86 49 65 87 (x) (x) 63 95 39 39 48 26 (x) (x) 32 17to End -101 -55 -76 (x) -156 -106 (x) (x) -27 -23 -31 (x) -30 -36 (x) (x)
Change (%)
to Peak 53% 32% 40% 51% (x) (x) 40% 60% 77% 75% 97% 51% (x) (x) 72% 32%to End -41% -27% -34% (x) -59% -37% (x) (x) -30% -25% -32% (x) -34% -38% (x) (x)
— 40 —

Average Annual Immigration for Calendar Years, 1990-2004, by Country or Region of Birth and by Estimation Methodbased on CPS, ACS, and Census 2000 Data
(In thousands)2000-Based 1990-Based 2000-Based '90-Based
CPS (arrival)
ACS (arrival)
Cen. 2000
(arrival)
CPS (yr ago)
ACS (yr ago)
CPS (arrival)
CPS (yr ago)
CPS (arrival)
ACS (arrival)
Cen. 2000
(arrival)
CPS (yr ago)
ACS (yr ago)
CPS (arrival)
CPS (yr ago)
CalendarYear
Average(2000-Based)
Average(2000-Based)
Detailed Table 2b.
Born in Middle Eastern Countries* Born in Other Asian Countries
1990 27 20 30 32 (x) (x) 31 (x) 274 273 268 280 (x) (x) 325 (x)1991 23 20 25 24 (x) (x) 31 (x) 257 273 242 257 (x) (x) 325 (x)1992 24 23 22 27 (x) (x) 21 (x) 251 238 257 258 (x) (x) 248 (x)1993 24 23 25 24 (x) (x) 21 (x) 225 238 208 228 (x) (x) 248 (x)1994 26 26 25 27 (x) (x) 32 (x) 217 227 200 223 (x) (x) 228 (x)1995 28 26 26 32 (x) (x) 34 30 231 227 221 246 (x) (x) 220 2091996 32 29 36 31 (x) (x) 37 46 221 233 209 223 (x) (x) 218 2121997 32 29 30 36 (x) (x) 35 32 230 233 222 234 (x) (x) 213 1901998 32 29 33 34 (x) (x) 32 25 247 228 246 265 (x) (x) 213 2121999 42 29 36 42 44 57 30 40 246 228 240 302 226 236 209 2082000 41 41 43 31 42 49 31 46 245 263 266 239 210 244 210 2122001 44 44 57 (x) 30 44 32 47 237 270 262 (x) 165 253 211 2132002 36 34 35 (x) 30 43 (x) (x) 231 232 231 (x) 231 232 (x) (x)2003 30 30 23 (x) 32 34 (x) (x) 220 223 227 (x) 222 210 (x) (x)2004 30 29 29 (x) 31 30 (x) (x) 205 221 208 (x) 185 208 (x) (x)
Start '92-'97 28 26 27 29 (x) (x) 30 36 229 233 219 235 (x) (x) 229 204Peak '99-'00 41 35 40 37 43 53 30 43 246 246 253 271 218 240 209 210End '02-'04 32 31 29 (x) 31 36 (x) (x) 219 225 222 (x) 212 217 (x) (x)
Change (Amount)
to Peak 14 9 12 7 (x) (x) 1 8 16 13 34 35 (x) (x) -20 6to End -10 -4 -10 (x) -12 -17 (x) (x) -26 -21 -31 (x) -5 -23 (x) (x)
Change (%)
to Peak 51% 36% 44% 25% (x) (x) 2% 21% 7% 6% 15% 15% (x) (x) -9% 3%to End -23% -11% -26% (x) -28% -32% (x) (x) -11% -8% -12% (x) -3% -10% (x) (x)
— 41 —

Average Annual Immigration for Calendar Years, 1990-2004, by Country or Region of Birth and by Estimation Methodbased on CPS, ACS, and Census 2000 Data
(In thousands)2000-Based 1990-Based 2000-Based '90-Based
CPS (arrival)
ACS (arrival)
Cen. 2000
(arrival)
CPS (yr ago)
ACS (yr ago)
CPS (arrival)
CPS (yr ago)
CPS (arrival)
ACS (arrival)
Cen. 2000
(arrival)
CPS (yr ago)
ACS (yr ago)
CPS (arrival)
CPS (yr ago)
CalendarYear
Average(2000-Based)
Average(2000-Based)
Detailed Table 2b.
Born in All Other Countries
1990 38 35 39 41 (x) (x) 59 (x)1991 35 35 35 34 (x) (x) 59 (x)1992 39 46 35 36 (x) (x) 61 (x)1993 40 46 35 37 (x) (x) 61 (x)1994 46 58 42 40 (x) (x) 55 (x)1995 59 58 59 60 (x) (x) 52 591996 68 76 63 65 (x) (x) 69 471997 71 76 64 72 (x) (x) 72 641998 83 99 73 76 (x) (x) 91 621999 87 99 90 93 66 88 99 652000 82 99 94 77 56 83 103 582001 86 98 86 (x) 90 69 104 572002 67 79 66 (x) 64 60 (x) (x)2003 55 77 55 (x) 29 60 (x) (x)2004 69 77 68 (x) 74 58 (x) (x)
Start '92-'97 54 60 50 52 (x) (x) 62 57Peak '99-'00 85 99 92 85 61 86 101 62End '02-'04 64 78 63 (x) 56 59 (x) (x)
Change (Amount)
to Peak 31 39 42 34 (x) (x) 39 5to End -21 -21 -29 (x) -5 -26 (x) (x)
Change (%)
to Peak 57% 65% 85% 65% (x) (x) 63% 9%to End -24% -21% -31% (x) -8% -31% (x) (x)
Source: Passel (2005), Pew Hispanic Center.
Note: See text for details of estimation methods.
* "Middle East" for these tabulations is defined as countries in southwestern Asia from Turkey in the north and west to Iran/Afghanistan in the east and Saudi Arabia/Yemen in the south.
(x) -- not available.
— 42 —
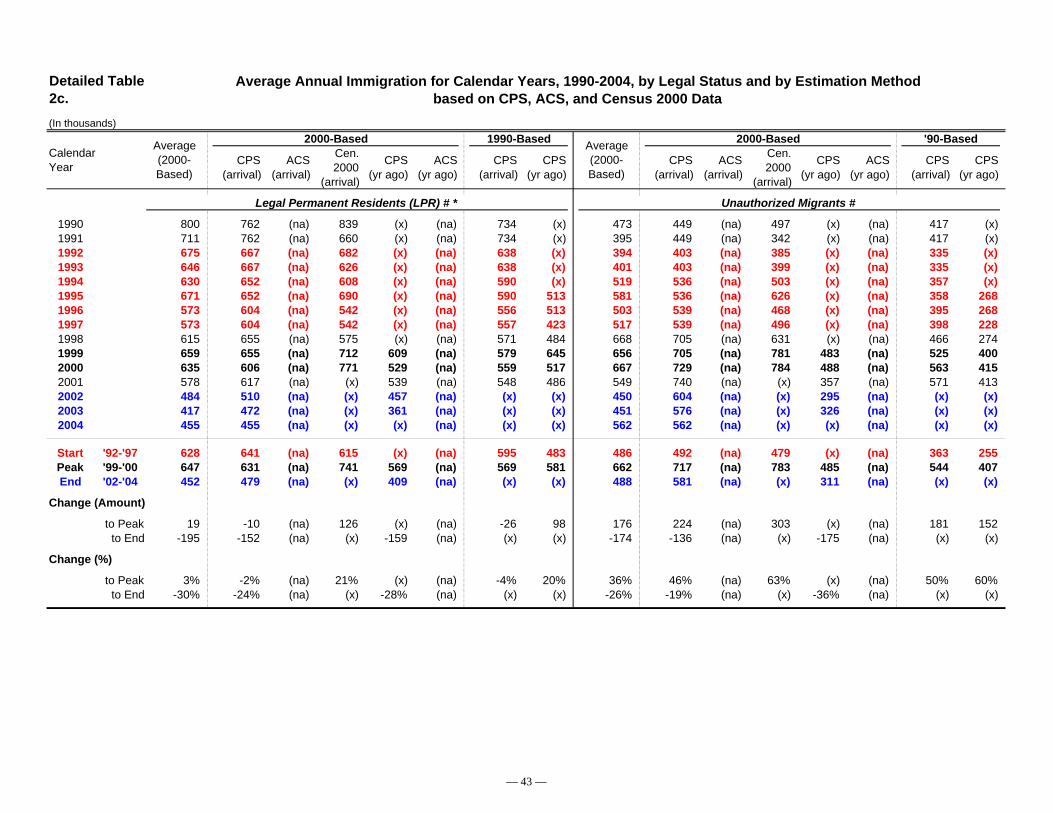
Average Annual Immigration for Calendar Years, 1990-2004, by Legal Status and by Estimation Methodbased on CPS, ACS, and Census 2000 Data
(In thousands)2000-Based 1990-Based 2000-Based '90-Based
CPS (arrival)
ACS (arrival)
Cen. 2000
(arrival)
CPS (yr ago)
ACS (yr ago)
CPS (arrival)
CPS (yr ago)
CPS (arrival)
ACS (arrival)
Cen. 2000
(arrival)
CPS (yr ago)
ACS (yr ago)
CPS (arrival)
CPS (yr ago)
Legal Permanent Residents (LPR) # * Unauthorized Migrants #
1990 800 762 (na) 839 (x) (na) 734 (x) 473 449 (na) 497 (x) (na) 417 (x)1991 711 762 (na) 660 (x) (na) 734 (x) 395 449 (na) 342 (x) (na) 417 (x)1992 675 667 (na) 682 (x) (na) 638 (x) 394 403 (na) 385 (x) (na) 335 (x)1993 646 667 (na) 626 (x) (na) 638 (x) 401 403 (na) 399 (x) (na) 335 (x)1994 630 652 (na) 608 (x) (na) 590 (x) 519 536 (na) 503 (x) (na) 357 (x)1995 671 652 (na) 690 (x) (na) 590 513 581 536 (na) 626 (x) (na) 358 2681996 573 604 (na) 542 (x) (na) 556 513 503 539 (na) 468 (x) (na) 395 2681997 573 604 (na) 542 (x) (na) 557 423 517 539 (na) 496 (x) (na) 398 2281998 615 655 (na) 575 (x) (na) 571 484 668 705 (na) 631 (x) (na) 466 2741999 659 655 (na) 712 609 (na) 579 645 656 705 (na) 781 483 (na) 525 4002000 635 606 (na) 771 529 (na) 559 517 667 729 (na) 784 488 (na) 563 4152001 578 617 (na) (x) 539 (na) 548 486 549 740 (na) (x) 357 (na) 571 4132002 484 510 (na) (x) 457 (na) (x) (x) 450 604 (na) (x) 295 (na) (x) (x)2003 417 472 (na) (x) 361 (na) (x) (x) 451 576 (na) (x) 326 (na) (x) (x)2004 455 455 (na) (x) (x) (na) (x) (x) 562 562 (na) (x) (x) (na) (x) (x)
Start '92-'97 628 641 (na) 615 (x) (na) 595 483 486 492 (na) 479 (x) (na) 363 255Peak '99-'00 647 631 (na) 741 569 (na) 569 581 662 717 (na) 783 485 (na) 544 407End '02-'04 452 479 (na) (x) 409 (na) (x) (x) 488 581 (na) (x) 311 (na) (x) (x)
Change (Amount)
to Peak 19 -10 (na) 126 (x) (na) -26 98 176 224 (na) 303 (x) (na) 181 152to End -195 -152 (na) (x) -159 (na) (x) (x) -174 -136 (na) (x) -175 (na) (x) (x)
Change (%)
to Peak 3% -2% (na) 21% (x) (na) -4% 20% 36% 46% (na) 63% (x) (na) 50% 60%to End -30% -24% (na) (x) -28% (na) (x) (x) -26% -19% (na) (x) -36% (na) (x) (x)
CalendarYear
Average(2000-Based)
Average(2000-Based)
Detailed Table 2c.
— 43 —

Average Annual Immigration for Calendar Years, 1990-2004, by Legal Status and by Estimation Methodbased on CPS, ACS, and Census 2000 Data
(In thousands)2000-Based 1990-Based 2000-Based '90-Based
CPS (arrival)
ACS (arrival)
Cen. 2000
(arrival)
CPS (yr ago)
ACS (yr ago)
CPS (arrival)
CPS (yr ago)
CPS (arrival)
ACS (arrival)
Cen. 2000
(arrival)
CPS (yr ago)
ACS (yr ago)
CPS (arrival)
CPS (yr ago)
CalendarYear
Average(2000-Based)
Average(2000-Based)
Detailed Table 2c.
Temporary Legal Migrants (Nonimmigrants) # **
1990 (x) (na) (na) (na) (x) (x) (na) (x)1991 (x) (na) (na) (na) (x) (x) (na) (x)1992 161 (na) (na) (na) (x) (x) 161 (x)1993 161 (na) (na) (na) (x) (x) 161 (x)1994 158 (na) (na) (na) (x) (x) 158 (x)1995 154 (na) (na) (na) (x) (x) 156 1531996 157 (na) (na) (na) (x) (x) 162 1531997 167 (na) (na) 192 (x) (x) 163 1461998 258 264 (na) 251 (x) (x) 206 1631999 279 264 (na) 324 250 (x) 225 1542000 257 265 (na) 212 293 (x) 267 2772001 260 261 (na) (x) 258 (x) 285 3022002 206 207 (na) (x) 206 (x) (x) (x)2003 173 182 (na) (x) 165 (x) (x) (x)2004 174 174 (na) (x) (x) (x) (x) (x)
Start '92-'97 160 (na) (na) 192 (x) (na) 160 150Peak '99-'00 268 265 (na) 268 271 (na) 246 215End '02-'04 185 188 (na) (x) 185 (na) (x) (x)
Change (Amount)
to Peak 108 (na) (na) 76 (x) (na) 86 65to End -83 -77 (na) (x) -86 (na) (x) (x)
Change (%)
to Peak 68% (na) (na) 40% (x) (na) 54% 43%to End -31% -29% (na) (x) -32% (na) (x) (x)
Source: Passel (2005), Pew Hispanic Center. (x) -- not available.
Note: See text for details of estimation methods.
# Legal status at time of survey.* LPRs, or Legal Permanent Residents, include those arriving as refugees and those who have naturalized.** Data on temporary migrants are available only from the Census and CPSs in the 1-3 years following arrival.
— 44 —
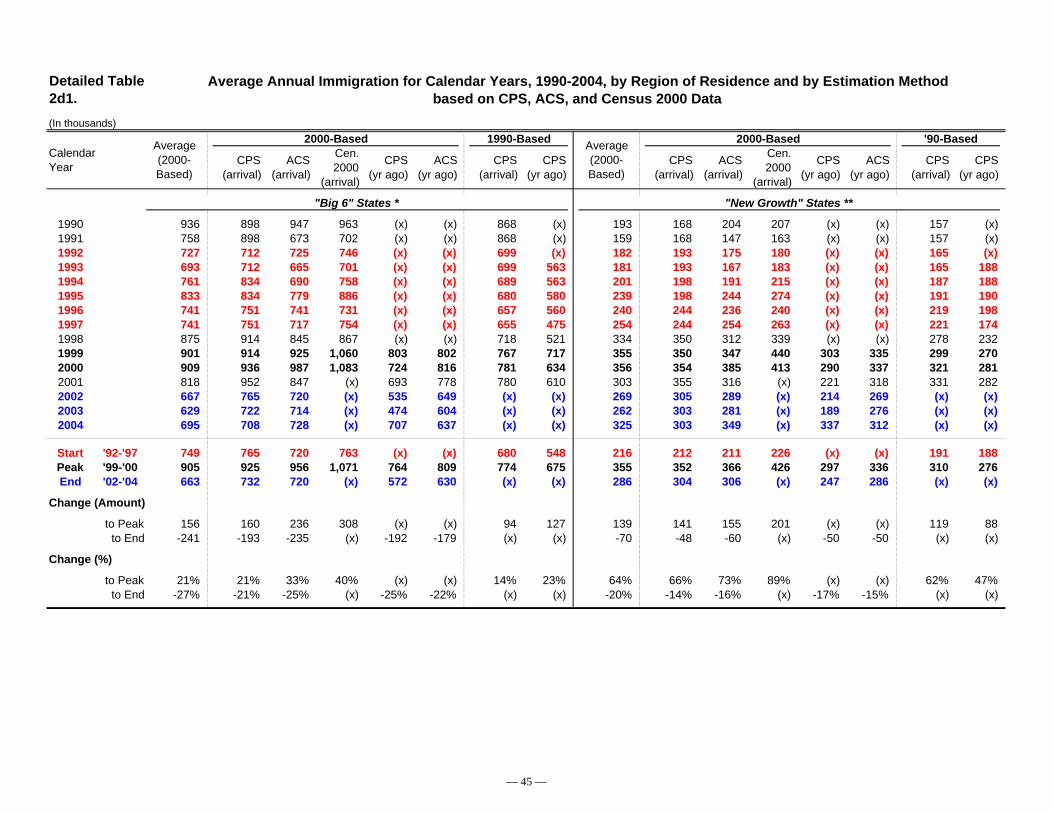
Average Annual Immigration for Calendar Years, 1990-2004, by Region of Residence and by Estimation Methodbased on CPS, ACS, and Census 2000 Data
(In thousands)2000-Based 1990-Based 2000-Based '90-Based
CPS (arrival)
ACS (arrival)
Cen. 2000
(arrival)
CPS (yr ago)
ACS (yr ago)
CPS (arrival)
CPS (yr ago)
CPS (arrival)
ACS (arrival)
Cen. 2000
(arrival)
CPS (yr ago)
ACS (yr ago)
CPS (arrival)
CPS (yr ago)
"Big 6" States * "New Growth" States **
1990 936 898 947 963 (x) (x) 868 (x) 193 168 204 207 (x) (x) 157 (x)1991 758 898 673 702 (x) (x) 868 (x) 159 168 147 163 (x) (x) 157 (x)1992 727 712 725 746 (x) (x) 699 (x) 182 193 175 180 (x) (x) 165 (x)1993 693 712 665 701 (x) (x) 699 563 181 193 167 183 (x) (x) 165 1881994 761 834 690 758 (x) (x) 689 563 201 198 191 215 (x) (x) 187 1881995 833 834 779 886 (x) (x) 680 580 239 198 244 274 (x) (x) 191 1901996 741 751 741 731 (x) (x) 657 560 240 244 236 240 (x) (x) 219 1981997 741 751 717 754 (x) (x) 655 475 254 244 254 263 (x) (x) 221 1741998 875 914 845 867 (x) (x) 718 521 334 350 312 339 (x) (x) 278 2321999 901 914 925 1,060 803 802 767 717 355 350 347 440 303 335 299 2702000 909 936 987 1,083 724 816 781 634 356 354 385 413 290 337 321 2812001 818 952 847 (x) 693 778 780 610 303 355 316 (x) 221 318 331 2822002 667 765 720 (x) 535 649 (x) (x) 269 305 289 (x) 214 269 (x) (x)2003 629 722 714 (x) 474 604 (x) (x) 262 303 281 (x) 189 276 (x) (x)2004 695 708 728 (x) 707 637 (x) (x) 325 303 349 (x) 337 312 (x) (x)
Start '92-'97 749 765 720 763 (x) (x) 680 548 216 212 211 226 (x) (x) 191 188Peak '99-'00 905 925 956 1,071 764 809 774 675 355 352 366 426 297 336 310 276End '02-'04 663 732 720 (x) 572 630 (x) (x) 286 304 306 (x) 247 286 (x) (x)
Change (Amount)
to Peak 156 160 236 308 (x) (x) 94 127 139 141 155 201 (x) (x) 119 88to End -241 -193 -235 (x) -192 -179 (x) (x) -70 -48 -60 (x) -50 -50 (x) (x)
Change (%)
to Peak 21% 21% 33% 40% (x) (x) 14% 23% 64% 66% 73% 89% (x) (x) 62% 47%to End -27% -21% -25% (x) -25% -22% (x) (x) -20% -14% -16% (x) -17% -15% (x) (x)
CalendarYear
Average(2000-Based)
Average(2000-Based)
Detailed Table 2d1.
— 45 —

Average Annual Immigration for Calendar Years, 1990-2004, by Region of Residence and by Estimation Methodbased on CPS, ACS, and Census 2000 Data
(In thousands)2000-Based 1990-Based 2000-Based '90-Based
CPS (arrival)
ACS (arrival)
Cen. 2000
(arrival)
CPS (yr ago)
ACS (yr ago)
CPS (arrival)
CPS (yr ago)
CPS (arrival)
ACS (arrival)
Cen. 2000
(arrival)
CPS (yr ago)
ACS (yr ago)
CPS (arrival)
CPS (yr ago)
CalendarYear
Average(2000-Based)
Average(2000-Based)
Detailed Table 2d1.
All Other States
1990 158 146 157 172 (x) (x) 146 (x)1991 143 146 139 143 (x) (x) 146 (x)1992 156 173 146 150 (x) (x) 166 (x)1993 158 173 149 152 (x) (x) 166 1161994 167 175 159 167 (x) (x) 181 1161995 185 175 182 197 (x) (x) 180 1641996 191 197 185 189 (x) (x) 191 1651997 204 197 201 212 (x) (x) 195 1681998 253 275 231 252 (x) (x) 246 1691999 273 275 264 318 235 275 263 2122000 287 304 293 271 295 273 286 2942001 267 307 269 (x) 239 254 294 3082002 232 254 235 (x) 210 229 (x) (x)2003 211 248 201 (x) 190 203 (x) (x)2004 202 248 202 (x) 172 185 (x) (x)
Start '92-'97 177 182 170 178 (x) (x) 180 146Peak '99-'00 280 290 278 295 265 274 275 253End '02-'04 215 250 213 (x) 190 206 (x) (x)
Change (Amount)to Peak 104 108 108 117 (x) (x) 95 107to End -66 -40 -66 (x) -75 -68 (x) (x)
Change (%)to Peak 59% 59% 63% 66% (x) (x) 53% 73%to End -23% -14% -24% (x) -28% -25% (x) (x)
Source: Passel (2005), Pew Hispanic Center. (x) -- not available.
Note: See text for details of estimation methods.
* The 6 states with the largest immigrant populations: CA, NY, TX, FL, IL, and NJ.** "New Growth States" are states other than the 6 largest immigration states where the foreign-born population grew faster during 1990-2000 than in the fastest growing
large state (TX). The 22 New Growth States are: Southeast -- DE, NC, SC, GA, KY, TN, AL, MS, AR, OK; Mid-West -- IN, MN, IA, NE, KS; and Mountain/West -- ID, CO, AZ, UT, NV, WA, OR.
— 46 —

Average Annual Immigration for Calendar Years, 1990-2004, for the Six Largest Immigration States by Estimation Methodbased on CPS, ACS, and Census 2000 Data
(In thousands)2000-Based 1990-Based 2000-Based '90-Based
CPS (arrival)
ACS (arrival)
Cen. 2000
(arrival)
CPS (yr ago)
ACS (yr ago)
CPS (arrival)
CPS (yr ago)
CPS (arrival)
ACS (arrival)
Cen. 2000
(arrival)
CPS (yr ago)
ACS (yr ago)
CPS (arrival)
CPS (yr ago)
California New York
1990 425 399 432 446 (x) (x) 437 (x) 168 167 168 167 (x) (x) 155 (x)1991 333 399 291 310 (x) (x) 437 (x) 141 167 121 133 (x) (x) 155 (x)1992 290 274 294 301 (x) (x) 283 (x) 144 141 140 151 (x) (x) 145 (x)1993 262 274 249 264 (x) (x) 283 242 140 141 135 145 (x) (x) 145 1031994 271 281 253 278 (x) (x) 251 242 158 190 133 153 (x) (x) 145 1031995 290 281 275 314 (x) (x) 241 218 163 190 138 161 (x) (x) 145 831996 276 296 271 262 (x) (x) 240 196 136 127 137 143 (x) (x) 124 1171997 282 296 267 282 (x) (x) 242 169 132 127 131 138 (x) (x) 122 1071998 321 337 309 318 (x) (x) 268 222 136 134 126 147 (x) (x) 116 641999 330 337 333 379 325 276 290 302 137 134 137 173 125 119 118 1092000 332 334 348 432 265 281 301 241 128 148 131 149 98 112 114 932001 305 339 308 (x) 305 266 304 226 112 153 120 (x) 76 100 111 882002 230 262 259 (x) 176 224 (x) (x) 87 108 110 (x) 45 85 (x) (x)2003 221 263 223 (x) 176 222 (x) (x) 90 98 117 (x) 62 81 (x) (x)2004 265 265 283 (x) 270 242 (x) (x) 94 95 108 (x) 86 88 (x) (x)
Start '92-'97 279 284 268 283 (x) (x) 257 214 145 152 135 149 (x) (x) 138 103Peak '99-'00 331 336 340 406 295 278 296 271 133 141 134 161 111 115 116 101End '02-'04 239 263 255 (x) 207 229 (x) (x) 90 101 112 (x) 64 85 (x) (x)
Change (Amount)
to Peak 52 52 72 122 (x) (x) 39 58 -13 -11 -2 13 (x) (x) -22 -1to End -92 -72 -85 (x) -88 -49 (x) (x) -42 -41 -22 (x) -47 -31 (x) (x)
Change (%)
to Peak 19% 18% 27% 43% (x) (x) 15% 27% -9% -7% -1% 9% (x) (x) -16% -1%to End -28% -22% -25% (x) -30% -18% (x) (x) -32% -29% -17% (x) -42% -27% (x) (x)
CalendarYear
Average(2000-Based)
Average(2000-Based)
Detailed Table 2d2.
— 47 —
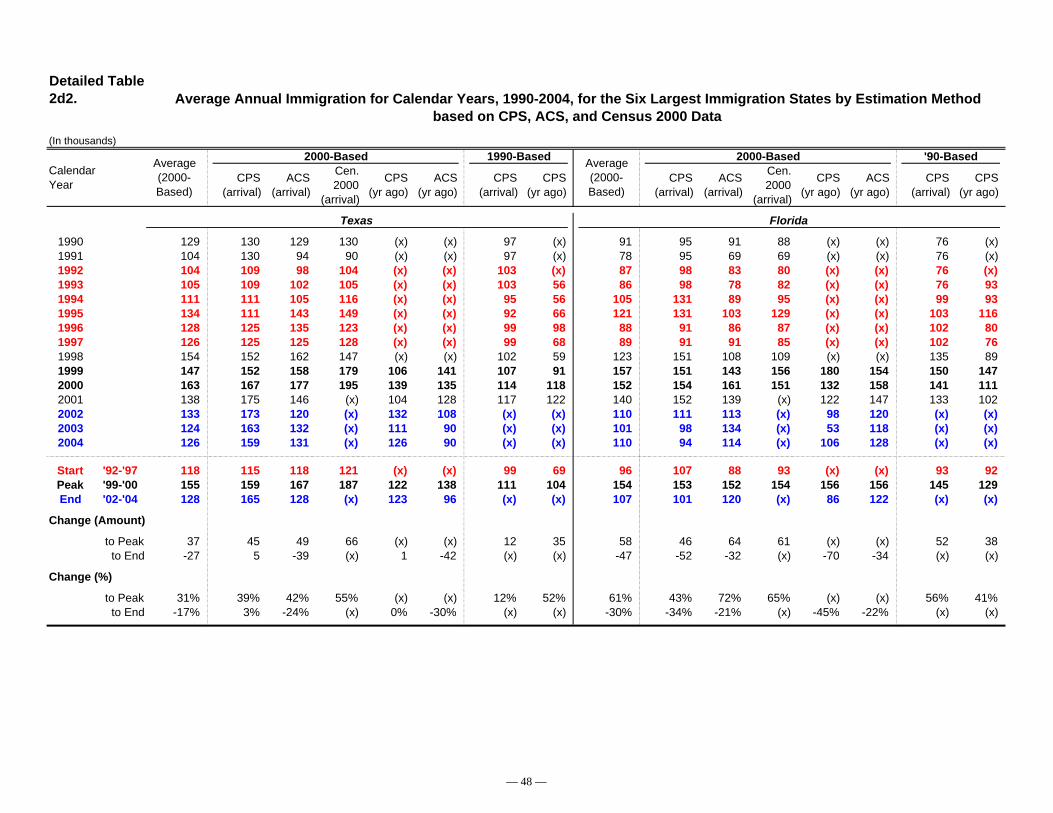
Average Annual Immigration for Calendar Years, 1990-2004, for the Six Largest Immigration States by Estimation Methodbased on CPS, ACS, and Census 2000 Data
(In thousands)2000-Based 1990-Based 2000-Based '90-Based
CPS (arrival)
ACS (arrival)
Cen. 2000
(arrival)
CPS (yr ago)
ACS (yr ago)
CPS (arrival)
CPS (yr ago)
CPS (arrival)
ACS (arrival)
Cen. 2000
(arrival)
CPS (yr ago)
ACS (yr ago)
CPS (arrival)
CPS (yr ago)
CalendarYear
Average(2000-Based)
Average(2000-Based)
Detailed Table 2d2.
Texas Florida
1990 129 130 129 130 (x) (x) 97 (x) 91 95 91 88 (x) (x) 76 (x)1991 104 130 94 90 (x) (x) 97 (x) 78 95 69 69 (x) (x) 76 (x)1992 104 109 98 104 (x) (x) 103 (x) 87 98 83 80 (x) (x) 76 (x)1993 105 109 102 105 (x) (x) 103 56 86 98 78 82 (x) (x) 76 931994 111 111 105 116 (x) (x) 95 56 105 131 89 95 (x) (x) 99 931995 134 111 143 149 (x) (x) 92 66 121 131 103 129 (x) (x) 103 1161996 128 125 135 123 (x) (x) 99 98 88 91 86 87 (x) (x) 102 801997 126 125 125 128 (x) (x) 99 68 89 91 91 85 (x) (x) 102 761998 154 152 162 147 (x) (x) 102 59 123 151 108 109 (x) (x) 135 891999 147 152 158 179 106 141 107 91 157 151 143 156 180 154 150 1472000 163 167 177 195 139 135 114 118 152 154 161 151 132 158 141 1112001 138 175 146 (x) 104 128 117 122 140 152 139 (x) 122 147 133 1022002 133 173 120 (x) 132 108 (x) (x) 110 111 113 (x) 98 120 (x) (x)2003 124 163 132 (x) 111 90 (x) (x) 101 98 134 (x) 53 118 (x) (x)2004 126 159 131 (x) 126 90 (x) (x) 110 94 114 (x) 106 128 (x) (x)
Start '92-'97 118 115 118 121 (x) (x) 99 69 96 107 88 93 (x) (x) 93 92Peak '99-'00 155 159 167 187 122 138 111 104 154 153 152 154 156 156 145 129End '02-'04 128 165 128 (x) 123 96 (x) (x) 107 101 120 (x) 86 122 (x) (x)
Change (Amount)
to Peak 37 45 49 66 (x) (x) 12 35 58 46 64 61 (x) (x) 52 38to End -27 5 -39 (x) 1 -42 (x) (x) -47 -52 -32 (x) -70 -34 (x) (x)
Change (%)
to Peak 31% 39% 42% 55% (x) (x) 12% 52% 61% 43% 72% 65% (x) (x) 56% 41%to End -17% 3% -24% (x) 0% -30% (x) (x) -30% -34% -21% (x) -45% -22% (x) (x)
— 48 —

Average Annual Immigration for Calendar Years, 1990-2004, for the Six Largest Immigration States by Estimation Methodbased on CPS, ACS, and Census 2000 Data
(In thousands)2000-Based 1990-Based 2000-Based '90-Based
CPS (arrival)
ACS (arrival)
Cen. 2000
(arrival)
CPS (yr ago)
ACS (yr ago)
CPS (arrival)
CPS (yr ago)
CPS (arrival)
ACS (arrival)
Cen. 2000
(arrival)
CPS (yr ago)
ACS (yr ago)
CPS (arrival)
CPS (yr ago)
CalendarYear
Average(2000-Based)
Average(2000-Based)
Detailed Table 2d2.
Illinois New Jersey
1990 61 52 66 67 (x) (x) 55 (x) 60 55 62 64 (x) (x) 48 (x)1991 50 52 49 50 (x) (x) 55 (x) 51 55 48 50 (x) (x) 48 (x)1992 50 42 50 59 (x) (x) 38 (x) 53 48 60 52 (x) (x) 54 (x)1993 51 42 52 58 (x) (x) 38 17 48 48 50 48 (x) (x) 54 511994 62 61 65 61 (x) (x) 48 17 54 60 46 55 (x) (x) 51 511995 66 61 66 72 (x) (x) 50 37 58 60 55 60 (x) (x) 50 601996 59 56 61 60 (x) (x) 44 40 54 56 50 55 (x) (x) 47 281997 59 56 57 64 (x) (x) 42 24 53 56 47 56 (x) (x) 47 311998 78 77 78 78 (x) (x) 52 51 64 63 61 68 (x) (x) 46 361999 68 77 83 90 28 62 57 30 61 63 72 81 40 51 46 382000 72 64 87 86 53 72 62 42 63 69 83 69 36 58 49 292001 61 62 67 (x) 43 72 64 46 61 71 66 (x) 43 65 51 272002 55 59 50 (x) 55 54 (x) (x) 51 52 67 (x) 28 58 (x) (x)2003 51 52 62 (x) 41 49 (x) (x) 42 48 46 (x) 32 44 (x) (x)2004 53 49 44 (x) 67 53 (x) (x) 46 47 47 (x) 52 36 (x) (x)
Start '92-'97 58 53 59 62 (x) (x) 43 27 53 55 51 54 (x) (x) 51 44Peak '99-'00 70 71 85 88 40 67 59 36 62 66 78 75 38 54 48 33End '02-'04 53 54 52 (x) 54 52 (x) (x) 46 49 53 (x) 37 46 (x) (x)
Change (Amount)
to Peak 12 18 26 26 (x) (x) 16 9 9 11 27 21 (x) (x) -3 -11to End -17 -17 -32 (x) 14 -15 (x) (x) -16 -17 -25 (x) -1 -8 (x) (x)
Change (%)
to Peak 21% 34% 45% 41% (x) (x) 36% 33% 16% 20% 52% 38% (x) (x) -6% -24%to End -24% -24% -38% (x) 34% -22% (x) (x) -26% -26% -32% (x) -2% -15% (x) (x)
Source: Passel (2005), Pew Hispanic Center. (x) -- not available.
Note: See text for details of estimation methods.
— 49 —

Average Annual Immigration for Calendar Years, 1990-2004, by Region of Residence for Smaller Immigration States and by Estimation Method based on CPS, ACS, and Census 2000 Data
(In thousands)2000-Based 1990-Based 2000-Based '90-Based
CPS (arrival)
ACS (arrival)
Cen. 2000
(arrival)
CPS (yr ago)
ACS (yr ago)
CPS (arrival)
CPS (yr ago)
CPS (arrival)
ACS (arrival)
Cen. 2000
(arrival)
CPS (yr ago)
ACS (yr ago)
CPS (arrival)
CPS (yr ago)
New Growth States -- Southeast * New Growth States -- Midwest *
1990 59 41 66 68 (x) (x) 45 (x) 29 33 25 29 (x) (x) 23 (x)1991 48 41 49 54 (x) (x) 45 (x) 25 33 20 22 (x) (x) 23 (x)1992 63 63 62 64 (x) (x) 52 (x) 28 29 26 29 (x) (x) 30 (x)1993 64 63 62 66 (x) (x) 52 99 26 29 23 27 (x) (x) 30 391994 72 64 73 79 (x) (x) 58 99 32 30 32 35 (x) (x) 31 391995 87 64 94 103 (x) (x) 57 43 35 30 32 42 (x) (x) 31 261996 92 91 91 95 (x) (x) 71 41 38 41 36 38 (x) (x) 37 401997 101 91 107 104 (x) (x) 74 44 41 41 37 44 (x) (x) 37 351998 135 136 127 140 (x) (x) 105 95 52 52 48 56 (x) (x) 45 471999 145 136 142 185 128 132 116 111 58 52 60 72 48 59 44 452000 136 132 157 172 94 126 125 84 56 58 66 57 34 64 48 292001 111 132 129 (x) 68 116 128 79 50 58 54 (x) 26 62 50 252002 113 143 128 (x) 75 107 (x) (x) 39 43 41 (x) 29 44 (x) (x)2003 120 154 127 (x) 77 121 (x) (x) 42 41 48 (x) 37 42 (x) (x)2004 159 157 169 (x) 171 140 (x) (x) 47 40 47 (x) 49 52 (x) (x)
Start '92-'97 80 72 82 85 (x) (x) 61 65 33 33 31 36 (x) (x) 33 36Peak '99-'00 140 134 149 178 111 129 120 98 57 55 63 65 41 61 46 37End '02-'04 131 152 142 (x) 107 123 (x) (x) 43 41 45 (x) 38 46 (x) (x)
Change (Amount)
to Peak 61 62 68 93 (x) (x) 60 33 24 22 32 29 (x) (x) 13 1to End -9 17 -8 (x) -3 -6 (x) (x) -14 -13 -18 (x) -2 -15 (x) (x)
Change (%)
to Peak 76% 85% 83% 109% (x) (x) 99% 50% 71% 65% 103% 80% (x) (x) 41% 3%to End -7% 13% -5% (x) -3% -5% (x) (x) -25% -24% -28% (x) -6% -25% (x) (x)
CalendarYear
Average(2000-Based)
Average(2000-Based)
Detailed Table 2d3.
— 50 —

Average Annual Immigration for Calendar Years, 1990-2004, by Region of Residence for Smaller Immigration States and by Estimation Method based on CPS, ACS, and Census 2000 Data
(In thousands)2000-Based 1990-Based 2000-Based '90-Based
CPS (arrival)
ACS (arrival)
Cen. 2000
(arrival)
CPS (yr ago)
ACS (yr ago)
CPS (arrival)
CPS (yr ago)
CPS (arrival)
ACS (arrival)
Cen. 2000
(arrival)
CPS (yr ago)
ACS (yr ago)
CPS (arrival)
CPS (yr ago)
CalendarYear
Average(2000-Based)
Average(2000-Based)
Detailed Table 2d3.
New Growth States -- Mountain/West * Other States -- Northeast & South
1990 105 93 112 109 (x) (x) 89 (x) 90 80 89 100 (x) (x) 65 (x)1991 86 93 78 86 (x) (x) 89 (x) 80 80 79 80 (x) (x) 65 (x)1992 92 101 88 87 (x) (x) 83 (x) 88 103 78 83 (x) (x) 88 (x)1993 91 101 82 90 (x) (x) 83 50 90 103 85 83 (x) (x) 88 571994 97 104 86 101 (x) (x) 99 50 90 94 85 92 (x) (x) 98 571995 117 104 118 129 (x) (x) 102 120 98 94 95 106 (x) (x) 96 961996 109 112 109 107 (x) (x) 111 117 102 107 99 101 (x) (x) 102 1051997 112 112 110 114 (x) (x) 109 95 110 107 109 114 (x) (x) 105 871998 147 162 137 142 (x) (x) 128 90 140 155 127 137 (x) (x) 133 1131999 152 162 146 183 127 143 139 114 151 155 144 177 148 134 140 1352000 164 164 163 184 162 148 148 168 159 174 157 148 174 141 152 1602001 141 164 133 (x) 127 140 152 178 153 178 145 (x) 151 137 156 1652002 117 119 120 (x) 110 118 (x) (x) 132 146 122 (x) 139 122 (x) (x)2003 100 108 106 (x) 75 113 (x) (x) 111 138 103 (x) 100 103 (x) (x)2004 119 106 132 (x) 118 120 (x) (x) 99 137 102 (x) 70 89 (x) (x)
Start '92-'97 103 106 99 105 (x) (x) 98 87 97 102 92 96 (x) (x) 96 81Peak '99-'00 158 163 154 183 145 145 144 141 155 165 150 162 161 137 146 147End '02-'04 112 111 119 (x) 101 117 (x) (x) 114 140 109 (x) 103 105 (x) (x)
Change (Amount)
to Peak 55 57 56 79 (x) (x) 46 54 58 63 58 66 (x) (x) 50 67to End -46 -52 -35 (x) -44 -28 (x) (x) -41 -24 -41 (x) -58 -33 (x) (x)
Change (%)
to Peak 53% 54% 56% 75% (x) (x) 47% 63% 60% 62% 63% 68% (x) (x) 52% 83%to End -29% -32% -23% (x) -30% -19% (x) (x) -26% -15% -28% (x) -36% -24% (x) (x)
— 51 —

Average Annual Immigration for Calendar Years, 1990-2004, by Region of Residence for Smaller Immigration States and by Estimation Method based on CPS, ACS, and Census 2000 Data
(In thousands)2000-Based 1990-Based 2000-Based '90-Based
CPS (arrival)
ACS (arrival)
Cen. 2000
(arrival)
CPS (yr ago)
ACS (yr ago)
CPS (arrival)
CPS (yr ago)
CPS (arrival)
ACS (arrival)
Cen. 2000
(arrival)
CPS (yr ago)
ACS (yr ago)
CPS (arrival)
CPS (yr ago)
CalendarYear
Average(2000-Based)
Average(2000-Based)
Detailed Table 2d3.
Other States -- Midwest & West
1990 68 66 67 72 (x) (x) 81 (x)1991 63 66 60 63 (x) (x) 81 (x)1992 68 69 67 67 (x) (x) 78 (x)1993 67 69 64 69 (x) (x) 78 591994 77 81 74 74 (x) (x) 84 591995 86 81 86 91 (x) (x) 83 681996 88 90 86 89 (x) (x) 89 601997 93 90 92 98 (x) (x) 90 811998 113 120 104 115 (x) (x) 113 551999 122 120 120 141 87 141 123 772000 129 130 136 123 121 132 134 1332001 115 129 125 (x) 88 117 138 1442002 100 108 112 (x) 71 107 (x) (x)2003 100 110 99 (x) 90 100 (x) (x)2004 102 111 100 (x) 102 96 (x) (x)
Start '92-'97 80 80 78 81 (x) (x) 84 65Peak '99-'00 125 125 128 132 104 137 129 105End '02-'04 100 110 104 (x) 87 101 (x) (x)
Change (Amount)
to Peak 45 45 50 51 (x) (x) 45 40to End -25 -16 -24 (x) -17 -36 (x) (x)
Change (%)
to Peak 57% 56% 64% 62% (x) (x) 54% 61%to End -20% -12% -19% (x) -16% -26% (x) (x)
Source: Passel (2005), Pew Hispanic Center. (x) -- not available.
Note: See text for details of estimation methods.
* "New Growth States" are states other than the 6 largest immigration states where the foreign-born population grew faster during 1990-2000 than in the fastest growing large state (TX). The 22 New Growth States are: Southeast -- DE, NC, SC, GA, KY, TN, AL, MS, AR, OK; Mid-West -- IN, MN, IA, NE, KS; and Mountain/West -- ID, CO, AZ, UT, NV, WA, OR.
— 52 —

Detailed Table 3.
Annual Legal Admissions and Foreign-Born Population, from March Current Population Survey and American Community Survey, by Year: 1991-2005
(In thousands)"Green cards" -- Change in Foreign-Born Population Foreign-Born Population
"CPS" Year Non-IRCA LPRs Total Post-'90 Entrants Total Post-'90 Entrants(Ending New Adjust- March CPS March CPS March CPS March CPSMarch 1) Total Arrivals ments '90-wts. '00-wts. ACS '90-wts. '00-wts. ACS '90-wts. '00-wts. ACS '90-wts. '00-wts. ACS
1991 676 439 237 -- -- -- -- -- -- -- -- -- -- -- --1992 748 472 277 -- -- -- -- -- -- -- -- -- -- -- --1993 840 522 318 -- -- -- -- -- -- -- -- -- -- -- --1994* 846 517 329 -- -- -- -- -- -- 23,389 -- -- 4,744 -- --1995* 764 445 320 1,084 -- -- 1,122 -- -- 24,473 -- -- 5,865 -- --
1996 797 397 400 84 -- -- 714 -- -- 24,557 -- -- 6,579 -- --1997 863 404 459 1,221 -- -- 959 -- -- 25,779 -- -- 7,539 -- --1998 737 371 366 503 -- -- 1,089 -- -- 26,281 -- -- 8,628 -- --1999 651 376 275 167 -- -- 662 -- -- 26,448 -- -- 9,290 -- --2000 731 404 327 1,932 -- -- 1,916 -- -- 28,379 30,089 30,273 # 11,206 12,126 13,149 #
2001 939 409 530 1,548 1,725 1,275 2,065 2,420 1,172 29,927 31,814 31,548 13,271 14,546 14,3222002 1,064 400 664 -- 646 1,548 -- 1,235 1,381 -- 32,460 33,096 -- 15,781 15,7032003 915 374 541 -- 1,010 572 -- 990 970 -- 33,471 33,668 -- 16,771 16,6732004 806 360 446 -- 773 590 -- 1,249 839 -- 34,244 34,258 -- 18,020 17,512
2005** 946 362 584 -- 912 -- -- 1,469 -- -- 35,156 -- -- 19,488 --
Source: Tabulations and estimates from Pew Hispanic Center, Passel (2005).Notes: "Green" card data are from Yearbook of Immigration Statistics , Table 4. The data exclude persons granted permanent residency under
the Immigration Reform and Control Act of 1986 (IRCA). Data shown are estimates for March-February years obtained by averaging fiscal year data. **For 2005, estimates assume admissions for October 2004-February 2005 at same level as fiscal 2004.
See text for explanation of CPS and ACS data. * Figures shown for 1994 and 1995 CPS use corrected weights from Passel (1996).CPS populations refer to the civilian noninstitutional population; ACS figures to the household population.
# Census 2000 values (in thousands) for total foreign-born population and post-1990 entrants are: 31,146 and 13,212, respectively.
— 53 —

Detailed Table 4.
Immigration to the United States by Decade: 1820-2010
(In thousands)
Period*Legal
AdmissionsAdmissionsless IRCA
"Other"Immigrants
TotalImmigration
Census Population
PercentImmigration
1820-2010 69,869 72,842 20,200 93,042 (na) (na)1820 8
1821-1830 143 143 -- 143 9,638 1.5%1831-1840 599 599 -- 599 12,866 4.7%1841-1850 1,713 1,713 -- 1,713 17,069 10.0%
1851-1860 2,598 2,598 -- 2,598 23,192 11.2%1861-1870 2,315 2,315 -- 2,315 31,443 7.4%1871-1880 2,812 2,812 -- 2,812 38,558 7.3%1881-1890 5,247 5,247 -- 5,247 50,189 10.5%1891-1900 3,688 3,688 -- 3,688 62,980 5.9%
1901-1910 8,795 8,795 200 8,995 76,212 11.8%1911-1920 5,736 5,736 300 6,036 92,228 6.5%1921-1930 4,107 4,107 -- 4,107 106,022 3.9%1931-1940 528 528 -- 528 123,203 0.4%1941-1950 1,035 1,035 -- 1,035 132,165 0.8%
1951-1960 2,515 2,515 -- 2,515 151,326 1.7%1961-1970 3,322 3,322 500 3,822 179,323 2.1%1971-1980 4,493 4,493 2,500 6,993 203,302 3.4%1981-1990 7,338 5,979 4,000 9,979 226,542 4.4%1991-2000 9,095 7,766 6,200 13,966 248,710 5.6%
2001-2010 3,780 9,450 6,500 15,950 281,422 5.7%
Source: Yearbook of Immigration Statistics: 2004, Table 1; author's estimates (Passel 2005); and Historical Statistics of the United States.
Notes: * Fiscal years"Legal Admissions" are shown through 2004, as follows:
1820-67 alien passengers arrived at seaports;1868-92 immigrant aliens arrived;1892-94 immigrant aliens admitted for permanent residence;1895-97 immigrant aliens arrived;
1898-2003 immigrant aliens admitted for permanent residence;1892-1903 aliens entering by cabin class not counted as immigrants;
-1908 land arrivals not completely enumerated."Admissions less IRCA" make two changes to "Legal Admissions":
(1) Persons acquiring legal status through the Immigration Reform and Control Actof 1986 (IRCA) are not included: 1,359,000 in 1981-1990 and 1,330,000 in 1991
(2) Admissions for 2001-2010 are assumed to continue for the rest of the decadeat the average for 2001-2004.
"Other Immigrants" include unauthorized migrants and refugees not counted elsewherePersons acquiring legal status under IRCA are included here at the time of theirarrival. Author's estimates and approximations.
Census counts are for the beginning of each decade. Percentages compareimmigration during the decade to the population at the beginning.
(na) -- not applicable.
— 54 —

Detailed Table 5a.
Mexico-U.S. Migration and Labor Force and Unemployment for the United States and Mexico: 1990-2004
(Populations in thousands)
Year Laborforce*
Unemployedpersons
Totalemployment
Percentunemployed
Change in labor force
Change in employment
Percent change in labor force
Percent change in employment
Mexico-U.S.
MigrationMexico U.S. Mexico U.S. Mexico U.S. Mex. U.S. Mex. U.S. Mex. U.S. Mex. U.S. Mex. U.S. (Table 1b)
1990 24,063 129,045 (x) 7,047 (x) 121,998 (x) 5.5% (x) (x) (x) (x) (x) (x) (x) (x) (na)1991 (x) 129,491 (x) 8,628 (x) 120,863 (x) 6.7% (x) 446 (x) -1,135 (x) 0.3% (x) -0.9% 3371992 (x) 131,085 (x) 9,613 (x) 121,472 (x) 7.3% (x) 1,594 (x) 609 (x) 1.2% (x) 0.5% 3291993 32,381 131,999 (x) 8,940 (x) 123,059 (x) 6.8% (x) 914 (x) 1,587 (x) 0.7% (x) 1.3% 3321994 (x) 133,704 (x) 7,996 (x) 125,708 (x) 6.0% (x) 1,705 (x) 2,649 (x) 1.3% (x) 2.2% 372
1995 35,559 134,848 1,980 7,404 33,578 127,444 5.6% 5.5% (x) 1,144 (x) 1,736 (x) 0.9% (x) 1.4% 4431996 36,581 136,390 1,575 7,236 35,006 129,154 4.3% 5.3% 1,022 1,542 1,428 1,710 2.9% 1.1% 4.3% 1.3% 3881997 38,345 138,673 1,302 6,739 37,043 131,934 3.4% 4.9% 1,764 2,283 2,037 2,780 4.8% 1.7% 5.8% 2.2% 3901998 39,562 139,995 1,161 6,210 38,401 133,785 2.9% 4.4% 1,218 1,322 1,358 1,851 3.2% 1.0% 3.7% 1.4% 5071999 39,648 141,659 825 5,880 38,823 135,779 2.1% 4.2% 86 1,664 422 1,994 0.2% 1.2% 1.1% 1.5% 496
2000 40,162 144,867 861 5,692 39,301 139,175 2.1% 3.9% 513 3,208 477 3,396 1.3% 2.3% 1.2% 2.5% 5302001 40,073 146,023 855 6,801 39,218 139,222 2.1% 4.7% -89 1,156 -82 47 -0.2% 0.8% -0.2% 0.0% 4372002 41,086 147,185 969 8,378 40,117 138,807 2.4% 5.8% 1,013 1,162 899 -415 2.5% 0.8% 2.3% -0.3% 3782003 41,516 148,858 1,047 8,774 40,469 140,084 2.5% 6.0% 430 1,673 352 1,277 1.0% 1.1% 0.9% 0.9% 3692004 (x) (x) (x) 8,149 (x) (x) 3.2% 5.5% (x) 1,395 (x) 1,516 (x) 0.9% (x) 1.1% 459
Correlation with Mexican migration:Current year --
(x) (x) (x) (x) (x) (x) -0.23 -0.90 -0.30 0.48 -0.24 0.48 -0.30 0.43 -0.26 0.45 (x)Migration lagged one year --
(x) (x) (x) (x) (x) (x) -0.28 -0.66 0.18 0.51 0.28 0.67 0.19 0.49 0.27 0.66 (x)
* Economically-active population(x) -- not available. (na) -- not applicable.
Source: OECD Economic Statistics through 2003; Bureau of Labor Statistics for U.S. 2004; CIA for Mexico 2004.
— 55 —

Detailed Table 5b.
Mexico-U.S. Migration and Gross Domestic Product for the United States and Mexico: 1990-2004
(In billions of U.S. dollars)
Year GDP(In Current PPP)
GDP(in 2000 US$)
Percent change in GDP
(Current PPP)
Percent change in GDP
(2000 US$)
Mexico-U.S.
MigrationMexico U.S. Mex. U.S. Mex. U.S. Mex. U.S. (Table 1b)
1990 515 5,803 638 7,113 (x) (x) (x) (x) (na)1991 556 5,996 665 7,101 7.9% 3.3% 4.2% -0.2% 3371992 589 6,338 689 7,337 6.0% 5.7% 3.6% 3.3% 3291993 614 6,657 702 7,533 4.3% 5.0% 2.0% 2.7% 3321994 655 7,072 733 7,836 6.6% 6.2% 4.4% 4.0% 372
1995 627 7,398 688 8,032 -4.3% 4.6% -6.2% 2.5% 4431996 672 7,817 724 8,329 7.2% 5.7% 5.2% 3.7% 3881997 730 8,304 773 8,704 8.6% 6.2% 6.8% 4.5% 3901998 775 8,747 812 9,067 6.2% 5.3% 5.0% 4.2% 5071999 816 9,268 842 9,470 5.3% 6.0% 3.8% 4.4% 496
2000 898 9,817 898 9,817 10.1% 5.9% 6.6% 3.7% 5302001 919 10,128 897 9,891 2.4% 3.2% 0.0% 0.8% 4372002 951 10,470 904 10,049 3.5% 3.4% 0.8% 1.6% 3782003 983 10,971 917 10,321 3.3% 4.8% 1.4% 2.7% 3692004 1,006 11,734 (x) 10,756 2.4% 7.0% 4.4% 4.2% 459
Correlation with Mexican migration:Current year --
(x) (x) (x) (x) -0.02 0.28 0.09 0.40 (x)Migration lagged one year --
(x) (x) (x) (x) 0.21 0.58 0.35 0.73 (x)
(x) -- not available. (na) -- not applicable.
Source: OECD Economic Statistics through 2003; Bureau of Labor Statistics for U.S. 2004; World Bank for Mexico 2004.
— 56 —