Embed Size (px)
Citation preview
T R E N D S I N H E A LT H B E N E F I T S
2019 National Health Benefits Statistics & Trends Report
110962 02/19 53978439-117788648

The health care landscape is in a constant state of flux. Even as we publish this report, major decisions have to be made at the federal, state and industry levels that will change how people get care and stay healthy. It’s difficult to predict how all these factors will affect health benefits that employers provide to their workers.
2019 began with the lowest unemployment rate that America has seen in fifteen years, and that labor shortage presents a real problem to employers who need to find and retain talent. Employers who make the decision to offer benefits to their employees do it not just out of obligation — they do it because they care about the people they work with. Benefits decision-makers like you struggle to provide the best benefits to their teams with limited budgets. That’s why we hope you’ll find this report helpful as you make choices about the health benefits you offer to your employees. Below is a summary of some of our key findings:
Economic snapshot
Health benefits remain the second biggest
employee cost (after wages) for large
employers, with employees paying
18% of premiums for individual coverage
on average (page 8).
PPOs are still the most common health plan type, but
high-deductible plans are on the rise (page 18).
U.S. health spending will grow at a
rate of 5.5% each year, with prescription
drug costs making up almost 10% of that total (page 10).
Health benefits cost over $12k per
employee in 2017 on average (page 8).
PPO
Introduction

Benefit strategies
Emerging trends
Health care is the third largest expense for retirees, so planning is
crucial to help reduce expense and promote financial wellness (page 46).
Association Health Plans are a new concept created by the Department
of Labor in 2018. It allows smaller companies to band together to buy
insurance as part of an association thereby reaping the benefits of what larger companies can get on the market (page 42).
Integrating health care and
ancillary benefits (like dental,
vision and life insurance) from
the same carrier is a rising
trend, with 13% more
companies integrating benefits
over the past two years (page 22).
In an era of low unemployment,
health insurance is key to
employee retention, 85% of
millennials say that health care
is “absolutely essential” or
“very important” (page 33).
Well-being programs are still
popular, with 83% of large
employers planning to continue
or expand wellness offerings
over the next few years
(page 27) with financial
wellness programs in particular
gaining steam.
High performance and narrow networks are ramping up, with more
than 60% of employers expected to offer in 2018. (page 44).

Benefit cost as percent of total compensation: 2017 . . . 6
Health insurance coverage by funding source: 2013, 2016, 2017 . . . . . . . . . . . . . . 7
Average plan costs per employee . . . . . . . . . . . . . . 8
National view of drug spending . . . . . . . . . . . . . . 10
Managing drug costs . . . . . . . . . . . . . . . . . . . . 14
Specialty pharmacy in review: 2018 . . . . . . . . . . . . 16
Employee enrollment by plan type: 2018 . . . . . . . . . 18
Percentage of employers offering health benefits by company size: 2009-2018 . . . . . . . . . . . 19
ECONOMIC SNAPSHOT — 4
What’s inside

BENEFIT STRATEGIES — 20
The value of integrated health care . . . . . . . . . . . . 22
Are health and wellness incentives driving healthy behavior? . . . . . . . . . . . . . . . . . . 26
Companies increasingly offer “financial wellness” benefits . . . . . . . . . . . . . . . . 28
Amid low unemployment rates, health insurance could be the key to employee recruitment and retention. . . . . . . . . . 32
Ancillary (dental, vision, life and disability) coverage . . 35
Voluntary benefits . . . . . . . . . . . . . . . . . . . . . . 38
EMERGING TRENDS — 40
Questions to ask when considering an association health plan . . . . . . . . . . . . . . . . . 42
High-performance, tiered and narrow networks offer savings; show signs of rebounding popularity. . . . . . . . . . . . . . . 44
Planning for retiree health care expenses . . . . . . . . 46
The evolution of concierge service . . . . . . . . . . . . 48
Selling health insurance across state lines: what it means for employers . . . . . . . . . 49
The future of telehealth . . . . . . . . . . . . . . . . . . . 50
Future of workforce benefits . . . . . . . . . . . . . . . . 52

44

E C O N O M I C S N A P SH OT
5

Insurance continues to be the largest expense next to wages and salaries for large employers, while small employers see it as the third largest.
There was no significant change between 2016 and 2017, with the average cost of insurance at 7.9%.
An average of 7.9% of compensation being related to insurance means that for an employee who is paid $30 per hour, $2.37 would go toward insurance alone. INSIGHTS
Benefit cost as percent of total compensation: 2017
60%
91%
99%
92%
98% 97%
93%
99%
57%
66%
7.3%
7.9%
8.6%
5.0%
4.1%
2.5%
9.1%
7.6%
6.4%
3.4%
4.2%
3.5%
7.9%
6.4%
5.7%
67.2%
69.7%
73.4%
80%
Wages and salaries
Legally required benefits1
Retirement and savings
Insurance2
Supplemental pay3
Paid leave4
Note: Insurance includes: life, health, short-term disability and long-term disability.
Source: Bureau of Labor Statistics website: Employer Costs of Employee Compensation (accessed October 2018): bls.gov.
100+ employees
50-99 employees
1-49 employees
1 Legally required benefits include Social Security, Medicare, unemployment and other legally required benefits.2 Insurance includes life insurance, health insurance and short- and long-term disability insurance.3 Supplemental pay includes overtime, bonuses and other supplemental pay.4 Paid leave includes vacation, holiday, sick and personal time.
Economic snapshot Benefit strategies Emerging trends
6

Employer-sponsored health insurance continues to be the number one source of benefits for the insured.
The uninsured population decreased between 2013 and 2016, but held steady in 2017.
The effect of the repeal of the individual mandate starting in 2019 is still unknown.
Health insurance coverage by funding source: 2013, 2016, 2017
INSIGHTS
Employment based
Direct-purchase
Medicare
Medicaid
Military health care
Uninsured
Note: The totals in the chart exceed 100% because people can have multiple sources for coverage.
Source: U.S. Census Bureau website: Current Population Survey, 2014, 2017, and 2018 Annual Social and Economic Supplements (accessed October 2018): www2.census.gov. 20 40 60 80 100 120
2017
2016
2013
7

Economic snapshot Benefit strategies Emerging trends
Growth has actually slowed in the past few years in part due to a shift to consumer-driven health plans (CDHPs). One potential reason is that CDHPs encourage members to be more actively engaged in decisions about their health care spending, which can create better health outcomes and potentially reduce health care costs.
Most employees contribute to a portion of their costs. According to the Kaiser Family Foundation Employer Health Benefits 2018 survey, employees contribute roughly 18% of their premium for single coverage and 29% for family coverage.
ANALYSIS
2017
2016
Source: National Survey of Employer-Sponsored Health Plans Executive Summary (Mercer) 2017 (accessed October 2018).
500+ employees
10-499 employees
All employers
$10,000 $11,000 $12,000 $13,000
$12,288
$11,527
$11,271
$12,229
$11,920
$12,615
Average total health benefits per employee
8
Economic snapshot Benefit strategies Emerging trends

9

Economic snapshot Benefit strategies Emerging trends
U.S. health expenditures Growth in national health expenditures, Gross Domestic Product, and health share of GDP, 1990-2026
Health share of Gross Domestic Product
Projected national health expenditures 2017-26 annual growth: 5.5%
Nominal Gross Domestic Product growth 2017-26 average annual growth : 4.5%
Source: Centers for Medicare and Medicade Services. Office of the Actuary, National Helath Statistics Group. Shaded boxes indicate 1990-91, 2001, and 2007-09 recessionary periods as identified by the National Bureau of Economic Research.
2016 17.9%
2026 19.7%
20%
0%
1990 1994 1998 2002 2006 2010 2014 2018 2022 2026
National view of drug spending
1 Centers for Medicaid and Medicare websit: National Health Expenditure Projections, 2017-2026 Forecast Summary Major Findings for National Health Expenditures: 2017-2026 (2018): accessed August 2018): cms.gov/research-statistics-data-and-systems/statistics-trends-and-reports/nationalhealthexpendda0ta/nationalhealthaccountsprojected.html. 2 NHE Projections 2017-2026 - Forecast Summary Page 1.
U.S. health spending is projected to grow at an average annual rate of 5.5%, reaching $5.7 trillion by 2026. Health spending is projected to grow 1% faster than the GDP per year between 2017-2026.1
There are multiple factors affecting this growth, including the increase in prices for goods and services as well as baby boomers and even Generation Xers shifting from private health insurance to Medicare.2
INSIGHTS
10

PPOs continue to be the most popular plan type, enrolling 48% (combined) of covered employees.
Large employees are more likely to offer multiple plan types.
Prescription drug spending is an important component of health expenditures.
}} In 2016, 9.9% of national health expenditures were attributed to prescription drugs.3
}} By 2026, total prescription drug spending is forecasted to reach $604.8 billion.
}} Consumer out-of-pocket prescription spending is projected to reach over $73 billion, approximately 12% of total prescription drug spending.3 INSIGHTSINSIGHTS
Prescription drug expenditures 2010-2026
Total Rx spending
Total health insurance spending
Medicare
Other health insurance programs
Out-of-pocket payments
Private health insurance
Medicaid
Other third party payers
Source: Centers for Medicare & Medicaid Services, Office of the Actuary.
$200
$300
$400
$500
$600
2010 2012 2014 2016 2018 2020 2022 2024 2026
3 American Academy of Actuaries, Prescription Drug Spending in the U.S. Health Care System: An Actuarial Perspective (March 2018), actuary.org (accessed 8/24/2018). 11

12
Economic snapshot Benefit strategies Emerging trends

2017 Prescription drug net spending growth
4 IQVIA Institute for Human Data Science, Medicine Use and Spending in the U.S.: A Review of 2017 and Outlook to 2022 (April 2018): iqvia.com 13
New brand-name drugs
Patent protected brand name drug price
Patent protected brand name drug volume
Generic drug volume
Generic drug price
Loss of exclusivity
Source: IQVIA Institute for Human DataScience, Medicine Use and Spending in theU.S.: A Review of 2017 and Outlook to 2022:(April 2018): iqvia.com.
$15
$10
$5
$0
- $5
- $10
- $15
12
5.2
1.5
- 0.5
- 5
- 12.5
Dollars in billions
At almost 10% of the national health expenditures, what exactly goes into that number?
2017 offers a good example of the impact of drug spending components. Net drug spending grew by $0.7 billion in 2017, down from $12.1 billion in 2016.4 The largest driver of 2017 net prescription drug spending was new brand-name drugs, which had been on the market for 24 months or less.4 New brand-name drugs tend to be expensive, especially if few therapeutically equivalent drugs are available. Specialty drugs drove 80% of the new brand-name drug net growth.4 Alternatively, generic drugs
experienced a net spending decrease of $5.5 billion due to more competition in the generic drug market.4 The largest contributor to reductions in net spending was brand-name drugs losing patent protection, also called loss of exclusivity. When a drug’s patent expires, generic versions can be marketed, increasing competition and normally decreasing cost.
If these projections hold true, employers will continue to experience rising health care and pharmacy costs.
See “Managing drug costs” for ways employers are trying to control these costs.
4 IQVIA Institute for Human Data Science, Medicine Use and Spending in the U.S.: A Review of 2017 and Outlook to 2022 (April 2018): iqvia.com. 13

Economic snapshot Benefit strategies Emerging trends
Managing drug costs
Number of tiers for drugs covered by plan
One tier
Two tiers
Three tiers
Four tiers
Five tiers
Six or more
Source: Pharmacy Benefit Management Institute website: 2017 Trends in Drug Benefit Design Report (accessed October 2018): pbmi.com.
Economic snapshot Benefit strategies Emerging trends
2012 2013 2014 2015 2016 2017
1%1% 2% 1% 2% 3%
3% 2% 4% 3% 2% 4%
3%4% 3% 3%
22%22%
29% 29%31%
31%
63%64% 55% 58%
54% 49%
9%6%
7% 5% 5% 5%
5% 7%
(n=424) (n=478) (n=353) (n=302) (n=337) (n=318)
1 2017 Trends in Drug Benefit Design, Pharmacy Benefit Management Institute, 2017. 1 2017 Trends in Drug Benefit Design, Pharmacy Benefit Management Institute, 2017.
Employers are using multiple “tools” to manage their organization’s drug usage and spend. One of these tools includes shifting to a drug list with four or more tiers.
}}The goal is to encourage employee use of clinically effective, lower-cost drugs on lower tiers.
}}In 2017, 41% of employer pharmacy plans included four or more drug list tiers. This is a 58% increase in the use of four or more drug list tiers since 2012.1
}}38% of employers surveyed said they were considering increasing the number of drug list tiers in the future.1
14

Use of trend management tools
Not used or under consideration
Under consideration for use in the future
Currently used
Source: Pharmacy Benefit Management Institute website: 2017 Trends in Drug Benefit Design Report (accessed October 2018): pbmi.com.
Methods such as prior authorization, limiting drug refills until most of the current quantity is used and quantity limits are the most popular methods of managing utilization, with over 90% of employers using them.2
}} Prior authorization, which requires members and their doctors to obtain pharmacy benefit provider approval before prescriptions can be filled, helps ensure clinically appropriate medication use.
}} Refill too soon requirements help prevent drug stockpiling and overuse.
}} Quantity limits regulate the medication amount covered by the pharmacy for specific length of time, following U.S. Food and Drug Administration (FDA) guidelines and manufacturer recommendations.
Managing specialty drug costs remained a top priority for employers in 2017.3 51% of employers surveyed used coinsurance for specialty drugs as a cost-sharing mechanism with employees. More than half of employers were excluding certain drugs from coverage. Drugs frequently excluded from drug lists included those to treat growth deficiency conditions and infertility.3
Prior authorization
Refill too soon/supply limits
Quarterly limits
Step therapy
Formulary exclusions
Compound drug limits or exclusions
Exclusion of classes with OTC versions
Mandatory generic program
Predictive modeling/member
segmentation
92%
92%
91%
82%
75%
75%
68%
58%
22% 44%
4% 4%
5% 3%
4% 5%
13% 5%
15% 10%
12% 14%
19% 13%
24% 18%
34%
2 2017 Trends in Drug Benefit Design, Pharmacy Benefit Management Institute, 2017.3 2017 Trends in Specialty Drug Benefits, Pharmacy Benefit Management Institute, 2017. 15

Economic snapshot Benefit strategies Emerging trends
Specialty pharmacy in review: 2018
1 U.S. Food and Drug Administration, First Remarks to FDA Staff, News and Events (accessed November 2018), fda.gov/NewsEvents/Speeches/ucm558566.2 FDA Approves Fremanezumab (Ajovy) for Migraine Prevention, MedScape, September 17, 2018.3 National Institutes of Health U.S. Library of Medicine website: Migraine (accessed October 2018): medlineplus.gov/migraine.html.4 U.S. Food and Drug Administration website: FDA approves first drug comprised of an active ingredient derived from marijuana to treat rare, severe forms of epilepsy (accessed October 2018): fda.gov/newsevents/newsroom/pressannouncements/ucm611046.htm.5 Pharmacy Times website: Ibalizumab-uiyk for HIV: What Pharmacists Should Know (accessed October 2018): pharmacytimes.com. 6 U.S. Food and Drug Administration website: FDA approves a new treatment for PKU, a rare and serious genetic disease (accessed October 2018): fda.gov/newsevents/ newsroom/pressannouncements/ucm608835.htm.
Economic snapshot Benefit strategies Emerging trends
Managing specialty drugs is a challenge all health plans and pharmacy benefit managers face. And the challenges are quickly growing.
As recently as 2017, the FDA significantly increased the annual number of both traditional and specialty drugs approved. According to Food and Drug Commissioner Scott Gottlieb, MD., “Congress gave us a clear mandate to be forward-leaning when it comes to how we’ll evaluate safety and efficacy in view of emerging scientific insight and better analytical tools. We need to make sure we’re taking steps to foster innovation and regulating areas of promising new technology in ways that don’t raise the cost of development or reduce innovation.”1
In 2016, 26 new drugs were approved by the FDA; 18 were specialty drugs. In 2017, 55 drugs were approved and 73% were considered specialty drugs.
The trend of rapid and robust specialty drug development continued in 2018. Of the 55 new drugs developed, 32 were specialty and biosimilar drugs, including the introduction of drugs with novel treatment mechanisms.
Drugs of note approved during 2018 include:
}} Aimovig, Ajovy, Emgality – These new injectable medications work to actually prevent migraines, rather than treating them once they’ve developed. They are the first FDA-approved drugs in the new anti-CGRP drug class that works by blocking a molecule involved in migraine attacks. It’s estimated that 40% of those who suffer with migraines may be helped by these drugs.2 In the U.S., approximately 12% of the population report experiencing migraine headaches.3
}} Epidiolex – This is the first cannabis-based drug to be approved by the FDA. It’s used for treatment of seizures associated with two rare and severe forms of epilepsy.4
}} Trogarzo – This drug is the first HIV therapy with a new mechanism of action to be approved in 10 years. As the first monoclonal antibody for the treatment of HIV, Trogarzo is used to treat patients who have developed multidrug-resistant disease.5
}} Palynziq – This is a novel enzyme therapy for adults diagnosed with phenylketonuria (PKU), a rare and serious genetic disease. Those with PKU are unable to break down phenylalanine (Phe), an amino acid contained in foods with proteins and high-intensity sweeteners. An overload of Phe can lead to intellectual, neurodevelopmental and psychiatric disabilities.6 About one in every 10,000 to 15,000 Americans has PKU.
16

They’re used to manage complicated and often chronic disease states such as cancer and HIV/AIDS, or inflammatory conditions such as rheumatoid arthritis and Crohn’s disease.
They can be expensive because they are sometimes biologics — drug products made from living organisms.
They may require frequent dosing adjustments and intensive clinical monitoring.
They may require special handling, such as refrigeration or manipulation in a controlled environment (for example, oncology drugs).
Their usage may require intensive patient support, including care management or mandated patient education on usage.
They are often used to treat long-term or life-long conditions such as hemophilia or multiple sclerosis.
What are specialty drugs? While there is no standard industry definition, specialty drugs commonly share these attributes:
While these drugs offer new and life-changing impacts to patients, they also come with extremely high price tags. Employers should work with their pharmacy account representatives to learn more about possible management strategies.
17

Economic snapshot Benefit strategies Emerging trends
Economic snapshot Benefit strategies Emerging trends
Employee enrollment by plan type: 2018
Employee enrollment by plan type: 2018
Conventional = indemnity insurance
HMO = health maintenance organization
PPO = preferred provider organization
POS = point of service plans
HDHP/SO = high-deductible health plans with savings options
Source: 2018 Employer Health Benefits Survey, The Henry J. Kaiser Family Foundation, [October 3, 2018].
2018 2018 Small employer (3-199) Large employer (200+)
29% 29%
11%
3%
43%
51%
16% 16%
75%
Preferred provider organizations (PPOs) continue to be the most common plan type in 2018, enrolling 48% of covered employees. However, high-deductible plans have been on the rise because they are
typically less expensive for employers and encourage members to be more actively engaged in decisions about their health care spending.
18

Percentage of employers offering health benefits by company size: 2009-2018
2008 2009 2010 2011 2012 2013 2014 2015 2016 2017 2018
All employers
Small employers (3–49)
Mid-size employers (59–99)
Large employers (100+)
Source: 2018 Employer Health Benefits Survey, The Henry J. Kaiser Family Foundation, [October 3, 2018].
100%
63% 69% 61% 55% 56%59% 60% 57% 57% 57%53%
In a time of low unemployment, it makes sense that we see an increase in small employers offering health benefits because providing competitive
benefits could be a differentiator when attracting qualified talent.
19

20

B E N E F I T STRATEGIES
2121

Employer-provided health care benefits have typically been delivered in “silos” — with medical, pharmacy, dental, vision, life, disability and health and wellness benefits offered through different carriers with little or no interaction among them. As a result, employees and their health care providers have had a fragmented, incomplete picture of their health.
Integrated health care (IHC) takes health data and transforms it into real insights that give members and their health care providers a complete picture of the member’s health. It also may help identify potential gaps in care.
IHC programs have been shown to increase member engagement and deliver better health outcomes, lower cost of care and a better health experience for members.
How integrated care works
By eliminating the silos these components traditionally have operated within, data is aggregated to provide a more complete picture of a member’s health, identify gaps in care earlier and facilitate sharing of this information between providers, care managers and members to enable coordinated care. Also, sharing health data among various lines of coverage can help detect chronic diseases early. These may include diabetes, cardiovascular disease, chronic obstructive pulmonary (lung) disease, asthma, cancer and arthritis.
Here are examples of IHC in action:
}} Complex chronic conditions like cancer, multiple sclerosis and inflammatory conditions are better managed with medical and pharmacy benefits, and when all employee health benefits are closely aligned.
}} Certain medical conditions, like diabetes and pregnancy, are better managed with good oral care.1 IHC allows care managers to identify these conditions and provide at-risk employees with useful oral care information. Some insurance carriers provide extra dental cleanings and send employees condition-specific notifications when a gap in care is identified through claims analysis.
}} Eye doctors can detect early signs of some conditions and diseases by looking at the retina and blood vessels in the eye.2 With IHC, an employee’s electronic health profile can be shared with an eye doctor so they can provide more informed care. A routine eye exam claim can trigger a proactive care management program referral, helping employees get the care they need.
}} Typically, 5% - 10% of employees (those with a disability claim) represent 50% of employee medical costs.3 With IHC, care managers and disability case managers can work together more effectively to help employees develop “stay-at work” or “return-to-work” goals.
The value of integrated health care
1 American Optometric Association website: Evidence-based Clinical Practice Guideline: Comprehensive Adult Eye and Vision Examination (accessed October 2018): aoa.org.2 American Optometric Association: Evidence-based Clinical Practice Guideline: Comprehensive Adult Eye and Vision Examination (2015): aoa.org.3 Council for Disability Awareness: Chances of a Disability (July 3, 2013): disabilitycanhappen.org.22
Economic snapshot Benefit strategies Emerging trends

69% Vision benefit
65% Pharmacy benefit
67% Dental benefit
51% Disability benefit
PRODUCT INTEGRATION AMONG EMPLOYERS WITH 100+ EMPLOYEES ACTIVELY INTEGRATING PRODUCTS4
2016 2018
71%60%
33%46%
27%
25%
35%24%6% 5%
THE BIG PICTURE: 71% OF EMPLOYERS ARE INTEGRATING THEIR BENEFIT PROGRAMS OR CONSIDERING DOING SO4
Integrating
Considering
Potential consideration
Rejected
234 Anthem internal data. Integrated Health Care Report (2018), Edition 3.

Integration can be a multi-pronged approach. For employers who are reticent or resource constrained, integration can take place in phases over their various lines of coverage. Although the complete picture of health if ideal for real insight, a staggered approach can sometimes be an easier transition.
Regardless of company size, employers can save on health care costs, improve health outcomes for their employees, increase employee engagement and satisfaction and simplify administration of benefit plans using a single-carrier IHC model. Defining metrics for success and regularly evaluating these programs is important, because it helps employers ensure they’re meeting the health care needs of their employees.
actively integrating or considering integration
75%National
68%Large group
60%Small group
NATIONAL AND LARGE GROUP EMPOYERS ARE STILL THE MOST ACTIVE IN LEADING THE WAY TO INTEGRATION
55% of employers measure
success by member engagement
27% measure success by
financial return
19% integrate simply because “it’s the right thing to do”
HOW DO EMPLOYERS MEASURE THE SUCCESS OF THEIR IHC PROGRAMS5
24
Economic snapshot Benefit strategies Emerging trends
5 Anthem internal data. 2018 Integrated Health Care Employer Survey.

6 Centers for Disease Control and Prevention, Chronic Disease Overview, 2017 cdc.gov/chronicdisease/about/index.htm. 7 Centers for Disease Control and Prevention: Promoting Health in the Fall, 11 Tips to Stay Healthy (accessed November 2018): cdc.gov. 8 Benjamin EJ, Blaha MJ, Chiuve SE, et al. Heart disease and stroke statistics—2017 update: a report from the American Heart Association. Circulation 2017;135:e1–e458.9 National Cancer Institute website: Cancer Prevalence and Cost of Care Projections (Accessed June 2018) costprojections.cancer.gov.10 American Diabetes Association website: The Cost of Diabetes. (Accessed June 29, 2018): diabetes.org.
Why is IHC so important?
CANCER9
}} 1.7 million in the U.S. diagnosed with cancer each year
}} Cost of cancer care is expected to reach $174 billion by 2020
HEART DISEASE AND STROKE8
}} More than 810,000 Americans die each year
}} Cost health system $190 billion per year and $126 billion in lost productivity on the job
DIABETES10
}} More than 29 million Americans have diabetes and another 86 million adults are prediabetic
}} Costs the U.S. health care system and employers $245 billion every year
25

Are health and wellness incentives driving healthy behavior?Developing a wellness program can help improve the health and productivity of employees, and in turn help improve the cost of employer-sponsored health plans. Many employers have used incentives to drive participation, which may be particularly helpful for employees in high-deductible health plans. But how can you ensure that incentives are effective at driving key health behaviors? Are there some incentives that are more effective than others? Or is the success of the program based on how they are implemented versus what is implemented?
Traditional wellness incentives typically apply to biometric screening, weight management and smoking cessation programs. Many employers are expanding their programs to include things like discounts for fitness trackers, reimbursement for gym memberships and disease management programs. Incentives are typically added to increase participation and keep employees healthy, which can help lower health care costs. These programs show no signs of slowing down.
What are the key components to building an effective incentive strategy?
As wellness programs continue to be a part of the benefits offerings for many companies, it’s important to look at the overall strategy. Early programs often provided a one-time financial incentive for desired results. Although they can be effective in the short term, these programs typically don’t encourage ongoing healthy lifestyle changes. More recently, wellness programs have expanded to include rewards for successful condition management, which works to manage certain conditions, like asthma or diabetes that require consistent monitoring and support.
However, there’s still a disconnect between offering incentives and determining whether they have an impact on employee health. Many employers fail to measure their impact, either from a financial or value perspective. Only 26% of employers tie well-being to at least one key business metric.
26
Economic snapshot Benefit strategies Emerging trends

How do I determine the value I’m getting from my incentive program?
The key is determining your goals and that will help you determine your measurements. Are you interested solely in the quantifiable results, or are qualitative factors important as well? Two ways to measure are return on investment (ROI) and value on investment (VOI). Depending upon your goals, they may return different results. ROI is a simpler calculation based on the amount spent on the program divided by benefit cost savings. If you have employees who have conditions that need constant support like diabetes or asthma, condition management programs might provide a high ROI for your business. If you factor in employee absences or lost productivity due to conditions not being properly managed, those dollars can add up.
VOI on the other hand can be harder to quantify, but it’s very important. Value includes the perceived satisfaction, retention and motivation the employee experiences. This understandably can be quite challenging to measure.
Understanding your goals will help to determine your measurements. How do you get started?
If you don’t have access to the actual data, you can send out an anonymous survey to your employees to see which health management goals most interest them. Then use that information to help determine which components should be part of your incentive strategy. Do you have a relatively healthy workforce that wants to focus on moving more? Or do your employees want to lose weight or need help managing conditions or diseases? Once you have a clear idea of the types of incentives you want to offer, then determine the best approach for measuring them.
Knowing what your employees want will help your program, and ultimately them, be more successful.
1 Making Well-Being Work: Ninth Annual Employer-Sponsored Health and Well-Being Survey (NBGH) June 2018 (accessed October 2018).
OF LARGE EMPLOYERS LARGE EMPLOYERS OFFER FINANCIAL INCENTIVES
TO THEIR EMPLOYEES.1
86%
OF LARGE EMPLOYERS PLAN TO CONTINUE OR EXPAND WELL-BEING INCENTIVES OVER
THE NEXT THREE TO FIVE YEARS.1
83%
27

As the competition for top talent continues to heat up, thanks to low unemployment and increased demand for high tech solutions, many companies are expanding their traditional benefits to deliver more options that are of interest to employees.
Virtually all employees have financial obligations and aspirations. This can be anything from paying off student loan debt for recent grads, to the increased financial obligations of buying a home and having children, to saving enough for a comfortable retirement.
About three quarters of employers consider it advantageous to have a workforce that is financially secure. Financial wellness programs, such as life and disability insurance, retirement planning services and even student loan repayment options, are perceived to meet multiple objectives, such as improving productivity, “doing the right thing for employees,” optimizing benefit spends, and attracting and retaining top talent.1
With so many companies understanding that a financially secure workforce is important, it’s not surprising that the percentage of companies offering financial wellness programs has been rising. Prudential’s 10th survey of employee benefits, Benefits and Beyond: Employer Perspectives on Financial Wellness, finds the percentage of employers offering financial wellness programs rose to 83%, up from 20% two years earlier.
An additional 14% of employers say they plan to offer these programs in the next one or two years. The survey includes responses from nearly 800 decision-makers for group insurance benefits at U.S. businesses with at least 100 full-time employees.
.
The definition of “financial wellness” varies widely, from “not living paycheck to paycheck” to “feeling confident about my finances and financial future.” In some companies, financial wellness is considered a component of a multi-element well-being approach, alongside physical, emotional/mental, spiritual and social factors. In other companies, financial wellness sits squarely in the financial benefits realm with compensation, retirement, and life and disability coverage.
Financial wellness has many links to physical health and wellness. Financial stress can contribute to poor health.2
Companies increasingly offer “financial wellness” benefits
Source: Bank of America Merrill Lynch website: 2018 Workplace Benefits Report (accessed October 2018): benefitplans.baml.com.
Source: Prudential website: Benefits and Beyond: How Employers Think About Financial Wellness (accessed October 2018): prudential.com
OF EMPLOYEES ARE STRESSED ABOUT THEIR FINANCIAL SITUATION
56%
EMPLOYERS OFFERING FINANCIAL WELLNESS PROGRAMS
2015 2017 2019
20%83%
97% projected
100%
Projected growth for 201914%
1 Prudential website: Benefits and Beyond: How Employers Think About Financial Wellness (accessed October 2018): prudential.com.2 National Center for Biotechnology Information website: The psychosocial context of financial stress: Implications for inflammation and psychological health (accessed October 2018): ncbi.nlm.nih.gov.28
Economic snapshot Benefit strategies Emerging trends

Companies increasingly offer “financial wellness” benefits
MANAGING HEALTH CARE COSTS IS A CONCERN FOR MANY EMPLOYEES
Employees are aware of the responsibilities they have when it comes to managing and paying for their health care now and in the future — but they still need help. When asked about their health care concerns:
66% rate planning for out-of-pocket cost as the most challenging and stressful aspect of
managing their health care
23% don’t save beyond a year and the majority
under-fund their health care savings
50% don’t know how to predict current or future
out-of-pocket health care costs or determine the appropriate savings vehicle or rate
75% feel fear regarding their health
care finances
Source: Bank of America Merrill Lynch website: 2017 Workplace Benefits Report Supplement: A Closer Look at Healthcare (accessed October 2018): baml.com.
MOST COMMON FINANCIAL WELLNESS PROGRAMS*
How employers are offering financial
wellness benefits can take many forms.
Some focus on digital tools, while others
provide more hands-on options
Digital portal through which all tools and content can be accessed
Tools and calculators to help employees
gauge their financial wellness
Retiree planning (e.g., Social Security
optimization)
Access to financial advice and/or advisors
Source: Prudential website: Benefits and Beyond: How employers Think About Financial Wellness (accessed October 2018): prudential.com.
*Excludes core benefits such as retirement plans, health plans, and group insurance.
67% 66% 62% 60%18% 23% 20% 22%
Currently offered
Plan to offer
29

Here are a few simple ways to help employees with their financial wellness by looking to your existing benefits offerings:
Health savings accounts If you offer a health savings account in conjunction with a high-deductible health plan, or a flexible spending account, the companies who administer them likely have educational materials or may even offer personalized support. Make the most of what they have available and be sure to distribute to employees.
Employee assistance programs (EAP) Most, if not all, EAPs include resources to help with financial concerns such as locating a financial consultant. They may even include a few free sessions.
Disability insurance Remind employees about the financial security and peace of mind that comes with the income they’ll get if they can’t work due to a disability. If you offer your medical and disability plans through the same company, there may be integration that helps employees get set up for their disability benefits more easily.
If you’re considering implementing or expanding a more formal financial wellness program for your employees, think through the following questions:
}} Where does financial wellness fit in your overall benefit package, and how much value does it add?
}} What is the demographic mix of your employee population, and what financial pressures are most prominent – student loan repayment, day-to-day budgeting, saving for large expenses, and/or retirement planning? A simple anonymous survey asking people to rank priorities may provide insights beyond a basic demographic-based assumption.
}} How do your employees prefer to get information about their benefits? Is there high use of online and digital tools, or are they accustomed to receiving information through meetings and in-person contact?
}} How will you promote availability of the new and/or improved services? Do you have in-house resources and channels to leverage, or would you prefer to leverage tools from the vendor providing the services/tools?
As more and more employers recognize the links between financial wellness and the health and productivity of their workforce, expect to see the number and variety of programs available grow.
30
Economic snapshot Benefit strategies Emerging trends

31

Amid low unemployment rates, health insurance could be the key to employee recruitment and retention
In many ways, the 2018 economy has been marked by optimism and a low unemployment rate. The lowest, in fact, in 15 years, according to a 2018 study by Deft Research. This study also found that nearly half of employers report greater difficulty attracting talent than in past years.
The Deft study showed that small businesses are struggling with recruiting more than most, and are four times as likely to report more difficulty recruiting than less. Though they may have more hiring resources, large employers are facing their own challenges. Nearly half of large firms are experiencing 11% or greater turnover.
This means that it’s more important than ever to offer strong benefits, starting with employer-sponsored health insurance. Salary increases aren’t always enough — enhanced medical benefits like employer health insurance are critical tools for attracting and retaining talent.
Employees want health benefits
While attracting and retaining talent involves a variety of different factors, many employees put a high value on health benefits.
If forced to choose between more comprehensive employer health insurance and a 10% raise, just over half of survey participants said they’d take the insurance.
And employers have taken notice. Deft Research reports that 44% of companies having difficulty attracting talent have attempted to boost recruiting efforts by improving medical benefits.
Similarly, what once were perks — for example life insurance and dental coverage — are now seen as necessities. Offering supplemental insurance is a relatively popular choice.
Saving money with health care
The options mentioned above provide relatively affordable strategies for small businesses to win the battle for talent. Offering employees a supplemental plan to cover items like critical illness, vision, disability, long-term care or legal expenses can be a means of making coverage available without breaking the bank. At the same time, wellness programs don’t have to be expensive, and the good health habits they encourage can help prevent more expensive issues down the line.
Improving health care options for employees has other benefits, too. Healthy employees are more likely to be productive and take less time off. In fact, some experts have found that every dollar put toward employee wellness offers a six-to-one return on investment.
Businesses are changing the way they look at employee recruitment and retention. Benefits leaders are placing increased emphasis on understanding their organization’s employee population, and many have begun to engage employees directly to understand better the benefits they value. Growing human resources communications roles have evolved to help communicate benefits holistically and promote organizational investments in workers. Low unemployment rate or not, offering great health insurance to employees may be the key to standing out to potential talent — and to making your business a success.
85% of respondents said that health insurance is “absolutely essential” or “very important,” outranking other benefits
like employer retirement contributions.
IN A SURVEY BY THE BENENSON STRATEGY GROUP OF 1,002 EMPLOYED MILLENNIALS
(THOSE BORN BETWEEN 1981 AND 1997)
OF EMPLOYERS ARE ADOPTING OR EXPANDING THIS COVERAGE.
OF EMPLOYERS HAVE INTRODUCED NEW HEALTH AND WELLNESS PROGRAMS AS A WAY OF ATTRACTING EMPLOYEES.
30%
26%
32
Economic snapshot Benefit strategies Emerging trends
32

The numbers add up
If there was any doubt that in 2018 it’s more important than ever to offer the benefits people want, the numbers speak for themselves:
1 Bureau of Labor Statistics website: Labor Force Statistics from the Current Population Survey (accessed November 2018): bls.gov.2 Deft Research website: 2018 Group Benefit Decision Makers Study (accessed 2018): deftresearch.com.3 Benenson Strategy Group website: Millennials Sound off on Healthcare (accessed 2018): bsgco.com.4 ENI website: Workplace Wellness and ROI of 6:1 (accessed 2018): eniweb.com.
THE U.S. UNEMPLOYMENT RATE AS OF AUGUST 20181
THE PERCENTAGE OF MILLENNIALS WHO SAY THAT HEALTH INSURANCE IS AN “ABSOLUTELY ESSENTIAL” OR “VERY IMPORTANT” BENEFIT3
THE PERCENTAGE OF SMALL BUSINESSES REPORTING MORE DIFFICULTY ATTRACTING TALENT TODAY THAN IN THE PAST2
3.9%
85%THE PERCENTAGE OF COMPANIES THAT HAVE IMPROVED MEDICAL BENEFITS AS A STRATEGY FOR ATTRACTING TALENT2
44%
44%
THE RETURN ON INVESTMENT FOR SPENDING ON EMPLOYEE WELLNESS4
6 to 1
3333

Economic snapshot Benefit strategies Emerging trends
34
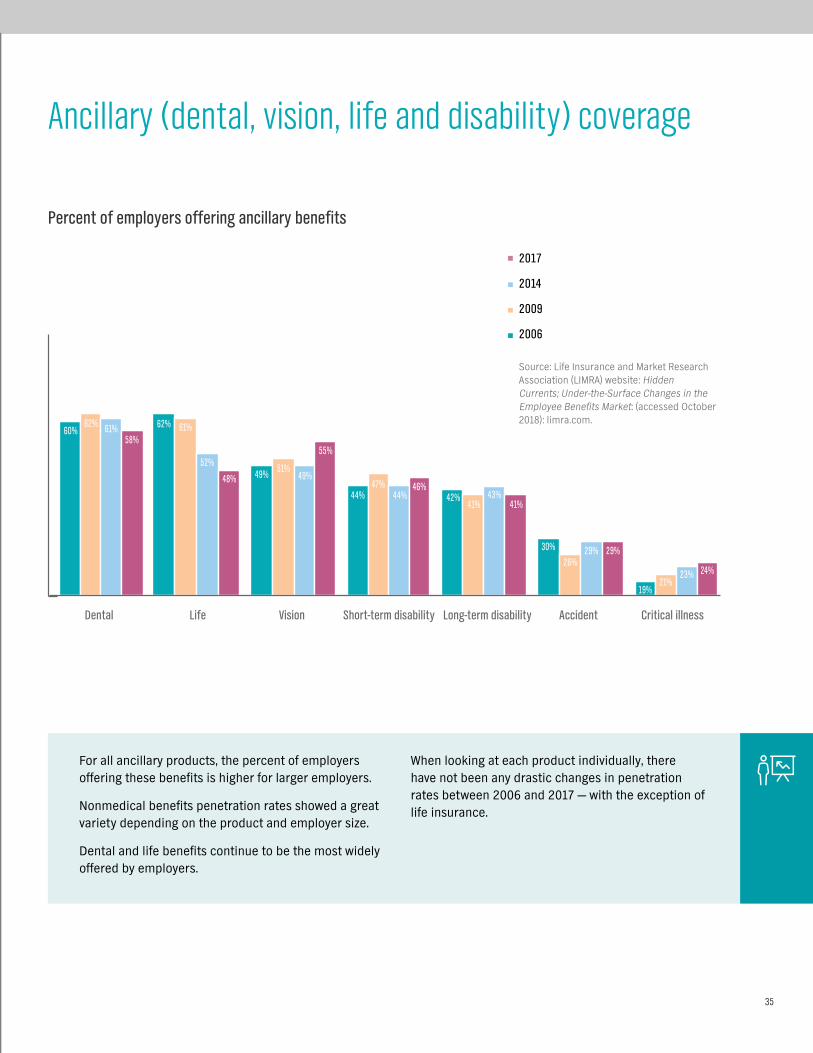
Percent of employers offering ancillary benefits
2017
2014
2009
2006
Source: Life Insurance and Market Research Association (LIMRA) website: Hidden Currents; Under-the-Surface Changes in the Employee Benefits Market: (accessed October 2018): limra.com.
42%41% 41%
30% 29% 29%
19%21%
23% 24%26%
43%
60%62%
49%
62% 61%
51%
61%
52%49%
44% 44%47% 46%
58%
48%
55%
Dental Life Vision Short-term disability Long-term disability Accident Critical illness
Ancillary (dental, vision, life and disability) coverage
For all ancillary products, the percent of employers offering these benefits is higher for larger employers.
Nonmedical benefits penetration rates showed a great variety depending on the product and employer size.
Dental and life benefits continue to be the most widely offered by employers.
When looking at each product individually, there have not been any drastic changes in penetration rates between 2006 and 2017 — with the exception of life insurance.
35
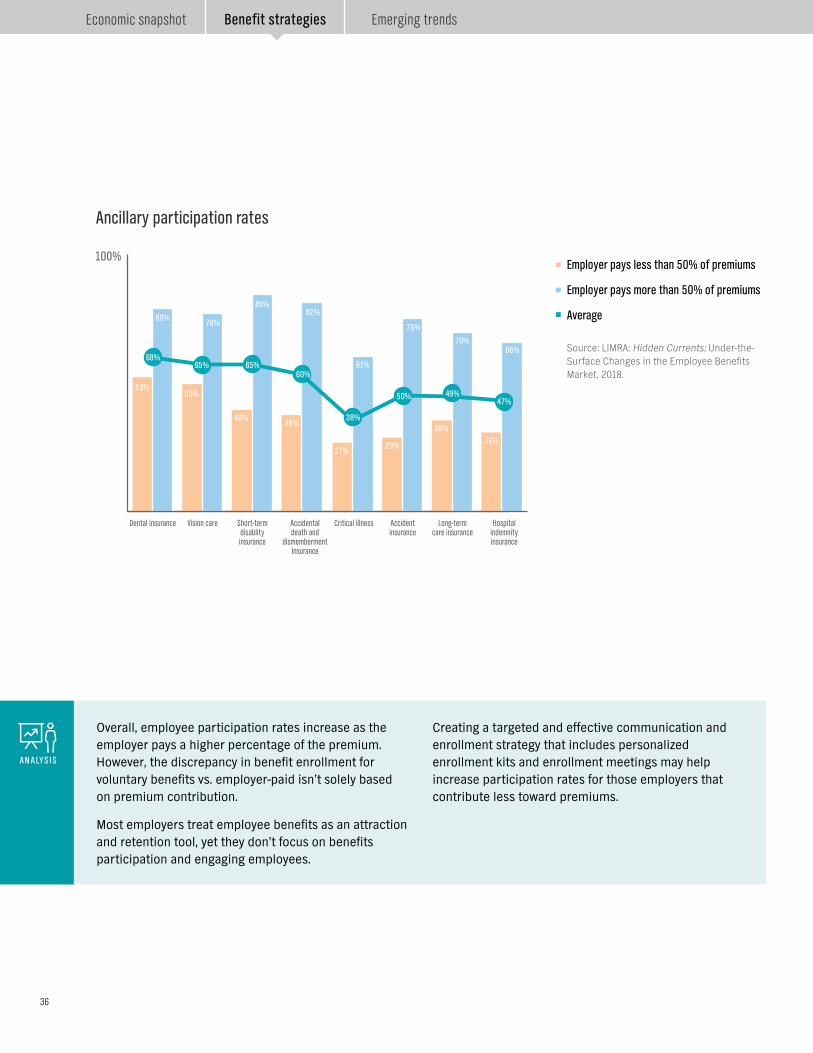
Ancillary participation rates
Overall, employee participation rates increase as the employer pays a higher percentage of the premium. However, the discrepancy in benefit enrollment for voluntary benefits vs. employer-paid isn’t solely based on premium contribution.
Most employers treat employee benefits as an attraction and retention tool, yet they don’t focus on benefits participation and engaging employees.
Creating a targeted and effective communication and enrollment strategy that includes personalized enrollment kits and enrollment meetings may help increase participation rates for those employers that contribute less toward premiums.
ANALYSIS
Employer pays less than 50% of premiums
Employer pays more than 50% of premiums
Average
Source: LIMRA: Hidden Currents; Under-the-Surface Changes in the Employee Benefits Market, 2018.
100%
Dental insurance Vision care Short-term disablity insurance
Accidental death and
dismemberment Insurance
Critical illness Accident insurance
Long-term care insurance
Hospital indemnity insurance
53%50%
40%38%
27%29%
36%31%
80%78%
85%82%
61%
76%
70%66%
68%65% 65%
60%
38%
50% 49%47%
36
Economic snapshot Benefit strategies Emerging trends

Employees’ perspective on ancillary products1
ANCILLARY BENEFITS MATTER TO EMPLOYEES AND PLAY AN IMPORTANT ROLE IN THEIR CHOICE OF EMPLOYERS — SUBSTANTIALLY MORE THAN WORK ‘PERKS.’
33%have turned down a company
because they weren’t impressed by the ancillary benefits being offered. This increases to 55%
among those on individual plans.
Which, if any, of the following work benefits and insurance benefits would you consider a “must have” to accept a job offer from a company?
Medical insurancePaid vacation days
Paid sick daysDental insurance
Prescription drug planVision insurance
Life insuranceShort-term disability insurance
Long-term disablity insuranceTuition reimbursementOn-site wellness visits
Free coffee/teaDiscounted gym membership
On-site child careCatered breakfast/lunch
Yoga classes
87%81%
77%73%
67%
62%45%
40%40%
18%17%
10%8%
7%7%
5%
79% AGREE “ANCILLARY BENEFITS ARE IMPORTANT TO MY OVERALL HEALTH AND WELL-BEING”
371 Anthem: Online Survey, Driving Job Satisfaction Through Specialty Benef ts, June 2018. i

Voluntary benefits
Employers continuously face the challenges that come with balancing rising health insurance costs with the goal of offering a competitive benefits program that helps attract and retain the best employees.
Voluntary products offer a solution by giving employees a complete benefits program, with no direct cost to the employer – and employees enjoy group rates vs. higher individual rates.
It’s also important to find an insurance carrier that will prepare and manage enrollments to help increase awareness, engagement and enrollment into these plans.
OF ALL EMPLOYERS OFFER AT LEAST ONE VOLUNTARY PRODUCT - THIS TRANSLATES INTO
87 MILLION EMPLOYEES BEING OFFERED AT LEAST ONE VOLUNTARY PRODUCT.
APPROXIMATELY
60%
Of the approximately 112 million employees in the U.S.,
60 million currently own at least one voluntary product.
That leaves approximately 27 million employees with
access to voluntary products today through their employers – yet they have not purchased coverage.
There are also 25 million employees
working for employers who have yet to offer
them any voluntary products.
Source: Eastbridge Consulting Group, Inc. website: Forecasting Voluntary Sales (accessed August 2018): eastbridge.com.
38
Economic snapshot Benefit strategies Emerging trends

39

4040

E M E R G I N GT R E N D S
4141

If you’re a small business owner or a self-employed working owner, there’s a new way to get health care coverage. The Department of Labor (DOL) recently issued a rule expanding the availability of association health plans1 (AHPs) for small businesses and certain self-employed individuals (for example, working owners). The new DOL rule also extends the benefits of large group treatment to qualifying AHPs. But what are AHPs, and what might their expansion mean for you and for your business? Let’s explore.
What Is an AHP?
AHPs are group health plans sponsored by an association. Under the new DOL rule, any employer, including small businesses and working owners, may join together in an association if the employers are in the same industry (regardless of location), or the employers are not in the same industry but are in a geographically limited area, such as a single state or certain metropolitan area (even if the metropolitan area crosses state lines). For example, one AHP might be available to employees in unrelated industries in a certain city, (for example, members of a Chamber of Commerce in the Los Angeles metro area), and a different AHP may be offered to employees nationwide whose employers are members of an association of similar businesses, such as florists. AHPs enable these small businesses and working owners to join an association and pool their employees to purchase health care coverage as a single group, allowing them to benefit from reduced administrative expenses, larger risk pools, potentially reduced premiums, and other benefits of treatment as a large employer group, as we’ll discuss.
How do AHPs differ from employer-sponsored plans?
Simply put, an AHP means that an association sponsors a single group health plan for a group of employers that are members of the association. The association acts very much like an employer does in setting up the available benefits under the group health plan, establishing eligibility requirements, and setting premiums and contributions. Unlike an employer, though, an association sponsoring an AHP must have a governance structure, with officers and directors, as well as governing documents, such as by-laws. Employer members of an association sponsoring an AHP also play an important part in controlling the association, so its members have a say in what benefits the AHP may cover.
Questions to ask when considering an association health plan
1 U.S. Department of Labor website: About Association Health Plans (accessed November 2018): dol.gov.42
Economic snapshot Benefit strategies Emerging trends
What are the pros and cons of AHPs?
AHPs must comply with most of the same requirements applicable to other health plans. AHPs can’t discriminate against individuals based on age or prior health conditions, and they may not impose annual or lifetime limits on coverage.
AHPs are able to offer small employers and self-employed individuals the advantages that large employers enjoy in their group health plans, because the size of the group is based on the total number of members of the association. The group health plans sponsored by large employers with 51 or more employees are exempt from certain ACA market reforms, such as the requirement to offer the 10 categories of essential health benefits and modified community rating rules. Exemption from these requirements can help to lower the cost of coverage under an AHP.
While AHPs cannot charge members higher premiums based on any individual’s health status, they may consider age, gender, industry, occupation and geography as factors in setting premium rates. So it’s possible that premiums for AHPs could potentially be more expensive for groups of employers in industries associated with higher health risks. Similarly, a company that obtains coverage through an AHP covering a disproportionate number of older employees or women might face higher premiums than it would if it purchased its own policy. In addition, as noted above, AHPs do not have to cover the 10 categories of essential health benefits required to be covered under the ACA, so an AHP may not cover all of the services you might expect to be covered.
This content is provided solely for informational purposes. It is not intended as and does not constitute legal advice. The information contained herein should not be relied upon or used as a substitute for consultation with legal, accounting, tax and/or other professional advisers.
Is an AHP right for my business?
When it comes to AHPs, it’s important to do your homework. For some businesses, AHPs may be a more affordable alternative to traditional health insurance plans. But when considering obtaining coverage under an AHP, be sure to consider both its advantages and disadvantages before making a
decision. Just as you would with any health care plan, read the fine print, do some comparison shopping, and talk to a trusted health care broker before making a final decision.
43

Employers interested in the cost savings associated with narrower health care provider networks are expected to ramp up offerings of lower cost plans with fewer provider options. The expectation is that more than 60% of employers may offer a narrow or high-performance network plan in 2018.1
Potential cost savings has led employers to consider offering narrower networks, and to design benefits that drive consumers to high-performing providers. When employees and their family members see high-quality, lower cost providers, those providers benefit, employers benefit and the consumer benefits. Potential cost savings paired with high-quality care has employers looking to begin offering these high-value network options in the near future.2
In 2017, the share of employers with 50 or more workers whose largest plan included a high-performance or tiered provider networks rose slightly in 2017 to around 12%. This is down from a peak of 27% in 2013 but close to the rate of 11% in 2016.3
High-performance or high-value provider networks include only providers who have a demonstrated history of delivering high-quality, efficient care. Tiered networks, which offer members financial incentives to visit high-quality, lower-cost providers, have been shown to lower cost of care by 5%.4
High-performance, tiered and narrow networks offer savings; show signs of rebounding popularity
1 National Business Group on Health. Topics: High-Performance Network/Centers of Excellence (accessed Aug. 1, 2018) businessgrouphealth.org.2 Society for Human Resource Management website: Employers May Adopt Narrow Networks of Health Care Providers (accessed November 2018): shrm.org.3 2017 Employer Health Benefits Survey, The Henry J. Kaiser Family Foundation, (September 29, 2017).4 The Commonwealth Fund website: Enrollment in a Health Plan with a Tiered Provider Network Decreased Medical Spending by 5 Percent. (accessed November 2018): commonwealthfund.org.5 Employer Benefit Research Institute website: Narrow Provider Networks for Employer Plans: Issue Brief (accessed November 2018): ebri.org.
Small firms (50-199 workers)
Large firms (200+ workers)
All firms with 50+ workers
Source: 2017 Employer Health Benefits Survey, The Henry J. Kaiser Family Foundation, (September 29, 2017).
2007
8%
16%
22%
11%
15%
12%
28%
8%
16%
22%
11%12%12%
16%
14%
27%
10%
17%
24%
14%15%
18%18%
24%
20142011 20162010 20152013 2017
THE SHARE OF EMPLOYEES WITH 50 OR MORE WORKERS WHOSE LARGEST PLAN INCLUDES A
HIGH-PERFORMANCE OR TIERED PROVIDER NETWORK
Consumers who pay for their own coverage or who are uninsured have found narrow or tiered networks more palatable than their counterparts with
employer-sponsored coverage, but that difference in receptiveness could be shifting due to exposure to the individual market created by the Affordable Care Act.5ANALYSIS
44
Economic snapshot Benefit strategies Emerging trends
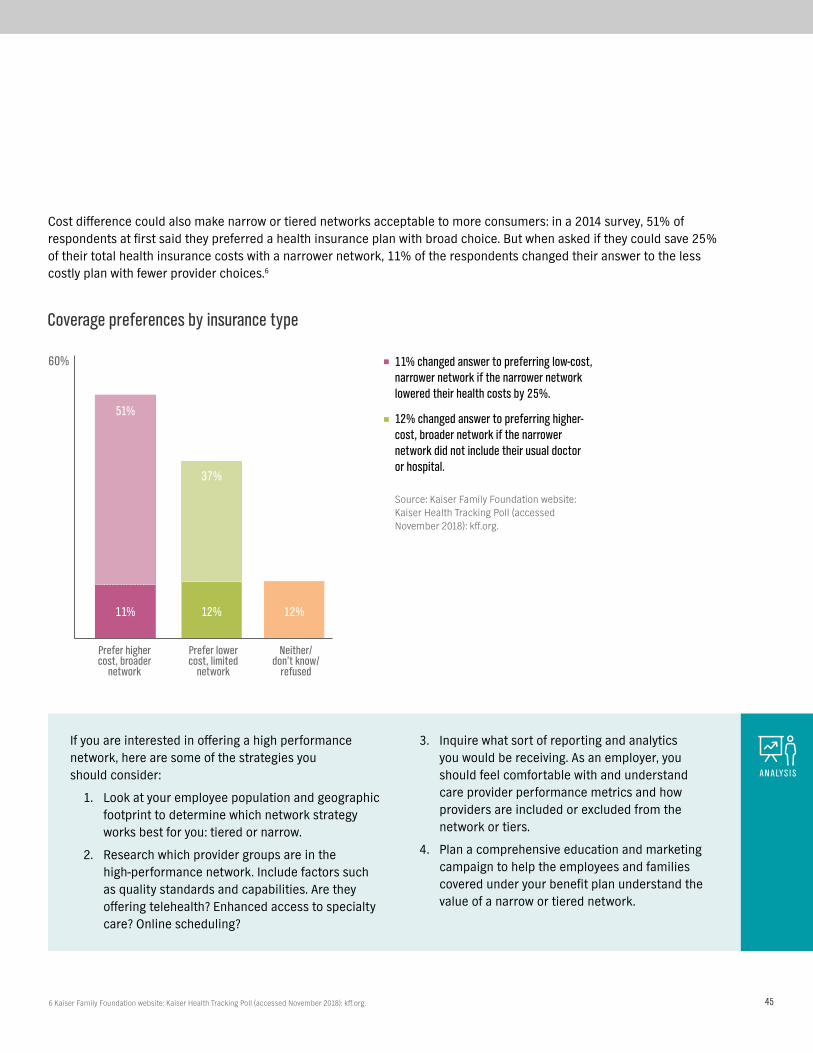
Cost difference could also make narrow or tiered networks acceptable to more consumers: in a 2014 survey, 51% of respondents at first said they preferred a health insurance plan with broad choice. But when asked if they could save 25% of their total health insurance costs with a narrower network, 11% of the respondents changed their answer to the less costly plan with fewer provider choices.6
Prefer higher cost, broader
network
60%
Prefer lower cost, limited
network
Neither/ don’t know/
refused
Coverage preferences by insurance type
51%
37%
11% 12% 12%
11% changed answer to preferring low-cost, narrower network if the narrower network lowered their health costs by 25%.
12% changed answer to preferring higher-cost, broader network if the narrower network did not include their usual doctor or hospital.
Source: Kaiser Family Foundation website: Kaiser Health Tracking Poll (accessed November 2018): kff.org.
If you are interested in offering a high performance network, here are some of the strategies you should consider:
1. Look at your employee population and geographic footprint to determine which network strategy works best for you: tiered or narrow.
2. Research which provider groups are in the high-performance network. Include factors such as quality standards and capabilities. Are they offering telehealth? Enhanced access to specialty care? Online scheduling?
3. Inquire what sort of reporting and analytics you would be receiving. As an employer, you should feel comfortable with and understand care provider performance metrics and how providers are included or excluded from the network or tiers.
4. Plan a comprehensive education and marketing campaign to help the employees and families covered under your benefit plan understand the value of a narrow or tiered network.
ANALYSIS
6 Kaiser Family Foundation website: Kaiser Health Tracking Poll (accessed November 2018): kff.org. 45

Planning for retiree health care expenses
1 Bureau of Labor Statistics website: Consumer Expenditure Survey (accessed November 2019): bls.gov/cex/2017/combined/age.pdf.2 Fidelity website: How to Plan for Rising Health Care Costs (accessed November 2019): fidelity.com.3 2018 Employer Health Benefits Survey, The Henry J. Kaiser Family Foundation, [October 3, 2018]).4 Bureau of Labor Statistics: bls.gov/cex/2017/combined/age.pdf.
Top consumer expenditures4
Age 65-74 75+
Annual spend $54,997 $41,849
Housing $18,068 $14,692
Food $6,818 $5,621
Healthcare $6,723 $6,457
Health care costs are one of the largest expenses for retirees and they’re growing faster than other costs. In fact, health care costs are the third largest expenditure for those between 65-74 years of age and the second largest expenditure for those who are 75 or older.1 According to the Fidelity Retiree Health Care Cost Estimate, an average retired couple age 65 in 2018 may need approximately $280,000 saved (after tax) to cover health care expenses in retirement alone.2 This comes at a time when fewer companies are sponsoring retiree health benefits. In 2018, retirement health benefits were offered by only 18% of companies with 200+ employees.3
However, companies can help employees even if they do not sponsor retirement health benefits. One way is by encouraging them to increase contributions to tax-advantaged accounts, such as Health Savings Accounts (HSAs), which enable tax-free spending on health care in retirement. These types of accounts can help reduce the erosion of their retirement savings and help promote financial wellness.
Among large employers offering health benefits to active workers 1988 - 2018
Percentage of employers offering retiree health benefits
*Estimate is statistically different from estimate for the previous year. No statistcal tests are conducted for years prior to 1999.
Note: Large employers have 200 or more workers.
Source: Kaiser/HRET Survey of Employer-Sponsored Health Benefits, 1999-2018; KPMG Survey of Employer-Sponsored Health Benefits, 1991, 1993, 1995, 1998; The Health Insurance Association of America (HIAA), 1988.
1988 1998 2008 2016 2017 2018
70%
66%
29%
40%
18%*
24% 25%
46
Economic snapshot Benefit strategies Emerging trends
100%
2014 2015 2016 2017 2018
200 - 999 workers
1,000 - 4,999 workers
5,000 or more workers
All large firms
Test found no statistical difference from estimate for the previous year shown.
Note: Large firms have 200 or more workers.
Source: Kaiser/HRET Survey of Employer-Sponsored Health Benefits, 1999-2018; KPMG Survey of Employer-Sponsored Health Benefits, 1991, 1993, 1995, 1998; The health Insurance Association of America (HIAA), 1988.
2%
6%7% 7%
12%
7%
2%
11%12%
10%
14%
12%
2%
7%
25%
5%
20%
6%
8%
4%
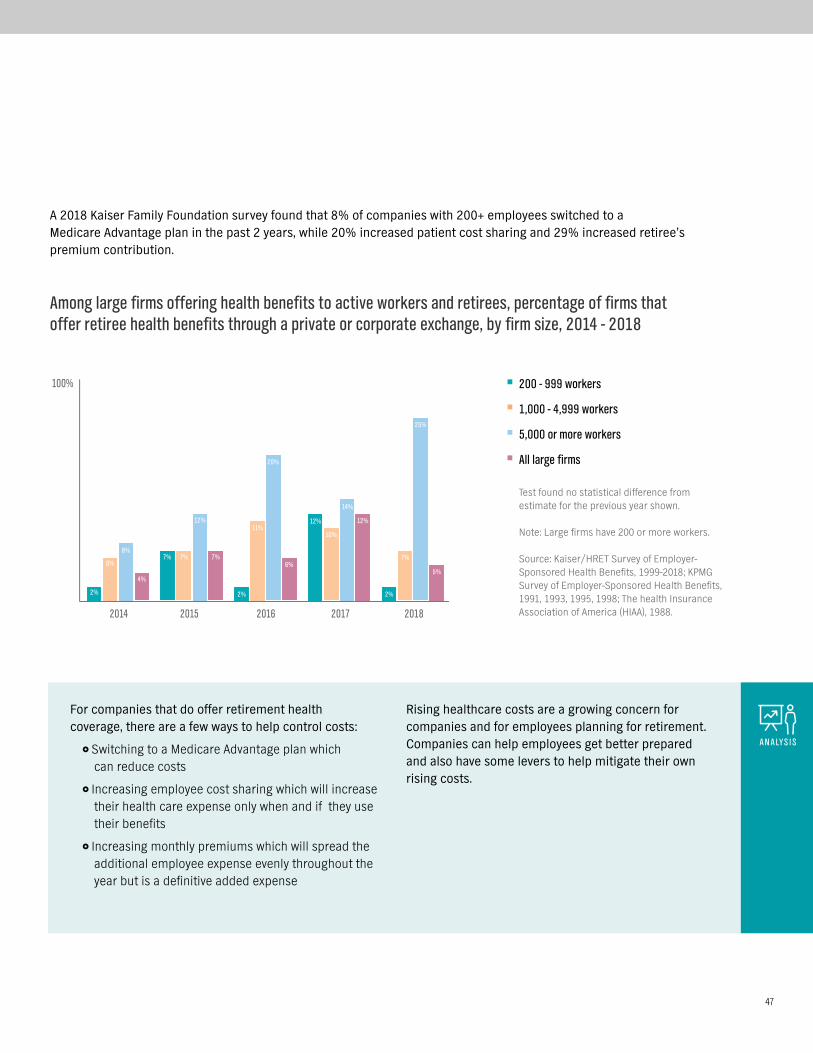
A 2018 Kaiser Family Foundation survey found that 8% of companies with 200+ employees switched to a Medicare Advantage plan in the past 2 years, while 20% increased patient cost sharing and 29% increased retiree’s premium contribution.
Among large firms offering health benefits to active workers and retirees, percentage of firms that offer retiree health benefits through a private or corporate exchange, by firm size, 2014 - 2018
For companies that do offer retirement health coverage, there are a few ways to help control costs:
}} Switching to a Medicare Advantage plan which can reduce costs
}} Increasing employee cost sharing which will increase their health care expense only when and if they use their benefits
}} Increasing monthly premiums which will spread the additional employee expense evenly throughout the year but is a definitive added expense
Rising healthcare costs are a growing concern for companies and for employees planning for retirement. Companies can help employees get better prepared and also have some levers to help mitigate their own rising costs.
ANALYSIS
47

The concierge service model has moved beyond the front desk of a hotel. In an age where customers are more empowered than ever, the concierge model is evolving to customer service for other industries, including health care coverage.
Historically, health plan customer service has been known for answering questions about copays, claims, what’s covered and what the caller owed, but didn’t go much beyond that. In the last decade, though, two trends have converged:
}} Health plan designs have gotten more complex, including high-deductible plans.
}} Consumers have come to expect far better service. And they use social media to detail their experiences.
As a result, more people need more help understanding their health coverage, and health care companies have realized the need to evolve their service approach.
A concierge customer service model focuses on getting the individual the information and resources they need to manage their health and health benefits. Concierge customer service models have associates who are often specially selected and trained to consult and provide comprehensive support.
They generally go beyond the “obvious question” to anticipate what else the individual may need, based on the situation, and offer suggestions as well as proactive follow-up. For your employees, this can mean less time tracking down health care information, and less stress about their benefits. This approach also results in higher member satisfaction.1
In some companies, concierge associates may be closely linked to health care professionals, such as nurses, health coaches, educators and social workers. Together, they can guide your employees through their health situation and help them find the right care, at the right time, for the right cost.
More advanced concierge models use health data, sophisticated algorithms and even speech-recognition software to enable their associates to identify opportunities to help members get the care they need.
Often, it’s when someone isn’t getting the care they need that poses the biggest risk. Data analytics are used to identify when someone is missing a key piece in their care, like a routine screening or exam. For example, if a member calls in to ask about a recent claim for a doctor visit, the algorithm may identify that the person has not had a preventive screening, or is due for a test. The system can then alert the associate to remind the member about this gap in care.1
When evaluating any carrier, looking into their customer service model is a great way to understand the level of service your employees will get from them, which can have a direct impact on the cost and quality of their care.
The evolution of concierge service
2 Super Office website: 32 Customer Service Statistics You Need to Know for 2019 (accessed October 2018): superoffice.com.
89% of customers get frustrated
because they need to repeat their issues to multiple representatives2
89% of businesses are soon expected
to compete mainly on customer experience2
48
Economic snapshot Benefit strategies Emerging trends
1 Anthem Marketing Insights & Analytics, December 2017.

Premium increases and a reduction in the number of issuers selling plans in the Affordable Care Act marketplaces over the past several years have prompted some stakeholders to propose allowing the sale of health insurance across state lines as a way to increase marketplace competition and drive down premiums. But would allowing insurers to sell insurance across state lines really accomplish these objectives?
Are there benefits to allowing the sale of health insurance across state lines?
Proponents of this idea believe that allowing consumers to select from health insurance plans offered throughout the country, may encourage insurers to improve their offerings and reduce their costs to be more competitive. They also believe it would encourage insurers to enter markets where there currently is little or no competition.
Currently, five states – Maine, Rhode Island, Kentucky, Georgia and Wyoming – already allow the sale of health insurance across state lines, yet not a single health insurance company has taken advantage of the opportunity presented in these states. Why not?
A major reason is that selling across state lines doesn’t improve the affordability of health insurance. A key driver of health insurance premiums is the local cost of health care. Premiums of cross-border health plans would continue to reflect these local costs, so individuals in areas with higher health care prices would not experience lower health insurance premiums.
Health insurers would also face a significant barrier to selling across state lines in that they must develop networks of health care providers and try to negotiate favorable contracts with networks of hospitals and doctors in the states where they plan to sell. Because an out-of-state insurer would not have a local presence and recognition in the state, it’s likely the out-of-state insurer would have difficulty negotiating effectively with providers.
Will association health plans promote the sale of insurance across state lines?
Association health plans (AHPs) are group health plans sponsored by an association or a group of small employers. Any employer, including small businesses and certain self-employed individuals (working owners), may join an association if the employers are in the same industry, regardless of location, and that association can sponsor a group health plan. That means groups of small businesses and working owners in the same industry, but located in different states, can join an association that purchases a health insurance plan for all its members.
Some associations with nationwide scope have expressed interest in sponsoring an AHP. However, a number of states, including California, New York and Connecticut, are concerned about out-of-state issuers offering plans to their residents. So they’ve adopted rules that would make it difficult for nationwide association health plans to operate easily.
Selling health insurance across state lines: what it means for employers
49

1 National Business Group on Health website: Surveys of Large Group Employers (accessed November 2018): businessgrouphealth.org. 2 NTCA The Rural Broadband Association website: The Future of Rural America Includes Healthcare Access (accessed November 2018): ceoblog.ntca.org.
Medical care is increasingly being handled remotely — rather than face-to-face — through what’s now known as telehealth. Using a secure, two-way video connection, members can have video visits with board-certified doctors about a variety of symptoms and conditions. The doctors can diagnose problems, recommend treatments — even prescribe drugs when appropriate.
Overall, the use of telehealth is trending upward, but it’s not where it could be. Over the first half of 2016, approximately 70% of all employees at large companies had access to telehealth, but only 3% of those employees actually used it. Telehealth is still a critical part of most employers’ health benefits strategy.
Telehealth’s biggest advantage is that it opens up many possibilities of where medical care can be delivered. Patients no longer have to drive to a hospital or a doctor’s office to receive a medical consultation. Many areas in the U.S. are underserved medically because they don’t have enough people to support primary care doctors, let alone specialists. There are an estimated 40 specialists for every 10,000 rural Americans, versus 134 per every 10,000 urban Americans.2 With digital access, more people can get the quality medical care they need.
The future of telehealth
The 2019 National Business Group on Health (NBGH) Large Employers Health Care Strategy and Plan Design Survey showed
THAT HALF OF LARGE EMPLOYERS SAID IMPLEMENTING MORE VIRTUAL CARE SOLUTIONS WILL BE THEIR NUMBER 1
INITIATIVE IN 2019.1
#1
50
Economic snapshot Benefit strategies Emerging trends

Source: news.aamc.org/press-releases/article/workforce_report_shortage_04112018/.
THE U.S. COULD SEE A SHORTFALL OF NEARLY 120,000 PHYSICIANS BY 2030
By that year, the country may have a deficit of between 14,800 and 49,300 PCPs
Nearly 1 in 3 physicians will reach age 65 or older over the
next ten years – a mass retirement could create a
significant shortage of doctors
Medical schools have upped incoming class sizes by nearly 30% since 2002 to help address the burgeoning
need for caregivers
There are many reasons to be optimistic about the capabilities of telehealth, but there are a few concerns. For it to continue to grow, technology still needs to improve. Expanded access to high speed Internet is needed, and researchers need to improve monitoring technology to provide better data for patients who are out of the hospital. Patients and doctors also need to become more comfortable with remote appointments.
Many telehealth providers have announced expanded capabilities, including virtual psychology and psychiatry appointments, allergist and other specialist visits, digital health coaching for chronic conditions (for example obesity, high blood pressure, cholesterol), and more. With technology and patient expectations evolving, all signs point to virtual and remote health care becoming the norm.
ANALYSIS
51

1 Mercer website: Delivering the Workforce for the Future (accessed October, 2018): mercer.com.2 Society for Human Resource Management: Labor Secretary Acosta Talks About Deregulation, Gig Economy: (accessed, 2018): shrm.org.
Heard of these? Mobile workforce. Gig economy. Side hustles. Talent wars. On-demand workforce. Sharing economy. Contingent workers. The workforce is morphing in multiple directions, and as it does, so do benefits needs and expectations.
Summed up by Mercer consulting firm, “… the best companies will establish and manage an extended talent ecosystem, comprising multiple talent pools and spanning multiple generations.”1 In other words, companies will be using a mix of different kinds of workers, some of whom will work directly for the company, some of whom may be temporary staff or contractors, and possibly other arrangements.
While employee benefits have shifted over decades to reflect changes in generational and societal needs, now workers’ needs for different types of financial and personal support are changing even faster, and the benefits to meet those needs are struggling to keep up.
“So many of our laws presuppose a traditional employer-employee relationship,” said Labor Secretary Alexander Acosta. “At some point the economy changes,” he added, noting that “we need to ask if those laws are still right for the modern economy.”2
Ready or not, changes are clearly underway, with many companies saying that they will be increasing their use of different types of workers in just the next couple of years.
Future of workforce benefits
Anticipated use of each labor type in 2020 relative to today
Increase
Stay the same
Decreased
Note: n = 11,070
Source: Deloitte website: Human Capital Trends: (accessed October 2018): deloitte.com.
Contractors
Freelancers
Gig workers
Crowd workers
100%
37%
33%
28%
21%
46%
52%
56%
62%
16%
15%
15%
18%
52
Economic snapshot Benefit strategies Emerging trends

How benefits differ for part-time, full-time and contract workers
The benefit availability and mix varies for different types of workers, with contractors still ahead of part-timers in what they can get.
3 Willis Towers Watson website: The Future of Benefits (accessed October 2018): towerswatson.com.
All workers Part-timeFull-time Contract
66%
74%
35%
49%46%
32%
19%
59%
69%
21%
53%60%
24%27%30%
14%
Research by Willis Towers Watson consulting firm, shows the more things change, the more they stay the same in terms of what workers want – short-term and long-term financial protection.
Those benefits may take different forms than they have in the past. For example, traditionally, bonuses have been reserved for full-time employees. But in some companies, especially where gig workers are key to delivering value for customers, they may be eligible for bonuses for key contributions to achieving team goals.
Looking ahead, there will continue to be more and different types of benefits that companies can offer those who work for and with them. When sifting
through the options and evaluating which will deliver the most value, Willis Towers Watson provides five guiding principles:3
}} Align benefit strategy with business objectives.
}} Aim for global consistency with local relevance.
}} Provide core security and increase employee choices.
}} Improve the employee experience.
}} Create a platform to deliver high-performing programs.
ANALYSIS
Any benefits
Health insurance
Retirement plan
Pension
Source: National Public Radio website: Freelanced: The Rise of the Contract Workforce (accessed October 2018): npr.org.
53