Embed Size (px)
Citation preview
Eurasia Journal of Mathematics, Science & Technology Education, 2014, 10(6), 547-558
Copyright © 2014 by iSER, International Society of Educational Research ISSN: 1305-8223
Trends in Dissertations Involving Technology-Assisted Mathematics Instruction: The Case of Turkey Enver Tatar, Adnan Akkaya & Türkan Berrin Kağızmanlı Atatürk University, TURKEY Received 19 September 2013; accepted 24 August 2014
The purpose of this study is to examine thesis studies on technology-supported mathematics education in Turkey in terms of the keywords, mathematical areas, technologies and methodology used and results obtained. Data were obtained from 105 graduate theses. At the end of the analysis of the data, it was determined that most used keywords were from the subject area of mathematics education and there were more studies that focused on algebra in comparison with those on geometry, and the computer was the most frequently preferred technology employed. Researchers mostly preferred to take primary education 6th, 7th, 8th grade students as their population samples, and used achievement tests as the data collection instrument. It was found that mixed research methods were the most frequently employed ones, quantitative studies were preferred more than qualitative studies, mean/standard deviation data were used more in the analysis of quantitative data while descriptive analysis was preferred more in the analysis of qualitative data. When the results obtained from experimental studies in the theses were compared, it was seen that higher values were obtained in treatment groups receiving technology-supported education in terms of achievement, attitude towards mathematics, interest in mathematics, motivation for mathematics and retention of learning. Keywords: content analysis, educational research, mathematics education, technology-assisted
INTRODUCTION
Traditional education, in which the student is a passive learner has failed to meet educational requirements, and has resulted in the introduction of new approaches to education in which the student is more active. Technology, which has begun to pervade every aspect of our lives, is very important in the transition from traditional education to a more student-centered approach. It is difficult to perceive an education system that contributes to the development and progress of societies and individuals independent of
technology in this century in which we face technological changes every passing day (Gerçek, Köseoğlu, Yılmaz, & Soran, 2006). Developments in education and technology enable information systems to be effectively used in education, resulting in an increasingly positive influence on the quality of this usage (Ersoy, 2009). As an educational approach independent of technology does not reflect today‟s educational environment where education influences technology and vice versa, the use of technology in education has come to be obligatory (Erdemir, Bakırcı, & Eyduran, 2009). Today, technologies such as the computer, CDs, the calculator, the Internet, the smart board, the video camera, projector and cassette are widely used in educational environments. When these kinds of technologies are integrated into educational environments, students may be better motivated for learning resulting in better comprehension of the concepts that are introduced in lessons (Aktümen &
Correspondence to: Enver Tatar, Department of Mathematics Education, Kazım Karabekir Education Faculty, Atatürk University, Erzurum, 25240, TURKEY E-mail: [email protected] doi: 10.12973/eurasia.2014.1216a
E. Tatar et. al
548 © 2014 iSER, Eurasia J. Math. Sci. & Tech. Ed., 10(6), 547-558
Kaçar, 2008; Baki & Çakıroğlu, 2010; Machin & Rivero, 2002). It is accepted that teachers should use technological tools in order to increase the interest of students in class and to make student understanding of mathematics easier (Alakoç, 2003). Hohenwarter, Hohenwarter, & Lavicza (2008), also reported that the use of technologies by teachers during their lessons supports the learning of the students and improves their mathematical knowledge and skills. The application of technology involves the use of concrete and experimental approaches to mathematical topics and enables students to employ more abstract and symbolic approaches in their solution of problems (Flores, 2002). It is thought that dynamic and visual learning environments provided via technology will positively impact our views of mathematics education not only in terms of teaching and teaching strategies, but also in regard to the content of mathematics education (Karadağ & McDougall, 2009). Through the integration of technology into mathematics, and the creation of a learning environment in which mathematics is no longer considered a specter, students become active participants in lessons; they construct their own learning and are both engaged and entertained while learning mathematics. Studies involving instructional technologies should be based on the current literature, especially compared to other fields as it is a field that is rapidly developing
and changing (Gülbahar & Alper, 2009). In the field of information technology, educational researchers publish papers or present papers at conferences on the integration of technology into mathematics education. A review of the current literature will not only suggest new ideas for future research to researchers, but will also provide a convenient basis for the creation of a theoretical basis for studies, the selection of appropriate materials, and for the comparison and interpretation of research results (Tatar & Tatar, 2008). As a result, through an examination of previous studies, researchers will find a strong basis for their future work. A literature review makes an important contribution to researchers in their particular fields. Tatar and Tatar (2008) have remarked that keywords especially give the researcher the opportunity to locate publications relevant to his/her own study. Examination of previous studies reported in graduate theses and published articles generally reveal the dominant trends in current educational research. In Turkey, many studies have been conducted in different fields involving the use of instructional strategies. By undertaking a content analysis of studies conducted in the field of instructional technologies, Gülbahar and Alper (2009) reported that studies conducted on a theoretical basis were limited. Also, more studies were quantitative in nature, while qualitative studies were limited in number. Examining the methodologies employed in studies of science education, Sözbilir and Kutu (2008) also concluded that quantitative research was conducted more in comparison to qualitative research. They found that one or two different data collection tools as well as achievement tests and surveys were used in the studies. Furthermore, data analysis was performed via descriptive statistics in quantitative research, while mostly descriptive analysis was used in analysis of qualitative research. In addition, Sozbilir, Kutu and Yasar (2012) conducted a content analysis of studies in terms of the subject matter that was investigated and research methods/designs and data analyses procedures that were used in science education papers published by Turkish authors in national and international journals. They determined the percentages of most frequently studied subject matter at national and international levels, trends in research designs, frequently used data analysis methods and the number of different data collection tools that were used over the period from 1999 to 2009. Examining the statistical errors in thesis involving studies carried out in the fields of science and mathematics, Kabaca and Erdoğan (2007) found statistical mis-uses in seven sub-categories in many theses. Making a descriptive analysis of the keywords of studies published on science and mathematics education, Tatar and Tatar (2008) found that the frequencies of keywords specific to science and
State of the literature
The study aims to determine the trends of graduate thesis studies on technology-based mathematics education.
Examination of previous studies generally reveals the basic structure of the researches.
Distribution of keywords, subject areas, technologies, methodologies and nature of the results obtained from experimental studies are the main components of the study that allow us to examine research subjects of the theses.
Contribution of this paper to the literature
This study describes the dominant trends of theses on technology-based mathematics education in Turkey.
This study provides researchers with information about the structure of theses and to enable them to be aware of the studies that have been conducted.
It is envisaged that the study would guide researchers in their future studies and to introduce them to new perspectives in their research.

Trends in Technology-Assisted Mathematics
© 2014 iSER, Eurasia J. Math. Sci. & Tech. Ed., 10(6), 547-558 549
mathematics topics were low. In particular, secondary education and university level topics were examined. Studies in science education focused on misconceptions while studies in mathematics education dealt more with attitude surveys. Examining research subjects in mathematics education, Kayhan and Koca (2004) found that the studies mainly involved the subjects of “cognitive dimension”, “mathematics subjects (curriculum)” and “teaching methods”. Examining studies that were published on mathematics education, Ulutaş and Ubuz (2008) found that such studies mostly focused on the subjects of numbers and geometry. Experimental studies were preferred, and primary school and undergraduate students were chosen as the samples for the studies. Examining theses written in the field of mathematics education and teaching, İnceoğlu (2009) found that (1) there were more graduate theses, (2) there were more male researchers in comparison with female researchers, and (3) the number of words in thesis titles was a maximum of 24 and a minimum of 3. Examining master and doctoral studies conducted on mathematics education in Turkey, Baki, Güven, Karataş, Akkan, and Çakıroğlu (2011) reported that researchers mostly preferred (1) mathematics teaching as a research subject, (2) experimental design as the research design, (3) surveys and achievement tests as data collection tools, and (4) primary and secondary grade students (in 6th, 7th and 8th grades) as the samples for the studies. Identifying the trends in mathematics education research papers published by Turkish researchers in the last quarter, Çiltaş, Güler, and Sözbilir (2012) found that
the number of mathematics education researches gradually increased over the years. The mathematics education papers were mainly in the areas of algebra, geometry and about the relationship of mathematics with other disciplines. The present study aims to determine the trends of graduate thesis studies on technology-based mathematics education published in Turkey. The research questions that guided the study are as follows:
What is the distribution of keywords used in the studies?
What are the subject areas on which the studies were conducted?
What are the technologies employed in the studies?
What is the distribution of methodologies (sample type, sample size, research method, data collection tool, data analysis) employed in the studies?
What is the nature of the results obtained from these experimental studies?
METHOD
Content analysis was employed in the present study. Content analysis is a research technique used to make repeatable and valid deductions from texts concerning their contents (Krippendorff, 2004). In content analysis, which is a suitable method for analyzing all kinds of texts written within the framework specific rules, the principle entails the reading and interpretation of the meanings covered by the texts by different researchers, analysts and observers (Gökçe, 2006).
Table 1. The number of theses examined according to universities
University Master theses Doctorate theses Total Abant Izzet Baysal 2 0 2 Anadolu 2 2 4 Ankara 0 1 1 Atatürk 2 3 5 Balıkesir 5 0 5 Çukurova 4 0 4 Dokuz Eylül 10 3 13 Ege 6 0 6 Gazi 9 2 11 Gaziantep 1 0 1 Hacettepe 2 0 2 İstanbul 1 0 1 Kahramanmaraş Sütçü İmam 1 0 1 KTÜ 7 3 10 Marmara 10 1 11 ODTÜ 4 2 6 Osman Gazi 9 0 9 Sakarya 2 0 2 Selçuk 7 0 7 Süleyman Demirel 1 0 1 Yeditepe 1 0 1 Yüzüncü Yıl 0 2 2 Total 86 19 105
E. Tatar et. al
550 © 2014 iSER, Eurasia J. Math. Sci. & Tech. Ed., 10(6), 547-558
Scope of the Study
The present research was conducted on master and doctoral theses related to technology-supported mathematics education in Turkey until the end of 2011; the theses, whose authors have permitted access to, could be accessed via the website of the national thesis center of the Council of Higher Education (YOK), http://tez2.yok.gov.tr. In this way, 105 graduate thesis studies from 22 universities were accessed. The distribution of these theses from various universities is presented in Table 1.
Data Collection Tool
A thesis classification form was used as the data collection tool in the present study (Appendix 1). This form was developed through a modification of the article classification form developed by Sözbilir and Kutu (2008) to meet the requirements of the present study. The form that contained the following items: subject, research design/methods, data collection tools, samples and data analysis methods of the paper, was modified to consist of five components, namely identification of the theses, distribution of keywords, areas covered by the theses, technologies employed in the theses and distribution of methodologies (sample type, sample size, research method, data collection tool, data analysis) and the results obtained from experimental studies. The modified form was validated by two experts and reorganized using the feedback received.
Data Analysis
The theses were content analysed. One of basic principles of content analysis is to combine similar data within the framework of particular concepts and themes and to arrange and interpret them in such a way that readers can understand them (Yıldırım & Şimşek, 2008). The authors studied the theses under the guidance of the first author. The theses were distributed among the authors who independently classified them. To achieve reliability the authors came together frequently and discussed the classifications step by step. Particular attention was paid to achieving agreement of all three authors during the analysis of the research data. The data were analyzed, and the results of the analyses were presented in tables or charts together with their frequencies.
FINDINGS
This section presents data obtained from the theses examined in the order of the questions of the study.
Keywords Used in the Studies
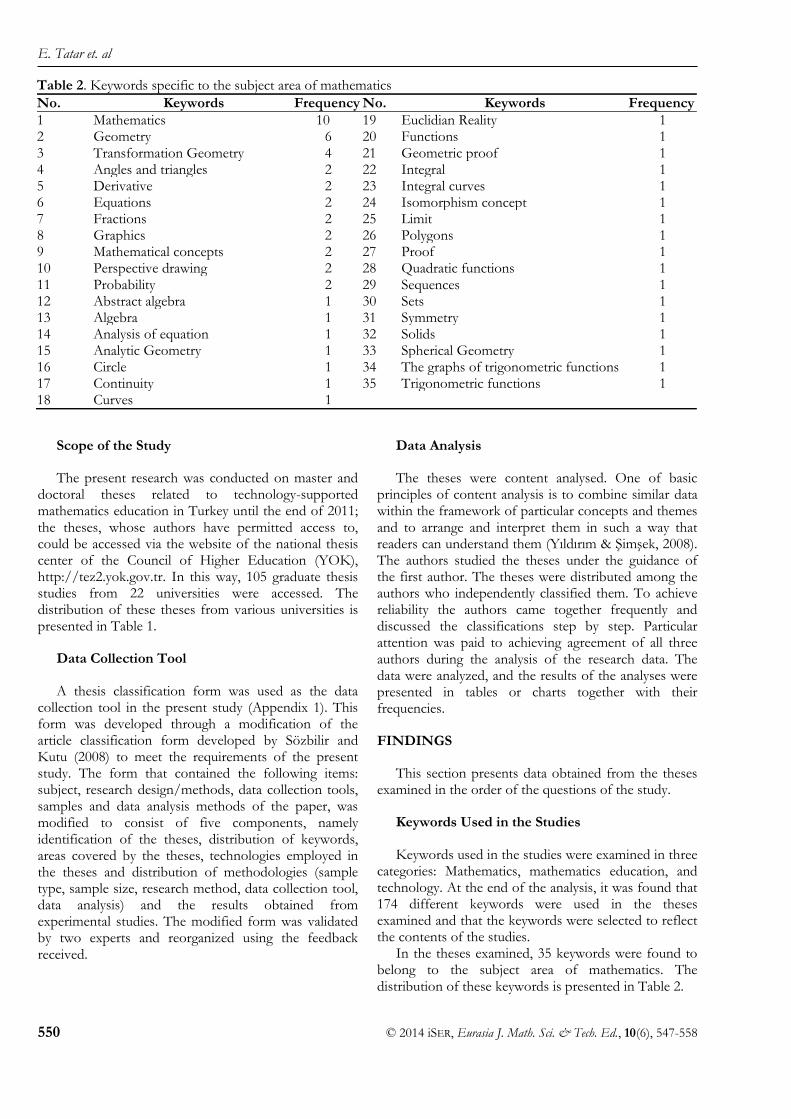
Keywords used in the studies were examined in three categories: Mathematics, mathematics education, and technology. At the end of the analysis, it was found that 174 different keywords were used in the theses examined and that the keywords were selected to reflect the contents of the studies. In the theses examined, 35 keywords were found to belong to the subject area of mathematics. The distribution of these keywords is presented in Table 2.
Table 2. Keywords specific to the subject area of mathematics
No. Keywords Frequency No. Keywords Frequency
1 Mathematics 10 19 Euclidian Reality 1 2 Geometry 6 20 Functions 1 3 Transformation Geometry 4 21 Geometric proof 1 4 Angles and triangles 2 22 Integral 1 5 Derivative 2 23 Integral curves 1 6 Equations 2 24 Isomorphism concept 1 7 Fractions 2 25 Limit 1 8 Graphics 2 26 Polygons 1 9 Mathematical concepts 2 27 Proof 1 10 Perspective drawing 2 28 Quadratic functions 1 11 Probability 2 29 Sequences 1 12 Abstract algebra 1 30 Sets 1 13 Algebra 1 31 Symmetry 1 14 Analysis of equation 1 32 Solids 1 15 Analytic Geometry 1 33 Spherical Geometry 1 16 Circle 1 34 The graphs of trigonometric functions 1 17 Continuity 1 35 Trigonometric functions 1 18 Curves 1

Trends in Technology-Assisted Mathematics
© 2014 iSER, Eurasia J. Math. Sci. & Tech. Ed., 10(6), 547-558 551
Among the keywords determined to be specific to the subject area of mathematics, keywords such as mathematics (10), geometry (6), transformation geometry (4), angles and triangles (2), derivatives (2), equations (2), fractions (2), graphics (2), mathematical concepts (2), perspective drawing (2) and probability (2) were used more than once, and the remaining 24 different keywords were used only once. The distribution of keywords specific to the subject area of mathematics education in the theses examined is summarised in Table 3. Since there are many keywords within the subject area of mathematics education (95), 23 keywords among these keywords with frequency values of two or more are given in Table 3.
Examining the keywords specific to the subject area of mathematics education, it was seen that “mathematics instruction”, “attitude” and “achievement” were the most frequently used keywords, and that keywords such as “mathematics education”, “education and instruction”, “geometry instruction”, “retention” and “prospective mathematics teacher” had frequencies greater than three. Among the 44 keywords found to include the subject area of technology, 21 keywords with frequency values of two or more were included. The distribution of keywords in the subject area of technology in the
theses within the scope of the present study is given in Table 4.
Examining the keywords specific to the subject area of technology, it was seen that the keywords “computer based instruction/education” was used in 41% of the theses. It was seen that the keywords, “Geometer‟s Sketchpad” and “Cabri” were used as the dynamic geometry software, and “GeoGebra” was used as the dynamic mathematics software. Apart from software, “computer”, “smart board” and “calculator” were used as other instructional technologies in the keywords.
Subject areas in which the studies were conducted
The subject areas of the theses based on technology-supported mathematics teaching were divided into these groups: algebra, geometry, mixed and other. The results obtained from this categorization are presented in Figure 1. Theses on geometry were included in the „geometry group‟, theses on mathematics subjects except geometry were included in the „algebra group‟, both subjects studied were included into the „mixed (geometry and algebra) group‟. In addition to these groups, theses on interest, ability, attitude, teacher
Table 3. Keywords with the subject area of mathematics education
No. Keywords Frequency No. Keywords Frequency
1 Mathematics instruction 21 13 Teacher education 3 2 Attitude 19 14 Collective learning 2 3 Achievement 18 15 Computer based instruction tutorial 2 4 Mathematics education 9 16 Conceptual learning 2 5 Education and instruction 8 17 Constructivism 2 6 Geometry instruction 6 18 Geometric thinking levels 2 7 Retention 5 19 Learning geometry 2 8 Prospective mathematics teachers 4 20 Multiple intelligences 2 9 Anxiety 3 21 Primary school 2 10 Misconception 3 22 Spatial ability 2 11 Prospective teachers 3 23 Traditional teaching method 2 12 Problem solving skill 3
Table 4. Keywords involving the subject area of technology
No. Keywords Frequency No. Keywords Frequency
1 Computer based instruction 32 12 Technology 3
2 Computer based education 11 13 Technology based instruction 3
3 Dynamic geometry software 10 14 Calculator 2
4 Computer based math. instruction 6 15 Computer self-efficacy 2
5 Cabri 5 16 Educational technology 2
6 GeoGebra 5 17 Graph calculator 2
7 Geometer‟s Sketchpad 5 18 Informatics technologically 2
8 Computer 4 19 Smart board 2
9 Instructional software 4 20 Technology integration 2
10 Dynamic geometry 3 21 Web based instruction 2
11 Education software 3

E. Tatar et. al
552 © 2014 iSER, Eurasia J. Math. Sci. & Tech. Ed., 10(6), 547-558
views, the introduction of software programs and theoretical studies were included into the „others‟ group.
Based on the distribution of technology-supported theses examined according to subject areas, it was found that 41% were in the research area of algebra, 34% were in the research area of geometry, and 23% were in other areas of research. The areas of algebra and geometry were combined in only two studies.
Technologies Used in the Studies
The results obtained on examination of technologies used in the theses are given in Table 5.
It was found that the researchers mostly used the computer in technology-supported learning environments. It was also found that these studies utilized dynamic software programs such as Geometry Sketchpad (16), Cabri (11), GeoGebra (9), Cindrella (1) and Euclidian Reality (1) and computer algebra systems such as Mapple (4), Mathematica (3), Logo (2), Mathcad (2) and Derive (1). In addition, internet, training CDs and Microsoft Office were also utilized in technology-supported educational environments. Thirty nine studies that were included in the “Other” category in Table 5 were either studies in which a new software program other than existing ones was developed or studies about computer technologies which had frequency values lower than three. It was observed that, with the
exception of the computer, projectors, smart boards and calculators were the more frequently preferred tools among the technological tools used in educational environments.
Methodologies Employed in the Studies
In this section, the methodologies employed in the studies are examined, and the analyses made according to the sample type and size, research method, data collection tool and data analysis concepts are presented.
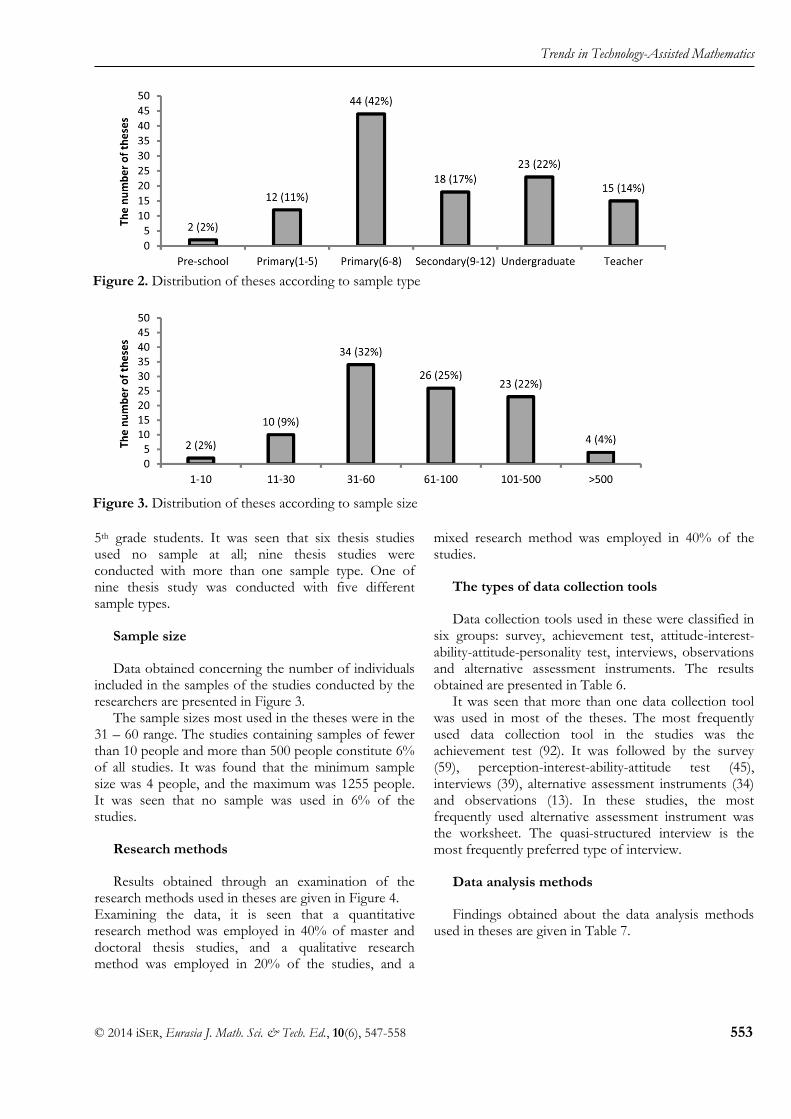
Sample types
Sample types that researchers involved in their theses were divided into six groups: Pre-school, primary education 1st 2nd, 3rd, 4th, 5th grade, primary education 6th, 7th, 8th grade, secondary education, undergraduate students, and teachers. Data obtained are given in Figure 2.
It was found that mostly primary (6-8) (44) and undergraduate students (23) were preferred in the theses examined. The lowest number of studies was conducted at pre-school level: only two studies were conducted on students in their pre-school period. Eighteen studies were conducted with secondary education students, and 15 studies were conducted with teachers. Twelve studies were conducted with primary education 1st, 2nd, 3rd, 4th,
Figure 1. Distribution of theses according to subject areas
Table 5. Technologies used in the theses
Technologies
Computer Frequency Other technologies Frequency
Geometry Sketchpad 16 Smart board 5 Cabri 11 Projector 5 Internet 9 Calculator 4 GeoGebra 9 Video-TV 1 Interactive training cd 8 Overhead 1 Microsoft Office 6 Audio cassette 1 Mapple 4 Visual posters 1 Mathematica 3 Other 39 Total 105 Total 18
Trends in Technology-Assisted Mathematics
© 2014 iSER, Eurasia J. Math. Sci. & Tech. Ed., 10(6), 547-558 553
5th grade students. It was seen that six thesis studies used no sample at all; nine thesis studies were conducted with more than one sample type. One of nine thesis study was conducted with five different sample types.
Sample size
Data obtained concerning the number of individuals included in the samples of the studies conducted by the researchers are presented in Figure 3.
The sample sizes most used in the theses were in the 31 – 60 range. The studies containing samples of fewer than 10 people and more than 500 people constitute 6% of all studies. It was found that the minimum sample size was 4 people, and the maximum was 1255 people. It was seen that no sample was used in 6% of the studies.
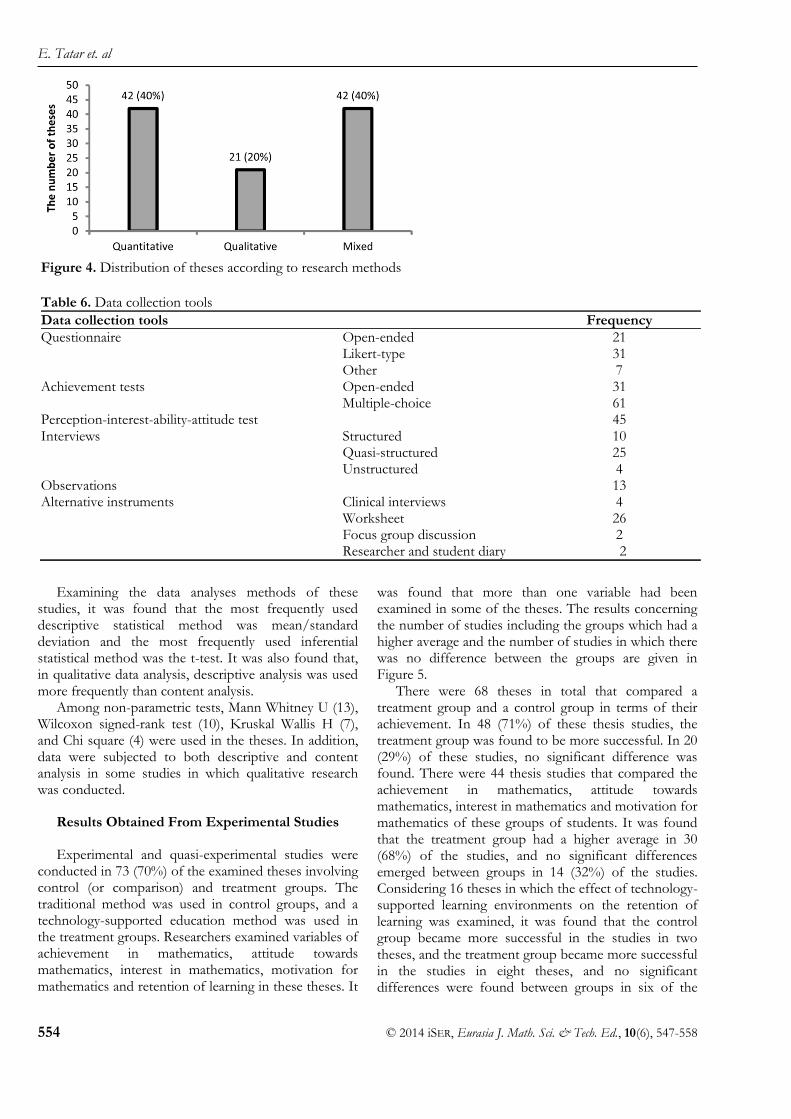
Research methods
Results obtained through an examination of the research methods used in theses are given in Figure 4. Examining the data, it is seen that a quantitative research method was employed in 40% of master and doctoral thesis studies, and a qualitative research method was employed in 20% of the studies, and a
mixed research method was employed in 40% of the studies.
The types of data collection tools
Data collection tools used in these were classified in six groups: survey, achievement test, attitude-interest-ability-attitude-personality test, interviews, observations and alternative assessment instruments. The results obtained are presented in Table 6. It was seen that more than one data collection tool was used in most of the theses. The most frequently used data collection tool in the studies was the achievement test (92). It was followed by the survey (59), perception-interest-ability-attitude test (45), interviews (39), alternative assessment instruments (34) and observations (13). In these studies, the most frequently used alternative assessment instrument was the worksheet. The quasi-structured interview is the most frequently preferred type of interview.
Data analysis methods
Findings obtained about the data analysis methods used in theses are given in Table 7.
Figure 2. Distribution of theses according to sample type
Figure 3. Distribution of theses according to sample size
E. Tatar et. al
554 © 2014 iSER, Eurasia J. Math. Sci. & Tech. Ed., 10(6), 547-558
Examining the data analyses methods of these studies, it was found that the most frequently used descriptive statistical method was mean/standard deviation and the most frequently used inferential statistical method was the t-test. It was also found that, in qualitative data analysis, descriptive analysis was used more frequently than content analysis. Among non-parametric tests, Mann Whitney U (13), Wilcoxon signed-rank test (10), Kruskal Wallis H (7), and Chi square (4) were used in the theses. In addition, data were subjected to both descriptive and content analysis in some studies in which qualitative research was conducted.
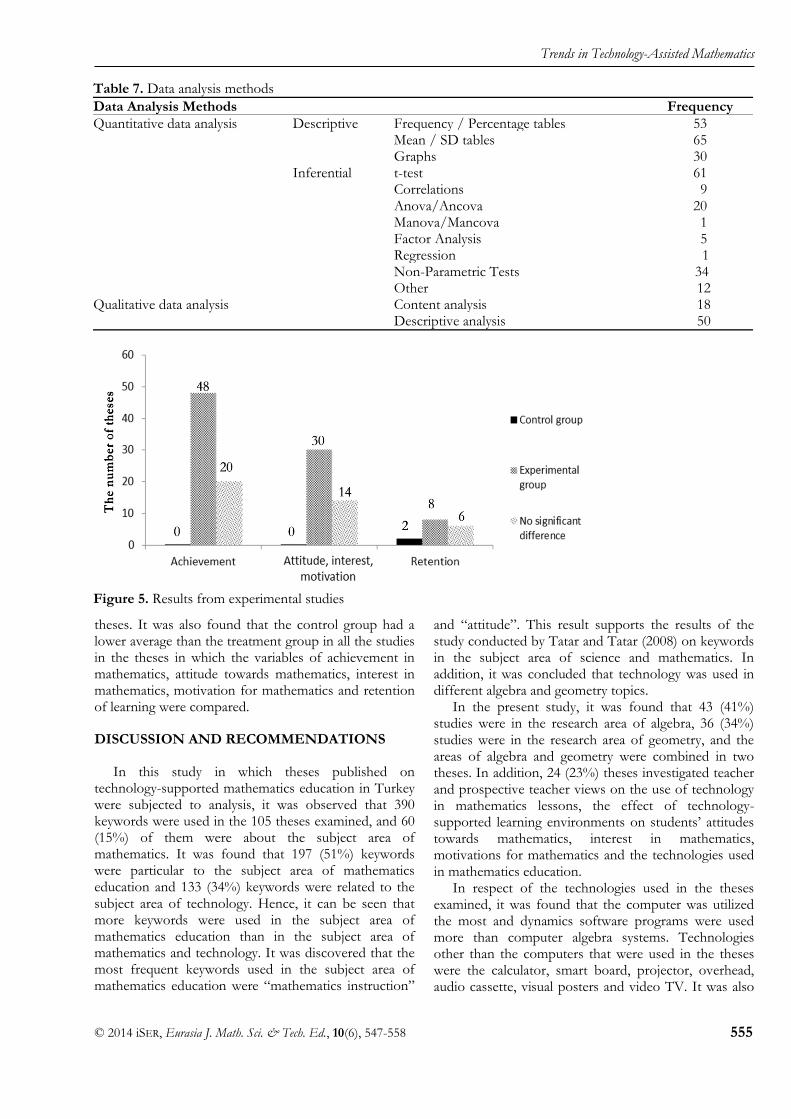
Results Obtained From Experimental Studies
Experimental and quasi-experimental studies were conducted in 73 (70%) of the examined theses involving control (or comparison) and treatment groups. The traditional method was used in control groups, and a technology-supported education method was used in the treatment groups. Researchers examined variables of achievement in mathematics, attitude towards mathematics, interest in mathematics, motivation for mathematics and retention of learning in these theses. It
was found that more than one variable had been examined in some of the theses. The results concerning the number of studies including the groups which had a higher average and the number of studies in which there was no difference between the groups are given in Figure 5.
There were 68 theses in total that compared a treatment group and a control group in terms of their achievement. In 48 (71%) of these thesis studies, the treatment group was found to be more successful. In 20 (29%) of these studies, no significant difference was found. There were 44 thesis studies that compared the achievement in mathematics, attitude towards mathematics, interest in mathematics and motivation for mathematics of these groups of students. It was found that the treatment group had a higher average in 30 (68%) of the studies, and no significant differences emerged between groups in 14 (32%) of the studies. Considering 16 theses in which the effect of technology-supported learning environments on the retention of learning was examined, it was found that the control group became more successful in the studies in two theses, and the treatment group became more successful in the studies in eight theses, and no significant differences were found between groups in six of the
Figure 4. Distribution of theses according to research methods
Table 6. Data collection tools
Data collection tools Frequency
Questionnaire Open-ended 21 Likert-type 31 Other 7 Achievement tests Open-ended 31 Multiple-choice 61 Perception-interest-ability-attitude test 45 Interviews Structured 10 Quasi-structured 25 Unstructured 4 Observations 13 Alternative instruments Clinical interviews 4 Worksheet 26 Focus group discussion 2 Researcher and student diary 2
Trends in Technology-Assisted Mathematics
© 2014 iSER, Eurasia J. Math. Sci. & Tech. Ed., 10(6), 547-558 555
theses. It was also found that the control group had a lower average than the treatment group in all the studies in the theses in which the variables of achievement in mathematics, attitude towards mathematics, interest in mathematics, motivation for mathematics and retention of learning were compared.
DISCUSSION AND RECOMMENDATIONS
In this study in which theses published on technology-supported mathematics education in Turkey were subjected to analysis, it was observed that 390 keywords were used in the 105 theses examined, and 60 (15%) of them were about the subject area of mathematics. It was found that 197 (51%) keywords were particular to the subject area of mathematics education and 133 (34%) keywords were related to the subject area of technology. Hence, it can be seen that more keywords were used in the subject area of mathematics education than in the subject area of mathematics and technology. It was discovered that the most frequent keywords used in the subject area of mathematics education were “mathematics instruction”
and “attitude”. This result supports the results of the study conducted by Tatar and Tatar (2008) on keywords in the subject area of science and mathematics. In addition, it was concluded that technology was used in different algebra and geometry topics.
In the present study, it was found that 43 (41%) studies were in the research area of algebra, 36 (34%) studies were in the research area of geometry, and the areas of algebra and geometry were combined in two theses. In addition, 24 (23%) theses investigated teacher and prospective teacher views on the use of technology in mathematics lessons, the effect of technology-supported learning environments on students‟ attitudes towards mathematics, interest in mathematics, motivations for mathematics and the technologies used in mathematics education.
In respect of the technologies used in the theses examined, it was found that the computer was utilized the most and dynamics software programs were used more than computer algebra systems. Technologies other than the computers that were used in the theses were the calculator, smart board, projector, overhead, audio cassette, visual posters and video TV. It was also
Table 7. Data analysis methods
Data Analysis Methods Frequency
Quantitative data analysis
Descriptive Frequency / Percentage tables 53 Mean / SD tables 65 Graphs 30
Inferential t-test 61 Correlations 9 Anova/Ancova 20 Manova/Mancova 1 Factor Analysis 5 Regression 1 Non-Parametric Tests 34 Other 12
Qualitative data analysis Content analysis 18 Descriptive analysis 50
Figure 5. Results from experimental studies

E. Tatar et. al
556 © 2014 iSER, Eurasia J. Math. Sci. & Tech. Ed., 10(6), 547-558
found in the study conducted by Alakoç (2003) that researchers preferred to use similar technologies.
Primary education involving 6th, 7th, 8th grade students were the most frequently preferred group as a sample. This finding supports the results obtained by Baki et al. (2011) and Lubiensky, & Bowen, (2000). In contrast, Sozbilir et al. (2012) found that undergraduate students were the most frequently preferred group by researchers in science education research. The least frequently preferred sample type was the pre-school that was used only twice. This finding supports that obtained by Ulutaş and Ubuz (2008). In addition, it was found that there were fewer studies conducted with secondary education students and teachers in comparison with students at primary education and undergraduate level. Since secondary education topics are more abstract in comparison with primary education topics, the use of technology in secondary education for concretization purposes will positively affect achievement. Therefore, it is necessary to increase the number of studies conducted with secondary education students. Additionally, increasing the number of studies conducted with teachers to make them aware of the process will be appropriate for achieving the goal of delivering technology-supported education. It was observed that the sample size mostly varied between 31 and 60. This result is similar to the examining trends in educational research in Turkey conducted by Göktaş et al. (2012). The fact that the number of thesis studies conducted with samples of 30 and fewer subjects was only 11% is partly due to the fact that quantitative or mixed research methods were mostly employed while the number of qualitative research methods used was limited.
Examining the research methods of theses, it was observed that quantitative research and mixed research methods were the most frequently preferred. It was also found that quantitative research methods were used more in comparison with qualitative research methods. This trend corresponds to the findings obtained in several other studies (Baki et al., 2011; Gülbahar & Alper, 2009; Ross, Morrison, & Lowther, 2010; Sözbilir & Kutu, 2008; Sozbilir et al., 2012; Ulutaş & Ubuz, 2008).
In the theses examined, the most frequently used data collection tools were the achievement test and the survey. This result supports the findings of the study conducted by Baki et al. (2011) and Çiltaş et al. (2012). A high number of experimental studies comparing the achievements of control and treatment groups more frequently involved the usage of the achievement test in comparison to other data collection tools. Quasi-structured interviews were conducted more than structured and unstructured interviews. Observation was found to be the least frequently used data collection tool. This finding corresponds to that obtained by
Sozbilir et al. (2012). In addition, more than one data collection tool was used in the majority of the theses.
Examining the data analysis of the thesis studies, descriptive statistical methods were seen to be preferred. Mean-standard deviation, frequency-percentage tables and t-test were used more frequently in the analysis of quantitative data. Descriptive analysis was used more often than content analysis in the analysis of qualitative data. This finding supports that in the the study conducted by Sözbilir and Kutu (2008).
According to the results obtained from the thesis studies in which a treatment group comprising students taught in a technology-supported learning environment was compared with a control group taught in the traditional way, learning mathematics in technology-supported environments had a positive impact on achievement in mathematics, attitude towards mathematics, interest in mathematics, motivation for mathematics and retention of learning. This finding is expected to lead to researchers and mathematics teachers choosing technology-supported mathematics instructional strategies and corresponds to the results of other similar studies (Dikovic, 2009; Machin & Rivero, 2002; Tajuddin, Tarmizi, Konting & Ali, 2009).
This study aimed to provide researchers with information about the structure of theses published on technology-supported mathematics education in Turkey and to enable them to be aware of the studies that have been conducted. It is envisaged that the present would guide educational researchers in their studies and to introduce them to new perspectives in their research.
REFERENCES
Aktümen, M., & Kaçar A. (2008). Effects of computer algebra systems on attitudes towards mathematics. Hacettepe University Journal of Education, 35, 13-26.
Alakoç, Z. (2003). Technological modern teaching approaches in mathematics teaching. The Turkish Online Journal of Educational Technology, 2(1), 1303-6521. http://www.tojet.net/volumes/v2i1.pdf [viewed 19 November 2011].
Baki, A., & Çakıroğlu, U. (2010). Learning objects in high school mathematics classrooms: Implementation and
evaluation. Computers & Education, 55(4), 1459-1469. doi: 10.1016/j.compedu.2010.06.009
Baki, A., Güven, B., Karataş, İ., Akkan, Y., & Çakıroğlu, Ü. (2011). Trends in Turkish mathematics education research:From 1998 to 2007. Hacettepe University Journal of Education, 40, 57-68.
Çiltaş, A., Güler, G., & Sözbilir, M. (2012). Mathematics education research in Turkey: A content analysis study. Educational Sciences: Theory & Practice, 12(1), 574-578.
Dikovic, L. (2009). Applications GeoGebra into teaching some topics of mathematics at the college level. Computer Science and Information Systems, 6(2), 191-203. doi: 10.2298/csis0902191D

Trends in Technology-Assisted Mathematics
© 2014 iSER, Eurasia J. Math. Sci. & Tech. Ed., 10(6), 547-558 557
Erdemir, N., Bakırcı, H., & Eyduran, E. (2009). Öğretmen adaylarının eğitimde teknolojiyi kullanabilme özgüvenlerinin tespiti [Determining of Student Teachers‟ Self-Confidence Using Technology in Instruction]. Journal of Turkish Science Education, 6(3), 99-108. http://www.tused.org/internet/tused/archive/v6/i3/text/tusedv6i3s9.pdf [viewed 16 October 2011].
Ersoy, M. (2009). The effect of computer aided applications on elementary mathematics teacher candidates? geometry success and their perceptions about learning and teaching (Unpublished graduate theses). Osmangazi University Institute of Science, Eskişehir.
Flores, A. (2002). Learning and teaching mathematics with technology. Teaching Children Mathematics, 308-310.
Gerçek, C., Köseoğlu, P., Yılmaz, M., & Soran, H. (2006). An analyses of the attltudes of teacher candidates towards computer use. Hacettepe University Journal of Education, 30, 130-139.
Gökçe, O. (2006). İçerik analizi kuramsal ve pratik bilgiler [Content analysis: the theoretical and practical knowledge]. Ankara: Siyasal Bookstore.
Göktaş, Y., Küçük, S., Aydemir, M., Telli, E., Arpacık, Ö., Yıldırım, G., Reisoğlu, İ. (2012). Educational technology research trends in Turkey: A content analysis of the 2000-2009 Decade. Educational Sciences: Theory & Practice, 12(1), 191-196.
Gülbahar, Y., & Alper, A. (2009). A Content analysis of the studies in instructional technologies area. Ankara University Journal of Faculty of Educational Sciences, 42(2), 93-111.
Hohenwarter, J., Hohenwarter, M., & Lavicza, Z. (2008). Introducing dynamic mathematics software to secondary school teachers: the case of GeoGebra. JI. of Computers in Mathematics and Science Teaching, 28(2), 135-146. http://www.geogebra.org/en/wiki/index.php/Publications [viewed 13 July 2010].
İnceoğlu, G. (2009). A evaluation of thesis on mathematics education and mathematics teaching. e-Journal of New World Sciences Academy, 4(3), 1046-1052. http://www.newwsa.com/makale_detay_ozet_bilgiler.asp?d=1&makale_detay_id=901&makale_upload_id=506&islem_turu=0 [viewed 19 September 2011].
Kabaca, T., & Erdoğan, Y. (2007). Examining Of Statistical Properties of the Thesis Studies in the Fieldsof Science, Computer and Mathematics Education. Pamukkale University Journal of Education, 22, 54-63.
Karadağ, Z., & McDougall, D. (2009). Dynamic worksheets: visual learning with the guidance of Polya. MSOR Connections, 9(2), 13-16. doi: 10.11120/msor.2009.09020013
Kayhan, M. & Koca, S. A. Ö. (2004). Research subects in mathematics education: 2000-2002. Hacettepe University Journal of Education, 26, 72-81.
Krippendorff, K. (2004). Content analysis: An ıntroduction to its methodology (2nd ed.). London: Sage Publications.
Lubiensky, S. T., & Bowen, A. (2000). Who‟s counting? A survey of mathematics education research 1982-1998. Journal for Research in Mathematics Education, 31 (5), 626–633.
Machin, M. C., & Rivero, R. D. (2002). Students' attitudes towards mathematics and computers when using Derive in the learning of calculus concepts. The International Journal of Computer Algebra in Mathematics Education, 9(4), 259-283.
Ross, S. M., Morrison, G. R., & Lowther, D. L. (2010). Educational technology research past and present: Balancing rigor and relevance to impact school learning. Contemporary Educational Technology, 1 (1), 17-35. http://www.cedtech.net/articles/11/112.pdf [viewed 27 February 2011].
Sözbilir, M., & Kutu, H. (2008). Development and current status of science education research in Turkey. Essays in Education, Special Issue, 1-22. http://www.usca.edu/essays/specialedition/MSozbilirandHulyaKutu.pdf [viewed 10 May 2011].
Sozbilir, M & Kutu H., & Yasar, M. D. (2012). Science education research in Turkey: A content analysis of selected features of papers published. In D. Jorde & J. Dillon (Eds). Science Education Research and Practice in Europe: Retrospective and Prospective (pp.341-374). Rotterdam: Sense http://www.academia.edu/427515/Book_Chapter_Sozbilir_M._Kutu_H._and_Yasar_M.D._2012_._Science_education_research_in_Turkey_A_content_analysis_of_selected_features_of_papers_published [viewed 22 September 2012].
Tajuddin, N. M., Tarmizi, R. A., Konting, M. M., & Ali, W. Z. W. (2009). Instructional efficiency of the integration of graphing calculators in teaching and learning mathematics. International Journal of Instruction, 2(2), 11-30. http://www.e-iji.net/dosyalar/iji_2009_2_2.pdf [viewed 25 June 2011].
Tatar, E., & Tatar, E. (2008). Analysis of science and mathematics education articles published in Turkey-I: keywords. İnönü University Journal of the Faculty of Education, 9(16), 89-103.
Ulutaş, F., & Ubuz, B. (2008). Research and trends in mathematics education: 2000 to 2006. İlköğretim Online, 7(3), 614-626. http://ilkogretim-online.org.tr/vol7say3/v7s3m6.pdf [viewed 02 February 2012].
Yıldırım, A., & Şimşek, H. (2008). Sosyal bilimlerde nitel araştırma yöntemleri [Qualitative methods in social sciences] (7th ed.). Ankara: Seçkin Publications.

E. Tatar et. al
558 © 2014 iSER, Eurasia J. Math. Sci. & Tech. Ed., 10(6), 547-558
Appendix 1. Theses classification form
Title of These :…………
Keywords
1. Subject area of mathematic ............. 2. Subject area of mathematics Education ............. 3. Subject area of technology .............
Distribution of Theses According to Areas
1. Algebra ……….. 2. Geometry ……….. 3. Mixed ……….. 4. Other ………..
Technologies Employed In The Study :………..
Sample Methodology Employed in the Study
Sample types: Sample size: Pre-school Primary school (1-5) Primary school (6-8) Secondary school (9-12) Undergraduate Teacher
( ) ( ) ( ) ( ) ( ) ( )
1-10 ( ) 1. Quantitative research 2. Qualitative research 3. Mixed methods research
( ) ( ) ( )
11-30 ( )
31-60 ( )
61-100 ( )
101-500 ( )
>500 ( )
Data Collection Tools
1. Questionnaire Open-ended ( ) Likert-type ( ) Other ( ) 2. Achievement test Open-ended ( ) Multiple-choice ( ) 3. perception-interest-ability-attitude test ( ) 4. Interview Structured ( ) Quasi-structured ( ) Unstructured ( ) 5. Observation 6. Alternative instruments Focus group discussion ( ) Clinical interview ( ) Worksheet ( ) Researcher and student diary ( )
VERİ ANALİZİ Nicel Veri Analizi Nitel Veri Analizi 1. Descriptive 2. Inferential 1. Qualitative
Frequency / percentage tables ( ) t-test ( ) Content analysis ( ) Mean / SD tables ( ) Correlations ( ) Descriptive analysis ( ) Graphs ( ) Anova/Ancova ( ) Manova/Mancova ( ) Factor Analysis ( ) Regression ( ) Non-Parametric Tests ( ) Other ( )
Results Obtained from Experimental Studies Achievement Attention Retention
Experimental group ……… ……… ………
Control group ……… ……… ………
No significant difference ……… ……… ………