Embed Size (px)
Citation preview
Trends in Crime: Does Perception Match Reality?
SEPTEMBER 16, 2015

Trends in Crime: Does Perception Match Reality? Page 1
The following report was produced by Dr. Max Felker-Kantor in partnership with The Polis Center at IUPUI for the SAVI Community Information System. Access this report digitally at www.savi.org
Table of Contents Does perception match reality? ..................................................................................................................... 2 The story is not the same for everyone ......................................................................................................... 2 About the analysis ......................................................................................................................................... 3 A nuanced story ............................................................................................................................................ 3 IMPD crime rate is higher than the state’s and nation’s ............................................................................... 4 Type of crime matters ................................................................................................................................... 4 Geography Matters ........................................................................................................................................ 7 Using geography to focus crime reduction initiatives................................................................................... 9 Exploring patterns of improvement and decline ......................................................................................... 10 Understanding the social and economic context ......................................................................................... 12 There is no single solution for reducing crime ........................................................................................... 15 Bibliography ............................................................................................................................................... 16 Appendix A ................................................................................................................................................. 18 Appendix B ................................................................................................................................................. 19
Suggested Citation: Felker-Kantor, MA, Colbert JT, and Kandris, SK. (2015, September). Trends in
Crime: Does Perception Match Reality? Available from the SAVI Community Information System at: www.savi.org

Trends in Crime: Does Perception Match Reality? Page 2
Does perception match reality? Many factors contribute to our perceptions of crime. News stories, types of crime committed, location of crime—these elements and others help to shape the way we perceive the safety of our communities.
Frustrated with a summer of violence.
Crime is destroying communities.
Surge of violence in Indianapolis.
Vandalism on the rise.
Stop the gun violence.
Often local crime headlines tell a story of an increasingly violent Indianapolis, but does perception match reality?
The story is not the same for everyone Crime and public safety are important social and political issues faced by cities and communities across the country. Contrary to public perception, over the past two decades crime rates across the United States have decreased dramatically (Wolfers, 2014; McCarthy, 2015; Lopez, 2015). In 1994 the national Part I crime rate (the combination of property and violent crime) was 53 crimes per 1,000 people. In 2013, the rate was 31 crimes per 1,000 people, a decline of 41.5 percent. Yet, the story has not been the same across the country. When examining trends in crime at different geographic areas, such as counties, cities, or neighborhood the story becomes more complicated.
Studying crime trends in the Indianapolis Metropolitan Police Department (IMPD) jurisdiction reveals a more nuanced story. Overall, the crime rate is at the lowest level since 2007. Property crime and simple assaults, in particular, dropped significantly. Over the same period, however, violent crime has increased, especially since 2011.
Yet the possibility of becoming victim of crime is not the same for everyone. Examining the geographic distribution of crime shows wide variation from place to place. Part I crime rates range from a low of 2.6 per 1,000 residents in the Cumberland neighborhood on the eastern edge of the city to a high (excluding Lafayette Square) of 202 in Downtown Indianapolis.
Changing Boundaries
On January 1, 2007, the City Council consolidated the Indianapolis Police Department and Marion County Sheriff’s Department into the Indianapolis Metropolitan Police Department (City-County Council, 2007). The change, conceived to reduce expenditures, meant that the IMPD would be responsible for policing a larger geographic area.

Trends in Crime: Does Perception Match Reality? Page 3
About the analysis In this report, we explore the trends in crime rates in the 94 neighborhoods and 201 census tracts within the IMPD service area from 2007 to 2014.
All crime rates have been calculated based on 2010 population data and represent the number of crimes per 1,000 people. As a result, some of the crime rate figures may differ from other published sources. Data is drawn from the Indianapolis Metropolitan Police Department, which does not serve the Airport, Speedway, Beach Grove, and Lawrence areas. The Park 100 neighborhood was removed for statistical and mapping purposes.
A nuanced story Crime rates do not follow an upward trend of progress over time but fluctuate dramatically in relation to changes in social, economic, and political conditions. From historically low levels in the 1960s, for example, crime rates rose across the United States during the 1970s and 1980s, reaching their height in the early 1990s, and receding nearly to 1960s levels today.
Indianapolis has shown similar fluctuations. The number of Part I Crimes (the combination of all property and violent crimes) reported for the IMPD area in 2014 was at the lowest level since 2007. The rate of 63 crimes per 1,000 people in 2014 was nearly 12 percent lower than in 2007 (71.3). Yet, Indianapolis lags behind other cities where crime rates are lower, such as Louisville, Chicago, New York, and Los Angeles.
COMPARING OTHER CITIES (2013)
Part I Violent Crime Rate
Property Crime Rate
St. Louis, MO 82.1 15.9 66.2
Cincinnati, OH 67.6 9.5 58.1
Indianapolis, IN 66.7 12.6 54.2
Kansas City, MO 65.6 12.6 53
Chicago, IL 51.2 9.7 41.5
Louisville, KY 48.3 5.4 42.9
Los Angeles, CA 26.4 4.3 22.1
New York, NY 23.1 6.2 16.9 Note: Chicago data is from 2012 and does not include Rape or Attempted Rape. All data are from FBI UCR reports.

Trends in Crime: Does Perception Match Reality? Page 4
IMPD crime rate is higher than the state’s and nation’s IMPD area crime rates are also significantly higher than rates for Indiana and the United States. In 2013, for example, the IMPD’s Part I crime rate of 66.7 was 108 percent higher than Indiana’s rate of 32 and 115 percent higher than the national rate of 31. Our results show that two-thirds of neighborhoods in the IMPD jurisdiction (63 of 94 analyzed) have Part I crime rates above the 2013 average for the United States. More surprising, 40 percent of IMPD neighborhoods (39 of 94) had Part I crime rates higher than the 1994 U.S. average (53 per 1,000).
Type of crime matters When broken down by category, however, the story changes once again. As the charts on the next page show, property crime has decreased by 16 percent between 2007 and 2014. And simple assaults declined by 27 percent. Violent crime, however, has shown a different trajectory. The rate for 2014 was 8 percent higher than in 2007. When viewed proportionally, the upward trend in violent crime is even more apparent. Violent crime has increased from 13 percent of all crimes in 2007 to 16.6 percent in 2014.
Reporting Crime
The FBI collects data on Part I Crimes in order to provide a measure of the scope and level of crime. The Indianapolis Metropolitan Police Department reports Part I Crimes on a yearly basis. The seven categories of crimes that are included in the Crime Index are:
Property
Burglary (Residential and Business) Larceny
Vehicle Theft
Violent
Aggravated Assault Robbery
Rape and Attempted Rape
Homicide
In this analysis, we also include Simple Assaults that do not result in serious injury and are considered Part II crimes by the FBI. The Appendix provides detailed definitions of each type of crime.

Trends in Crime: Does Perception Match Reality? Page 5
Crime Rates by Type of Crime
Type IMPD Area 2007 Crime
Rate per 1,000
IMPD Area 2014 Crime
Rate per 1,000
One Year Change in Rate
from 2013 to 2014
Seven Year Change in Rate
from 2007 to 2014
All Crime (Part I and Simple Assaults) 90.6 77 -8.9% -14.9%
Part I Crime (Violent and Property) 71.3 63 -5.7% -11.7%
Violent 11.8 12.8 +1.75% +8.34% Property 59.5 50.2 -7.4% -15.7% Simple Assaults 19.3 14.1 -21.0% -27.0%
VIOLENT
Aggravated Assaults 6.2 7.5 +4.75% +19.6% Robberies 4.8 4.6 -0.3% -5.8% Homicides 0.14 0.17 +10.4% +19% Rapes and Attempted Rapes 0.6 0.62 -16.1% +3.02%
PROPERTY
Larcenies 34.2 29.5 -8.0% -14.0%
Residential Burglaries 13.4 12.8 -6.0% -4.3%
Business Burglaries 2.7 1.7 -32.2% -38.0%
Vehicle Thefts 9.1 6.2 +2.9% -32.1%
90.6 88.0 87.3 85.5 86.5 88.684.6
77.0
59.5 58.4 56.8 55.4 57.2 57.4 54.250.2
19.3 17.8 18.9 18.5 18.3 19.3 17.814.1
11.8 11.7 11.7 11.6 11.0 11.9 12.6 12.80
10
20
30
40
50
60
70
80
90
100
2007 2008 2009 2010 2011 2012 2013 2014
Cri
mes
per
1,0
00
Res
iden
ts
Year
IMPD Area Crime Rates by Type, 2007-2014
All Crime
Property
Simple Assaults
Violent

Trends in Crime: Does Perception Match Reality? Page 6
Crime rates also differ when property and violent crimes are disaggregated. Within the categories of violent crime, for example, robberies declined while aggravated assault, rape, and homicide all showed increases. While homicides often attract the most attention from the media and public officials, they represent only a small percentage of all violent crimes. More telling is the rate of aggravated assaults. Between 2007 and 2014, aggravated assaults increased from 6.2 to 7.5. This 8 percent growth reveals a more troubling trend in the growth of violent crime.
In contrast, the trends in property crime rates show significant decreases across all categories for the same period except for a slight increase in vehicle thefts in the past year.
6.2 6.2 6.46.9
6.47.1 7.1
7.5
4.8 4.8 4.74.0 4.1 4.1
4.6 4.6
0.60 0.57 0.50 0.55 0.50 0.54 0.73 0.620.14 0.13 0.12 0.11 0.12 0.12 0.15 0.17
0
1
2
3
4
5
6
7
8
2007 2008 2009 2010 2011 2012 2013 2014
Cri
mes
per
1,0
00
Res
iden
ts
Year
IMPD Area Violent Crime Rates by Type, 2007-2014
AggravatedAssaults
Robberies
Rapes andAttemptedRapesHomicides
34.2 33.5 33.2 33.2 32.7 34.032.0
29.5
13.4 14.7 15.6 14.5 15.7 15.4 13.6 12.89.1 7.8
5.3 5.4 6.3 5.5 6.0 6.2
2.7 2.5 2.6 2.3 2.4 2.4 2.5 1.70
5
10
15
20
25
30
35
40
2007 2008 2009 2010 2011 2012 2013 2014
Cri
mes
per
1,0
00
Res
iden
ts
Year
IMPD Area Property Crime Rates by Type, 2007-2014
Larcenies
ResidentialBurglariesVehicle Thefts
BusinessBurglaries

Trends in Crime: Does Perception Match Reality? Page 7
Geography Matters Geography matters when examining crime and public safety. Incidents of crime do not occur evenly across the IMPD area. High crime neighborhoods (the top 25) have a Part I crime rate of 116, which is nearly 10 times higher than the rate for the 25 lowest crime neighborhoods (16.8). High and low crime neighborhoods can be in close proximity (such as Wynnedale/Spring Hill and the Near NW/Riverside), even sharing a border in some cases (Clearwater and North Central).
The crime rate of the top 25 high crime neighborhoods in Indianapolis is nearly 10 times higher than that of the 25 lowest crime neighborhoods.

Trends in Crime: Does Perception Match Reality? Page 8
Visualizing the geography of crime shows how the distribution of types of crime varies. In particular, property crime is more widely distributed than violent crime. As shown in the first map below, violent crime rates are generally higher in the central city. Areas with malls, such as Lafayette Square and Keystone at the Crossing tend to have higher property crime rates, as shown in the second map.
By visualizing crime at smaller geographic area, such as census tracts, the variation becomes even more apparent. See Appendix B for additional maps.

Trends in Crime: Does Perception Match Reality? Page 9
Using geography to focus crime reduction initiatives In October 2014, the Indianapolis Department of Public Safety identified six focus areas in which they hoped to reduce crime and improve quality of life (Department of Public Safety: DPS Focus Area: Initial Analysis). The following table compares crimes rates of each of the six focus areas to the crime rate of the rest of the IMPD jurisdiction (final column in table). The highest and lowest rates for each type of crime are highlighted. The data show:
For six of the nine types of crime, the rate is higher in all six focus areas than the rest of IMPD.
The focus area around New York & Sherman has the highest crime rate for five of the nine crime types, and is second or third for three others.
The focus around East 42nd and Post Road has the lowest rate for 3 of the types of crimes.
DPS Focus Area Crime Rates (per 1,000) by Type of Crime
Area
Crime East 42nd
St. & North Post Road
38th & Sherman
New York & Sherman
34th & Illinois
16th and Tibbs
29th & MLK
Rest of IMPD
Larceny Rate 21.2 29.1 48.3 46.3 36.7 33.4 30.8
Residential Burglary Rate 28.6 20.2 31.7 24.8 22.6 25.7 12.8
Vehicle Theft Rate 8.6 11.9 14.2 12.7 9.8 10.1 6.2
Business Burglary Rate 0.2 2.8 2.4 3.9 2.2 1.9 1.8
Simple Assault Rate 19.8 33.7 42.4 36.1 25.6 20.7 13.8
Aggravated Assault Rate 12.8 20.8 23.7 22.7 19.8 20.4 7.1
Robbery Rate 10.4 12.1 14.1 14.4 12.2 12.0 4.3
Rape Rate 0.2 3.2 2.2 2.5 1.7 1.1 0.6
Homicide Rate 0.5 1.3 0.6 0.7 0.9 0.9 0.1
Population 4,049 10,035 15,178 4,318 6,325 7,926 735,807

Trends in Crime: Does Perception Match Reality? Page 10
The following chart looks at the proportion of each type of crime within the six DPS focus areas and the rest of the IMPD jurisdiction. It shows:
Violent crimes account for a larger portion of the crimes in the six focus areas than they do in the rest of the IMPD area (comprising between 23% and 28% in the focus areas compared to 15% in the rest of the IMPD area).
Violent crimes and simple assaults account for more than 50% of the crimes in the focus area at 38th and Sherman.
The largest proportion of crimes in the rest of the IMPD area is larcenies, comprising 40% of crimes in that area. Larcenies comprise only 21% to 28% of crimes in the six focus areas.
Assaults (simple and aggravated) account for between 32% and 40% of crimes in the six focus areas compared to 27% in the rest of the IMPD area.
The majority of people arrested in the six focus areas are not residents (WishTV). While troubling, it reveals a need to understand the broader geography of crime in the city and how high and low crime areas are interconnected as a metropolitan-wide issue of public safety.
Exploring patterns of improvement and decline When looking at the change in crime by neighborhood between 2007 and 2014 as show on the following maps, an interesting pattern develops:
Many of the neighborhoods where crime has increased are located in areas around I-465. The areas where crime has increased the most have been outside the central city.
Of the 94 neighborhoods analyzed, the overall crime rate increased in 15 neighborhoods and decreased in the remaining 79.
Visualizing the change in crime by category reveals the differences between changes in violent and property crime rates.
o Property crime rates increased in only 16 out of 94 neighborhoods in the IMPD area. o Violent crimes increased in 56 neighborhoods.
0%10%20%30%40%50%60%70%80%90%
100%
East 42ndStreet &
North PostRoad
38th &Sherman
New York&
Sherman
34th &Illinois
16th andTibbs
29th &MLK
Rest ofIMPD
DPS Focus Areas and IMPD: Crime Proportion by Category,
2014
Larceny
Residential Burglary
Vehicle Theft
Business Burglary
Simple Assault
Aggravated Assault
Robbery
Rape
Homicide

Trends in Crime: Does Perception Match Reality? Page 11
*Note: Homecroft, Crows Nest, and Williams Creek had no violent crimes in 2007.
Trends in Crime: Does Perception Match Reality? Page 12
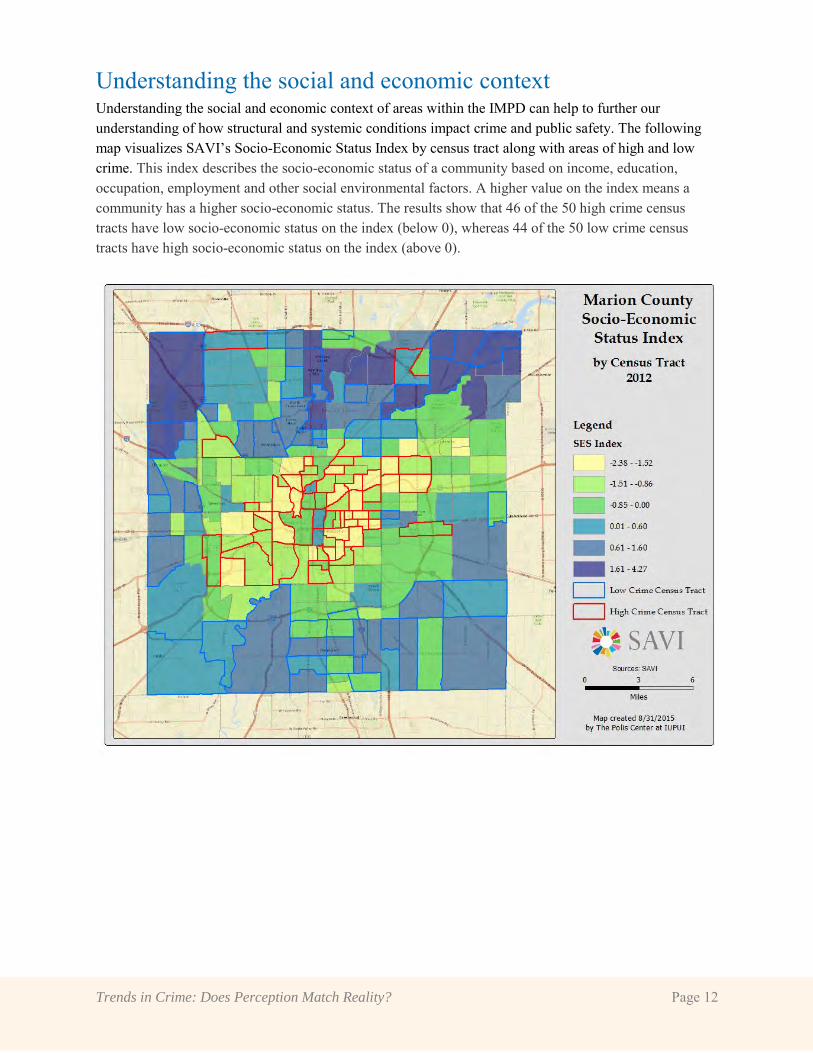
Understanding the social and economic context Understanding the social and economic context of areas within the IMPD can help to further our understanding of how structural and systemic conditions impact crime and public safety. The following map visualizes SAVI’s Socio-Economic Status Index by census tract along with areas of high and low crime. This index describes the socio-economic status of a community based on income, education, occupation, employment and other social environmental factors. A higher value on the index means a community has a higher socio-economic status. The results show that 46 of the 50 high crime census tracts have low socio-economic status on the index (below 0), whereas 44 of the 50 low crime census tracts have high socio-economic status on the index (above 0).

Trends in Crime: Does Perception Match Reality? Page 13
Examining some of the variables that contribute to the socio-economic status index shows the inequality in social and economic conditions between low and high crime areas.
Comparing social economic factors of high crime areas to low crime areas (as shown in the next chart) reveal the following about high crime areas:
The crime rate is 6 times higher than low-crime areas. The poverty rate is 4 times higher than low-crime areas. The unemployment rate is nearly 3 times higher than low-crime areas. There are 3 times as many people with no high school diploma than in low-crime areas. Bachelor degree attainment is almost half that of adults in low-crime areas. Per capita income is half that of low-crime areas.
16.5
36.9
19.1
24.727.0
16.9 17.3
7.8
22.1
13.8
18.6 18.620.9 20.7
2.8
9.56.9 8.1 8.1
39.4
32.2
0.0
5.0
10.0
15.0
20.0
25.0
30.0
35.0
40.0
45.0
Part I CrimeRate per 100
Poverty Rate UnemploymentRate
Vacant HousingRate
% Pop over 25without
High SchoolDiploma
% Pop withBachelor'sDegree or
Higher
Per CapitaIncome
(in thousands)
Comparing Census Tracts within IMPD Area, 2014
50 Census Tracts withHighest Part I Crime Rate
50 Census Tracts withMiddle Part I Crime Rate
50 Census Tracts withLowest Part I Crime Rate
Trends in Crime: Does Perception Match Reality? Page 14
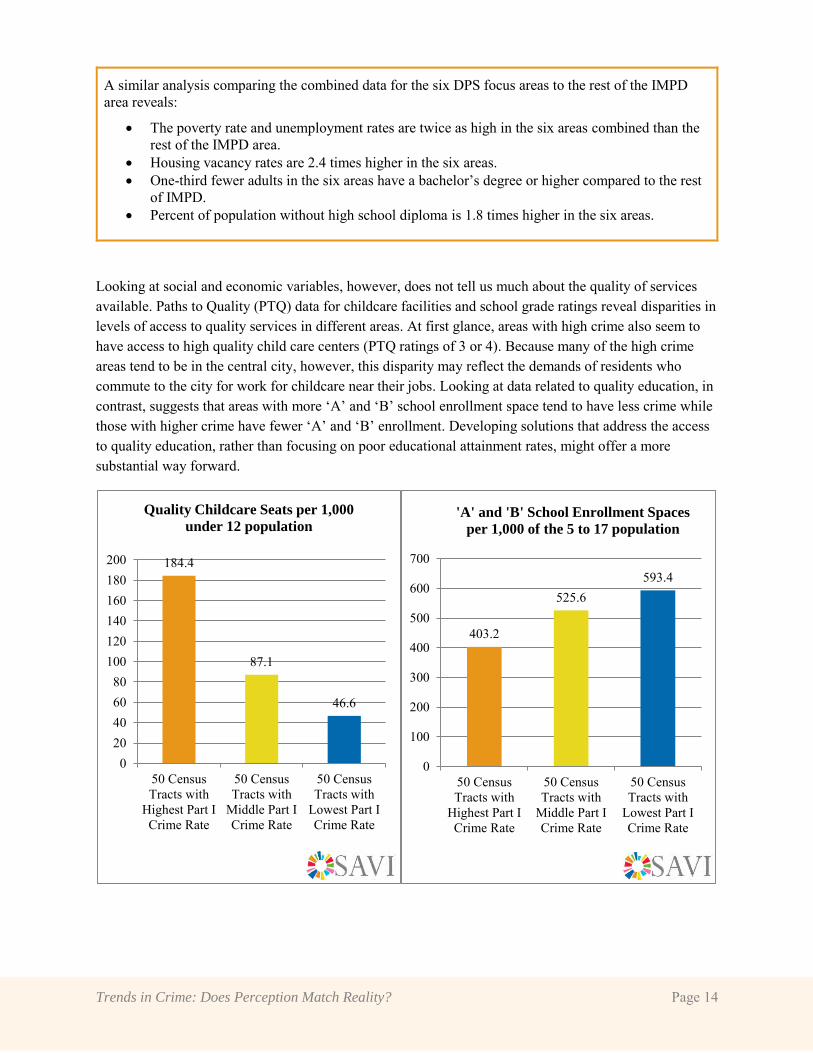
A similar analysis comparing the combined data for the six DPS focus areas to the rest of the IMPD area reveals:
The poverty rate and unemployment rates are twice as high in the six areas combined than the rest of the IMPD area.
Housing vacancy rates are 2.4 times higher in the six areas. One-third fewer adults in the six areas have a bachelor’s degree or higher compared to the rest
of IMPD. Percent of population without high school diploma is 1.8 times higher in the six areas.
Looking at social and economic variables, however, does not tell us much about the quality of services available. Paths to Quality (PTQ) data for childcare facilities and school grade ratings reveal disparities in levels of access to quality services in different areas. At first glance, areas with high crime also seem to have access to high quality child care centers (PTQ ratings of 3 or 4). Because many of the high crime areas tend to be in the central city, however, this disparity may reflect the demands of residents who commute to the city for work for childcare near their jobs. Looking at data related to quality education, in contrast, suggests that areas with more ‘A’ and ‘B’ school enrollment space tend to have less crime while those with higher crime have fewer ‘A’ and ‘B’ enrollment. Developing solutions that address the access to quality education, rather than focusing on poor educational attainment rates, might offer a more substantial way forward.
184.4
87.1
46.6
020406080
100120140160180200
50 CensusTracts with
Highest Part ICrime Rate
50 CensusTracts with
Middle Part ICrime Rate
50 CensusTracts with
Lowest Part ICrime Rate
Quality Childcare Seats per 1,000
under 12 population
403.2
525.6593.4
0
100
200
300
400
500
600
700
50 CensusTracts with
Highest Part ICrime Rate
50 CensusTracts with
Middle Part ICrime Rate
50 CensusTracts with
Lowest Part ICrime Rate
'A' and 'B' School Enrollment Spaces
per 1,000 of the 5 to 17 population

Trends in Crime: Does Perception Match Reality? Page 15
There is no single solution for reducing crime Scholars and experts disagree on the reasons for the decline in crime rates in the United States over the past two decades (Chettiar, 2015). Explanations vary widely and include, among others, changing employment levels, aging populations, expanded police forces, and the reduction of lead exposure in young children. Regardless of these explanations, it is clear that there is no single solution to reducing crime and improving public safety. Creating safe communities, therefore, not only requires smarter policing methods but also crime prevention measures, reentry programs, strong collective action from communities, and policies aimed at addressing the unequal social and economic structures underlying crime.
As the Indianapolis Department of Public Safety has emphasized, finding ways to prevent recidivism rates from the first day of incarceration is important to reducing crime (City of Indianapolis, Department of Public Safety, March 2015). Action must also be taken to prevent crime and arrest in the first place. Access to quality education and jobs is crucial (Lochner and Moretti). Solutions require programs and policies to address the barriers to high quality education, employment, housing, transportation, and healthcare across the city. As a recent report by The Indianapolis Foundation suggested, organizing resources, fostering community collaboration, and mobilizing community assets is a necessary step in reducing crime (The Indianapolis Foundation).
Visualizing crime rates by geography can help open conversations as to why certain areas experience more crime than others and can help direct services to areas that are vulnerable to crime. Efforts aimed at reducing crime must consider how types of crime vary by neighborhood. But understanding the geography of crime also reveals the need for metropolitan-wide solutions to improving public safety and inequality. Only by examining the disparities in crime across the IMPD area can we significantly improve public safety for all.

Trends in Crime: Does Perception Match Reality? Page 16
Bibliography Chettiar, Inimai M. (February 11, 2015). “The Many Causes of America’s Decline in Crime.” The
Atlantic. Retrieved from http://www.theatlantic.com/features/archive/2015/02/the-many-causes-of-americas-decline-in-crime/385364/.
City-County Council of the City of Indianapolis and Marion County, Indiana. (2005). General Ordinance No. 110. Retrieved July 22, 2015, from http://www.indy.gov/eGov/City/DPS/IMPD/About/History/Documents/GeneralOrdinance110.pdf.
City of Indianapolis. Department of Public Safety. (2014). DPS Focus Area: Initial Analysis. Retrieved July 22, 2015, from http://www.indy.gov/eGov/City/DPS/Documents/DPS%20Focus%20Areas.pdf.
City of Indianapolis. Department of Public Safety. (2015, March). Newsletter, 3 (2). Retrieved July 22, 2015, from http://www.indy.gov/eGov/City/DPS/Documents/March%202015%20DPS%20Newsletter_FINAL.pdf.
City of Indianapolis. Department of Public Safety. (2015). 2015 Focus Area Goals and Objectives. Retrieved July 22, 2015, from http://www.indy.gov/eGov/City/DPS/Documents/2015%20Focus%20Area%20Goals%20and%20Objectives.pdf.
The Indianapolis Foundation. (2015). “The Importance of Community: Investing in Effective Community-Based Crime Prevention Strategies.”
Kekoe, Troy. (April 2015). “New crime data shows challenges ahead in DPS focus areas.” WishTV. Retrieved from http://wishtv.com/2015/04/28/new-crime-data-shows-challenges-ahead-in-dps-focus-areas/.
Lochner, Lance and Enrico Moretti. (March 2004). “The Effect of Education on Crime: Evidence from Prison Inmates, Arrests, and Self-Reports.” The American Economic Review 94,1: 155–89.
Lopez, German. (2015, September 8, 2015). “Why murder rates are up in St. Louis, Balitmore, and other cities.” Vox.com. Retrieved from http://www.vox.com/2015/9/8/9273139/murder-rates-rising-sharply.
Mack, Justin L. (2015, July 14). “Indianapolis down at midyear point.” Indianapolis Star. Retrieved from http://www.indystar.com/story/news/crime/2015/07/14/indianapolis-murders-midyear-point/30145025/.
McCarthy, Justin. (2014, November 14). “Most Americans Still See Crime Up Over Last Year.” Retrieved from http://www.gallup.com/poll/179546/americans-crime-last-year.aspx.
Oppel Jr., Richard A. (May 23, 2011). “Steady Decline in Major Crime Baffles Experts.” The New York
Times. Retrieved from http://www.nytimes.com/2011/05/24/us/24crime.html.
Roeder, Oliver, Lauren-Brooke Eisen, and Julia Bowling. (2015). What Caused the Crime Decline?. Brennan Center for Justice, New York University. Retrieved from https://www.brennancenter.org/sites/default/files/publications/What_Caused_The_Crime_Decline.pdf.
Truman, Jennifer L. and Lynn Langston. (2014, September). Criminal Victimization, 2013 (U.S. Department of Justice, Bureau of Justice Statistics No. NCJ 247648). Retrieved from http://www.bjs.gov/content/pub/pdf/cv13.pdf.
Trends in Crime: Does Perception Match Reality? Page 17
U.S. Department of Justice. Federal Bureau of Investigation. Criminal Justice Information Services Division. (2014). Crime in the United States: 2013. Retrieved July 22, 2015, from https://www.fbi.gov/about-us/cjis/ucr/crime-in-the-u.s/2013/crime-in-the-u.s.-2013/tables/6tabledatadecpdf/table-6.
Wolfers, Justin. (2014, September 16). “Perceptions Haven’t Caught Up to Decline in Crime.” The New
York Times. Retrieved from http://www.nytimes.com/2014/09/17/upshot/perceptions-havent-caught-up-to-decline-in-crime.html?abt=0002&abg=0.

Trends in Crime: Does Perception Match Reality? Page 18
Appendix A Crime Definitions from the FBI The Uniform Crime Reporting (UCR) Program “collects data about Part I offenses in order to measure the level and scope of crime occurring throughout the Nation. The Program’s founders chose these offenses because they are serious crimes, they occur with regularity in all areas of the country, and they are likely to be reported to police. The Part I offenses are:”
Violent Crimes
Criminal homicide a.) Murder and nonnegligent manslaughter: the willful (nonnegligent) killing of one human being by another. Deaths caused by negligence, attempts to kill, assaults to kill, suicides, and accidental deaths are excluded. The Program classifies justifiable homicides separately and limits the definition to: (1) the killing of a felon by a law enforcement officer in the line of duty; or (2) the killing of a felon, during the commission of a felony, by a private citizen. b.) Manslaughter by negligence: the killing of another person through gross negligence. Traffic fatalities are excluded.
Forcible rape The carnal knowledge of a female forcibly and against her will. Rapes by force and attempts or assaults to rape, regardless of the age of the victim, are included. Statutory offenses (no force used victim under age of consent) are excluded.
Robbery The taking or attempted taking of anything of value from the care, custody, or control of a person or persons by force or threat of force or violence and/or by putting the victim in fear.
Aggravated assault An unlawful attack by one person upon another for the purpose of inflicting severe or aggravated bodily injury. This type of assault usually is accompanied by the use of a weapon or by means likely to produce death or great bodily harm. Simple assaults are excluded.
Property Crimes
Burglary (breaking or entering) The unlawful entry of a structure to commit a felony or a theft. Attempted forcible entry is included.
Larceny-theft (except motor vehicle theft) The unlawful taking, carrying, leading, or riding away of property from the possession or constructive possession of another. Examples are thefts of bicycles or automobile accessories, shoplifting, pocket-picking, or the stealing of any property or article that is not taken by force and violence or by fraud. Attempted larcenies are included. Embezzlement, confidence games, forgery, worthless checks, etc., are excluded.
Motor vehicle theft The theft or attempted theft of a motor vehicle. A motor vehicle is self-propelled and runs on land surface and not on rails. Motorboats, construction equipment, airplanes, and farming equipment are specifically excluded from this category.
Arson Any willful or malicious burning or attempt to burn, with or without intent to defraud, a dwelling house, public building, motor vehicle or aircraft, personal property of another, etc.
The Part II offenses, for which only arrest data are collected, are:
Other assaults (simple) Assaults and attempted assaults which are not of an aggravated nature and do not result in serious injury to the victim.
Trends in Crime: Does Perception Match Reality? Page 19
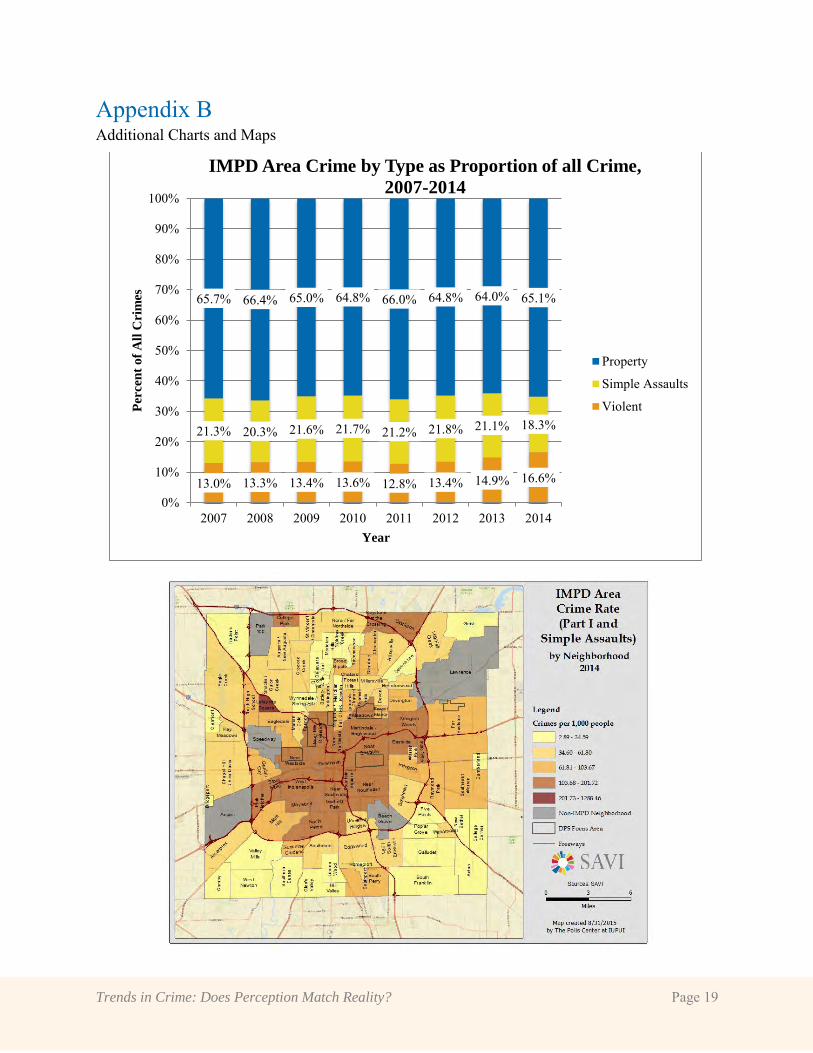
Appendix B Additional Charts and Maps
13.0% 13.3% 13.4% 13.6% 12.8% 13.4% 14.9% 16.6%
21.3% 20.3% 21.6% 21.7% 21.2% 21.8% 21.1% 18.3%
65.7% 66.4% 65.0% 64.8% 66.0% 64.8% 64.0% 65.1%
0%
10%
20%
30%
40%
50%
60%
70%
80%
90%
100%
2007 2008 2009 2010 2011 2012 2013 2014
Per
cen
t o
f A
ll C
rim
es
Year
IMPD Area Crime by Type as Proportion of all Crime,
2007-2014
Property
Simple Assaults
Violent

Trends in Crime: Does Perception Match Reality? Page 20

Trends in Crime: Does Perception Match Reality? Page 21

Trends in Crime: Does Perception Match Reality? Page 22


![Corporate crime enforcement trends [Date]](https://img.dokumen.tips/doc/110x75/61975b0c7c9a6650425bf7a4/corporate-crime-enforcement-trends-date.jpg)