Embed Size (px)
Citation preview

1
Trends in Chicago’s Schools Across Three Eras of Reform
Stuart Luppescu, Elaine M. Allensworth, Paul Moore, Marisa de la Torre, James Murphy with Sanja Jagesic September 2011

2
Table of Contents Acknowledgements ....................................................................................................................................... 4
Executive Summary ....................................................................................................................................... 5
Graduation Rates Have Improved Dramatically, Without a Decline in High School Performance ....................................................................................................................................................... 6
The Average Student Is Still Far Below College-Ready Standards ................................................... 7
Racial Gaps Increased in All Eras, Especially the Gap Between African American Students and Students of Other Races/Ethnicities .................................................................................................. 7
Even in an Age of Accountability, Publicly Reported Statistics Are Not Useful for Gauging District Progress ................................................................................................................................................ 8
Chapter 1. Introduction ................................................................................................................................ 8
Three Eras of School Reform ......................................................................................................................... 9
Chapter 2. Problems with Using Publicly Reported Statistics to Discern Trends over Time ...................... 11
Issue 1: Changes in Tests, Standards, Scoring, and Test Administration Make Scores Non-Comparable ...................................................................................................................................................... 11
Issue 2: Percent meeting standards is an imprecise metric ........................................................... 16
Issue 3: The Promotion Policy Concentrated Low-Scoring Students in Certain Grades and Kept Them in Test Score Reports for More Years .............................................................................. 17
Issue 4: Policy Changes First Decreased then Increased the Proportion of CPS Students Included in Publicly Reported Test Scores ........................................................................................... 19
Issue 5: A Changing Demographic Profile of CPS Students .............................................................. 22
Chapter 3. Test Score Trends in the Elementary/Middle Grades ............................................................... 24
Reading Scores in Grades Three through Eight Have Improved Little ....................................... 24
Math Scores in Grades Three through Eight Improved in All Three Eras .................................. 26
A Decline in Scores with ISAT Implementation ................................................................................... 28
Putting Gains over Time in Perspective: Math scores have improved from barely meeting standards to the mid-low range of meeting standards ....................................................................................... 31
Racial Gaps Increased on Elementary Schools Tests .......................................................................... 33
Which Types of Schools Improved? .................................................................................................... 35
Chapter 4. High School Test Score Trends .................................................................................................. 42
Increasing numbers of students are taking the ACT ........................................................................... 42
ACT scores have been rising, even with more students taking the exam .......................................... 43
ACT Scores during Era 3 Grew Most in Selective Enrollment and Racially Integrated Schools .......... 47
Chapter 5. Graduation and Dropout Trends ............................................................................................... 51
Age cohorts provide a more accurate assessment of graduation and dropout trends ...................... 54

3
Chapter 6. High School Course Taking Patterns ......................................................................................... 59
Chapter 7. Changes in School Climate and Organizational Supports ......................................................... 68
School Leadership .......................................................................................................................................... 68
Professional Capacity ................................................................................................................................... 71
Parent/Community Ties .............................................................................................................................. 73
Student Centered Learning Climate ........................................................................................................ 73
Instruction ........................................................................................................................................................ 76
Conclusions and Areas for Further Study ................................................................................................... 78
Appendix A. Reform Timeline ..................................................................................................................... 81
Appendix B: Rescaling the ITBS to the ISAT ................................................................................................ 82
Appendix C: Survey Administration and Rasch Scaling ............................................................................... 87
Appendix D: Calculating Graduation and Dropout Rates ........................................................................... 88
Appendix F: Statistical Modeling of Outcomes ......................................................................................... 100
Statistical Models .............................................................................................................................. 100
Covariates included in the models .................................................................................................... 101
Works Cited ............................................................................................................................................... 106
Endnotes ................................................................................................................................................... 109

4
Acknowledgements This report was the result of a group effort by many people, and we greatly appreciate the support and feedback we received from our colleagues at the Consortium on Chicago School Research (CCSR) at the University of Chicago and the CCSR Steering Committee. Special thanks to Holly Hart for researching and constructing the Reform Timeline and working on the early stages of this study. Several CCSR directors provided feedback on early drafts of this report, including Penny Sebring, Paul Goren, David Stevens, Jenny Nagaoka, Melissa Roderick, and Sue Sporte. We are also very grateful for the considerable help of CCSR Associate Director for Communications, Emily Krone, who provided tireless editing and substantive feedback. We are also very grateful for the support of our Steering Committee and the members who took the time to read drafts of this report and to provide us with valuable feedback. We particularly thank Kim Zalent, Arie van der Ploeg, Kathleen St. Louis, Steve Zemelman, Matt Stagner, Josie Yanguas, and Greg Michie.
We would also like to thank the Illinois State Board of Education for providing test data and Chicago Public Schools (CPS) for their continued cooperation and support in providing us with data.
Most importantly, we want to acknowledge the Chicago Community Trust for taking the initiative to commission this study and providing the funding to carry it out.

5
Executive Summary In 1988, U.S. Secretary of Education William Bennett proclaimed Chicago’s public schools to be the worst in the nation. Since that time, Chicago has been at the forefront of urban school reform. Beginning with a dramatic move in 1990 to move power away from the central office, through CEO Paul Vallas’s use of standardized testing to hold schools and students accountable for teaching and learning, and into CEO Arne Duncan’s bold plan to create 100 new schools in five years, Chicago has attempted to boost academic achievement through a succession of innovative policies. Each wave of reform has brought new practices, programs, and policies that have interacted with the initiatives of the preceding wave. And with each successive wave of reform this fundamental question has been raised: Has progress been made at Chicago Public Schools (CPS)?
This report attempts to address the question by analyzing trends in elementary and high school test scores and graduation rates over the past 20 years. Key findings include:
• Graduation rates have improved dramatically, and high school test scores have risen; more students are graduating without a decline in average academic performance.
• Math scores have improved incrementally in the elementary/middle grades, while elementary/middle grade reading scores remained fairly flat for two decades.
• Racial gaps in achievement have steadily increased, with white students making slightly more progress than Latino students, and African American students falling behind all other groups.
• Despite progress, the vast majority of CPS students have academic achievement levels that are far below where they need to be to graduate ready for college.
Many of the findings in this report contradict trends that appear in publicly reported data. For instance, publicly reported statistics indicate that CPS has made tremendous progress in elementary math and reading tests, while this analysis demonstrates only incremental gains in math and almost no growth in reading. The discrepancies are due to myriad issues with publicly reported data—including changes in test content and scoring—that make year-over-year comparisons nearly impossible without complex statistical analyses, such as those undertaken for this report. This leads to another key message in this report:
• The publicly reported statistics used to hold schools and districts accountable for making academic progress are not accurate measures of progress.
For this study, we addressed the problems in the public statistics by carefully constructing measures and methods to make valid year-over-year comparisons. This allowed us to create an accurate account of the progress made by CPS since the early 1990s. The Consortium on Chicago School Research (CCSR) at the University of Chicago has a long history of tracking trends in Chicago’s schools. Through 20 years of studying the district, we have developed methods for using student data to create indicators that are comparable over time, adjusting for changes in tests, policies, and conditions that make the publicly reported statistics unsuitable for gauging trends in student performance.

6
We divide the last 20 years into three eras of reform, defined by district leadership and the central reform policies that those leaders pursued. Era 1 is the time of decentralized control of schools, when decisions over budget and staffing were transferred from the central office to locally elected school boards. Era 2 is defined by the beginning of mayoral control over the schools, the tenure of Paul Vallas as CEO, and the beginning of strong accountability measures for students and schools. Era 3 is defined by Arne Duncan’s tenure as CEO, the emphasis on diversification through the creation of new schools, and a greater use of data and research in practice. While these three eras are defined by very different key policies, each era of reform builds on the reforms of the previous era.
This report shows areas of substantial progress, as well as areas of concern, and counters a number of misconceptions that exist about the state of the schools. What it does not do is draw conclusions about the effects of particular school policies on the progress of students. Changes in student achievement over the last 20 years are a result of the totality of policies, programs, and demographic changes that have occurred in the schools. The policies of each new school administration have interacted with the policies of the preceding administration. Improvements in student outcomes in any given year are a result of changes in policy, practice, and the environment around the school in that year, and in preceding years. A number of individual policies have been studied over the last 20 years, and where evidence exists that a policy had a specific effect on student outcomes, we report it. However, it is beyond the scope of this study to definitively analyze the combined effects of myriad policies.
Graduation Rates Have Improved Dramatically, Without a Decline in High School Performance
Chicago schools have shown remarkable progress over the last 20 years in high school graduation rates. In the early 1990s, students who entered Chicago high schools were about as likely to drop out as to graduate. Now they are more than twice as likely to graduate as to drop out. Graduation rates have improved among students of all racial/ethnic groups and among both boys and girls. Improvements in graduation rates began to occur in Era 1, slowed down in Era 2, and then accelerated considerably in Era 3.
At the same time, high school students have improved their performance on the tests administered to all high school juniors in Illinois, with ACT scores rising by about a point over the last decade. All students who graduate now do so with courses required for admission to college, while many students used to take just one science credit and remedial math and English courses.
Math Scores Have Improved Incrementally in the Elementary/Middle Grades, but Reading Scores Have Remained Fairly Flat
Math scores have risen in the elementary/middle grades; students are now scoring at a level similar to students who were one year older in the early 1990s, at least in some grade levels. This could be viewed as a remarkable improvement; at the same time, the typical student has moved from just meeting state standards to a level that is still at the low end of the range of scores that meet state standards. Students at this level are extremely unlikely to reach ACT college-readiness benchmarks by the time they are juniors in high school. Due to a disconnect between the elementary school ISAT standards and the high school college-readiness standards as defined by ACT, elementary students must actually exceed standards—rather than simply meet standards—on the Illinois test in order to have a reasonable chance of meeting ACT college benchmarks in high school.

7
Reading scores in the elementary/middle grades have not shown much improvement over the three eras of school reform. There were some improvements in the lower grades during Era 2, and scores improved modestly among white and Asian students across all three eras. However, scores have not improved at all among African American students, which is the largest racial group in CPS. Reading skills in general remain at a low level.
While students’ test performance is low in Chicago, it is not lower than the test performance at other schools in Illinois that serve similar populations of students. In fact, Chicago students score better than residents of other parts of Illinois who attend schools that serve students with similar backgrounds. However, because Chicago schools serve a very economically disadvantaged student population compared to most of the rest of Illinois, their performance is much lower than the average school in Illinois.
The Average Student Is Still Far Below College-Ready Standards
Most CPS students meet state learning standards on the state tests in the elementary/middle grades. However, the eighth grade state standards are well below the ninth grade benchmarks for college readiness. Few CPS students meet these benchmarks when they enter high school, which means they have little chance of making enough progress to attain ACT scores that are expected for admission to four-year colleges. Previous CCSR research has shown that the elementary state standards are far easier to meet than the high school standards, making it appear that students are better prepared for high school than they actually are.
Racial Gaps Increased in All Eras, Especially the Gap Between African American Students and Students of Other Races/Ethnicities
College readiness among African American and Latino students is an area of particular concern. By 2009, white and Asian CPS students had average ACT scores that were close to ACT college-readiness benchmarks. They were also likely to have taken the high school courses that would be expected of applicants to selective four-year colleges. However, the elementary and high school test scores of African American and Latino students were much further behind. Furthermore, African American students’ scores improved the least over the three eras. Especially in the elementary/middle schools, test scores for African American students improved at a much slower rate than those of other students. Average scores for African American students improved slightly in math, while improving moderately among other students. There were virtually no improvements in reading scores among African American students, while white and Asian students showed some modest improvements and Latino students showed some slight improvements. Thus, African American students increasingly fell behind other students over the last 20 years, especially in Era 3.
Leadership, Professional Capacity, and Parent Involvement Have Improved, but the Quality of Instruction and Supports for Students Have Not
There have been some improvements in the organizational functioning of Chicago schools over the three eras of reform. Many of the aspects that are important for well-run schools—high quality leadership, parent involvement, the ways in which teachers work together—showed improvements during the first few years of one or more of the eras. In some cases, these improvements were sustained into the next era, although many improvements that occurred at the start of an era declined again

8
towards the end of the era. These improvements in overall school organization did not, however, translate into better overall instructional quality in classrooms. While there were some improvements in instruction and support for students throughout the eras, the improvements were not sustained. In particular, after 2005 there were substantial declines in students’ reports of their relationships with teachers and the support they received from them.
Even in an Age of Accountability, Publicly Reported Statistics Are Not Useful for Gauging District Progress Chicago has not only been at the forefront of school reform policies but also has been ahead of most of the rest of the country in collecting data and tracking student and school performance. Yet, even with a heavy emphasis on data use and accountability indicators, the publicly reported statistics that are used by CPS and other school districts to gauge progress are simply not useful for measuring trends over time. The indicators have changed frequently—due to policies at the local, state, and federal levels; changes made by test makers; and changes in the types and numbers of students included in the statistics. As there is a greater push at both the state and federal levels to use data to judge student and school progress, we must ensure that the statistics that are used are comparable over time. Otherwise, future decisions about school reform will be based on flawed statistics and a poor understanding of where progress has been made.
Chapter 1. Introduction In 1988, shortly after U.S. Secretary of Education William Bennett called Chicago’s schools the worst in the nation, the Chicago School Reform Act took the dramatic step of stripping authority from the central office and decentralizing decision making to the local level. In 1995, the state took another bold move to improve Chicago’s schools by giving authority over the schools to the mayor, Richard M. Daley. He appointed the district’s first Chief Executive Officer, Paul Vallas. Another wave of reform came in 2001, when Vallas stepped down as CEO and the mayor appointed Arne Duncan to lead the city’s schools. With each change in leadership, Chicago has undergone bold initiatives to improve the educational outcomes of the district’s largely minority, low-income student population. Each successive wave of reform has instituted new practices, programs, and policies that have built upon the initiatives of the preceding wave—all intended to address problems of low academic performance among large numbers of students and schools. Throughout these periods of intense school reform, there have been questions about the degree to which they have led to improvements in Chicago’s schools. Many statistics about Chicago schools are available to the public. However, most of these statistics are intended to provide snapshots on school performance and are not useful for understanding change over time. This has led to contradictory beliefs about the state of the schools, as well as a sense of uncertainty about what types of further reform are needed.
There is an array of confounding conditions that make it difficult to gauge the extent of progress in the schools. For example, in 2005 the state switched the test that was used to gauge reading and math proficiency among elementary school students. This change made it impossible to compare student performance to prior years. The new test had different content, scoring, and pass scores, and it was given at a different time of year than the old test. There was a large increase in the percentage of students meeting the expected standards that year, but it was unclear whether students had actually

9
demonstrated better academic skills. It is well known that this particular test change made studying trends over time problematic. Numerous other changes, which are not well known, also have affected the comparability of scores on many other occasions. These include not only other changes to the test format, testing conditions, and scoring methods, but also changes in school policies—grade promotion standards, testing policies, and eligibility around bilingual and special education services—and shifts in the types of students being served by the schools. These changing conditions have affected test scores in ways that make publicly reported data non-comparable over time. This report addresses these many factors, which influence trends in test scores, graduation rates, and other academic outcomes, to provide an assessment of the progress the district has made in student performance during the three eras of reform in CPS from 1990 to 2009. There has never been a single study that has tracked trends in Chicago for such a long period of time; this report shows the degree to which Chicago’s schools have made progress since the days that they were called the worst in the country.
Three Eras of School Reform We divide the last 20 years into three eras of reform, defined by district leadership and the central policies of reform that those leaders pursued. Era 1 begins with the passage of the Chicago School Reform Act of 1988. This act established Local School Councils, which were composed of the school principal, representatives of the faculty, parents, and community members. This act devolved authority to the local schools that had previously been held by the central office. The Local School Councils had the power to hire the principal, as well as to allocate financial resources and to make decisions about curriculum and other academic matters. We refer to this era as “Decentralization.” There were three superintendents during this era; Argie Johnson held the position at the end of the era, for two of the six years. In 1995, the state, dissatisfied with the performance of the system, gave the mayor of Chicago authority over the city schools. Mayor Richard M. Daley removed Argie Johnson; changed the governance structure of the schools; and installed his former budget director, Paul Vallas, in a newly created position: CEO. Although Vallas had almost no prior education experience, the new position focused on management rather than on educational development. He worked to improve relations with the teachers’ union, which was an urgent priority as the prior school year (1994-1995) experienced frequent school closures because of contract disagreements. The Vallas administration brought stability both in district leadership and union negotiations, as well as infrastructure improvement to the city’s schools. The new administration also did not shy away from educational reform. It enacted tough policies that were designed to improve student achievement. New graduation requirements required all students to take a college preparatory curriculum. Performance standards were enacted for both students and schools based on standardized test scores, with severe consequences for not meeting the expectations. Beginning in 1996, students in eighth grade were required to earn a minimum score on the Iowa Tests of Basic Skills (ITBS) to enroll in high school.1 In the next year, students in grades three and six also faced test-based promotional requirements. This resulted in 7,000 to 10,000 students retained in grade per year. In addition, schools with large proportions of low-scoring students were put on probation, subjected to intervention, and, in extreme cases, reconstituted, which involved firing the principal and replacing some staff. Because of the emphasis on testing and test performance, we refer to this era as “Accountability.” When Paul Vallas resigned in 2001, he was replaced by his deputy chief-of-staff, Arne Duncan. Previously, Duncan had helped run a school in Kenwood on the South Side of Chicago.

10
The Duncan administration was characterized by opening many new charter and contract schools, focusing on transforming high schools, closing poorly performing schools, instituting new instructional programs, and working to improve professional development. One of the hallmark policies of the Duncan administration was Renaissance 2010, the plan to open 100 new schools in 10 years. From 2001 to 2009, Chicago saw 155 new schools open and 82 schools close. The Duncan administration also initiated major efforts to improve the use of data at schools, developing mechanisms to provide high schools with timely data reports on students’ progress in ninth grade and college outcomes. The Duncan administration acknowledged the need to raise standards in the areas of literacy and math and pursued various strategies to increase coherency in curriculum, intensify their professional development efforts, and raise awareness about the importance of literacy and math through various initiatives. The era was marked by the creation and reorganization of central offices around curricular areas and the provision of math and literacy coaches to support their efforts. This led to work to standardize the math curriculum and an array of initiatives aimed at improving literacy instruction.2 In the latter part of Era 3, about one-third of high schools participated in an intensive curriculum effort that supplied schools with curricula in English, math, and science that was aligned to the ACT. During Era 3, the federal government initiated school-level accountability at the national level through the No Child Left Behind Act. Because this period featured so many different approaches to educational reform, including a large expansion of the number and types of schools in the system, we call the period of the Duncan administration “Diversification.” In 2009, Arne Duncan left CPS to become the U.S. Secretary of Education. Thus, we divide up this 20 year period into three eras:
• Era 1: 1988-1995 – Argie Johnson, Decentralization • Era 2: 1996-2001 – Paul Vallas, Accountability • Era 3: 2002-2009 – Arne Duncan, Diversification
Appendix A provides more details about the reforms that occurred over this span of almost 20 years. As we examine trends in student performance across this period, it is important to remember that, while each era brought new policies to Chicago’s schools, the major initiatives of the prior era continued to be present in some form in each subsequent era. Thus, each era of reform built on the reforms of the prior period. Changes in Chicago’s schools from 1988 through 2009 are a result of the accumulation of effects of all of these eras of reform.

11
Chapter 2. Problems with Using Publicly Reported Statistics to Discern Trends over Time The trends in student achievement displayed in this report frequently do not match the publicly reported statistics. This does not mean that the statistics that are reported publicly are wrong. However, they are often calculated in ways that are not comparable across the years. Decisions about how to produce indicators of student performance change frequently in response to policies at the local, state, and federal levels. Often changes are made in an attempt to produce more accurate indicators, but these changes make the indicators non-comparable to those produced in the past. In this report, we make our own calculations from student-level data, so that student achievement can be compared in a fair way over time. The report begins by showing trends in students’ performance on tests in grades three through eight. There have been numerous policies that have affected reports on students’ test scores in these grades, and this has resulted in publicly reported test scores that are simply not comparable from year-to-year. The issues around these tests, and the methods used to adjust for these issues, are described in detail in this chapter. Some of these adjustments are also used for other indicators of student achievement, as described later in the report. There are five general issues that make it difficult to create fair comparisons across time in students’ test scores:
1) Changes in tests, standards, scoring, and test administration make scores non-comparable. 2) The most commonly used metric—the percent meeting standards—is imprecise and can be
misleading. 3) The promotion policy instituted in Era 2 concentrates low-scoring students in certain grades and
keeps the lowest-scoring students’ scores in district averages for extra years. 4) The proportion of CPS students whose test scores were included in the publicly reported
statistics has changed over time with various policies. 5) The types of students entering Chicago schools have changed over time, and these demographic
changes can affect district achievement levels.
This chapter details the methods CCSR researchers used to address each of the five issues outlined above in order to make fair comparisons over time. The complexity of the methodology underscores how difficult it is to gauge improvements in schools and districts when the statistics that are reported are affected by numerous decisions of policymakers, practitioners, and the makers of assessments. This is a critical issue to address, as there are increasing calls to use data to make decisions about schools and substantial resources are being used to develop new data systems.
Issue 1: Changes in Tests, Standards, Scoring, and Test Administration Make Scores Non-Comparable Figure 1 shows the publicly reported proficiency rates on the mandatory reading tests for CPS students in grades three through eight from 1990 through 2009. It looks as if there have been very large improvements in students’ reading scores, according to the publicly reported numbers, with almost two-thirds of students meeting or exceeding standards in 2009, while less than one-quarter of students scored at or above national norms in 1990. However, there have been a number of changes in tests and test administration over this period that make these numbers non-comparable. During the period under study, the school system used two different tests for accountability purposes: the Iowa Tests of Basic Skills (ITBS) and the Illinois Standards Achievement Tests (ISAT). In addition, many changes were made in

12
test form and content, score reporting, scaling and norming, and test administration. These changes combined to make interpreting test scores over time very complicated.
Beginning in 1990, until CPS stopped giving the ITBS in 2005, the school system administered eight different test forms to students in grades one through eight each year.3 The form change in 1993 represented a substantial change in the content of the test. The material presented in the questions was thought to align more closely to modern pedagogy than previous forms. The first section of the math test, which had been devoted to testing “Math Concepts,” was divided into “Math Concepts” and “Estimation.” The second section changed from “Problem Solving” to “Problem Solving” and “Data Interpretation.” From 1993 to 2001, the school system administered one of three different forms of the test; forms K, L, or M. By 2002, there were concerns that schools and students had become too familiar with the questions on these forms, and so the central office decided to administer a new series of forms. Form A was administered in 2002 and 2004; form B was administered in 2003. In 2001, the city decided to use a new set of national-norm standards, and re-normed all old tests back to 1998 to the new standards. In 2002, there was a change in test administration procedures that allowed students to take a break in the middle of the reading test. This change in test administration procedures was accompanied by a rise in scores, especially in the third and fourth grades. Scores in grades three and four rose dramatically in 2002, with the new test administration procedures and the new norms, and stayed at about the same level in 2003 and 2004. In 2005, when the district went back to Form M, scores took a sudden precipitous drop to the levels seen in 2001. At this point, it became apparent that the source of the wild swings in test scores was a result of changes in the tests and test administration. The test publisher released adjusted scores for the K, L, and M forms, giving the test scores that would have been obtained if those tests had been administered under the same conditions as for forms A and B. The publicly reported statistics were then adjusted retroactively. Even with this

13
adjustment, the test scores for 2002 through 2004 in the lower grades appear inconsistent with scores observed in the other years. In 2006, as part of the implementation of the No Child Left Behind Act, states were required to test all students in grades three through eight. The state test, the ISAT, became the principal instrument of accountability in CPS, and use of the ITBS was discontinued. The ISAT was developed at the Illinois State Board of Education to reflect state learning standards. In addition to series of questions created specifically to address the state standards, it contained a number of questions from the SAT 9 (Stanford Achievement Test), a nationally normed standardized assessment published by Harcourt Assessment, later bought by Pearson Assessment and Information. These questions were included to enable the state to make comparisons with national norms.4 The change in tests led to a change in the types of questions being asked of students. The metric to which students were being compared also changed—from national percentile ranks to state standards. In addition, the test now measured students at an earlier point in the school year, with the test administration moved from late May to early March. One further problem with the ISAT is that the scoring does not seem to be equivalent over time—the same skill levels receive slightly higher scores in later years of test administration than in earlier years. A number of scholars have suggested that the scaling of the ISAT may not be consistent over time. For example, in 2006 a fifth grade student who answered 36 questions correctly on the math exam would be judged as meeting standards. In 2008, a student only needed to answer 35 answers correctly to meet standards. In 2009 and 2010 the number of correct answers required to meet standards further declined to 33 and 32, respectively. Officials at the Illinois State Board of Education say that this is a normal consequence of the equating process. If later tests were more difficult, then fewer correct answers would indicate the same level of achievement. But other people disagree. Robert Linn, an educational researcher at the University of Colorado, stated that such a consistent decline in the number of correct answers required to meet standards “would not be typical unless the state is intentionally trying to do that.”5 We are aware of at least one change in scoring methods that occurred in 2008 that could have produced scores that were not completely comparable to previous years’ results.6 The concerns raised by others, and knowledge of at least one documented change in scoring methods, led us to question and examine the equivalence of ISAT scores across the years. This analysis further suggested scores are higher in later years for the same underlying skill levels. We compared students’ scores on the ISAT to their scores on other exams—the ITBS and the EXPLORE exam, which is part of the ACT-developed EPAS system. We selected students who received the same score on the EXPLORE exam in ninth grade, and compared their scores two years earlier on the seventh grade ISAT, and five years earlier on the fourth grade ITBS. Figure 2 illustrates the patterns we observed with one group of students—those who scored a 15 on the EXPLORE exam in the fall of ninth grade, in 2008, 2009, or 2010. Five years previous, the average ITBS scores of these students were very similar regardless of the year they took the ITBS (2003, 2004, and 2005). However, these students’ average ISAT scores in grade seven were very different, depending on the year. The average for these students in 2006 was 247.5; in 2007 it was 251; and in 2008 it was 254. This is a considerable amount of variation in the grade seven ISAT scores despite having nearly identical ITBS scores three years earlier, and identical EXPLORE scores one year later. It seems unlikely that these groups would have, on average, exactly the same skill levels in fourth and ninth grade, but differ in seventh grade. This suggests that ISAT scores are not completely comparable over time. We did similar analyses for the other cohorts, and for reading as well as math, and found similar results.

14
The Solution: Making the same score equal the same underlying skill ITBS Equating. In order to make comparisons across years, the first step was to put all the scores on the ITBS on a single scale, where the same score represents the same skill over time and across different grade levels. Without doing this, it is impossible to tell how much students learn as they progress from grade to grade. In addition, we needed to ensure that the scores on different versions of the test were made to represent the same skill level. This makes the results from one year comparable to the results from the previous year. In CPS, nine different forms of the ITBS were used between the 1980s and 2005. Because we had access to students’ responses on individual items of the ITBS, we were able to put all test scores on a single scale from the lowest level of grade three to the top of grade eight, and ensure that the scores were equivalent across different test forms and different grade levels within the same year.7 ITBS to ISAT Comparison. Making ITBS and ISAT test results comparable was more complicated than adjusting for form and scoring effects across different versions of the ITBS. These were completely different tests, with different scales. Furthermore, students did not take both tests in the same year, which would have provided an easier way to compare scores in both tests. A prior version of the ISAT had been given in grades three, five, and eight prior to 2006; however, the new test had been revised considerably. We solved this problem by taking advantage of the many years of test scores that we had for each student in each year. As shown in Figure 2, each cohort of students took tests in each year from about age nine to about age 14, if they progressed at the expected rate. Students who were nine in 2001 took the ITBS in 2005 when they were 13; students who were nine in 2002 took the ISAT in 2006 when they were 13—making their scores at age 13 not comparable. However, both cohorts of students 1) took the ITBS when they were nine, 10, 11, and 12 years old, and 2) took the ISAT when they were 14. They also both took the EXPLORE at age 14, when they entered ninth grade. Thus, we have many years of

15
data in which the students took the same tests at the same ages. We can calculate the ISAT score that students in the 2001 cohort likely would have had if they had taken the ISAT at age 13, instead of the ITBS, by comparing them to students from the 2002 cohort who had the same scores on the ITBS at ages nine through 12, and on the ISAT and EXPLORE1
at age 14, but took the ISAT instead of the ITBS instead at age 13. By comparing students who had the same scores on the same tests prior to age 13 and after age 13, we discern which ITBS scores at age 13 are equivalent to each ISAT score at age 13.
Instead of examining only two cohorts, we used all of the overlapping information across all of the cohorts that took both ITBS and ISAT tests to determine the scores on the ISAT in March that are equivalent to the ITBS in May. Only the first two years of ISAT data were included in the rescoring of the ITBS to avoid problems with non-equivalent scoring of the ISAT over time. We then translated all of the ITBS scores into ISAT scores; ITBS results are represented using the familiar ISAT 120—400 point scale throughout this report. For details on the methods that were used for translating ITBS scores into ISAT scores, see Appendix B. The state of Illinois does not make public technical details on the ISAT, including information on changes in test forms, content or norming. We also do not have access to item-level student data (i.e., how students scored on individual test questions). Therefore, we could not make adjustments for irregularity in ISAT scoring or any changes in test forms that occurred. Without item-level data, it is not possible to separate out changes due to the scoring technique and test forms from changes in the actual student trends. In addition, we assume that the equating of the ISAT across forms and levels was done correctly, but in the absence of item-level data, we are unable to verify that. Therefore, we compare gains in CPS schools to gains made statewide over the four years in which students took the ISAT. We also present data from the NAEP exam, which was administered by the federal government to a sample of Chicago students in grades four and eight from 2003 to 2009.

16
Issue 2: Percent meeting standards is an imprecise metric The statistics that have been widely used to monitor school and district progress on tests have been simple indicators of the percentage of students who have met a benchmark score on the accountability tests:
• When the ITBS was first administered, the district reported scores as the “percent at-or-above national norms.” These scores were based on a grade equivalent unit (GE). GE units are very easy to interpret, as they show students’ scores relative to national averages at the time of the test. For example, the national average GE for a student taking the sixth grade test in May would be 6.8, equivalent to “six years and eight months of instruction.”8 If a sixth grade student scored 6.8 or above, that student was “at or above the national norm.” CPS publicly reported the percentage of students scoring at least at that level at the subject, school, school grade, and system level.
• In 2002, the school system began reporting results on the ITBS Developmental Standard Score. The scale was anchored at two points: 200–the median score for a fourth-grader, and 250–the median score for an eighth-grader. Each score point had an equivalent national percentile rank. If a student’s score was at or above the 50th percentile, that student was counted as “at or above national norms.” With the change in score reporting came a change in the norms. Previously, the ITBS scores had been determined by a norming study done in 1988. Beginning in 2002, percentile ranks were reported based on norming done in 2000.

17
• In 2006, when the ISAT replaced the ITBS, scores were reported on a scale that ranged from 120 to about 400, and spanned all grade levels. Although the ISAT included questions from the nationally normed SAT 10, the national norms were not used for public reporting. Instead, scores were reported based on the percentage of students meeting and exceeding state education goal standards. In conjunction with expert panels of educators, the state determined four performance levels: exceeds standards, meets standards, below standards, and academic warning.9 Bands of ISAT test score ranges determine the four levels.10
Dividing the entire distribution of scores into “at norms or below norms” or “meeting or below standards” produces a very imprecise metric of accomplishment and is a poor metric for gauging improvements in test scores over time. The size of year-to-year improvements depends entirely on whether there are many students with scores that are near the cut-off for meeting norms/standards. Small improvements in test scores can result in many more students meeting norms/standards if there are many students close to the cut-off score, while large overall improvements in test scores can go unnoticed if there are few students with scores close to the cut-off. There were widespread misconceptions around progress in the schools in Era 2 precisely because of this issue. It was generally believed that the district did a better job at getting low-achieving students to improve than it did at improving the scores of high-achieving students. There were statements that the district had become good at teaching basic skills, but not high-level skills. In fact, there was fairly equal growth among both low- and high-achieving students during the time period—the district was not better at educating low-skill than high-skill students. This misconception occurred because there were large numbers of students with scores near the 25th percentile, and very few with scores near the 75th percentile; the same level of improvement resulted in many more students moving from the bottom to the second quartile, but few moving from the third to the top quartile. The focus on the percentage of students in each quartile, rather than the average score, led to a misinterpretation of district progress. Moreover, the range of scores within the “meets” category is quite large, and so does not have any singular meaning in terms of subsequent outcomes, despite implying proficiency. An eighth grade student who scores 246 on the ISAT math test is deemed to have met standards, while a student with 245 has not, although the scores are statistically indistinguishable. For grade three reading, the “meets standards” category extends from 191 to 227 points on the ISAT scale, which corresponds to a student at about the 50th percentile through the 90th percentile. Students at the low end of the “meets standards” range have nearly no chance of meeting benchmark scores on the ACT three years subsequently, even though they are labeled “proficient.”11 The Solution: We report all test statistics as average scores, rather than percentages at or above norms, or meeting or exceeding standards.
Issue 3: The Promotion Policy Concentrated Low-Scoring Students in Certain Grades and Kept Them in Test Score Reports for More Years As Era 1 progressed, fewer and fewer students were held back in grade. About 90 percent of students were promoted to the next grade even if they showed low levels of achievement. This was widely referred to as “social promotion.” The retention rate for third-graders in 1993 was about 11 percent. This policy changed with the Vallas administration in Era 2. Beginning in 1996, and then expanding in 1997, strict policies regarding promotion of students in grades three, six, and eight were put in place.

18
Students had to meet minimum test scores to be promoted to grades four, seven, and nine. In 1998, more than 20 percent of third-graders were retained. High rates of grade retention led many more students to be old for their grade level, and all of these students retained under the policy had very low test scores, both their first and second years in the grade. Thus, in the first year after the third grade standard was put in place (1998), many more third-graders were old for their grade level (10 years old instead of nine years old), as many of the low-scoring students from the prior year remained in third grade. Figure 4 shows the percentages of students in grades three and four who were old for grade, and how those percentages changed over time with the implementation of district policies. In 1998, the year after the stricter promotion criteria were instituted, the proportion of students in grade three that were old for grade nearly doubled, compared to the previous year. The proportion of fourth grade students old for grade was nearly unchanged from the previous year, but in 1999, when the students who had been retained in grade three in 1997 were promoted, the number of fourth-graders who were old for their grade level shot up. Because these older students were also very low-scoring students (which is why they were old for their grade), test scores dropped at the third grade level in 1998, and then dropped at the fourth grade level in 1999. In 2000, CPS widened the range of acceptable scores, and the proportion of old-for-grade third-graders declined in 2001, and then declined in fourth grade in 2002. CPS tightened the promotion criteria in 2002, and subsequently there was an increase in old-for-grade third-graders in 2003 and old-for-grade fourth-graders in 2004.
Whether retaining low-achieving students was beneficial or harmful is the subject of other studies.12 The key issue for this study is that variations in grade progression produce instability in test score reports across the years when we examine test scores by grade level. It is difficult to judge whether CPS is doing a better job at educating students when students are grouped into grade levels according to their achieved skill levels as well as their ages. It makes the scores in any given grade non-comparable across the years. For example, we cannot say if CPS is doing a better job of educating third-graders if there are

19
suddenly more students in their fourth or fifth year of school in third grade, compared with previous years, and all of these students were the lowest-scoring students in the prior year. Although it is conventional to treat all students in a single grade as a uniform, homogeneous group, the period of time students have been exposed to instruction may differ within the same grade, and students may be clustered in grades based on prior performance as well as their age. The solution: In order to minimize the effects of retention and variation in the number of years students have been under instruction, we present in this report aggregated data by age, instead of grade.13 For example, instead of reporting the average achievement of students in grade three, we report the average achievement of nine year olds. This tells us whether students are achieving more at each age then they were in previous years, regardless of what grade they are in.
Issue 4: Policy Changes First Decreased then Increased the Proportion of CPS Students Included in Publicly Reported Test Scores Even though the vast majority of students take the yearly achievement tests in math and English, not all students’ scores are included in the calculation of school or district statistics. Prior to 2008, students’ test scores could be excluded from the statistics on student performance based on either special education or English language learners (ELL) status. Even after 2008, some students’ test results were not included in reporting due to absence on testing day or improper record keeping. As a result of a number of policies, the percentage of students with test scores included in public statistics changes considerably across the three eras. At the lowest point, 74 percent of students’ scores were reported in public statistics. At the highest point, in 2009, about 94 percent of scores were reported. Figure 5 shows the percentages of test scores publicly reported in each year. During Eras 1 and 2, more and more students were increasingly referred to special education services, and there were increases in the number of students identified as English language learners. As a result, fewer students were included in publicly reported statistics. With the introduction of the grade promotion policy of Era 2, there was an increase in the numbers of students identified as eligible for special education services; students who had been retained two or more years because of the policy were often identified as having learning disabilities.14 In addition, there was a change in the bilingual test-exclusion policy during Era 2 that led to fewer students’ scores being included in public reporting. Prior to 1998, test scores were excluded from reporting during students’ first three years in the bilingual program. In 1999, the policy was modified to exclude scores from students who were in the bilingual program for up to four years.

20
With the implementation of the No Child Left Behind Act came the mandate to test and report all students, including students with disabilities and students who are English language learners. Beginning in 2006, this resulted in a large increase in the percentage of students whose scores were publicly reported. In addition, in 2008, the state of Illinois stopped giving English language learners a separate test—they had previously taken the Image Test—and started giving them the ISAT along with all the other students in the state. The proportion of students tested and reported increased to its highest point in 2008 and 2009 when Latino students started taking the ISAT in place of the Image test and after NCLB mandated that all students be tested and included in public reporting. These variations in test score reporting rates considerably affected the test score trends because students with identified disabilities, English language learners, and students with frequent absences also tend to have lower scores, on average, than other students. Changes in the exclusion from reporting policy disproportionately affected Latino and Asian students, as shown in Figure 6. Since most of the students receiving bilingual education services were Latino and Asian, their scores were excluded from reporting at the highest rates. Notice that in 1999, when the exclusion for students in the bilingual program was extended from three years to four years, the proportion of Asian students whose scores were included dropped to about 70 percent, while the proportion of Latino students with reported scores was close to 60 percent. African American students’ reporting rates fell slightly during this time period, due mostly to increasing numbers of African American students classified as being eligible for special education services. But compared to the changes in reporting for Latino and Asian students, the changes for African American students were quite modest.

21
The solution: To make truly fair comparisons, changes in exclusion rates need to be adjusted out. There are two potential ways to do this: 1) include only students whose scores would be included for reporting at all points in time under all conditions; or 2) include test scores for all students who are actively enrolled in the system, whether they are reported or not. The first method would result in a large proportion of students—about 25 percent — not being counted in analysis of test score trends. Any student who was ever classified as eligible for special education services, or ever in the bilingual program, would have all her scores removed from the analysis. Furthermore, this method would require us to try to apply a consistent policy for identifying students as disabled or English Language learners across the years, when no such consistent policy exists. The second method provides an unbiased method of comparing test scores across the years. Thus, for the trends reported here, we include data from all students who were actively enrolled in a given school year. While this is the fairest method for comparing scores over time, there are still problems with this method. First, students whose scores were not included for public reporting may have had less motivation to perform well on the tests; thus, their scores may be lower than those of students with similar skills who were included in public reporting. Second, their scores may not be a good representation of their skills (e.g., weaker math scores for ELLs because instructions are in English), which is why there were policies excluding their scores from the public reports in the first place. However, this issue exists across all years, even years when all scores were included in public reporting. A third, more difficult problem is that some students did not take the tests at all, and we do not have data for these students. However, most of the students who are missing data in some years do have data in other years. Therefore, in order to include them in the yearly trends, we impute data for the years that they did not take the tests, calculating their likely score based on their scores on tests in other

22
years and their background characteristics.15 The amount of this kind of imputed data is about 6 percent of the total data set.
Issue 5: A Changing Demographic Profile of CPS Students During the period under study, the student population being served by CPS changed markedly in its ethnic composition. In 1992, the school system served a student population that was close to 60 percent African American (see Figure 7). Latino students made up a little more than one-quarter of the students in grades three through eight. White students were about one-eighth of the population, and Asian students about 3 percent. By 2009, African Americans represented less than half (46 percent) of the population of students in grades three to eight, while 42 percent of students were Latino. Changes in the types of students attending CPS could affect trends in test scores, even if the quality of education stays the same, since historically there are substantial differences in achievement levels by students’ race and ethnicity.
Other than the increase in the proportion of Latino students, there have been only modest changes over time in the backgrounds of students enrolled in Chicago schools. In general, students in Chicago are much more economically disadvantaged than students in the rest of the state. In the latest year for which we have data, 85 percent of students in grades three through eight qualify for free- or reduced-cost lunch. This is in stark contrast to the rest of the state, where the average percentage of low-income students is about 41 percent. Even so, the proportion of low-income students in the system has remained fairly constant over the study period, varying between about 81 percent and 87 percent. The solution: Throughout the report, we adjust the trends in student outcomes for changes that would be expected simply because of changes in the characteristics of students in the schools. These adjustments were made through statistical models that adjust the district average in each year, for

23
differences in students’ background characteristics compared with 1992. Background characteristics for which we made adjustments and details on the statistical models are provided in Appendix F.

24
Chapter 3. Test Score Trends in the Elementary/Middle Grades Students in Chicago take mandatory exams in the spring of each year from grades three to eight in math and reading.16 Prior to 2005, students took the Iowa Tests of Basic Skills. Beginning in 1996, this test was used for district accountability policies, which put schools on probation if an insufficient percentage of students scored at national norms. The test was also used to set grade-promotion criteria for students in grades three, six, and eight. In 2006, the district switched to the ISAT as the mandatory test used for both school accountability and student promotion standards in response to the state and federal testing requirements brought about by the federal No Child Left Behind Act (NCLB). In this chapter, we show average achievement levels across both tests, using the adjustments and equating procedures described in Chapter 2 and in the technical appendices. The change in tests is represented as a break in the trends that occurred in 2006.
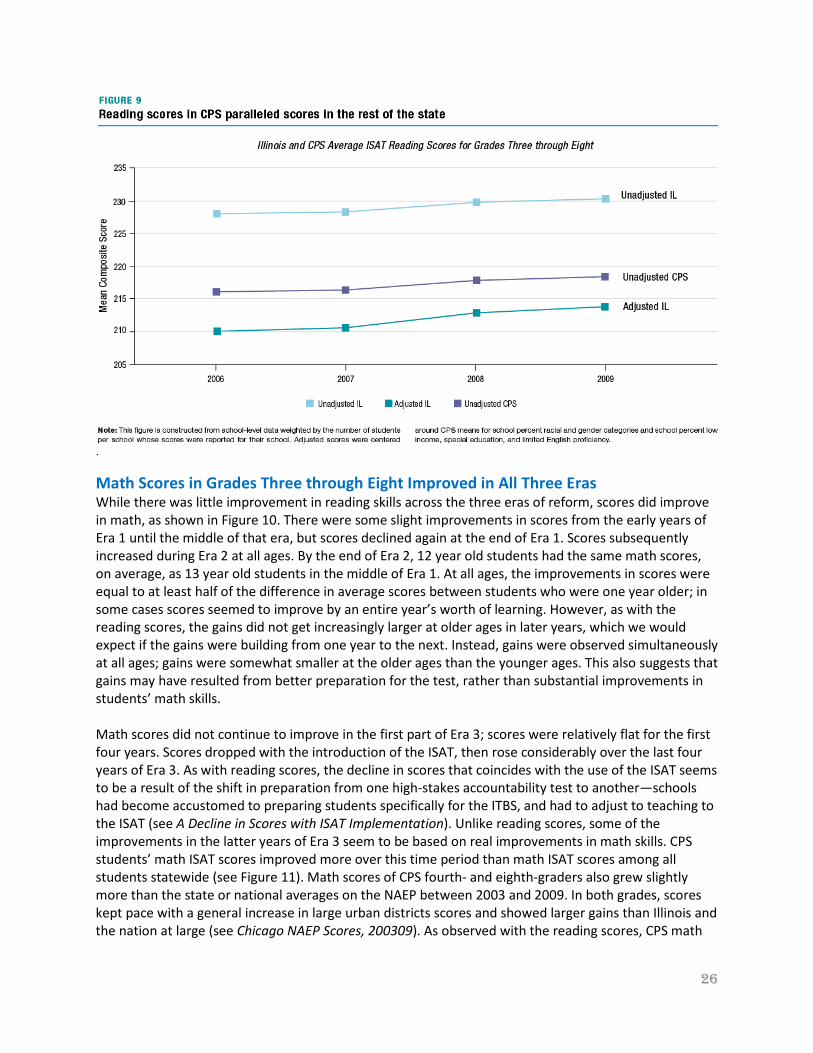
Reading Scores in Grades Three through Eight Have Improved Little Reading scores improved little over the 20-year period.17 Figure 8 shows average reading scores in each year by students’ age. Reading scores are relatively flat across Era 1, declining slightly at some ages towards the end of the era. Era 2 is the only era to show improvements on the ITBS, but the improvements only occurred among younger students. Improvements did not occur among the oldest children (at ages 13 and 14). In Era 3, there were no systematic improvements or declines in reading scores in the years in which students took the ITBS. It appears in Figure 8 that scores dropped with the switch to the ISAT. The decline in scores in 2006 seems to be an artifact of the ways in which students were prepared for the test (see Decline in Scores with ISAT Implementation). The sidebar shows that the decline in scores with the introduction of the ISAT was driven by schools with many low-achieving students—schools that were at risk of accountability sanctions based on students’ performance on the tests. These schools had strong incentives to gear instruction specifically towards the content of the high-stakes test, and the types of questions asked on the tests. When the district switched to a different test, students’ performance on the tests dropped. It also appears, from Figure 8, that reading scores improved considerably over the last four years of ISAT administration. However, as discussed in Chapter 2, there seems to be non-equivalent scoring on the ISAT that results in students receiving higher scores for the same skills in later years. To gauge the extent to which these scores represent real improvements in students’ reading skills, we compare the scores of CPS students to those of students statewide. As shown in Figure 9, the improvements in scores over the four-year period are very similar for both CPS students and the rest of the state—with students across the state showing a rise in scores in 2008, which is a year in which there was a change in scoring methods on the ISAT. CPS students did not show significantly more improvement in test scores than students across the state, which suggests the improvements in scores are due to changes in scoring rather than to changes in skills. This interpretation is further corroborated by a lack of improvement in reading scores on another exam—the NAEP—among CPS students in grades four and eight (see Chicago NAEP Scores 200309). Figure 9 also shows that reading scores in Chicago are substantially lower than the state average. However, this does not mean that Chicago does a worse job educating its students than other schools in the state. Chicago schools serve many more students from disadvantaged backgrounds than is typical in Illinois schools. In addition to showing the state average reading scores, Figure 9 also shows the Illinois

25
average adjusted for differences in the types of students who schools serve, in terms of percentage of low-income students, racial composition, and percent of students who are limited English proficient. The adjusted averages for the state provide an apples-to-apples comparison—removing the differences that we would expect to see simply because of differences in the types of students served compared to CPS. When we do this, we can see that Chicago schools show higher reading scores than other schools in Illinois that serve students with similar background characteristics. This finding is in concert with the results of a previous CCSR study18 in which we found that Chicago schools compared favorably with schools in the rest of the state, when comparing schools serving similar students.
26
.
Math Scores in Grades Three through Eight Improved in All Three Eras While there was little improvement in reading skills across the three eras of reform, scores did improve in math, as shown in Figure 10. There were some slight improvements in scores from the early years of Era 1 until the middle of that era, but scores declined again at the end of Era 1. Scores subsequently increased during Era 2 at all ages. By the end of Era 2, 12 year old students had the same math scores, on average, as 13 year old students in the middle of Era 1. At all ages, the improvements in scores were equal to at least half of the difference in average scores between students who were one year older; in some cases scores seemed to improve by an entire year’s worth of learning. However, as with the reading scores, the gains did not get increasingly larger at older ages in later years, which we would expect if the gains were building from one year to the next. Instead, gains were observed simultaneously at all ages; gains were somewhat smaller at the older ages than the younger ages. This also suggests that gains may have resulted from better preparation for the test, rather than substantial improvements in students’ math skills. Math scores did not continue to improve in the first part of Era 3; scores were relatively flat for the first four years. Scores dropped with the introduction of the ISAT, then rose considerably over the last four years of Era 3. As with reading scores, the decline in scores that coincides with the use of the ISAT seems to be a result of the shift in preparation from one high-stakes accountability test to another—schools had become accustomed to preparing students specifically for the ITBS, and had to adjust to teaching to the ISAT (see A Decline in Scores with ISAT Implementation). Unlike reading scores, some of the improvements in the latter years of Era 3 seem to be based on real improvements in math skills. CPS students’ math ISAT scores improved more over this time period than math ISAT scores among all students statewide (see Figure 11). Math scores of CPS fourth- and eighth-graders also grew slightly more than the state or national averages on the NAEP between 2003 and 2009. In both grades, scores kept pace with a general increase in large urban districts scores and showed larger gains than Illinois and the nation at large (see Chicago NAEP Scores, 200309). As observed with the reading scores, CPS math

27
scores are lower than the state average, but are higher than those at other Illinois schools serving students with similar background characteristics.

28
A Decline in Scores with ISAT Implementation There is a large drop off in average scores between 2005 and 2006 that coincides with the change in the high-stakes test that was administered to students—the switch from the ITBS to the ISAT. We were initially concerned that this drop was an artifact of the methods we used to put the two tests on the same scale. However, after examining the data thoroughly, we were convinced that this was not the case. These analyses are described in Appendix B. Instead, after further examination of the data, we were convinced that scores dipped in 2006 because schools had developed instructional techniques that were specifically targeted to the ITBS, and these techniques did not carry over to success on the ISAT. This same pattern was observed in 1990 when CPS changed to a new form of the ITBS after using the same form through most of the 1980s. This pattern was also documented when Massachusetts changed tests in 1987; in that case, the explanation also seemed to be that schools were slow to change the focus of instruction to the content domain covered by the new test.19 We come to this conclusion after finding that the decline in scores was largest among schools serving the highest percentages of students who had very low achievement—schools that would be particularly sensitive to accountability sanctions. Furthermore, the test change drop was larger among students at all achievement levels in low-achieving schools than among students with similar prior test scores in generally high-achieving schools. An example is provided in Figure 12. The two panels of Figure 12 display the test score growth of a cohort of students who were nine years old in 2003. Separate lines show the test score growth for students who started out with different levels of achievement at age nine—from those in the bottom quintile to those in the top quintile of ITBS math scores. The right panel shows the test score growth among students who were in the lowest-achieving schools in CPS in 2006, while the left panel shows growth for students with similar initial achievement as students in the low-performing schools, but who attended schools that had generally high achievement levels. In the high-performing schools, students at all levels of initial achievement made gains in their test scores between the time they were 11 years old and 12 years old, despite the change in the tests from ITBS to ISAT. These gains are consistent with gains the students were making in previous and subsequent years. The schools these students were in, regardless of their achievement levels, were doing a good job of preparing them academically for the assessments they would face. On the other hand, if we look at growth trajectories for students in low performing schools, we see a different picture. Students in low-performing schools did not show test score gains between 2005 and 2006, regardless of their level of initial achievement. It seems likely that teachers in these schools were not able to adapt their teaching to the change in the tests in the first year, perhaps because they had developed instructional techniques that were specifically geared toward the initial test. Improvements after 2006 were at least partially a result of changes in test scoring, as described in Chapter 2 (Issue 1). However, the rise in scores after 2006 is also likely a result of increasing familiarity with the test content and format. This is reflected in the improvements observed in scores in all types of schools, in Chicago and across the state.

29
Chicago NAEP Scores, 2003-2009
Since 1971, the U.S. Department of Education has periodically administered the National Assessment of Educational Progress (NAEP), often referred to as “the Nation’s Report Card.” NAEP is designed to track long-term changes in achievement in a variety of subject areas based on a nationally representative sample of students.20 Currently, NAEP is administered every two years. Originally designed to track national progress, NAEP was expanded on a trial basis in 1990 to provide state-level results. Since 2001, all states are required to participate in state-level NAEP for fourth and eighth grade reading and mathematics. Beginning in 2002, urban districts could voluntarily participate in the Trial Urban District Assessment (TUDA), providing results based on a representative sample of city students. Chicago is one of the original six participants in TUDA, which now includes 21 districts, allowing for comparison of CPS fourth and eighth grade reading and math results to students in other large urban districts. Beginning in 2003, national-, state-, and district-level assessments were administered simultaneously, allowing comparison of Chicago’s achievement levels in math and reading to those of the nation, the state, and other large cities. This provides a constant measure of math and reading achievement on an independent test over the time period when Chicago switched from the ITBS to the ISAT, and across the years in which the ISAT was used. The NAEP patterns replicate the patterns seen in the comparison of ISAT scores in CPS to the state. In reading, growth in NAEP scores among CPS students was similar to those in the state and the rest of the

30
nation (Figure 13). The NAEP scores of CPS fourth-graders grew modestly from 2003 to 2009, but at a slightly lower rate than those of other large cities, keeping pace with Illinois and the nation. Eighth grade reading scores changed little among CPS students, reflecting the same pattern seen at both the national and state levels. Thus, the NAEP scores suggest little change in reading achievement in CPS during most of Era 3, and no improvements beyond those observed nationwide.
At the same time, the math scores of CPS fourth- and eighth-graders grew slightly more than the state or national averages (see Figure 14). In both grades, scores kept pace with a general increase in large urban districts scores and showed larger gains than Illinois and the nation at large. This is similar to the pattern observed on the ISAT, where CPS students’ scores increased more from 2006 to 2009 than in the state. Thus, the NAEP provides some further evidence that math scores improved slightly more in CPS than in other places during Era 3.
The NAEP scores do not show substantial change in CPS students’ reading or math achievement from 2005 to 2007–the period during which CPS replaced the ITBS with the ISAT. While CPS test scores dropped with the switch from ITBS to ISAT in 2006 at low-performing schools, the consistency in NAEP scores suggests that the decline observed with the ISAT is likely due to testing effects rather than substantive differences in students’ reading or math achievement. While the NAEP does not have high stakes attached to the results, the ITBS and the ISAT were used to determine grade promotion for students and probation status for schools. Thus, schools likely geared instruction specifically to the ITBS, and then had to change their instructional emphasis when the ISAT became the new test. This caused the decline in scores that were observed at low-performing schools—schools that were most likely to be concerned about their probation status and to have many students at risk of being held back in grade.

31
Putting Gains over Time in Perspective: Math scores have improved from barely meeting standards to the mid-low range of meeting standards Over the 20 years of this study, the average math score for 12 year olds increased by 10 ISAT score points. By the end of Era 2, the average math score for 12 year olds was the same as the average math score for 13 year olds at the beginning of Era 1. This seems like a major improvement, of about a year’s worth of learning. But does this mean Chicago students are leaving middle school ready to engage in high school-level work? Furthermore, did scores increase across the board, or was it mainly students who were high- or low-achieving who showed improvements?
To provide nuance to the manner in which test scores increased, Figure 15 displays the overall distribution of scores for students in one age group: 14 year olds. ITBS national percentile ranks and ISAT performance levels are indicated on the chart with lines to show the extent to which students’ scores fall within the categories used to define performance on the two tests—the percent in each national quartile on the ITBS and the percent below, meeting or exceeding standards on the ISAT. The horizontal dashed lines show the national percentiles. The background shading indicates the boundaries of the ISAT performance-level categories. The long boxes present the distribution of math ITBS scores; the horizontal line in the middle of the box shows the median (50th percentile point) of the distribution. The top and bottom of the box is the 75th and 25th percentile points, respectively. The tops and bottoms of the whiskers show the 90th and 10th percentiles.

32
By following the white lines in the middle of each bar, we can see that median scores increased consistently during the period we studied; they started below the 25th national percentile point, and ended at about the 35th national percentile.21 Furthermore, the shape of the distribution did not change; the bottom of the distribution rose and the top point of the distribution rose. Scores improved as much among the higher-achieving students in CPS as they did among the lower-achieving students.
This finding contradicts common perceptions about the improvements that occurred in test scores in CPS. During the end of Era 2 and the beginning of Era 3, it was commonly believed that the district had become good at “getting students out of the bottom” but not at “getting students into the top.” There was substantial movement of students out of the bottom quartile and into the second quartile, but little movement of students into the top two quartiles. Thus, there was a perception that schools were doing a better job at educating students with basic skills, but had not improved teaching high-level skills. However, from Figure 15 we can see that students at all levels showed improvements in math scores. It was simply that there were large numbers of students who were close to the 25th percentile cut-off (because the median was close to the 25th percentile), so a small movement in average scores produced large numbers of students moving out of the bottom quartile. At the same time, there were very few students close to the 75th percentile, so an equal change in average gains among students with the highest scores in the system resulted in few students moving from the third to the top quartile.
Figure 15 also shows that the ISAT performance levels are set quite low for “meeting standards” while the performance levels for “exceeding standards” are very high. The ISAT “meets standards” point lines up with approximately the 22nd national percentile for the ITBS. To cross over into the “exceeds standards” category, a student must be in the national 77th percentile on the ITBS. In 1992, the median 12-year-old student would be just below “meeting standards,” according to the Illinois learning standards. In 2009, the median student, although scoring more than 10 points higher on the ISAT scale, is still in the bottom half of the “meets standards” category. Thus, the median score has improved from a level that does not quite meet Illinois standards to a level that is still at the low end of the “meets” range. This suggests a daunting challenge for CPS administration, which has set a goal of having all students “exceed” state standards, since few students are even close to exceeding state standards.
This also suggests that CPS must significantly accelerate progress at the elementary school level in order to meet its goal of having all juniors reach a 20 on the ACT—a score that would give CPS students a good chance of being admitted to Illinois state universities. As CCSR reported in 2008,22 eighth grade students at the very top of the “meets” category have only about a 60 percent chance of getting a 20 or above on the ACT three years subsequent. Only about one-quarter to one-third of students in the low-middle region of that category reached the 20 point mark on the ACT three years later. Thus, the typical CPS eighth-grader will need to show extraordinary learning gains in high school to have test scores expected for college when he or she graduates.

33
Racial Gaps Increased on Elementary Schools Tests Improvements in test scores were not equivalent across students from all racial/ethnic groups; African American students’ scores grew the least in all eras of reform. Average scores, broken down by students’ race/ethnicity, are displayed in Figure 16 (math) and Figure 17 (reading). To make the charts easier to read, scores from all ages have been combined into system averages.23 Improvements in math scores were similar for all but African American students. While African American students and Latino students had similar levels of math performance in 1990, Latino students improved at a faster rate, so that African American students’ scores were much lower than those of Latino students in 2009. Math scores improved among white and Asian students slightly more than among Latino students. The breakdowns by race/ethnicity suggest a very different pattern in reading scores than observed in the system-wide trends. There were modest improvements in reading scores across each of the three eras among white and Asian students, although the improvements were about half the size as those in math. Latino students’ reading scores also improved very slightly, but the improvements were much lower than in math. At the same time, there were no improvements in reading scores among African American students in CPS. Thus, they fell further behind students of all other racial/ethnic groups over the three eras of reform. The increase in the gap in reading and math scores between white and African American elementary grade students in Chicago was quite different from national trends. On the national NAEP exam, fourth grade racial gaps closed substantially over the course of the three eras in both reading and math, while eighth grade gaps were not consistently up or down.24

34

35
Do Test Scores Improvements in Era 2 Reflect Real Changes in Students’ Math and Reading Skills?
Improvements in test scores should correspond with improvements in the academic skills measured by the tests. However, it is extremely difficult to construct a test that is perfectly reliable and valid as a measure of general skills in math and reading. Students’ scores can be affected by a number of elements that are unrelated to their academic skills—such as how hard they try on the test, how familiar they are with the types of questions that are asked on the test, how comfortable they are with the way the test is administered (e.g., length of test, time pressure), and the degree to which the test emphasizes the specific skills that they know the best. Thus, changes in testing conditions can lead to changes in test scores whether or not students have shown improvements in learning.
During Era 2, when test scores grew the most, test results came to be tied to very important decisions made about students—determining promotion to the next grade, and schools—determining school probation status. The increase in stakes associated with the test could have motivated students to try harder on the tests and get higher scores. The emphasis placed on tests in Era 2 also could have encouraged teachers to spend more time on topics that were specifically covered by the test, and to spend class time becoming familiar with the test questions and format. Research on test-based accountability generally finds that teachers react to accountability programs by altering their content coverage and assessment methods so that they are aligned with the test and by spending more class time on test preparation.25 Thus, it is likely that improvements in test scores in Era 2 were not completely attributable to improvements in reading and math skills as much as learning how to score well on the tests.
Patterns in the way that test scores improved over time provide a further basis for questioning the validity of the Era 2 gains. If students were learning more at each grade level during this period, we would expect to see accelerating improvements at the older ages, as students increasingly entered each grade at higher levels of achievement. If, for example, student learning was increasing by 10 percent per year, students of all ages would show a 10 percent increase in the first year, but older students in the second year would have started out 10 percent higher and thus should have shown a 20 percent increase the second year compared to two years prior, and in the third year they should be 30 percent higher than students from three years prior. Instead, all the scores rise in parallel at approximately the same rate at each age. The pattern is what would be observed if gains occurred because of higher motivation or aligning instruction more tightly to the test. The sudden decline in scores with the switch to the ISAT that occurred at low-achieving schools further suggests that the improvements in scores in Era 2 were not completely reflective of improvements in learning. The most likely explanation is that students scored poorly because they were unused to the test form and content, compared to their familiarity with the ITBS. The same pattern has been observed in other cities and in earlier years in Chicago (see A Decline in Test Scores with ISAT Implementation).
Which Types of Schools Improved? Improvements in test scores varied considerably among schools in the district. While math test scores grew, on average, across all three eras, some schools showed no growth in each era. In fact, math scores declined considerably in some schools in Eras 1 and 3. As shown in Table 1, there was a group of schools that had declining math scores during Era 1 and during Era 3. In Era 1, the schools that showed the least improvement—those in the bottom quartile of test score growth—saw their scores drop by a half a point a year, on average. In Era 3, schools with the least growth showed declines of 1.4 points a

36
year, on average. At the same time, schools with the highest growth in math test scores in Eras 1 and 3 improved by about 1.7 points and 0.8 points a year, on average. In Era 2, almost no schools showed declining math scores. Those with the least growth remained at about the same performance level (gaining 0.1 points per year, on average), while those with the most growth improved by almost 2.5 points each year.
Reading scores improved less than math scores, on average. Thus, it is not surprising that schools with the most growth in each era grew less in reading than in math. Schools that grew the most improved their reading scores by about 0.7 points per year in Era 1, nearly 1.4 points per year in Era 2 and 0.7 points per year in Era 3. Schools whose reading scores grew the least showed declining in all three eras, even Era 2—declining by about 0.7 points per year in Era 1, 0.1 points per year in Era 2, and 0.9 points per year in Era 3.
Table 1. Schools showed considerably different rates of improvement in each era Average Yearly Test Score Growth Rates among Schools that Showed the Highest and Lowest Growth
Schools with the Least Growth in the Era (Bottom 25 percent)
Average yearly growth rate
Schools with the Most Growth in the Era (Top 25 percent)
Average yearly growth rate Math Reading Math Reading Era 1 -0.51 -0.69 1.69 0.73 Era 2 0.12 -0.11 2.49 1.36 Era 3 -1.43 -0.88 0.81 0.71 This table shows average yearly test score improvements for schools that showed the lowest and highest growth in each era. Using three-level hierarchical models, we obtained indicators of the average yearly test score growth for each school, for each era, adjusted for changes in demographics (race/ethnicity and SES). We then divided schools into quartiles based on the size of their average yearly gains in each era and calculated the average yearly growth for schools in each quartile.
Schools Most in Need of Improvement Grew Most During Era 2 Schools that started out each era with the lowest achievement levels—those in the lowest quartile at the beginning of the era–faced the most pressure to improve their scores. They needed to show higher gains than typical if they were to catch up with better-achieving schools. Figure 18 shows the extent to which the schools that started each era with the lowest scores in the district in reading were among the top or bottom schools in terms of improvement during each era. Since the schools are divided into quartiles, according to the size of their test score growth during the era, 25 percent of the schools district-wide fell into the top and bottom growth categories. In Era 1, schools that started out low-performing in reading were about as likely to be among the schools that showed the lowest growth as they were to be among schools that had the highest growth (25 percent versus 21 percent). The percentages in each category are similar to the distribution in the district (25 percent in each category), indicating that the growth in reading of low-achieving schools in Era 1 was not very different in low-performing schools compared with other schools.

37
In Era 2, about twice as many low-achieving schools grew at a fast rate than at a slow rate (30 percent compared to 15 percent). During the era of accountability, these schools were suddenly under substantial pressure to improve their test scores, and this may have spurred their growth on this metric, which was used to determine accountability sanctions. These schools also received support from external partners, including a large investment in many schools from the Annenberg foundation, and many received infrastructure support. These also could have helped improve scores. In Era 3, the pattern is reversed from what was observed in Era 2. Of the schools that started Era 3 with low reading scores, more than twice as many were among those with the lowest growth rather than the highest growth (40 percent compared with 17 percent). In Era 3, schools that showed the lowest growth actually had declining test scores. Thus, schools that began Era 3 with the weakest reading scores were more than twice as likely to have even lower scores by the end of the era than they were to improve. Some of the decline may have resulted from the shift to the ISAT exam; schools facing the most severe accountability pressures would have been more likely to tailor instruction specifically to the high-stakes test, and may have struggled to adjust their instruction for the new exam. However, this does not completely explain the decline in scores relative to other schools, as it is also observed during the years before the ISAT was administered. Some of these schools with declining performance in Era 3 may have had large numbers of students with excluded test scores before changes in testing requirements occurred with the implementation of the NCLB act. Because we include all students in our analyses—even those with excluded test scores—including their test scores does not affect our calculation of average scores. However, this policy shift may also have required these schools to shift their instructional strategies in ways that depressed overall achievement (e.g., changing the ways in which classes of bilingual and disabled students were organized or taught). Other policy changes, such as the closing and opening of many schools, may also have played a role in the decline in test scores for the lowest-performing schools. In this analysis, schools are included in the analysis during the years in which they are open, and some of these schools may have been closed for poor performance during Era 3. We see similar patterns in math. Figure 19 shows the degree to which schools that started each era with low math scores were among the least-improved and most-improved schools in each era. As with reading, low-achieving schools grew the most during Era 2 and were more likely to be in the lowest growth category in Era 3. Thus, test scores in both reading and math became more similar across schools in Era 2, and then spread apart in Era 3.

38
Schools Serving African American Students Grew the Least in All Eras Racial Categories Used in This Report Schools are divided into categories based on their racial composition according to the 1980 desegregation consent decree. Two of the categories capture schools that are close to 100 percent

39
African American or 100 percent Latino. The other two categories indicate a mixed student body composition.
Category Name Student Body Composition Number of schools serving grades three through eight
Era 1 Era 2 Era 3 Predominantly African American
At least 85 percent African American
230 237 254
Predominantly Latino At least 85 percent Latino 43 51 74
Racially Mixed Not more than 30 percent white or Asian, but neither 85 percent Latino nor 85 percent African American
107 117 120
Integrated At least 30 percent white or Asian 116 106 87
Chicago schools serve diverse populations of students, with the racial/ethnic composition varying considerably in schools across the district. In many schools, almost all students are African American, in others almost all students are Latino. In others, there are students of several different ethnicities—some serve a combination of African American and Latino students with relatively few white or Asian students (Racially Mixed schools), while others serve a substantial percentage of white or Asian students (Integrated schools). The likelihood of improvement was significantly different for schools serving different populations of students during the three eras of reform. Figure 20 shows the degree to which reading scores improved in each era by the racial/ethnic categories used by the district. In all three eras, fewer Predominantly African American schools (those that have at least 85 percent African American students) were among the schools with the highest growth in the era (the bars are all smaller than 25 percent). In Era 3, African American schools were about four times as likely to be in the bottom growth category as in the top (45 percent compared with 12 percent). Other school types (Predominantly Latino, Racially Mixed and Integrated) all were more likely to be in the high-growth group than the typical school in the district. Integrated schools, in which at least 30 percent of the students were white, were especially likely to be in the high-growth group. In fact, in Era 3, no Integrated schools were in the group of schools that showed the lowest growth, while 44 percent were in the group that improved the most. The contrast between African American schools and other schools is largest in Eras 1 and 3. Growth during Era 2 was less defined by school racial composition than in the other eras. Figure 21 shows the same chart for math. The patterns are basically the same in that the predominantly African American schools were more likely to be in the lowest growth category, and less likely to be among schools with the highest growth. This pattern is most noticeable in Era 3, and slightly less so in Era 2. As with reading scores, Integrated schools were much more likely than other schools to show large improvements in math scores in both Era 1 and Era 3.

40

41

42
Chapter 4. High School Test Score Trends There have been numerous changes in the tests taken by students in the elementary/middle grades in Chicago; however, one consistency in these tests is that they have been given in the same grade levels each year across all three eras of school reform. In contrast, tests were not consistently administered in the same grades at the high school level until the end of Era 2, when the district began administering the PSAE (ACT) to all eleventh-graders. Another test, the TAP, was administered in high schools previously. While published by the same company that publishes the ITBS, it was not given consistently to students in the same grades each year. The TAP was given to students in grades nine and 11 from 1994 to 1998. From 1999 to 2002, it was given to students in grades nine, 10, and 11. TAP was not given after 2002. From 1994 to 2000, both reading and math were tested, but only reading was tested in 2001 and 2002. These inconsistencies make it problematic to use the TAP to examine trends over time in student test performance, and necessarily limit our analysis to begin in 2001, the last year of Era 2. Thus, interpretations of high school test score trends can only reflect changes from the very end of Era 2 through Era 3.
The most reliable high school test data set is from the EPAS, published by ACT. During the last decade, these tests became the primary measurement for high school accountability in Chicago. The ACT is also used as the primary component of Illinois’ Prairie State Area Examinations, which are used for state and federal accountability purposes. The first cohort of students with ACT scores began and finished high school during Era 2, the subsequent two cohorts entered high school during Era 2 but took the ACT during Era 3, while the remaining cohorts were in high school only during Era 3.
Because the ACT is not administered until the middle of eleventh grade—normally a student’s third year of high school—students who drop out prior to eleventh grade do not have ACT scores. Hence, ACT test-takers are a self-selected group and not representative of all students who enter CPS high schools. Trends in ACT scores could be biased by changes in the rate at which students are actually making it to eleventh grade. Therefore, we begin by showing changes in the rate at which students who enter CPS high schools as ninth-graders actually reach eleventh grade and take the ACT in their third year of high school.
In addition to changes in the rate at which students make it to eleventh grade to take the ACT, high school test scores can be affected by changes in grade retention rates in the elementary grades (e.g., promotion standards that prevent students from entering high school), changes in achievement levels in elementary schools, and changes in the rates at which students leave or enter the school system between the middle and high school grades. To show the extent to which scores have improved net of the characteristics of the students entering CPS high schools, we also show ACT scores adjusted for students’ achievement levels at the start of high school and their background characteristics. The statistical adjustments remove any differences in scores that can be explained by changes in the types of students who are taking the ACT over time.
Increasing numbers of students are taking the ACT The percentage of students who enter CPS high schools and take the ACT by their third year of high school steadily increased over Era 3. Figure 22 shows the percentage of students who started as ninth-graders in each year from 1998 to 2006 who took the ACT when they were juniors three years later (in 2001 to 2009).

43
In the early part of the period, less than 60 percent of first-time freshmen went on to take the ACT on time in their junior year. The exact numbers cannot be calculated for the first two years (2001 and 2002) because the test records for some students could not be matched to administrative files due to incorrect data entry of some student ID numbers. However, in the first year with clean data (spring 2003), the ACT was taken by 58 percent of the students who started high school three years earlier (in fall 2000). By spring 2009, the ACT was taken by over two-thirds (69 percent) of the students who had entered CPS high schools three years prior—an increase of 11 percentage points. During Era 3, increasing numbers of students who enrolled in CPS high schools made it to the spring of their junior year on time to take the ACT.
ACT scores have been rising, even with more students taking the exam One might think that if more students are making it through high school to take the exam, ACT scores would go down, since those who make it to the eleventh grade are a less-select group of students. However, this is not the case. Not only are more students taking the ACT, but scores have been rising.
Figure 23 shows ACT scores over time. The purple line shows the average composite scores, while the blue line shows the scores adjusted for changes in the backgrounds of students taking the ACT (adjusted for race/ethnicity, gender, ELL status, SES, and achievement upon entering high school). The adjusted figures reveal whether scores are improving simply because different types of students are entering high school. Scores increased fairly steadily over the entire period, rising about a point from a low of 16.2 in 2001 to a high of 17.3 in 2007 and 2008. The most substantial gains occurred in 2004, with the first cohort to begin high school during Era 3.
Some of the rise in test scores occurred because of changes in the types of students who were taking the ACT over time. When ACT scores are adjusted for student backgrounds and entering achievement, they are generally lower than unadjusted scores, suggesting that some of the improvements are due to changes in who took the ACT, rather than improvements in learning while students were in high school. In particular, the large rise between 2003 and 2004 coincides with the first cohort of students retained

44
in third grade following the Era 2 implementation of the third grade promotion policy. That cohort contained fewer low-achieving students than prior cohorts.
At the same time, ACT scores improved beyond what would be expected simply from serving different types of students. While the adjusted ACT scores show lower growth than the unadjusted scores in the early years of Era 3, the two lines converge by the end of Era 3. This occurred because ACT scores increased at a much higher rate that would have been expected, given the characteristics of students entering high school during the latter years of Era 3. This can also be seen in Figure 24 which shows average EXPLORE test scores, taken in the fall of ninth grade, of cohorts of students entering CPS high schools during the last half of Era 3. The top line on the chart shows students’ ACT scores; the purple line below them shows the average EXPLORE scores for the same cohorts of students, two years prior. Although ACT scores rose during Era 3, ninth grade EXPLORE scores were flat, and the gains made between the EXPLORE and ACT steadily increased. The average gain for students who took the ACT in 2005 was 2.6 points; in 2009 it was 3.2 points. Student learning increased in high school during Era 3. This increase in test scores is heartening news. At the same time, scores remain below district goals for college and career readiness. During Era 3, the Duncan administration set a goal for students to reach a composite score of 20. This would qualify students for admission to many state-run colleges in Illinois, although it is below the college readiness benchmark score recommended by ACT of 21.26 At the current rate of increase, it would take another 17 years before the average ACT score in Chicago reached 20. Progress so far is encouraging, but there is still quite a ways to go.

45
ACT scores are broken down by students’ race/ethnicity in Figure 25. Scores for white and Asian students were considerably higher than those of Latinos and African Americans at the end of Era 2 and throughout Era 3. Their scores also grew at a slightly higher rate than scores for African American and Latino students. In fact, by the end of Era 3, white students’ scores had reached the district goal of a 20 on the ACT, on average, while Asian students’ scores surpassed it. African American and Latino students’ scores grew at a slower rate during the period, so the gap between white students and African American or Latino students grew slightly during Era 3. However, scores improved among students of all races and ethnicities during Era 3, so that African American and Latino students were scoring about a point higher, on average, at the end of Era 3 than at the end of Era 2.

46
Similarly, while ACT scores increased for students of all entering achievement levels, the largest increases were seen for students entering high school with relatively high levels of achievement. Figure 26 shows average ACT scores grouped by students’ achievement on eighth grade standardized tests. We show average ACT scores for each group in 2001, 2003, and 2009—the last years of Era 2, the mixed Eras 2 and 3 period, and Era 3. For students at the lowest level of entering achievement, average ACT scores increased from 12.2 in 2001 to 13.1 in 2009, an increase of almost 1 point. Scores rose by a similar amount for students with average entering achievement, increasing from 15.8 to 16.6 between 2001 and 2009. However, for students with the highest levels of entering achievement, scores increased by 2 points, from 22.3 to 24.3 between 2001 and 2009. In other words, while ACT scores rose across the board, increases were largest among students entering high school with high ability—those who were already most likely to meet college readiness standards.

47
ACT Scores during Era 3 Grew Most in Selective Enrollment and Racially Integrated Schools ACT scores grow more at selective enrollment schools over the course of the era than neighborhood schools, charters, and vocational education schools. Figure 27 shows the average yearly growth in ACT by school type during Era 3. The numbers to the right of each bar show the average score in the typical school of the given type during the school’s first year in Era 3. As Figure 27 shows, selective enrollment high schools exhibited the highest average yearly growth during the era, 0.18 points per year; if extrapolated over the six years of Era 3 that would be a gain of more than 1 point during the era. Selective enrollment schools also began Era 3 with by far the highest average ACT scores: these schools began the era with average scores of 21.8, almost 5 points higher than charters, the school type with the next highest average ACT score at the beginning of the era. Thus, selective enrollment schools began with the highest ACT scores and experienced more growth in scores than other types of schools. These results are consistent with the finding that students ACT scores increased more for students who entered high school with high levels of achievement than students with below average levels of entering achievement. It further supports the idea that while all types of students and schools saw increased ACT scores during Era 3, these gains were not equitably distributed, favoring students and schools that were already high achieving and meeting college readiness standards.
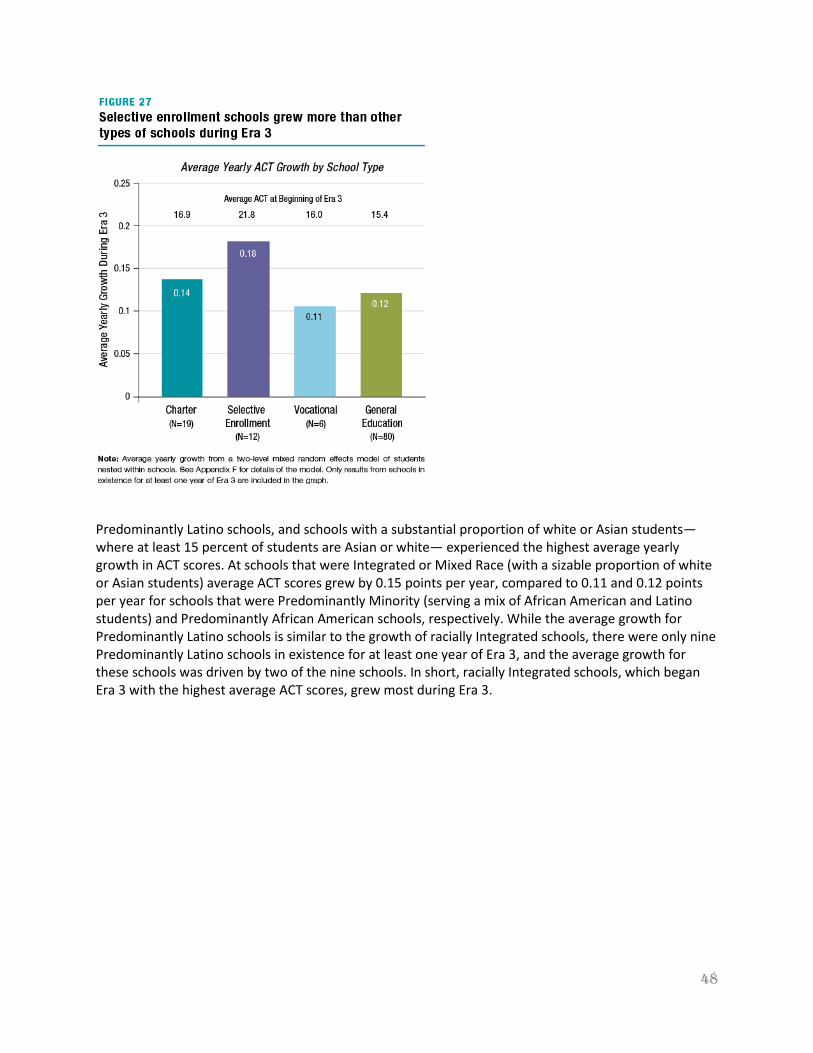
48
Predominantly Latino schools, and schools with a substantial proportion of white or Asian students—where at least 15 percent of students are Asian or white— experienced the highest average yearly growth in ACT scores. At schools that were Integrated or Mixed Race (with a sizable proportion of white or Asian students) average ACT scores grew by 0.15 points per year, compared to 0.11 and 0.12 points per year for schools that were Predominantly Minority (serving a mix of African American and Latino students) and Predominantly African American schools, respectively. While the average growth for Predominantly Latino schools is similar to the growth of racially Integrated schools, there were only nine Predominantly Latino schools in existence for at least one year of Era 3, and the average growth for these schools was driven by two of the nine schools. In short, racially Integrated schools, which began Era 3 with the highest average ACT scores, grew most during Era 3.

49
ACT Scores in the Context of College Readiness In the Midwest, most students take the ACT to accompany college admissions applications. Since 2001, Illinois has included the ACT in its annual state high school test, the Prairie State Achievement Exam (PSAE). Thus, all juniors in Illinois public high schools are required to take the ACT. Prior CCSR research has shown that grades matter much more than ACT scores in predicting CPS graduates’ enrollment and persistence in college. However, low ACT scores still present a significant barrier to attending a selective four-year college. Though there is no universally accepted definition of college readiness, ACT has established a benchmark college readiness score of 21 for reading and 22 for math; students scoring at this level have a fifty-fifty chance of getting at least a B in entry-level college classes, according to ACT. In 2010, 23 percent of CPS students met ACT college readiness standards in reading, and 18 percent hit the mark in math. Based on college-going patterns of past CPS students, a CPS student who scores between an 18 and a 20 on the ACT would have virtually no chance of attending a very selective college such as Northwestern or University of Illinois at Urbana-Champaign, and would need very good grades—at least a B average or better—to attend selective colleges such as DePaul University and Loyola University. Students scoring less than an 18 would have access to a somewhat selective college, such as Northern Illinois or Chicago State University only if they had GPAs that were at least at a B-/C+ level (above a 2.6).Unfortunately, CPS

50
students also tend to have low grades. About 60 percent of graduates from CPS have GPAs that are below a 2.6 (B-/C+) level, and only about one-fifth have GPAs above a 3.0. Further information on CPS students’ college readiness levels is available in From High School to the Future: A first look at Chicago Public School graduates’ college enrollment, college preparation, and graduation from four-year colleges. 2006. http://ccsr.uchicago.edu/content/publications.php?pub_id=7 Further information on CPS students’ ACT scores is available in: From High School to the Future: ACT Preparation—Too Much, Too Late. 2008. http://ccsr.uchicago.edu/content/publications.php?pub_id=124

51
Chapter 5. Graduation and Dropout Trends High school graduation is perhaps the most basic requirement for socio-economic success during adulthood. According to a 2002 U.S. Census Bureau report27 high school dropouts earn 30 percent less annually than those who have completed high school. As the country moves from an industrial economy to one focusing on technology and specialized skills, a high school diploma has become the minimum qualification that most employers are looking for in new hires. The U.S. Department of Labor reports that the seasonally adjusted unemployment rate in May 2011 for people over the age of 25 who had completed high school was 9.5 percent; while the rate for those who had not graduated was more than 50 percent higher, or 14.7 percent.28 It has been one of the main goals—nationally and locally—to increase the percentage of students completing high school. Twenty years ago, Chicago was a city of many dropout factories—this is the term coined by researchers at Johns Hopkins University to refer to high schools where nearly half of their students do not finish high school. In the aggregate, these schools, which represent about 15 percent of the high schools in the country, produce almost half of its dropouts.29 CPS students who entered high school in the fall of 1992 were about as likely to have dropped out four years later as they were to have graduated. In many schools, dropout rates were higher than graduation rates. Thirteen years later, students entering high school in 2005 are more than twice as likely to graduate in four years as they were to drop out (52 percent compared to 20 percent of all students who started high school in each year). Figure 29 shows that four-year graduation rates have been consistently improving since 1992.30 This figure shows the status of students four years after they enter high school—the percent that graduated, dropped out, left the system (mostly transfers out of CPS), or were still in school. In each year, these four percentages add to 100 percent of the students who entered ninth grade. The figure also shows the graduation rate, which is the percentage of students who graduated without including those that left the system.31 From 1996 to 2009, the four-year graduation rate increased from less than half of students graduating (46 percent) to two-thirds graduating within four years (66 percent). Four year graduation rates can improve for a number of reasons. They could improve because fewer students are dropping out, because more students are moving through the high school grades on-time, or simply because more students who drop out are being miscoded as transfer students. In fact, all of these changes have occurred. Miscoding dropouts as transfers does not reflect improvement in students’ educational attainment, and is problematic for gauging progress. There was a rise in the percentage of students leaving the system, especially during Era 3. Some of this increase in transfer rates likely occurred because of a change in the electronic record keeping system used by CPS during Era 3 (the Impact System). This system is known to have produced errors in administrative records, and it used different methods for coding transfer students. Thus, some of the rise in graduation rates may be due to a change in the way transfer students were classified. However, an examination of the administrative records (the “leave codes”) suggests that this accounts for 5 percent of the increase in transfer rates, at most. Even if students who left CPS are included in the base of students, there have been increases in the percentage of students who graduated over time, as shown by the “graduated” line in the figure. Furthermore, graduation rates have improved not only because fewer students have dropped out (see the “dropped out” line), but also because the proportion of students still active in school after four years has gone down. The proportion of students still active after four years declined from just about 10 percent with the 1992 cohort to about 5 percent for the 2005 cohort, indicating that the school system is reducing the average time students are spending to complete high school.

52
These improvements are impressive and, while CPS’s graduation rate still lags behind official reports of the national graduation rate, the gap between Chicago schools and the nation narrowed considerably in the last decade. For the cohorts starting ninth grade between 2001 and 2005, the graduation rate in the U.S. increased marginally from 72.6 percent to 73.2 percent.32 During the same period in CPS, four-year graduation rates—as calculated in this report—increased by 7 percentage points (from 50 percent to 57 percent). Thus, Chicago schools have shown more progress than the nation in recent years in guiding more students toward obtaining a high school diploma.
One question raised by these improvements is whether they should be attributed to changes in the high schools, changes in the preparation of students leaving the middle grades, or changes in the types of students enrolling in CPS high schools. Recall that elementary test scores were uniformly improving during Era 2. An increase in graduation rates would be expected in Era 2 due to improvements in student achievement in elementary schools during this period—students were entering high school with higher academic skills. In addition, starting in 1996, eighth-graders had to pass promotion criteria to proceed to high school. The group of students who started ninth grade in the fall of 1996 was composed solely of those who scored high enough to be promoted to ninth grade. Thus, the lowest-achieving students were kept from entering high school in 1996, which could have affected graduation rates. In fact, this cohort of ninth-graders shows a marked improvement in graduation compared to the previous one. The following fall, many of the students who had been held back the previous year entered high

53
school a year older that they would have been. Prior CCSR research showed that the policy led more students to drop out because it delayed entry into high school;33 this sudden influx of low-achieving students could have caused the graduation rate for that cohort to drop. These and other changes led us to examine graduation rates with adjustments for the characteristics of students as they entered high school.
Figure 30 shows the unadjusted four-year graduation rates, and the graduation rates adjusted for changes in background characteristics and incoming achievement levels of students entering ninth grade. The adjusted rates remove differences in graduation rates that would be expected simply because the backgrounds of students entering CPS high schools changed since 1992. For the 1992 through 1996 cohorts, the adjusted graduation rate is nearly identical to the unadjusted rate because there were few differences in the backgrounds of students entering CPS high schools. However, beginning with the 1996 cohort—the first affected by the eighth grade promotion policy—the lines begin to split apart. The adjusted rate (51 percent) is 1 point lower than the unadjusted rate (52 percent) because the entering achievement of the 1996 cohort was slightly higher than that of earlier cohorts. The lines split even further in 1997, and again in 1998, these gaps correspond with changes in the eighth grade promotion standards that occurred over the first three years of the policy. It became increasingly more difficult to pass the eighth grade standard, which caused the achievement levels of students entering ninth grade to rise. As a result, four-year graduation rates rose.
Nonetheless, even after adjusting for changes in demographics and entering achievement, graduation rates in CPS increased steadily and considerably in both Era 1 and Era 3. Thus, while the increases in graduation rates in Era 2 can at least partly be attributed to changes in the characteristics of students entering ninth grade, in Eras 1 and 3 they are more attributable to high schools themselves. At the end of Era 3, students were more likely to graduate than students who entered high school with similar skills and backgrounds at the beginning of the Era. The same is true for Era 1—graduation rates increased more than would be expected based simply on students’ skills and backgrounds when they entered ninth grade.
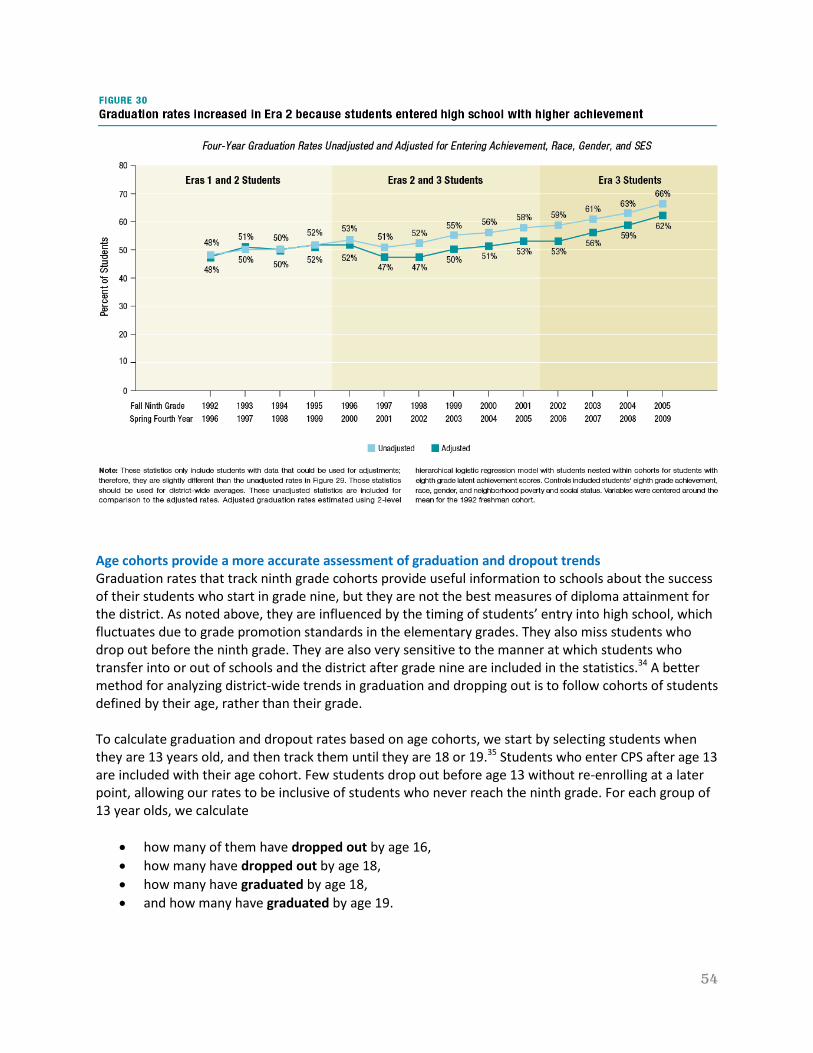
54
Age cohorts provide a more accurate assessment of graduation and dropout trends Graduation rates that track ninth grade cohorts provide useful information to schools about the success of their students who start in grade nine, but they are not the best measures of diploma attainment for the district. As noted above, they are influenced by the timing of students’ entry into high school, which fluctuates due to grade promotion standards in the elementary grades. They also miss students who drop out before the ninth grade. They are also very sensitive to the manner at which students who transfer into or out of schools and the district after grade nine are included in the statistics.34 A better method for analyzing district-wide trends in graduation and dropping out is to follow cohorts of students defined by their age, rather than their grade. To calculate graduation and dropout rates based on age cohorts, we start by selecting students when they are 13 years old, and then track them until they are 18 or 19.35 Students who enter CPS after age 13 are included with their age cohort. Few students drop out before age 13 without re-enrolling at a later point, allowing our rates to be inclusive of students who never reach the ninth grade. For each group of 13 year olds, we calculate
• how many of them have dropped out by age 16, • how many have dropped out by age 18, • how many have graduated by age 18, • and how many have graduated by age 19.

55
Students who make expected progress through school should graduate by age 18. Following students until age 19 makes the statistic more comprehensive since students who are retained in grade in the elementary school, or take more than four years to finish high school, would not graduate by age 18. Figure 31 shows the graduation and dropout rates for successive cohorts of students, beginning with students who were 13 in September 1991. In this first cohort, students were more likely to drop out than to graduate by age 18; 41 percent dropped out by 1996 compared to 38 percent who had graduated. For the cohort of students who were 13 in 2005 (or 18 years old in 2010), only one-fifth (20.8 percent) had dropped out by age 18, and over half (53.4 percent) had graduated by age 18. Graduation rates at age 19 increased even more—from less than half of students graduating by age 19 in 1997, to two-thirds of students graduating by age 19 in 2010. Following age cohorts, instead of ninth-grade cohorts, shows the improvements in graduation rates that had been occurring in Era 1 slowed down and even reversed for a short time during Era 2. The trends stop improving among students who were 16 years old in 1998 and 1999. These are students who were first subject to the eighth grade promotion standards, and who were also the first subject to new graduation requirements. Other studies have shown that both of these policies led students to be less likely to graduate.36 After this setback, graduation rates continued to improve, and improved dramatically in the last few years of Era 3. There was one drop in graduation rates at age 18, among students 18 years old in 2006; these are students who were first subject to the third grade promotion standard. Correspondingly, the proportion of students who dropped out by age 16 declined over the course of the three eras, other than the setback during Era 2 noted earlier. Nineteen percent of students who were 13 in 1991 dropped out by age 16 in 1994. By the end of Era 3, that rate had decreased to 8.4 percent for students who were 13 in 2007 (16 years old in 2010). After decreasing steadily for the vast majority of the three eras, the age-16 cohort dropout rate stabilized at slightly below 10 percent for the 2004 through 2007 age-13 cohorts. There was a policy change in 2006 that might have affected the ways in which chronically truant students were classified in administrative records as dropouts, potentially bringing more imprecision to classifications of students younger than 17. In 2006, the school board made it more difficult for students to drop out of school. In section 703.1 of the CPS policy manual, it states that students under the age of 17 will not be permitted to withdraw from school. Students who are 17 years old will be permitted to withdraw only after submitting statements of “informed consent” stating that they understand the adverse consequences of dropping out. The number of high schools in CPS has increased dramatically over the last twenty years, with many new schools opening while others have closed. We wondered whether the improvements in graduation rates were a result of better schools in the system due to the opening and closing of schools, or if the high schools that existed since 1991 had improved. Therefore, we conducted a series of analyses that compared cohorts of students within the same schools—examining whether students entering high school in recent years were more likely to graduate than students entering the same school in the early 1990s. 1
1 To do this analysis, we ran hierarchical models that nested students within schools, allowing us to estimate school trends instead of district trends. These models included student-level demographic control variables. We first ran these models with all schools that had a ninth grade cohort in any year from 1991 to 2004 (160 schools), and then with only schools that had a ninth grade cohort in every year from 1991 to 2004 (61 schools). Students who never made it to high school were not included in these models. The models with all schools, where students
We found that there were dramatic improvements in graduation rates in the schools that

56
existed throughout the time span (since 1991), and that these improvements were only slightly lower than the overall rise in graduation rates in the city. High schools in Chicago have improved their graduation rates considerably over the last twenty years; district rates have improved mostly because schools have improved, and a little bit as a result of some of the new schools in the system.
Graduation rates improved for students in all racial/ethnic groups, and among both males and females (see Figure 32 and Figure 33). Among both boys and girls, Asian students show the highest graduation rates, but they only account for about 4 percent of the student population. Among white, Latino, and African American students, graduation rates have increased dramatically over the three eras of reform, by 15 to 23 percentage points, depending on the group and gender. While substantial improvements are seen among students in all racial/ethnic groups, the rate of improvement for African American male students was smaller than for the other groups, even though they started off with the lowest graduation rates. Between 1991 and 2004, graduation rates for African American male students rose by about 15 percentage points. Rates for Latino and white male students increased by approximately 20 and 25 percentage points, respectively. While the gap in graduation rates between African American and other male students grew, dropout rates at age 16 converged so that the difference was less than 10 percentage points in the most recent years among boys of all racial/ethnic groups.
were nested in their first high school, showed a 19 percentage point increase in age 19 graduation rates, from the cohort of students who were 13 years old in 1991 to the 2004 cohort. When we constrained the analysis to schools that continuously served ninth graders from 1991 through 2004, the increase in graduation rates was just slightly lower, 17 percentage points.

57
Figure 32 shows that improvements in graduation and dropout rates for females were similar to those of males, but girls of all races/ethnicities were much more likely to graduate than boys with the same race/ethnicity. For example, for the cohort of students who were 13 years old in 2004, the female graduation rate at age 19 was 10 percentage points higher than the male rate among whites, 12 percentage points higher among Latinos, and 20 percentage points higher among African Americans. Similarly, the dropout rates at age 16 for girls were considerably lower than for males in all groups, but converged to under 10 percent by the end of Era 3.

58

59
Chapter 6. High School Course Taking Patterns Beginning with the 199798 school year, CPS mandated college preparatory coursework for all students in all high schools beginning with students entering high school. The new graduation requirements specified four years of specific English courses (survey literature, American literature, European literature, world literature), three years of specific math courses (algebra, geometry, advanced algebra), three years of laboratory science (biology, earth, space or environmental science, chemistry or physics), and three years of social science (world studies, U.S. history, and an elective). At the same time, they eliminated remedial courses in high school. Previously, a student could take any one science course, and any two math courses to meet the requirements. The new standards were in line with college admissions requirements in most public universities in Illinois. In addition to strengthening the graduation requirements, the school system made an effort to expand the opportunities of students to take advanced coursework. International Baccalaureate (IB) programs were opened in a number of high schools, expanding from two to about 15. The district also expanded the number of selective enrollment high schools in the city during Era 2, opening a new selective school in each of six school regions. In both Eras 2 and 3, the district widened the range and number of advanced placement (AP) courses available to students. Thus, there have been numerous attempts to increase curricular rigor in Chicago high schools over the last 15 years. The new graduation requirements led to a large change in coursework among students in CPS high schools. Figure 34 shows the percentage of students taking the full three-course math sequence required for graduation broken down by race/ethnicity, among students who graduated. The sharp jump up with the cohort of students who started high school in fall of 1997 reflects the policy change. Not all students who graduated completed the required math sequence, because some students with identified disabilities were exempted from the requirements by their individual education plans; but over 90 percent of students who graduated did so by completing at least three math courses, including Algebra II.

60
While more students took three years of math after they were required to do so, fewer students took advanced math classes beyond Algebra II. Figure 35 shows the highest math course students took in each cohort. The height of the blue bars, indicating the percentage of students who took the three-course sequence or more, jumps up with the 1997 cohort, as the policy was changed. However, the percentage of students who took advanced math (e.g., statistics, pre-calculus, solid geometry) dropped with the policy change. The decline in taking high-level math classes may have occurred because of the increased demand on math departments that resulted from the need to offer three years of college preparatory math classes to all students. Beginning in 2002, the rates of students taking advanced math classes began to rise again. However, by the end of Era 3, about the same percentage of students were taking advanced math classes as had been taking them before the 1997 policy change.

61
Science coursework shows a similar pattern as math; the new graduation requirements led more students to take either chemistry or physics, but fewer students took both. As discussed in Montgomery and Allensworth (2010), there is not the same clear hierarchy of science courses as there are in math. Moreover, students were given more choice in the types of science courses they could take to fulfill the graduation requirements. However, students can generally be classified into a general hierarchy as follows: 1) just earth or environmental science; 2) biology (with or without earth/environmental science); 3) chemistry or physics; 4) chemistry and physics; and 5) advanced chemistry or physics. Figure 36 shows how science coursework has changed over time. The top of the medium purple bars shows the percentage of students who took either physics or chemistry, as well as one earth science course and one life science course. When students were required to take one of these courses with the policy change in 1997, this percentage increased dramatically to the point where nearly all students took either chemistry or physics. At the same time, the number of students who took both chemistry and physics declined for the cohorts between 1996 and 2004. The percentage of students taking both chemistry and physics began to rise somewhat at the end of Era 3. However, as seen with math, the percentages of students taking both chemistry and physics at the end of Era 3 was about the same as at the beginning of Era 2. While the 1997 change in graduation requirements resulted in many more students taking college preparatory math and science courses, a prior CCSR study (Montgomery and Allensworth, 2010) showed that there were no accompanying improvements in college-going outcomes. This may be due to the fact that even though students passed more science and math courses, most passed with low grades: only about 30 percent earned As or Bs in their science courses. The decline in college-going was most pronounced among students entering high school with high incoming skills, and also may have been related to the decline in coursework in advanced science and math courses among students with the highest skills.

62
At the same time that graduation requirements were strengthened, additional opportunities for students to take more advanced, challenging coursework were developed. Between 1996 and 2006, the number of schools with at least 100 students taking AP courses increased from 20 to 50. During the same period, the number of schools with a sizable IB program went from 2 to 16. The rise in the percentages taking AP and IB coursework can be seen in Figure 37, which shows the percentage of graduated students who took and passed AP and IB courses among the cohorts starting ninth grade from 1993 to 2005. In the early years, very few AP and IB courses were available so the percentages of students taking and passing these advanced courses were very small—less than 5 percent of students took and passed more than one AP course. In Era 2, CPS introduced IB programs to a number of neighborhood high schools, and there was a corresponding increase in the percentage of students taking IB classes. However, this still represented a very small percentage of students; 0.4 percent of students who entered CPS high schools in 1997 participated in an IB program for at least a year. There were also more students who took more than one AP class in Era 2, and many more who took AP classes during Era 3. By the end of Era 3, about 15 percent of students took and passed more than one AP class while in high school. However, while more students took and passed AP classes, few students passed the corresponding AP test which is needed to get college credit. The AP Test pass rate (the percentage of students who took the test and got a 3, 4, or 5 on the test) is about 33 percent among CPS students. This is because many students enter AP classes with skill levels that are so low that they would need to make extraordinary gains to pass the tests.
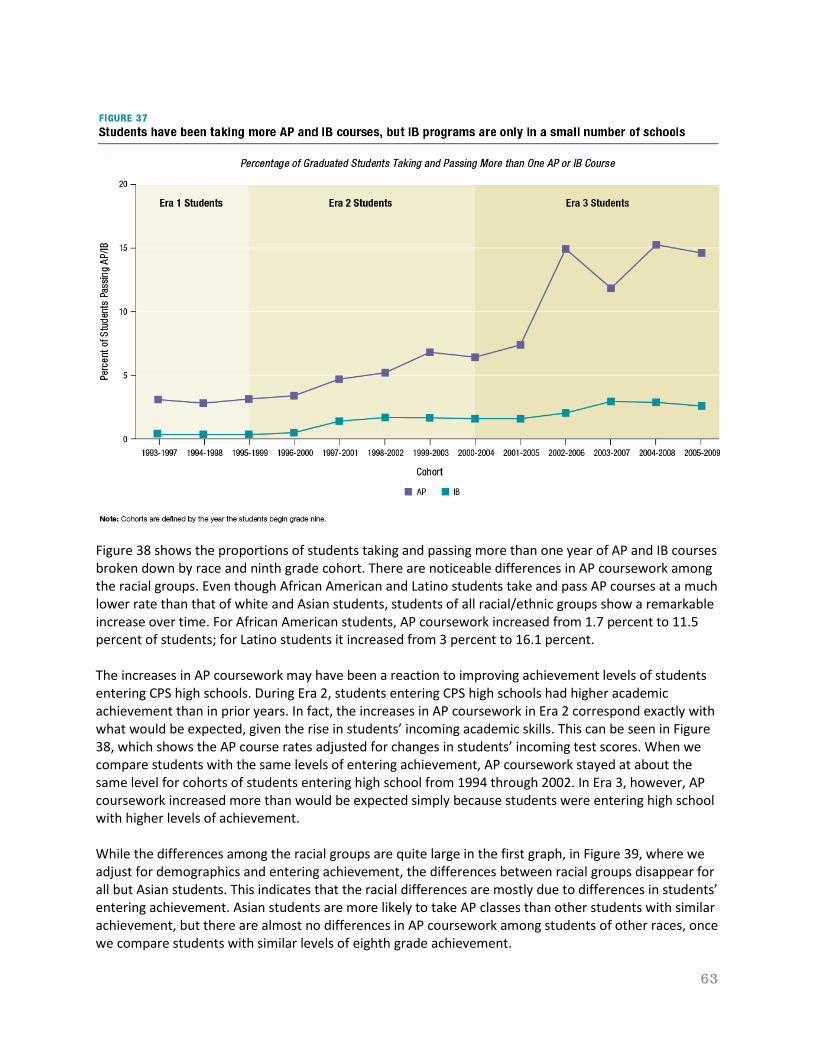
63
Figure 38 shows the proportions of students taking and passing more than one year of AP and IB courses broken down by race and ninth grade cohort. There are noticeable differences in AP coursework among the racial groups. Even though African American and Latino students take and pass AP courses at a much lower rate than that of white and Asian students, students of all racial/ethnic groups show a remarkable increase over time. For African American students, AP coursework increased from 1.7 percent to 11.5 percent of students; for Latino students it increased from 3 percent to 16.1 percent. The increases in AP coursework may have been a reaction to improving achievement levels of students entering CPS high schools. During Era 2, students entering CPS high schools had higher academic achievement than in prior years. In fact, the increases in AP coursework in Era 2 correspond exactly with what would be expected, given the rise in students’ incoming academic skills. This can be seen in Figure 38, which shows the AP course rates adjusted for changes in students’ incoming test scores. When we compare students with the same levels of entering achievement, AP coursework stayed at about the same level for cohorts of students entering high school from 1994 through 2002. In Era 3, however, AP coursework increased more than would be expected simply because students were entering high school with higher levels of achievement. While the differences among the racial groups are quite large in the first graph, in Figure 39, where we adjust for demographics and entering achievement, the differences between racial groups disappear for all but Asian students. This indicates that the racial differences are mostly due to differences in students’ entering achievement. Asian students are more likely to take AP classes than other students with similar achievement, but there are almost no differences in AP coursework among students of other races, once we compare students with similar levels of eighth grade achievement.

64

65
Patterns in IB coursework are similar to those of AP coursework, see Figure 37 and Figure 38. However, since IB programs have been implemented in very few schools in the city the overall rates are much lower. In addition, after we adjust for achievement and background of the students, the between-race differences all but disappear.

66

67

68
Chapter 7. Changes in School Climate and Organizational Supports CCSR has been tracking conditions in Chicago schools since we first started surveying teachers in CPS in 1991, principals in 1992, and students in 1994. Since 1997, we have surveyed students, teachers, and principals every other year in order to understand the processes through which schools affect student achievement. Over time, we developed and tested a framework for school improvement that focuses attention to five key organizational supports. This framework, which is called The Five Essential Supports for School Improvement, is documented in Bryk et al. (2010). The Five Essentials are:
• Inclusive Leadership Focused on Instruction • Professional Capacity • Parent/Community Ties • Student Centered Learning Climate • Ambitious Instruction
Under this framework, strategic, inclusive leadership is viewed as the lever for change, which promotes and develops the professional capacity of the staff, encourages ties to parents and the community in ways that are coherently aligned with the instructional program of the school, and develops a climate that facilitates student learning. The professional capacity of the school is determined by the quality of the staff, the professional development they receive, and the degree to which they work together as a professional community and take collective responsibility for the school. Parents and community partners work with school staff as partners in children’s education. The climate of the school is safe, orderly, and supportive for students. Instruction is engaging, ambitious, and well aligned across grade levels. Research has shown that these essential supports are important to school improvement; thus, we report on the trends across time as crucial indicators of organizational support in Chicago. Using survey data, we developed ways of measuring aspects of each of the five supports and tracking them over time. Since 1994, we have asked a number of questions consistently in each survey administration, allowing us to track changes over time.37 Unfortunately, the surveys did not ask consistent questions over time until they were administered in 1994. For this reason, we cannot look at trends in school climate and organization through Era 1. Instead, we treat the 1994 survey results as baseline data for the other two eras. Descriptions of CCSR surveys and the methods used to measure climate and instruction are provided in Appendix E. All of the measures shown in this report reflect teacher and student responses on multiple questions that are combined into measures of general topic areas. To provide some perspective on what teachers and students report, we provide a summary of responses to one of the questions that comprise each of the measures described here. Overall, there have been improvements in school leadership, professional capacity, and teachers’ relationships with parents. However, with the exception of improvement in school safety at the start of Era 2, neither the school climate nor the quality of instruction as reported by students has shown any improvement. Particularly after 2005, students’ reports of their interactions and relationships with teachers declined dramatically, erasing some gains that had been made in prior years.
School Leadership We track three aspects of school leadership in this report; 1) the degree to which the principal is viewed as a strong instructional leader in the school; 2) the degree to which instruction and programs are

69
coherently aligned within the school; and 3) teacher influence within the school. In general, school leadership showed modest improvements across the three eras—improving from the middle of Era 1 to the middle of Era 2, then falling slightly at the end of Era 2; improving again during Era 3, then falling slightly at the end. As shown in Figure 42, teachers’ perceptions of their principal as an instructional leader improved slightly from the middle of Era 1 through the middle of Era 2. Instructional leadership ceased to improve at the end of Era 2, but showed some improvements towards the middle of Era 3. At the very end of Era 3, reports of instructional leadership declined slightly. Over all three eras, instructional leadership improved modestly—by about a quarter of a standard deviation from a low in 1994 to a high in 2007. By the end of Era 3, when asked whether the principal sets high standards for teaching, 88 percent agreed or strongly agreed. In general, teachers held their principals’ instructional leadership in high regard. Similar patterns are observed with instructional program coherence—some improvements can be seen from Era 1 to the middle of Era 2 (see Figure 43). Improvements stopped at the end of Era 2, rose again during Era 3, and declined slightly in the last year of Era 3. Instructional program coherence improved less than instructional leadership, by about a fifth of a standard deviation from 1994 to 2007. In general, across all three eras, about 64 percent of teachers reported that instruction was well coordinated across grade levels. Teachers also assumed a greater leadership role in their schools over time, primarily at the high school level. However, trends in teacher influence look different than the other aspects of school leadership. There was an increase in teacher leadership from the middle of Era 1 to the first year of Era 2, but then no increases during Era 2 (see Figure 44). Higher teacher influence is consistent with the decentralized reform of Era 1, while the accountability policies of Era 2 may have done less to encourage teacher leadership. In elementary schools, there were no further increases in teacher influence after the rise at the end of Era 1; teacher influence remained fairly constant from 1997 to 2009 in elementary schools. However, high school teachers showed an extraordinary increase in teacher influence during Era 3 (of about 0.6 standard deviations). The increase in teacher leadership in high schools in Era 3 was extraordinary not just in its size, but also in that high school teachers overtook elementary school teachers in their reports of influence in the school. High school teachers are generally less positive in their reports about school organizational structures than elementary school teachers, and this represents a substantial shift in the way in which high school teachers viewed their roles in their schools during Era 3. By 2009, about 71 percent of both elementary and high school teachers reported having “some” or “a great deal” of influence over determining the instructional curriculum, one of the key areas of teacher influence measured by the surveys.

70

71
Professional Capacity Professional capacity also showed modest improvements across the three eras. Two aspects of professional capacity are shown in this report: 1) the degree to which teachers take collective responsibility for the whole school (not just their own classrooms); and 2) the quality of professional development in the school. As with instructional leadership and program coherence, teachers’ reports of collective responsibility among their colleagues showed improvements from the middle of Era 1 to the middle of Era 2, dropped off at the end of Era 2, and then improved again during Era 3. By the end of Era 3, 69 percent of elementary school teachers reported that “most” or “nearly all” of the teachers in their schools take responsibility for school improvement. On the other hand, only 53 percent of high school teachers perceived this degree of collective responsibility. The quality of professional development in schools shows a somewhat different pattern than other measures of leadership and professional community. In high schools, teachers reported better professional development during Era 2, while there were no improvements in elementary schools. Elementary school teachers reported improvements in professional development in Era 3, with little change reported by high school teachers (see Figure 45 and Figure 46).
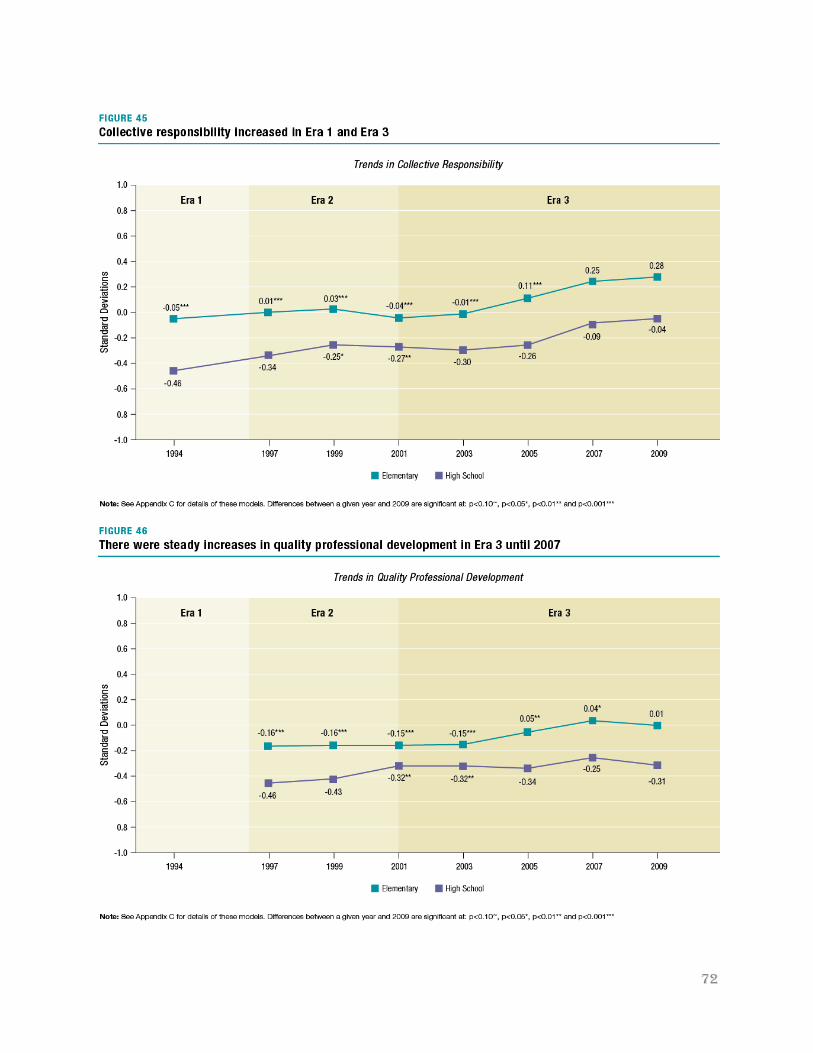
72

73
Parent/Community Ties There have also been improvements in teacher/parent trust across the three eras of school reform. As with indicators of leadership and professional capacity, teachers’ reports of their relationships with parents improved from the middle of Era 1 to the middle of Era 2, declined slightly at the end of Era 2, and then improved more during Era 3. By the end of Era 3, fully three-quarters of teachers reported that “most” or “nearly all” parents supported their teaching efforts.
Student Centered Learning Climate There was a dramatic improvement in students’ perception of safety in their schools between 1994 and 1997, at both the elementary and high school levels. The rapid improvement early in Era 2 corresponds with an investment in infrastructure, and a focus on security and an increased police presence in the schools during that period. By 1997, 81 percent of elementary students and 67 percent of high school students said that they felt mostly safe in the hallways and bathrooms around the school. Also, 53 percent of elementary students and 39 percent of high school students said they felt safe in the area immediately outside of the school. After the improvements observed at the beginning of Era 2, school safety remained at about the same levels throughout the rest of Era 2 and Era 3. Schools managed to maintain higher levels of safety than in Era 1, but did not improve further. Students’ reports of trusting relationships with their teachers did not improve, and even declined slightly during Era 2 and the first part of Era 3. At the end of Era 3, from 2005 to 2007, elementary students’ trust of their teachers declined substantially and remained low through 2009. By 2009, 79 percent of elementary school students and 69 percent of high school students agreed or strongly agreed that their teachers always try to be fair. The drop in students’ relationships with their teachers can also be seen in students’ reports of personal support from their classroom teachers. There were some

74
improvements in students’ reports about the amount of personal attention they received from their teachers in Era 2 and the first part of Era 3, especially at the elementary school level. However, students’ reports about personalized support from their teachers declined beginning in 2005, and continued to decline in 2009, especially among middle grade students.

75

76
Instruction Students’ reports of the quality of instruction in their classrooms have shown little improvement over the three eras of school reform. As shown in Figure 51, students’ engagement and participation rates in their classes have changed little over the three eras of reform. In 2009, about 74 percent of students in the middle grades agreed or strongly agreed that the topics they study are interesting and challenging. About 67 percent of high school students reported this level of engagement. Likewise, students’ reports of the academic press of their classes—the degree to which teachers press them to work hard and ask difficult questions—were relatively unchanged from Era 1 through Era 2 (see Figure 52). At the start of Era 3, there were some slight improvements in students’ reports of academic press, but then a large decline beginning in 2005.
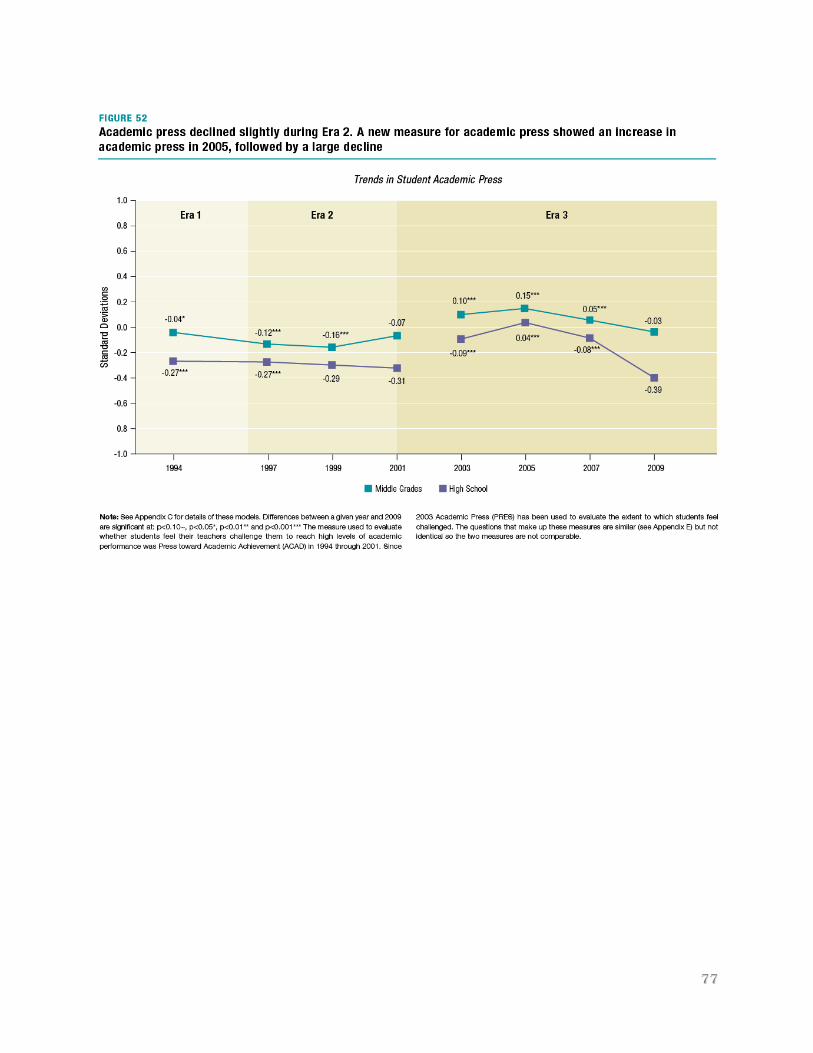
77

78
Conclusions and Areas for Further Study Chicago schools are not what they were in 1990. Graduation rates have improved tremendously, and students are more academically prepared than they were two decades ago. ACT scores have risen in recent years, and elementary math scores are almost a grade level above where they were in the early 1990s. However, average test scores remain well below levels that indicate students are likely to succeed in college. This is not a problem that is unique to Chicago. Nationwide, the typical high school graduate does not perform at college-ready levels. Chicago students do not perform more poorly than students with similar economic and ethnic backgrounds at other schools in Illinois. Era 1, the era of Decentralization when schools were given the latitude to formulate and execute their own improvement strategies, was a baseline period for this study. Our data sources begin to provide good information in the middle of the era; thus, it is difficult to gauge the extent to which students’ achievement improved under Decentralization. However, there were at least modest improvements in both elementary and high schools during Era 1. Graduation rates were very low, but improving. And math scores rose in the elementary grades, although they flattened in the end. Other research at CCSR has documented the unevenness in school improvement under Decentralization, in which the schools serving students from the most economically disadvantaged communities were least likely to improve, while those serving more advantaged communities were most likely to improve (Bryk et al., 2010). These outcomes can be explained by differences in the social resources available in school communities—under Decentralization, communities where residents were active in local organizations and where schools faced fewer social problems were more likely to show improvements. Era 2 was an era of strict test-based accountability measures, as well as bold initiatives enacted to transform CPS high schools. There were large investments in infrastructure and stability in district leadership. Students’ feelings of safety at school improved considerably at the start of the era. Test scores in the elementary/middle grades rose during this period, and they improved in schools serving students of all types of backgrounds. This was the only era to show large improvements in the lowest-achieving schools. However, the patterns in test scores in the lowest-performing schools suggest that some of the improvements resulted from instruction that was aligned specifically to the high stakes tests. Prior CCSR studies have found that the test-based accountability policies had mixed results for students (Roderick et al., 1999; Roderick and Engel, 2001; Roderick and Nagaoka, 2005; Jacob et al., 2004; Roderick et al., 1999; Roderick and Engel, 2001). They encouraged teachers and parents to provide more support to the lowest-achieving students, and they encouraged better alignment of instruction to grade-level standards. At the same time, they resulted in a narrowing of the curriculum, more instructional time spent on test-taking practice, and a large increase in grade retention in the elementary schools. Test-based promotion policies resulted in more students entering high school who were old for their grade level; this had a depressing effect on graduation rates (Allensworth, 2005). In fact, the improvements in graduation rates that had been occurring in Era 1 were set back in Era 2. This dip occurred, in part, because of the increase in grade retention, but also because of the change in graduation requirements in the high schools (Montgomery and Allensworth, 2010). While more students who graduated did so with college preparatory coursework, fewer students took the highest levels of coursework. In Era 3, there were large improvements in outcomes in the high schools and very little improvement in the elementary schools. Improvements that had been occurring in graduation rates accelerated, and were seen in all types of schools, both boys and girls and all racial/ethnic groups. At the same time,

79
scores on the ACT rose, even though students were not entering high school better prepared. In the elementary grades, test scores dropped—especially in the lowest-performing schools. Equity declined, so that schools serving African American students, and those that started out the era with the lowest levels of performance, were less likely than more advantaged schools to have improving test scores. Teacher capacity showed improvements throughout Era 3, in terms of teachers’ reports of the quality of their professional development and the degree to which they took collective responsibility in the school. At the high school level, teachers became much more influential in school decision-making. However, the end of Era 3 saw a decline in students’ reports of their relationships with teachers, especially in the elementary/middle grades. While the effects of the dominant policies of Eras 1 and 2 are largely understood, much research remains to be done to understand both the positive and problematic effects of the policies in Era 3. The decline in equity, with African American students falling behind students from other racial/ethnic groups, is particularly disturbing and has raised questions about the policies around school closings and openings, which disproportionately affected African American students. As we have presented these findings, some people have wondered whether students were hurt by the shuffling of students that occurred when schools were closed, or whether neighborhood schools declined as charter schools proliferated. One CCSR study showed no improvements in test scores for students who were displaced by school closings (Gwynne and de la Torre, 2009), but there is yet to be an analysis of the overall effect of the policies on all students and schools. Another area requiring more study is the rise in student performance in the high schools. Era 3 brought a much greater use of data in the high schools to track students and provide targeted support for passing classes and college readiness. Further research should investigate whether this use of data led to the improved outcomes and, if so, exactly how it happened.
The findings in this report contradict common perceptions about district performance over the last two decades. It has been widely believed that elementary schools have improved considerably, while high schools have stagnated. In fact, the opposite is true. These misperceptions arise because of problems with the metrics that are used to judge school performance, and differences in the standards by which high schools and elementary schools are held accountable. High schools are increasingly being judged by college-ready standards, particularly by college-ready benchmark scores on the ACT. The benchmark score on the ACT-aligned EXPLORE exam that students take at the beginning of high school corresponds to much higher skill levels than the “meets standards” benchmark on the spring eighth grade ISAT exam. Thus, because high schools are held to a much higher standard, it appears that they are less successful. This problem is accentuated by focusing on benchmark scores rather than averages—few students are close to meeting the high school benchmarks on the ACT, so it looks like there has been little movement when there has been growth. A further reason for misperceptions about elementary school performance comes from non-equivalent tests, scoring, and test administration procedures over time. These changes have often led scores to look like they are improving when skill levels have remained the same.
This report raises important questions about what how much improvement we can reasonably expect in a large system over the span of two decades. Over the course of the three eras of school reform, a number of dramatic system-wide initiatives were enacted. But instead of bringing dramatic changes in student achievement, district-wide changes were incremental—when they occurred at all. We can identify many individual schools that made substantial, sometimes dramatic, gains over the last 20 years, but dramatic improvements across an entire system of over 600 schools are more elusive. Past research at CCSR suggests that that the process of school improvement involves careful attention to

80
building the core organizational supports of schools—leadership, professional capacity, parent/community involvement, school learning climate, and instruction (Bryk, et al., 2010). Building the organizational capacity of schools takes time and is not easily mandated at the district level. Nevertheless, the extent to which the next era of school reform drives system-wide improvement will likely depend on the extent to which the next generation of reforms attends to local context and the capacity of individual schools throughout the district.

81
Appendix A. Reform Timeline Chicago School Reform Timeline
Testing Policy Timeline
Era 1 Decentralizatio
n 198895
1988 Chicago School Reform Act
Bilingual students’ ITBS results were included in public reporting. Students in bilingual education for more than three years were required to take the test; students in bilingual programs for less
than three years were tested at teachers’ discretion.
1989 First Local School Councils elected. Ted Kimbrough becomes Superintendent of CPS.
1993 Argie Johnson appointed Superintendent of CPS
1995 Second Chicago School Reform Act gives Mayor control of schools. Mayor appoints Paul Vallas as CEO.
Era 2 Accountability
19962001
1996 New promotion standards instituted for students in eighth grade; Students were required to meet a minimum score on the ITBS test in both reading and math in order to be promoted to ninth grade. Probation policy begins for schools when their reading scores were below a certain threshold. Schools on probation faced decreased autonomy and the threat of more sanctions; at the same time they received support from several sources.
1996
New promotion standards instituted for students in eighth grade; Students were required to meet a minimum score on the ITBS test in both reading and math in order to get promoted to ninth grade.. Test score cut-offs raised in each of the three following years so that it becomes increasingly more difficult to be promoted.
1997
Vallas limits students' participation in bilingual education to three years and begins to exclude scores of bilingual students from reporting if less than three years in bilingual education.
1997 Promotion policy extended to third and sixth grades. Reconstitution policy begins. In first year, teachers at seven high schools must re-apply for their jobs.
1998 Settlement of Corey H lawsuit leads CPS to send more special education students to neighborhood schools and general education classrooms.
1999
ISAT begins for third-, fifth-, and eighth-graders. It replaces IGAP as state elementary exam, while the ITBS continues to be used for district accountability. Exclusion of bilingual students from test reporting raised from three to four years. Students in third year of bilingual are now required to take the ITBS, but these scores are excluded from reporting.
1999 New test (ISAT) begins for third-, fifth-, and eighth-graders.
2000 CPS raises the threshold for putting schools on academic probation and begins intervention in low-scoring high schools.
2001 Arne Duncan appointed CEO. 2001 ISBE institutes PSAE for high schools. Promotion cut-off for sixth-graders raised.
Era 3 Diversification
200209
2002 No Child Left Behind Act signed. Takes effect 2003. 2002
ITBS Reading administered over two sessions with break between sessions. Returns to one session in 2005.
2003 First Chicago HS Redesign Initiative (CHSRI) schools open, funded by Gates Foundation; breaking three large high schools into several small high schools
2004
Retention decisions are based on the reading test only. 2004 Launch of Renaissance 2010, a plan to close
dozens of low-performing schools and open 100 new schools by 2010. New schools are given far more autonomy over budget and staffing. First schools open in 2006.
2005 CPS provides student data reports to high schools, first the post-secondary tracking reports and later Freshman Success reports
2005 Last year ITBS is used for promotion and accountability policy. School board restores math scores as criterion for retention.
2006 ISAT revised and expanded to all grades three through eight. ISAT now used for promotion and accountability.
2009 Arne Duncan nominated for U.S. Secretary of Education. 2008
All students receiving bilingual education are required to take the ISAT and PSAE test.

82
Appendix B: Rescaling the ITBS to the ISAT The Iowa Tests of Basic Skills (ITBS) were administered to CPS elementary school students from the 1980s until 2005, when the ISAT became the primary accountability instrument in Chicago. The ITBS test scores had to be transformed to put them on the same scale as the ISAT to enable us to display elementary test score trends across the entire period under study. We had previously equated all forms and levels of the ITBS in use from 1987 until 2005 using the Rasch model.38 We have confidence that the equated measures for the ITBS are consistent across all the forms and levels. However, these measures are on a logit scale (the useable range of which goes from about -3 to 6), which is not at all equivalent to the ISAT scale, which goes from 120 to about 400. Fortunately, we have multiple cohorts of students who took both exams, but in different years. We can use data from students who took the same exams in some grades, but different exams in other grades, to determine the relationship between scores on the ITBS and scores on the ISAT. In addition, we have grade nine EXPLORE scores for students that provide additional data about students’ math and reading skill levels at the start of the ninth grade (early October). The EXPLORE scores are available for students who took the eighth grade ITBS and those who took the eighth grade ISAT (taken in the spring of the year). Students had 12 possible data points for each subject tested: ITBS at ages nine through 14 and ISAT at ages nine through14 for reading and math. For any individual students a maximum of 6 of those data points were observed. In addition, students in later cohorts also had scores on the ninth grade EXPLORE. We use multiple imputation to obtain full data records for each student. The multiple imputation included, in addition to the available test score data,
• indicators for the cohort of the student (the year the student was nine years old) • indicators for the race/ethnicity of the student • variables describing the average SES and concentration of poverty in the student’s residential
census block group • variables indicating if the student was old-for-grade at each age
The multiple imputation procedure produced five imputed data sets; we calculated the average of the test scores for each subject, age and test for each student. We then used the full data set to define the relationship between the ITBS scores and the ISAT scores in separate models for each subject and age. The models predicted the ISAT test score from the ITBS score, the ITBS score squared, the ITBS test score cubed, and a dummy indicating whether the student was nine or 10 years old in 2002 through 2005. This final dummy variable was included because: 1) the differences in reading test administration during that period produced aberrations in the test scores that could not be corrected for in the equating, and 2) we only received equating data for that period for students in grade three and above. So, nine year olds who were still in grade two could not be measured, resulting in test scores for nine year olds that were strongly biased upwards. Including a dummy adjusted out the irregular pattern in the data. Coefficients from these models were then used to translate students’ actual ITBS scores into ISAT scores. One artifact of this process was that the imputation process produced a reduction in measurement error, so that extremely high or low scores were less likely to occur in the translated scores. Thus, the distribution is somewhat compressed with the translated scores, although the mean and general shape of the distribution remain the same. For example, here is the equation for the grade nine math prediction:

83
1412.05667.09758.20263.231 32 −⋅+−⋅+⋅+= ITBSITBSITBSISAT The age nine and age 10 reading prediction equation includes the dummy for Form A or B. The age nine reading equation is:
427.6348.0415.11485.201243.225 32 −⋅+−⋅+−⋅+⋅+= gformAByounITBSITBSITBSISAT The R2s for each age and subject are listed in the table below:
Subject
Age Reading Math
9 .73 .75 10 .76 .81 11 .78 .86 12 .81 .86 13 .79 .86 14 .74 .83
The Form A and B indicator for nine and 10 year olds adjusted for differences in the test administration practices between 2002 and 2004. In prior versions of the ITBS the reading portion of the test was administered in one sitting. For Forms A and B, given between 2002 and 2004, the students were given a break half-way through the reading portion. This resulted in higher scores for younger students that could not be accounted for in the equating. The R2s, which give the percent of variance explained by the model, are quite high. If the test has a reliability of .9 (which is typical for an assessment like this), the highest R2 it would be possible to get due to attenuation of correlation would be about .8, so these values are as good as could be expected.

84
Examination of the drop in scores in 2006 Because the decline in average scores between 2005 and 2006 was so severe compared to other year-to-year changes, we were concerned that it was a result of the imputation and rescaling methodology rather than real differences in students’ math and reading performance. We performed a number of analyses to check the validity of the score calculations. One concern was that the relationships between the scores on the test might not be correctly specified in the analytic models. Therefore, we carefully examined the fit of the models and resulting residuals to be certain that the decline in scores was not an effect of improper specification of the relationships (e.g., a relationship that was not cubic when specified as a third order fit). However, this did not explain the decline in scores, and we were assured that the models were appropriately specified at each age level. The rescaling process did reduce the overall variance in scores, but that alone would not affect average scores. But a second concern was that the rescaling process changed the shape of the distribution of scores in a way that affected the yearly averages. Mindful of the fact that the density of ITBS scores in CPS is greater at the lower end of the distribution, we wondered if the rescaling process was inflating the average by moderating more scores at the low end than at the high end, thereby changing the shape of the distribution. We examined, therefore, the distributions of the ISAT—both predicted (19902005) and actual (200609) —and the ITBS—both actual (19902005) and rescaled (19902005). We plotted the distributions by cohort and age for predicted and actual scores, standardized across years, so that they could be plotted on the same scale. All four sets were very similar, with the distributions of original scores nearly identical to the distributions of rescaled scores. As an additional test, we examined scatter plots of the actual ITBS scores from 19902005 against the rescaled ITBS scores from the same period, for each age and subject combination. These graphs showed virtually straight lines, with slight curves at the endpoints where very few scores exist. We also plotted line graphs of median scores by age and year instead of means and found no difference in the severity of the change in scores from 2005 to 2006. Taking a closer look at the magnitude of the asymmetry in distribution for each set of scores, we plotted the densities of each standardized distribution for each age and subject. The graphs showed that there existed only very slight differences in skewness for each distribution; Figure B1 is the display for eleven year olds in math, with degree of skewness in the legend.

85
With no evidence that the drop in scores from 2005 to 2006 was manufactured by our rescaling methodology, we shifted our attention instead to the rapid increase in scores seen between 2006 and 2008 as a potential source of bias. After some investigation, we found evidence that the scoring methodology used by administrators was not consistent from year-to-year on the ISAT,39 and our own analysis showed inconsistent scaling over time with the ISAT, as discussed in Chapter 3. Because the ISAT scores in 2008 and 2009 were qualitatively different than scores in 2006 and 2007, representing lower skills for the same score than with the earlier tests, we decided to exclude the 2008 and 2009 scores from the imputation models, rerunning the entire procedure using scores from 1990 to 2007 only. The result was a slight net decrease in average ITBS scores from 1990 to 2005 after rescaling to the ISAT scale. That is, rescaled scores were shifted downward slightly having not been influenced by the extraordinarily high ISAT scores in 2008 and 2009. This reduced the gap between 2005 and 2006 average scores, with ITBS scores somewhat more in line with ISAT scores than they were prior to the exclusion of 2008 and 2009 scores from the imputation models. The gaps remained, though, and some of them were still severe. After examining all other possibilities, we were convinced that the decline in scores represented real differences in student performance on the exams. We were further convinced of this after finding that the shift in scores occurred among particular types of schools, but not particular types of students within schools. When we first noticed that the decline in scores was largest among students with low test scores, we were concerned that the equating process was improperly specified among students with low achievement. However, we found that among students in high-achieving schools, there was not a large decline in scores among low-scoring students. Likewise, even high-scoring students showed a decline in scores in schools with low average achievement levels. If there was a problem with equating scores for low-achieving students, we would expect to see the gaps associated with students’ skill levels, rather than school skill levels.

86
However, this does not mean that we believe students’ math and reading skills necessarily declined from 2005 to 2006. Instead, we believe schools had become very proficient at preparing students specifically for the ITBS when it was the exam used for accountability and that the change in exams required a change in instructional and test preparation practices. We make this conclusion because the NAEP scores did not show a dramatic decline during the same time period and because the decline is most pronounced at schools that would have been most at risk for accountability sanctions tied to the high stakes tests (as discussed in Chapter 2).

87
Appendix C: Survey Administration and Rasch Scaling CCSR administers surveys to students in grades six through 12, teachers in all grades and principals in order to gauge their experiences in schools, determine the prevalence of certain instructional practices, and measure organizational structures in the schools. There are separate surveys for elementary school students, high school students in grades nine through11, and twelfth grade students. Parts of the student surveys are separated by subject, with some students responding about particular classes. In all there were more than 650 items administered to students in 2009. We received 69,146 surveys from elementary school students, 48,123 surveys from ninth through eleventh grade students, and 10,448 from seniors in 2009. Teachers took one of two versions of the survey, depending on whether they taught in an elementary school or a high school. We received surveys from 9,357 elementary school teachers, and 4,359 high school teachers in 2009. Although we also survey principals, we do not include those data in this study. From the teacher survey data, we construct 37 measures of school organization using the Rasch model, although not all 37 measures are considered in this report. We also made 42 measures from the student survey data; but, again, not all are referenced here. We have found these measures to be very predictive of academic and other positive outcomes in the schools in several studies. The Rasch model is a member of the family of item-response latent-trait models. Using a set of carefully selected survey items (questions), it produces an interval scale that determines item difficulties and person measures. The items are arranged on the scale according to how likely they are to be endorsed (item difficulty). The scale is then used to show person measure, a quantitative measure of a person’s attitude on a unidimensional scale. In other words, the items are used to define the measure’s scale, and people are then placed on this scale based on their responses to the items in the measure. The scale units are logits (log odds units), which are linear and therefore suitable for use in simple statistical procedures. Measures contain several related items (usually between four and eight). To create these item clusters, CCSR analysts select items that belong together according to education theory. Determinations as to which items to keep in the final measure are based on conceptual coherence as well as the statistical fit of the group of items. Unless there are strong conceptual reasons, CCSR analysts eliminate items with high misfit statistics. Each person and item is assigned a measure score that represents where they fall on the scale. In addition, each person and item has a true standard error (the precision of the measure) and a fit statistic (the statistical coherence of the measure). The fit statistics are calculated by taking the mean squared deviations of the difference between the expected values and the observed values. The fit statistics have an expected value of 1.0; items with fit statistics substantially greater than 1.0 may belong to a construct different from the one underlying other items in the cluster and may not belong in the cluster. After the measures were developed using an initial subset of people with well-fitting psychometric properties, a single set of item and step parameters were saved and used in subsequent years for

88
scoring. In this way, the meaning of the measure scores stays consistent over time. This is necessary for measuring change across the constructs.
Appendix D: Calculating Graduation and Dropout Rates
This report presents graduation and dropout rates calculated in two different ways, based on either: 1) cohorts of students who started ninth grade in each year—freshman cohort data; and 2) cohorts of 13 years old students in CPS each year — age 13 cohort data. These two different ways of calculating graduation and dropout rates were explained in detailed in Allensworth (2005). Here we offer a brief explanation of the decisions and rules that are needed in order to calculate the graduation and dropout rates we present in this report. The freshman cohort rates follow cohorts of first-time ninth graders to determine the percentage of students who graduated, dropped out, left CPS, or were still enrolled four years later. First-time ninth grade students are students who had never previously enrolled in grade nine, 10, 11, or 12 in a CPS high school, and were actively enrolled as ninth-graders in a regular (non-alternative) CPS high school, including Transition Centers, Academic Preparatory Centers and Achievement Academies, on the thirtieth day of the school year, or were not yet enrolled in a CPS high school on the thirtieth day, but enrolled as a ninth-grader after the thirtieth day and remained in school long enough to receive grades for at least one semester. Students who were in ungraded special education were also included as first-time freshmen if they had not previously been enrolled in a CPS high school and they were actively enrolled in a CPS high school on the thirtieth day of the school year. Students who transferred into a CPS high school after ninth grade were not included in the freshman cohort statistics. Decisions about how to include transfer students can have large effects on the resulting indicators—leading them to be higher or lower, depending on the decision rules. For details, see Chapter 3 of NRC/NAED (2011). By keeping the group of students represented in a cohort to just those enrolled in ninth grade we avoid inflating the statistic by including students who transfer into schools at older grades. This also keeps the resulting rates of graduates, dropouts, transfers, and students still enroll sum to 100 percent—making it easier to understand the statistics. The age cohort rates, which are more inclusive in a number of ways, include students who transfer in after age 13. The ninth grade cohort graduation rates shown in this report differ from the districts’ five-year cohort rates in a number of technical details. In addition to following students for different lengths of time, there are differences in which students are included in the cohorts, and how students are counted as transfers or dropouts. We do not include students who began ninth grade in a CPS alternative school as a member of a ninth grade cohort. Including these students would lower graduation rates by about 4 percentage points (depending on the cohort) because General Education Development (GED) certificates and alternative diplomas would be counted as dropouts. CPS also requires verification of transfers by the end of the school year in which a transfer is recorded. Requiring verification also decreases graduation rates since unverified transfers are counted as dropouts. While we agree with the practice of counting unverified transfers as dropouts, we do not use the verification files so that we have consistent methods over time, and because of concerns that legitimate transfers are often not verified on time. Counting unverified transfers as dropouts would slightly decrease the four-year graduation rates we calculated. For example, classifying unverified transfers as drop outs would decrease the graduation rate for the 2000 freshman cohort by about 2 percentage points. Finally, for the purposes of this report, we have included in our calculations only students who entered ninth grade in CPS instead of including students who entered later in high school as CPS does for five-year graduation rates. However, because students are most likely to drop out early in high schools, including these late entries

89
in our calculations would only increase our calculated graduation rate and would account for differences between CPS calculations and our own. Issues with leave codes following the introduction of the IMPACT system in 2007 posed challenges for coding the four-year status of students in later cohorts. In particular, for the cohort of students entering in fall 2003, there was an anomalously high proportion of students coded as having left the system four years after entering. If we had used the coding used for all other cohorts, 24 percent of 2003 freshman would have been classified as having left CPS by the end of their fourth year. Compared to the equivalent statistics for cohorts entering in 2002 (17 percent coded as left CPS by 2006) and 2004 (20 percent coded as left CPS by 2008) this large jump in the percentage of students being coded as having left CPS was suspicious and likely due to early implementation issues with the IMPACT system. To correct for this issue we re-coded the status of students who were classified as having left CPS by the end of the 200607 academic year with their status at the end of the 200708 year. Following the re-coding, only 18 percent of students were classified as having left the system. This figure corresponds more closely to other cohorts’ leave rates and with the overall trend in CPS seen in the rest of the time period including the pre-IMPACT years. The age 13 cohort rates follow students from age 13 to age 19. Students are included in a cohort if they were 13 years old on September 1 of the cohort year. Students who transferred into CPS after age 13 are included in the cohort that corresponds with their age, but their outcomes are reported only after they transferred into CPS. Introducing transfer students into age cohorts introduces less bias than it would with ninth grade cohorts because students’ age is not affected by grade progression in the elementary grades or credit accumulation in high school—while their status as a ninth grader is affected by both. Age 13 cohorts are followed for three years for early dropout rates (at age 16), and for five or six years for graduation and dropout rates at age 18 and 19. Students are classified as graduates if they receive a regular high school diploma. Recipients of alternative school diplomas and GEDs are not counted as graduates because the requirements for these credentials are less rigorous than those for a regular diploma, and because they are generally not perceived as equivalent in value to a regular high school diploma. Students who enroll in an alternative school or receive a GED are counted as dropouts. Students are classified as dropouts if their administrative records show them as no longer actively enrolled for any of the following reasons:
• Lost—could not be located
• Lost—undeclared
• Transferred to an evening school
• Exited IEP (rather than graduated)
• Dropout self-declared
• Dropout for absences
• Did not arrive at school
• Left an alternative school for any reason other than transfer to a regular CPS high school or graduating with a regular diploma (including receiving a GED or alternative school diploma, incarceration or transfer to a different school system)
• Still enrolled in an alternative school after fourth year in high school (freshman cohorts)
• Still enrolled in an alternative school at age 19 (age 13 cohorts)
• No leave code recorded

90
Students who are no longer active in CPS, whose last school was a regular high school, and who are not coded as dropouts according to the definition above, are coded as leaving CPS. Most of these students transferred to another school district. Other students were no longer enrolled in a regular high school because of institutionalization, incarceration, or death. Students who left CPS are not included in the calculation of dropout rates and graduation rates. Dropout rate is calculated as the number of students in the cohort who dropout divided by the total number of students in the cohort excluding students who left CPS. Graduation rate is calculated as the number of students in the cohort who graduated divided by the total number of students in the cohort excluding students who left CPS
Appendix E: Description of Survey Measures Survey data come from teacher and student surveys conducted in 1994, 1997, 2001, 2003, 2005, 2007, and 2009. Changes in survey questions throughout the years are noted, where applicable. Using Rasch rating-scale analysis, we derived survey measures or scales. This method involves an item response latent-trait model. Survey items are used to define a measure based on the relative probability of a respondent choosing each category on each item. Individuals are then placed on this scale based on their particular response to the items in the measure. The scale units—logits—constitute a linear measurement system and therefore are suitable for use in statistical procedures. Tables E1 and E2 show the questions that comprise each measure and the reliability of the measures from the elementary/middle grade surveys (ES) and the high school surveys (HS).

91
Table 1: Student Measures MEASURE DESCRIPTION ITEM TEXT Reliability STUDENT SAFETY (SAFE) 19942009 Safety reflects the students’ sense of personal safety inside and outside the school and traveling to and from school. A high score means they feel very safe in all these areas.
How safe do you feel: -Outside around the school? -Traveling between home and school? -In the hallways and bathrooms of the school? -In your classes? (Strongly Disagree, Disagree, Agree, Strongly Agree)
ES: 0.63 HS: 0.65
CLASSROOM PERSONALISM (PERC) 19942009 Classroom Personalism gauges whether students perceive that their classroom teachers give them individual attention and show personal concern for them. Students were asked if their teachers know and care about them, notice if they are having trouble in class, and are willing to help with academic and personal problems. A high score here means students experience strong personal support from school staff. Academic achievement is more likely in classrooms that combine personalism with a strong press toward academic work.
How much do you agree with the following statements about your math/English/this class.
My teacher:
-Relates this subject to my personal interests (question dropped in 2003)
-Really listens to what I have to say
-Helps me catch up if I am behind
-Notices if I have trouble learning something
-Is willing to give extra help on schoolwork if I need it.
-Believes I can do well in school
-Doesn’t know me very well (question dropped in 1999)
(Strongly Disagree, Disagree, Agree, Strongly Agree)
ES: 0.80 HS: 0.75
PRESS TOWARD ACADEMIC ACHIEVEMENT (ACAD) 19942003 Press Toward Academic Achievement gauges whether students feel their teachers challenge them to reach high levels of academic performance. This is a key element in a school climate focused
How much do you agree with the following statements about your math/English /this class.
My teacher:
-Encourages me to do extra work when I don't understand something
- Praises my efforts when I work hard (question added in 1997)
- Cares if I don't do my work in this class (question added in 1997)
- Cares if I get bad grades in this class (question added in 1997)
ES: 0.67 HS: 0.66
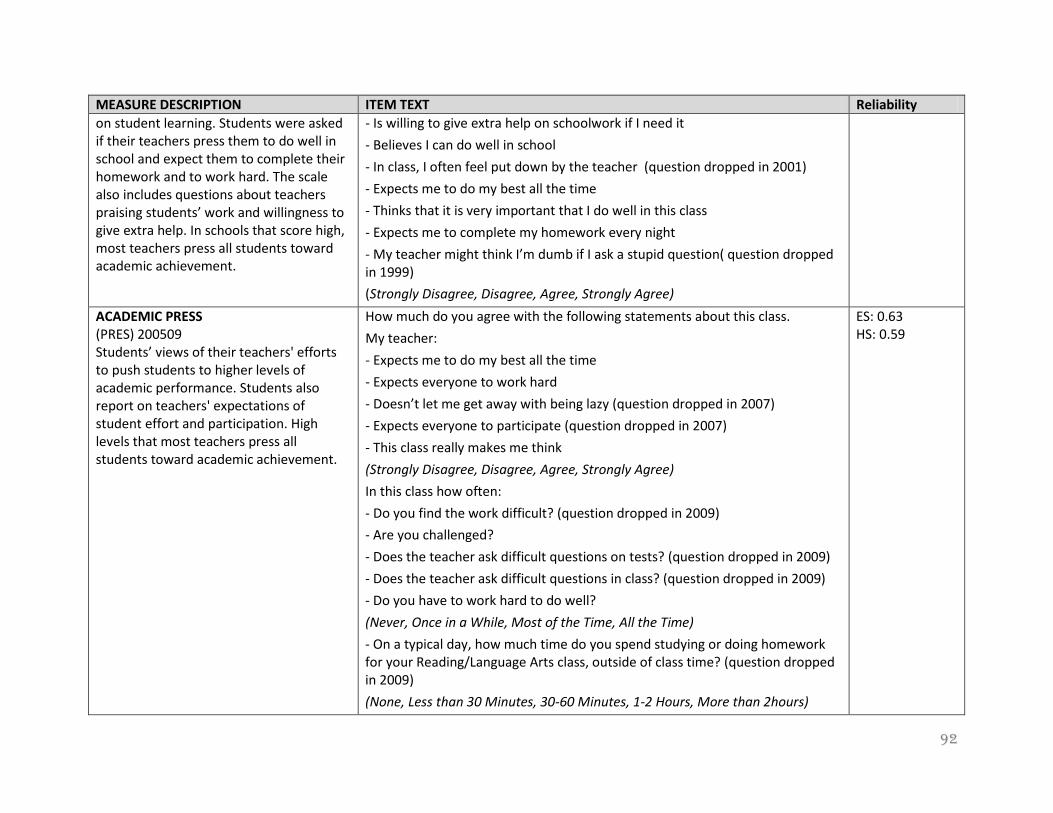
92
MEASURE DESCRIPTION ITEM TEXT Reliability on student learning. Students were asked if their teachers press them to do well in school and expect them to complete their homework and to work hard. The scale also includes questions about teachers praising students’ work and willingness to give extra help. In schools that score high, most teachers press all students toward academic achievement.
- Is willing to give extra help on schoolwork if I need it
- Believes I can do well in school
- In class, I often feel put down by the teacher (question dropped in 2001)
- Expects me to do my best all the time
- Thinks that it is very important that I do well in this class
- Expects me to complete my homework every night
- My teacher might think I’m dumb if I ask a stupid question( question dropped in 1999)
(Strongly Disagree, Disagree, Agree, Strongly Agree)
ACADEMIC PRESS (PRES) 200509 Students’ views of their teachers' efforts to push students to higher levels of academic performance. Students also report on teachers' expectations of student effort and participation. High levels that most teachers press all students toward academic achievement.
How much do you agree with the following statements about this class.
My teacher:
- Expects me to do my best all the time
- Expects everyone to work hard
- Doesn’t let me get away with being lazy (question dropped in 2007)
- Expects everyone to participate (question dropped in 2007)
- This class really makes me think
(Strongly Disagree, Disagree, Agree, Strongly Agree)
In this class how often:
- Do you find the work difficult? (question dropped in 2009)
- Are you challenged?
- Does the teacher ask difficult questions on tests? (question dropped in 2009)
- Does the teacher ask difficult questions in class? (question dropped in 2009)
- Do you have to work hard to do well?
(Never, Once in a While, Most of the Time, All the Time)
- On a typical day, how much time do you spend studying or doing homework for your Reading/Language Arts class, outside of class time? (question dropped in 2009)
(None, Less than 30 Minutes, 30-60 Minutes, 1-2 Hours, More than 2hours)
ES: 0.63 HS: 0.59

93
MEASURE DESCRIPTION ITEM TEXT Reliability How much do you agree with the following statements about this class?
- No one wastes time in this class (question dropped in 2007)
(Strongly Disagree, Disagree, Agree, Strongly Agree)
ACADEMIC ENGAGEMENT (ENGG) 19942009 Academic Engagement examines student interest and engagement in learning. Students responded to items regarding whether they are interested in their class and the topics studied. They also reported whether they work hard to do their best. A high score means greater individual engagement in learning.
How much do you agree with the following statements about this class. My teacher:
- The topics we are studying in this class are interesting and challenging
- I am usually bored with what we study in this class
- I usually look forward to this class
- I work hard to do my best in this class
- Sometimes I get so interested in my work I don’t want to stop
- I often count the minutes until class ends
(Strongly Disagree, Disagree, Agree, Strongly Agree)
ES: 0.70 HS: 0.55
STUDENT/TEACHER TRUST (TRTS) 19972009 Student/Teacher Trust focuses on the quality of relationships between students and teachers. Students were asked whether they believe teachers can be trusted, care about them, keep their promises, and listen to students' ideas, and if they feel safe and comfortable with their teachers. In high-scoring schools, there is a high level of care and communication between students and teachers.
How much do you agree with the following statements about your teachers:
- My teacher punishes students without knowing what happened (question dropped in 2007)
- My teachers can’t be trusted (question dropped in 1999)
- My teachers get mad when I make mistakes (question dropped in 2007)
- My teachers don’t care what I think (question dropped in 2007)
- My teachers really care about me
- My teacher always keeps their promises
- My teachers always try to be fair
- I feel safe and comfortable with my teacher at this school
- When my teacher tells me not to do something, I know he/she has a good reason
- My teachers treat me with respect (question added in 2007)
(Strongly Disagree, Disagree, Agree, Strongly Agree)
ES: 0.63 HS: 0.06

94
Table 2: Teacher Measures MEASURE DESCRIPTION ITEM TEXT STATISTICS INSTRUCTIONAL LEADERSHIP (INST) 19942009 Principal Instructional Leadership assess teachers’ perceptions of their principal as an instructional leader. Teachers were asked about their principal's leadership with respect to standards for teaching and learning, communicating a clear vision for the school, and tracking academic progress. In schools with a high score, teachers view their principal as very involved in classroom instruction, thereby able to create and sustain meaningful school improvement.
Please mark the extent to which you disagree or agree with the following. The principal at this school:
- Makes clear to the staff his or her expectations for meeting instructional goals
- Communicates a clear vision of our school
- Sets high standards for teaching
- Understands how children learn
- Sets high standards for student learning (question added in 1997, dropped in 2009)
- Presses teachers to implement what they have learned in professional development (question added in 1997)
- Carefully tracks students’ academic progress (question added in 1999)
- Actively monitors the quality of teaching in this school
- Knows what’s going on in my classroom (question added in 2003)
- Monitors quality of teaching (question added in 2003, dropped in 2009)
- Participates in instructional planning with teachers (question added in 2009)
- Encourages teachers to take risks (question dropped in 1997)
- Is willing to make changes (question dropped in 1997)
- Encourages teachers to try new methods (question dropped in 1994)
(Strongly Disagree, Disagree, Agree, Strongly Agree)
ES: 0.90 HS: 0.90

95
MEASURE DESCRIPTION ITEM TEXT STATISTICS TEACHER INFLUENCE (INFL) 19942009 Teachers Influence measures the extent of teachers’ involvement in school decision making. Teachers registered how many influence they have over such matters as selecting instructional materials, setting school policy, planning in-service programs, spending discretionary funds, and hiring professional staff. A high score indicates influence both over classroom matters and major school-wide decisions, such as budgets and hiring new staff, implying a broad sense of “ownership” for school decisions.
How much influence do teachers have over school policy in each of the areas below?
- Hiring new professional personnel
- Planning how discretionary school funds should be used
- Determining books and other instructional materials used in classrooms
- Establishing the curriculum and instructional program (question added in 1997)
- Determining the content of in-service programs
- Setting standards for student behavior
- Determining how student progress is measured (question dropped in 1999)
- Overall school schedule (question dropped in 1999)
- Teaching assignments (question dropped in 1999)
- Hiring new principal (question dropped in 2003)
(None, A Little, Some, A Great Deal)
- How many teachers are active in decision making? (question dropped in 1999)
(None, Some, About Half, Most, Nearly All)
To what extent do you disagree or agree with the following?
- Teachers have informal influence in decisions (question dropped in 2007)
- Teachers make important decisions at the school (question dropped in 2007)
- I feel comfortable voicing concerns (question dropped in 2001)
(Strongly Disagree, Disagree, Agree, Strongly Agree)
ES: 0.81 HS: 0.80

96
MEASURE DESCRIPTION ITEM TEXT STATISTICS PROGRAM COHERENCE (PGMC) 19942009 Program Coherence assesses the degree to which teachers feel the programs at their school are coordinated with each other and with the school’s mission. Teachers were asked, for example, if the materials in their schools are consistent both within and across grades, if there is sustained attention to quality program implementation, and if changes at the school have helped promote the school’s goals for student learning. A high score on the measure means a school’s programs are coordinated and consistent with the school’s goals for student learning, enabling the development of a high quality core program.
To what extent do you disagree or agree with the following?
- Once we start a program we follow up to make sure that it’s working
- We have so many different programs in this school that I can’t keep track of them all
- Many special programs come and go at this school
- You can see real continuity from one program to another at this school (question dropped in 2009)
- Curriculum, instruction, and learning materials are well coordinated across the different grade levels at this school (question added in 1999)
- There is consistency in curriculum, instruction, and learning materials among teachers in the same grade level at this school (question added in 1997)
- Programs have little relation to teacher and student needs (question only used in 1997)
- Programs promote goals of student learning (question only used in 1997)
(Strongly Disagree, Disagree, Agree, Strongly Agree)
- To what extent has the coordination of your school’s instructional program changed in the past 2 years? (question added in 1997, dropped in 2009)
(Worse, No Change, Better)
ES: 0.74 HS: 0.73
COLLECTIVE RESPONSIBILITY (COLR) 1994-2009 Collective Responsibility focuses on the extent of shared commitment among the faculty to improve the school so that all students learn. Teachers were asked how many colleagues feel responsible for students' academic and social development, set high standards of professional practice, and take responsibility for school improvement. A high score means a strong sense of shared responsibility among the faculty, who help
How many teachers in this school:
- Help maintain discipline in the entire school, not just their classroom?
- Take responsibility for improving the school?
- Set high standards for themselves? (question dropped in 2009)
- Feel responsible to help each other do their best?
- Feel responsible that all students learn?
- Feel responsible for helping students develop self-control?
- Feel responsible when students in this school fail? (question added in 1999)
(None, Some, About Half, Most, Nearly All)
ES: 0.91 HS: 0.90

97
MEASURE DESCRIPTION ITEM TEXT STATISTICS each other reach high standards.
TEACHER/PARENT TRUST (TRPA) 19942009 Teacher/Parent Trust measures the extent to which parents and teachers support each other to improve student learning and feel mutual respect. Teachers were asked if they feel they are partners with parents in educating children, if they receive good parental support, if the staff works hard to build trust with parents, and if teachers respect parents. A high score indicates very supportive relations among teachers and parents.
How many teachers in this school?
- Care about the community (question dropped in 1999)
- Respect LSC members (question dropped in 1997)
- Respect parents (question dropped in 1999)
- Feel good about parents’ support for their work? (question added in 1997)
- To what extent do you feel respected by the parents’ of your students?
(None, Some, About Half, Most, Nearly All)
For the students you teach this year, how many of their parents:
- Support your teaching efforts? (question added in 1997)
- Do their best to help their children learn? (question added in 1997)
- Care about the local community (question dropped in 1997)
(None, Some, About Half, Most, Nearly All)
Please mark the extent to which you disagree or agree with the following statements about your school.
- At this school it is difficult to overcome the cultural barriers between teachers and parents (question added in 1997, dropped in 2009)
- Teachers and parents think of each other as partners in educating children
(question dropped in 1997)
- Parents have confidence in the expertise of the teachers (question dropped in 2009)
- Staff at this school work hard to build trusting relationships with parents
(Strongly Disagree, Disagree, Agree, Strongly Agree)
ES: 0.76 HS: 0.77
PARENT INVOLVEMENT IN SCHOOL (PART) 19942009 Parent Involvement in School measures parent participation and support for the
For the students you teach this year, how many of their parents:1
- Attended parent-teacher conferences when you requested them?
- Volunteered to help in the classroom?
- Show up to events? (question added in 1999, dropped in 2003)
ES: 0.70 HS: 0.60

98
MEASURE DESCRIPTION ITEM TEXT STATISTICS school. Teachers reported how often parents picked up report cards, attended parent-teacher conferences, attended school events, volunteered to help in the classroom, or raised funds for the school. Schools with a high score have many parents who actively aid the school.
- Picked up their child’s last report card?
- How many parents attended school events?(question dropped in 2003)
- Help raise funds for schools? (question dropped in 2003)
(None, Some, About Half, Most, Nearly All)
COORDINATION and QUALITY OF PROFESSIONAL DEVELOPMENT
(QPD2) 1997-2009
Coordination and Quality of Professional Development measures teachers’ assessment of the degree to which professional development has influenced their teaching, helped them understand students better, and provided them with opportunities to work with colleagues and teachers from other schools. High levels indicate that teachers are involved in sustained professional development focused on important school goals.
How much do you disagree or agree with the following:
- Teachers are left completely on their own to seek out professional development (question dropped in 2009)
- Most of what I learn in professional development addresses the needs of the students in my classroom (question dropped in 2009)
- Most professional development topics are offered in the school once and not followed up (question dropped in 2009)
Overall my professional experiences this year have:
- Been sustained and coherently focused, rather than short-term and unrelated
- Included enough time to think carefully about, try, and evaluate new ideas
- Been closely connected to my schools improvement plan
- Included opportunities to work productively with colleagues in my school
- Included opportunities to work productively with teachers from other schools (Strongly Disagree, Disagree, Agree, Strongly Agree)
ES: 0.72 HS: 0.73
COLLEGIALITY
(COLG) 19942003
Peer Collaboration reflects the extent of a cooperative work ethic among staff. Teachers were asked about the quality of relations among the faulty, whether school staff coordinate teaching and learning across grades, and whether they
How much do you disagree or agree with the following:
- Collaborative effort makes the school run well
- Teachers at this school are cordial
- Teachers coordinate instruction across grades
- Teachers design instruction programs together.
(Strongly Disagree, Disagree, Agree, Strongly Agree)
ES: 0.76 HS: 0.74

99
MEASURE DESCRIPTION ITEM TEXT STATISTICS share efforts to design new instructional programs. Schools where teachers move beyond just cordial relations to actively working together score high on this scale and can develop deeper understanding of students, each other, and their profession.

100
Appendix F: Statistical Modeling of Outcomes Throughout the report, we have shown some of the student outcomes adjusted for some student covariates. This appendix provides a description of the statistical models, as well as the covariates, used to create the figures with the adjusted student outcomes.
Statistical Models Most models were specified as hierarchical models. Our data is student- or teacher-level data and hierarchical models are used to take into account the clustering of the data. Clustering arises because the observations either come from the same year or the same school. Table F1 shows in detail what type of model was used for each outcome and each figure in the main body of the report.
For test scores, graduation, and high school course taking, the basic model can be described as: Level 1 (students): ηij = π0j + kj*(Student Covariates kj) + eij Level 2 (either year or school): π0jk = β00k + r0jk πajk = βa0k , for a = 1 to K (some of these parameters will be allowed to vary randomly; see check Table X1) Normal assumptions apply to the error terms. For linear models, ηij is just the outcome. This is the case for test scores for elementary schools and high schools. For the analysis of graduation and whether students pass their IB and AP classes, we used nonlinear models since the dependent variable only take a value of zero or one. In those cases ηij is defined as the log odds where,
−=
ij
ijijijijij BY
ϕϕ
ηϕϕ1
logand),1(~ .
To examine how the survey measures changed over time we used a four-level hierarchical linear model. At Level 1 we adjusted for measurement error, which is produced by the Rasch analysis. At Level 2 we modeled the students’ or teachers’ “true score” in each of the measures. Level 3 nested the observations within year and Level 4 nested those observations within school. The basic model can be described as follows: Level 1 (measurement model):
,1Measurejtk
jtkjtk
jtk
jtk ess
+=π
where )1,0(~ Ne jtk , jtks is the standard error estimated from the Rasch analysis for person j at time t
in school k and jkπ is the person’s “true score.”
Level 2 (students or teachers):
,)Covariates(1
0 jtk
P
ppjtkptktkjtk r++= ∑
=
ββπ

101
Level 3 (Year):
. variables theofrest for the ,
Variables)Dummy Year (
0
01
mk0000
kpptk
k
M
mmkktk u
γβ
γγβ
=
++= ∑=
Level 4 (Schools):
. variables theofrest for the ,0
00000
pmpmk
kk wγγφγ
=+=
Normal assumptions applied to r, u, and w error terms.
Covariates included in the models Adjustments were made for different outcomes. This is a description of all the covariates used in the models. For a description of which covariates were used in which model see Table F1.
Race/Ethnicity. Set of dummy variables taking a value of zero or 1 for whether a student is African American, white, Latino, Asian, or other.
Gender. A dummy variable taking a value of one for whether a student is male and zero otherwise.
Socio-economic indicators. Two indicators were created to capture the socio-economic status of students:
- Neighborhood concentration of poverty. Based on data from the 2000 U.S. Census information on the census block group in which students lived. Students’ home addresses are used to link each student to a particular block group within the city, which could then be linked to census data on the economic conditions of the student’s neighborhood. Two indicators are used to construct these variables: 1) log of the percentage of families above the poverty line and 2) log of the percentage of men employed in the block group.
- Neighborhood social status. Based on data from the 2000 U.S. Census information on the census block group in which students lived. Students’ home addresses are used to link each student to a particular block group within the city, which could then be linked to census data on the economic conditions of the student’s neighborhood. Two indicators are used to construct these variables: 1) the average level of education among adults over age 21 and 2) log of the percentage of men in the block group employed as managers or executives.
Special education status. A dummy variable taking a value of one if the student was receiving special education services.
Bilingual education status. A dummy variable taking a value of one if the student was receiving bilingual services.
Test controls. A dummy indicating that the student was nine or 10 years old and taking ITBS Form A or B, given between 2002 and 2004.
Latent eighth grade achievement. Reading and math scores in eighth grade, but instead of the straight scores, we used the underlying achievement that comes from student’s scores based on all the ITBS

102
scores for that student from third through eighth grade. A description of this technique can be found in Miller, Allensworth, and Kochanek (2002).
Age dummies. Set of dummy variables taking a value of zero or 1 for whether a student was nine years old, 10 years old, etc.
Grade dummies. Set of dummy variables taking a value of zero or 1 for whether a student was in grade six, seven, etc.
Subject dummies. Set of dummy variables taking a value of zero or 1 for whether a student was answering a survey question about a particular class on English, math, science, social studies, language, or other.
Year dummies. Set of dummy variables taking a value of zero or 1 for whether an observation was for a particular year.
Controls used for CPS/Illinois Elementary Test Score Comparison:
Percent tested of each race/ethnicity. Of the total number of students in each school whose scores were reported, this is the percent of each race.
Percent low income. Of the total number of students in each school whose scores were reported, this is the percent eligible for free or reduced priced lunch.
Percent special education status. Of the total number of students in each school whose scores were reported, this is the percent with an individualized education program (IEP).
Percent bilingual education status. Of the total number of students in each school whose scores were reported, this is the percent with limited English proficiency status (LEP).

9/29/2011 4:57 PM 103
Table F1: Details on statistical models and covariates for each outcome Statistical Model Covariates Elementary Test Scores
Figures 8 and 10
2-Level Hierarchical Linear Model Students nested within year Random intercept and age dummy variables
Race/ethnicity, gender, socio-economic indicators, special education status, age, changes in test type, test form and test level, trends by era.
Figures 9 and 11 (State vs. CPS)
Linear regression model, weighted by the number of students in each school whose scores were reported No nesting
Percent tested of each race/ethnicity (Asian, African American, Latino, or white), percent low income, percent special education status, percent bilingual education status, with dummy variables indicating years.
Figure 12
2-Level Hierarchical Linear Model Students nested within year Random intercept and age dummy variables
Race/ethnicity, gender, socio-economic indicators, special education status, age, changes in test type, test form and test level, trends by era.
Figures 16-17
2-Level Hierarchical Linear Model Students nested within year Random intercept and race/ethnicity dummy variables
Race/ethnicity, gender, socio-economic indicators, special education status, age, changes in test type, test form and test level, trends by era.
Figures 18-21
2-Level Hierarchical Linear Model Students nested within school Random intercept and trends
Race/ethnicity, gender, socio-economic indicators, special education status, age, changes in test type, test form and test level, trends by era.
High School Test Scores
Figure 23 and 24
Ordinary least squares regression model.
Race/ethnicity, gender, socio-economic indicators, latent eighth grade achievement, and dummy variables indicating years. Entering achievement for students without eighth grade test scores were imputed based on ninth grade EXPLORE scores when available or the entering achievement of students with similar ACT scores.
Figure 25
Ordinary least squares regression models. 4 separate models for each racial/ethnic group.
Gender, socio-economic indicators, latent eighth grade achievement, and dummy variables indicating years. For students without eighth grade test

9/29/2011 4:57 PM 104
Statistical Model Covariates scores, entering achievement is imputed based on ninth grade EXPLORE scores when available or average entering achievement of similar students. The dummy variable for gender was centered around the 2001 mean for the particular ethnic/racial group while entering achievement and socio-economic indicators were standardized around the 2001 mean for the particular ethnic/racial group.
Figures 27 and 28
2-Level Hierarchical Linear Model Students nested within school
Race/ethnicity, gender, socio-economic indicators, latent eighth grade achievement, dummy variables for 2001 and 2002 and a continuous variable for the trend over Era 3 (2004-2009). Entering achievement for students without eighth grade test scores were imputed based on ninth grade EXPLORE scores when available or the entering achievement of students with similar ACT scores. All student characteristics were grand-mean centered.
First-Time Freshman Cohort Graduation
Figure 30
2-Level Hierarchical Logistic Model Students nested within cohorts. Random intercept
Latent eighth grade achievement, race/ethnicity, gender, socio-economic indicators, and dummy variables for each cohort. Race/ethnicity and gender dummy variables were centered around the mean for the 1992 cohort. Achievement and socio-economic indicators were standardized around the mean for the 1992 cohort.
High School Course Taking Patterns Figure 41
2-Level Hierarchical Logistic Model Students nested within year Random intercept
Latent eighth grade achievement, race/ethnicity, gender, and socio-economic indicators.
Teacher Survey Measures
Figures 42-47
4-Level Hierarchical Linear Model With a measurement model in Level 1, teacher data nested within year nested within schools
Dummy variables indicating years.

9/29/2011 4:57 PM 105
Statistical Model Covariates Random intercept
Student Survey Measures
Figures 48-52
4-Level Hierarchical Linear Model With a measurement model in Level 1, student data nested within year nested within school Random intercept
Race/ethnicity, gender, socio-economic indicators, dummy variables indicating grade, dummy variables for subject if students were answering questions about particular classes, and dummy variables indicating years.

9/29/2011 4:57 PM 106
Works Cited ACT, Inc. (2007) The ACT Technical Manual. ACT, Iowa City, Iowa. www.act.org/aap/pdf/ACT_Teachnical_Manual.pdf
Allensworth, E. (2004) Ending social promotion: Dropout rates in Chicago after implementation of the eighth grade promotion gate. Consortium on Chicago School Research, Chicago, Illinois.
Allensworth, E., and Nagaoka, J. (2010) “The effects of retaining students in grade with high stakes promotion tests.” Chapter 20 in Judith Meece (ed.), Handbook on Schools, Schooling, and Human Development, Taylor and Francis.
Allensworth, E.M. (2005) Dropout rates after high-stakes testing in elementary school: A study of the contradictory effects of Chicago’s efforts to end social promotion. Educational Evaluation and Policy Analysis, 27(4). http://ccsr.uchicago.edu/content/publications.php?pub_id=7
Allensworth, E.M. (2005) Graduation and dropout trends in Chicago: A look at cohorts of students from 1991 through 2004. Consortium on Chicago School Research, Chicago, Illinois. http://www.consortium-chicago.org/publications/p75.html
Banchero, S. (2008) Erros may snarl state testing. Chicago Tribune, August 2, 2008. http://articles.chicagotribune.com/2008-08-02/news/0808020038_1_test-scores-high-school-reading-scores-test-results
Bond, T.G., and Fox, C. (2007) Applying the Rasch Model: Fundamental measurement in the human sciences. Psychology Press.
Bryk, A., Meng Y.T., Easton, J.Q., and Luppescu, S. (1998) Academic productivity of Chicago public elementary schools: A technical report. Consortium on Chicago School Research, Chicago, Illinois.
Chapman, C., Laird, J. and Kewal Ramni, A. (2010) Trends in high school dropout and completion rates in the United States: 19722008. U.S. Department of Education, Washington, D.C.
Cheeseman Day, J., and Newberger, E.C. (2002) The big payoff: Educational attainment and synthetic estimates of work-life earnings. U.S. Census Bureau, Washington, D.C.
Cole, J.S., and Osterlind, S.J. (2008) Investigating differences between high- and low-stakes test performance on a general education exam. Journal of General Education, 57:2
Darling-Hammond, L., and Wise, A.E. (1985) Beyond standardization: State standards and school
improvement. The Elementary School Journal, 85(3), 315–36.
Easton, J.Q., Ponisciak, S., and Luppescu, S. (2008) From High School to the Future: The Pathway to 20. Consortium on Chicago School Research, Chicago, Illinois.
Easton, J.Q., Luppescu, S., and Rosenkranz T. (2006) 2006 ISAT Reading and math scores in Chicago and the rest of the state. Consortium on Chicago School Research, Chicago, Illinois.
Firestone, W.A., Mayrowetz, D., and Fairman, J. (1998) Performance-based assessment and instructional
change: The effects of testing in Maine and Maryland. Educational Evaluation and Policy Analysis, 20(2),
95–113.
Gwynne, J., and de la Torre, M. (2009) When schools close: Effects on displaced students in Chicago Public Schools. Chicago: Consortium on Chicago School Research, Chicago, Illinois.

9/29/2011 4:57 PM 107
(http://ccsr.uchicago.edu/content/publications.php?pub_id=136)
Illinois State Board of Education (2010) Illinois Standard Achievement Test. http://iirc.niu.edu/Tests.aspx?isat
Jacob, R.T., Stone, S., and Roderick, M. (2004) Ending social promotion in Chicago: The response of
teachers and students. Consortium on Chicago School Research, Chicago, Illinois.
Jones, M.G., Jones, B.D., and Hardin, B. (1999) The impact of high-stakes testing on teachers and
students in North Carolina. Phi Delta Kappan, 81(3), 199–203.
Koretz, D. (2008) Measuring up: What educational testing really tells us. Cambridge, Massachusetts: Harvard University Press.
Koretz, D.M., Barron, S.I., Mitchell, K.J., and Stecher, B.M. (1996) Perceived effects of the Kentucky
instructional results information system. Santa Monica, California: RAND.
McNeil, L. M. and Valenzuela, A. (2001) The harmful impact of the TAAS system of testing in Texas:
Beneath the accountability rhetoric. In M. Kornhaber and G. Orfield, (Eds.), Raising standards or raising
barriers? Inequality and high stakes testing in public education. New York: Century Foundation, 127–50.
Miller, S.R., and Gladden, R.M. (2002) Changing special education enrollments: Causes and distribution among schools. Consortium on Chicago School Research, Chicago, Illinois.
Montgomery, N., Allensworth, E., and Correa, M. (2010) Passing through science: The effects of raising graduation requirements in science on course-taking and academic achievement in Chicago. Consortium on Chicago School Research, Chicago, Illinois.
National Center for Education Statistics (2009) The Nation’s Report Card: Trial Urban District Assessment Mathematics 2009 (NCES 2010-452). Institute of Education Sciences, U.S. Department of Education, Washington, D.C.
National Center for Education Statistics (2010) The Nation’s Report Card: Trial Urban District Assessment Reading 2009 (NCES 2010-452). Institute of Education Sciences, U.S. Department of Education, Washington, D.C.
National Research Council and National Academy of Education (2011) High School Dropout, Graduation and Completion Rates. Washington, D.C.: The National Academies.
Rado, D. (2010) New ISAT lets kids pass with more wrong answers: Test experts question point decline; state officials cite statistical adjustments. Chicago Tribune, October 18, 2010. http://www.chicagotribune.com/news/education/ct-met-isat-answers-20101018,0,308277.story. Accessed 2011-4-5.
Roderick, M., Bryk, A.S., Jacob, B.A., Easton, J.Q. and Allensworth, E. (1999) Ending social promotion: Results from the first two years. Consortium on Chicago School Research, Chicago, Illinois.
Roderick, M., and Engel, M. (2001) The grasshopper and the ant: Motivational responses of low-
achieving students to high-stakes testing. Educational Evaluation and Policy Analysis, 23(3), 197–227.
Roderick, M., and Nagaoka, J. (2005) Retention under Chicago’s high-stakes testing program: Helpful,
harmful, or harmless? Education Evaluation and Policy Analysis, 24(4), 309–40.
Roderick, M., Bryk, A.S., Jacob, B.A., Easton, J.Q., and Allensworth, E. (1999) Ending social promotion:

9/29/2011 4:57 PM 108
Results from the first two years. Consortium on Chicago School Research, Chicago, Illinois.
Roderick, M., and Nagaoka, J. (2004) Ending social promotion: The effects of retention. Consortium on Chicago School Research, Chicago, Illinois.
Rosenkrantz, T. (2002) 2001 CPS test trend review: Iowa Tests of Basic Skills. Consortium on Chicago School Research, Chicago, Illinois.
SAS User’s Guide (2011) Proc MI Statement. http://support.sas.com/documentation/cdl/en/statug/63347/HTML/default/viewer.htm#statug_mi_sect004.htm
Schulz, M.E., and Nicewander, A. (2005) Grade equivalent and IRT representations of growth. Journal of Educational Measurement, vol. 34(4), 315–31.
U.S. Department of Labor (2011) Employment Projections. http://www.bls.gov/emp/ep_chart_001.htm

9/29/2011 4:57 PM 109
Endnotes 1 In the first year, students had to score at least 7.0 GEs (1.8 years below national norms). The passing score increased each year, reaching one year behind grade level by 2000. Promotion standards for third and sixth graders were implemented in 1997, with the sixth grade cut-off set at 1.5 years behind national norms, and the third grade cut-off set just one year behind national norms. 2 In math, the district raised concerns about the 87 different math curricula in use across city elementary schools and opened an office of math and science for K8, chose four curriculums, incentivized principals and teachers to participate in professional development, and then tracked to see if the students of teachers who attended professional development actually did better. In Literacy, there were a number of efforts, including AARDP( a two- to three-year focus on the extended response items on the ISAT) and some attempts to standardize early literacy assessments (out of which came the use of DIBELS, which continues). Other initiatives included Reading First, Striving Readers, and Real Men Read, pilots of “core” curriculum using basal texts, and pilots of Writing Workshop in various parts of the city. The most tangible work done was the development of “The Gold Book” (a document to guide teachers in their decision making). 3 The test was given to all students in grades three through eight; it was optional for students in grades one and two. 4 Unfortunately, the national norming samples used for the SAT 9 seem to be considerably different than those used for the ITBS. Chicago students with the same levels of performance have very different places in the distributions on the national norms provided in the two tests. 5 Diane Rado. 2010. New ISAT lets kids pass with more wrong answers: Test experts question point decline; state officials cite statistical adjustments. Chicago Tribune, October 18, 2010. Accessed 2011-4-5 at http://www.chicagotribune.com/news/education/ct-met-isat-answers-20101018,0,308277.story 6 The Illinois State Board of Education (ISBE) had always used the Rasch model for equating and scoring the ISAT. However, in 2008 there were some fears that the Rasch model (a one-parameter IRT model) was producing unusual distributions of test scores. ISBE’s Technical Advisory Board recommended changing from the Rasch model to the three-parameter logistic model for the scoring and equating of the ISAT. 7 We used Rasch scaling for both vertical and horizontal equating. A general reference to Rasch analysis can be found in: Bond, Trevor G., and Christine Fox. 2007. Applying the Rasch Model: Fundamental measurement in the human sciences. Psychology Press. 8 Grade Equivalent Units were highly criticized to the point where they are now very rarely used. The problem arises from the fact that students learn at different rates at different ages, while the GE scale implies linear growth across the entire period: one year of growth is 1 GE unit regardless of the student’s age. (See E. Matthew Schulz and W. Alan Nicewander. 2005. “Grade Equivalent and IRT Representations of Growth.” Journal of Educational Measurement. Volume 34, Issue 4, pp. 31531, December 1997.)

9/29/2011 4:57 PM 110
9 Exceeds Standards: Student work demonstrates advanced knowledge and skills in the subject. Students creatively apply knowledge and skills to solve problems and evaluate the results. Meets Standards: Student work demonstrates proficient knowledge and skills in the subject. Students effectively apply knowledge and skills to solve problems. Below Standards: Student work demonstrates basic knowledge and skills in the subject. However, because of gaps in learning, students apply knowledge and skills in limited ways. Academic Warning: Student work demonstrates limited knowledge and skills in the subject. Because of major gaps in learning, students apply knowledge and skills ineffectively. 10 http://iirc.niu.edu/Tests.aspx?isat 11 Easton, John Q, Stephen Ponisciak, and Stuart Luppescu. 2008. From high school to the future: The pathway to 20. Chicago: Consortium on Chicago School Research. 12 See the following CCSR reports for more information on student retention: Roderick, Melissa, Anthony S. Bryk, Brian A. Jacob, John Q. Easton, and Elaine Allensworth. 1999. Ending social promotion: Results from the first two years; Roderick, Melissa, and Jenny Nagaoka. 2004. Ending social promotion: The effects of retention; Jacob, Robin Tepper, Susan Stone, and Melissa Roderick. 2004. Ending social promotion: The response of teachers and students; Allensworth, Elaine. 2004. Ending social promotion: Dropout rates in Chicago after implementation of the eighth grade promotion gate. A summary of issues around using tests for promotion decisions, and research on the policies in Chicago is provided in: Allensworth, Elaine, and Jenny Nagaoka. 2010. “The effects of retaining students in grade with high stakes promotion tests.” Chapter 20 in Judith Meece (ed.), Handbook on Schools, Schooling, and Human Development, Taylor and Francis. 13 This method was used in previous test trend reports by CCSR, see Rosenkrantz, Todd. 2002. 2001 CPS Test Trend Review: Iowa Tests of Basic Skills. Chicago: Consortium on Chicago School Research, and other previous test trend reviews 14 A team may determine that a child has a learning disability if the child does not achieve commensurate with his or her age and ability. Students who failed the promotional standards multiple times were performing substantially below other students of the same age. The increase in identification of students as learning disabled in the grades with promotional standards is documented in Miller and Gladden (2002). 15 This is done through multiple imputation using PROC MI in SAS. http://support.sas.com/documentation/cdl/en/statug/63347/HTML/default/viewer.htm#statug_mi_sect004.htm 16 The ITBS was also given in first and second grades but was optional. Therefore, we do not include those data in our study of system-wide trends 17 The adjusted trends show much less fluctuations than unadjusted trends that are incorporate substantial variation due to changes in the characteristics of the test takers, as described in Chapter 2. 18 Easton, John Q., Stuart Luppescu, and Todd Rosenkranz 2006 2006 ISAT reading and math scores in Chicago and the rest of the state. Chicago: Consortium on Chicago School Research.

9/29/2011 4:57 PM 111
19 Koretz, Daniel. 2008. Measuring up: What educational testing really tells us. Cambridge, MA: Harvard University Press. pp. 24446. 20 NAEP data is from National Center for Education Statistics (2009, 2010). 21 These figures do not agree with CPS’s publicly reported statistics. For example, CPS reported that in 2005 the percentage of sixth-graders scoring at or above national norms in math was greater than 50 percent. The difference occurs because we include all test takers, not just students whose scores were included for reporting. 22 Easton, John Q, Stephen Ponisciak, and Stuart Luppescu. 2008. From high school to the future: The pathway to 20. Chicago: Consortium on Chicago School Research. 23 These values were calculated in a 2-level hierarchical model with observations nested within years. The Level 1 data are adjusted by sex, SES, age, and special education status to control for changes in these student characteristics over time. The race indicators are random at the year level, enabling us to get separate estimates for each race for every year. 24 Analysis based on publicly available NAEP data. Department of Education. Institute of Education Sciences. National Center for Education Statistics. (11/5/2002), “National Assessment of Educational Progress (NAEP) Data Files,” http://hdl.handle.net/1902.5/609759 National Archives and Records Administration. 25 Darling-Hammond and Wise, 1985; Firestone, Mayrowetz, and Fairman, 1998; Jones, Jones, and Hardin, 1999; Koretz, Barron, Mitchell, and Stecher, 1996; McNeil and Valenzuela, 2001; Cole, and Osterlind, 2008. 26 ACT benchmark scores correspond with the point at which students have at least a 50 percent chance of earning a B average during freshman year of college (ACT Inc., 2007). 27 Day, Jennifer Cheeseman, and Eric C. Newberger. 2002. The big payoff: Educational attainment and synthetic estimates of work-life earnings. Washington: U.S. Department of Commerce, Economics, and Statistics Administration, U.S. Census Bureau. 28 U.S. Department of Labor, Bureau of Labor Statistics, Economic News Release. Retrieved on 2011-7-5 at http://www.bls.gov/news.release/empsit.t04.htm 29 Balfanz, Robert, and Nettie Legters. 2006. The graduation rate crisis we know and what can be done about it. Education Week Commentary, July 12, 2006. web.jhu.edu/CSOS/graduation-gap/edweek/Crisis_Commentary.pdf 30 The four-year ninth grade cohort rates used in this report are consistent with the formula suggested by the U.S. Department of Education and the National Governor’s Association. It is similar to the methods used by CPS to produce its five-year graduation rate. However, in addition to covering a different number of years, it also differs from the district rate in that we do not count students whose transfers have not been validated as dropouts. We include them as transfers, but we examine transfer rates closely because we believe that more error is introduced by including the validation records. While we support validation of transfers, the validations must be done by July of the year that the student leaves, and this causes legitimate transfer students to be counted as dropouts. Because the district

9/29/2011 4:57 PM 112
requires validation, the leave records are generally accurate without the inclusion of the validation records. The rates we report here also differ substantially from the ISBE rate reported on the state report card. The formula for that rate is highly problematic, as reported in prior CCSR reports (see Allensworth, 2005). 31 The four-year graduation rates do not include students who transferred in or out of Chicago schools after ninth grade, so that they can be based off of the other percentages displayed in the figure. Graduation rates by age cohorts, which are provided later in this report, include students who transferred into the system at older ages. 32 Chapman, Chris, Jennifer Laird, and Angelina KewalRamni. 2010. Trends in high school dropout and completion rates in the United States: 19722008. Washington: U.S. Department of Education. Table 13, pp. 645 33 See EEPA article and CCSR report on eighth grade retention leading to higher dropout rates. 34 A full description of the issues associated with measuring graduation and dropout rates can be found in High school dropout, graduation, and completion rates: Better data, better measures, better decisions (National Research Council and National Academy of Education, 2011). 35 It is very rare for students to drop out before age 13; almost all students who do so eventually re-enroll in later years, at least for a short period of time. We include transfers into the system in these analyses, so those students who re-enroll are included in the statistics. Most of the students who drop out before high school are older than age 13, but are behind in grade level. 36 Montgomery and Allensworth (2009); Allensworth (2005). 37 Survey measures were created through Rasch analysis, which allows us to produce measures that are comparable across survey administrations by applying the same item and step difficulties to all years of data. 38 Described in Bryk, Anthony, Yeow Meng Thum, John Q. Easton, and Stuart Luppescu. 1998. Academic productivity of Chicago public elementary schools: A technical report. Chicago: Consortium on Chicago School Research. 39 http://articles.chicagotribune.com/2008-08-02/news/0808020038_1_test-scores-high-school-reading-scores-test-results 1 EXPLORE scores were only used to improve the comparison of the ITBS and ISAT and were not included in the analysis of elementary test score trends.