Embed Size (px)
Citation preview
Agriculture, Ecosystems and Environment 205 (2015) 36–47
Trends and spatial variation in water and land footprints of meat andmilk production systems in Kenya
Caroline K. Bosire a,c,*, Joseph O. Ogutu d, Mohammed Y. Said c, Maarten S. Krol a,Jan de Leeuwb, Arjen Y. Hoekstra a
aUniversity of Twente, Twente Water Centre, P.O. Box 217, 7522AE Enschede, The NetherlandsbWorld AgroforestryCentre (ICRAF), P.O. Box 30677, 00100 Nairobi, Kenyac International Livestock Research Institute (ILRI), P.O. Box 30709, 00100 Nairobi, KenyadUniversity of Hohenheim, Institute for Crop Science, Bioinformatics Unit, 70599 Stuttgart, Germany
A R T I C L E I N F O
Article history:Received 17 June 2014Received in revised form 24 February 2015Accepted 27 February 2015Available online xxx
Keywords:Water footprintLand footprintLivestock productionMeat and milkKenya
A B S T R A C T
Global consumption of livestock products is increasing steadily due to human population growth, povertyreduction and dietary changes raising the demand for already scarce freshwater and land resources. Here,we analyze the changes associated with direct and indirect use of freshwater and land for meat and milkproduction in three production systems in Kenya between the 1980s and 2000s. We use two resource useindicators, the water footprint (m3/year) and land footprint (ha), to assess changes in freshwater and landuse for cattle, goats, sheep and camels in arid, semi-arid and humid production systems. We estimateactual water and land use using Kenya-wide data for yields, feed composition and feed conversionefficiencies. Our results show that the amounts of freshwater and land resources used for production aredetermined mainly by production volumes and feed conversion efficiencies. Total water and landfootprints of milk production increased for goats, sheep and camels but decreased by half for cattle in aridand semi-arid production systems, in correspondence with similar changes in the total numbers of eachlivestock species. Green water and grazing land footprints dominated in all production systems due to thepredominance of indirect use of water to support forage production. The per unit meat footprint for cattleincreased significantly between the 1980s and 2000s in all production systems, due to adverse trends infeed conversion efficiency, while changes in the water and land footprints of other animal products weresmall, due to modest changes in all influencing factors. In contrast, national average footprints per unit ofbeef and milk show a modest decrease due to a relative shift of production to the more resource-efficienthumid production system. Given the potential increase in demand for livestock products and limitedfreshwater and land availability, feed conversion efficiencies should be improved by rehabilitatingdegraded rangelands, adopting improved breeds and using appropriate feed composition.
ã 2015 Elsevier B.V. All rights reserved.
Contents lists available at ScienceDirect
Agriculture, Ecosystems and Environment
journa l homepage : www.e l sev ier .com/ loca te /agee
1. Introduction
Depletion of natural resources by humans, particularly for foodproduction, is widely recognized as a significant threat to thesustainability of consumption (Chertow, 2000; Bac et al., 2011).Growing resource use intensities have led to groundwaterdepletion, soil loss, drying up of fresh water reserves and landdegradation globally (Meyer and Turner, 1994; Campbell et al.,
* Corresponding author at: International Livestock Research Institute (ILRI), P.O.Box 30709, 00100 Nairobi, Kenya. Tel.: +254 721391919.
E-mail addresses: [email protected] (C.K. Bosire), [email protected](J.O. Ogutu), [email protected] (M.Y. Said), [email protected] (M.S. Krol),[email protected] (J.d. Leeuw), [email protected] (A.Y. Hoekstra).
http://dx.doi.org/10.1016/j.agee.2015.02.0150167-8809/ã 2015 Elsevier B.V. All rights reserved.
2005; Oago and Odada, 2007). Despite the mounting physicalevidence of environmental degradation, the relation betweenconsumption in specific regions and its impact on the environmentin the production areas is usually not well recognised andquantified. Attempts to bridge this knowledge gap has motivatedthe development of various resource use indicators, such as thewater and ecological footprints (Rees and Wackernagel, 1996;Hoekstra and Hung, 2002).
The water footprint is an indicator of water use in relation to theproduction of consumer goods and is expressed in terms of thewater volume evaporated or polluted (Hoekstra et al., 2011). Awater footprint is composed of three components: the green, blue,and grey water footprints. The green water footprint refers to theconsumptive use of rainwater from lands used for crop productionor grazing, while the blue water footprint refers to the

C.K. Bosire et al. / Agriculture, Ecosystems and Environment 205 (2015) 36–47 37
consumptive use of water from rivers, lakes, wetlands and aquifers.Consumptive water use refers to both the volume of water thatevaporates and returns to the same catchment or to the sea andthat which is incorporated into pasture and crops. The green waterfootprint is relevant in both rain-fed and irrigated agriculture,while the blue water footprint refers to water consumption inirrigated agriculture as well as in households and industries.Thegrey water footprint is an indicator of water pollution and refers tothe volume of water that is required to assimilate pollutants suchas fertilizers, in mainly industrial production systems, in order tomeet water quality standards. The water footprint of a live animalconsists of two components: the direct water footprint related tothe drinking water and service water consumed and the indirectwater footprint of the feed (Chapagain and Hoekstra, 2003). Theland footprint is defined here as the ‘actual land used’ forproducing consumer goods and services (Erb, 2004). We distin-guished between two components: the cropland footprint and thegrazing land footprint. The land footprint is similar to the morewidely known ecological footprint and only differs in itsrepresentation of land use in terms of actual hectares (ha) insteadof normalized ‘global hectares’ (gha) (van Vuuren and Smeets,2000; Wackernagel et al., 2004). Land appropriation is typicallymeasured across five distinct land use types: cropland, grazingland, fishing ground, forest land, and built-up land.
The use of these indicators in isolation has led some authors toquestion their usefulness (Fiala, 2008; Vanham and Bidoglio,2013). This criticism can be addressed by assessing both indicatorsrather than just one of them. Only few studies have so far combinedthe water and ecological or land footprints (Hubacek et al., 2009;Ewing et al., 2012). Yet analyzes employing such a combinationmay enhance their effectiveness in sharpening our understandingof resource use dynamics and possible trade-offs (Hoekstra andWiedmann, 2014).
The footprint indicators have been applied at various spatialand temporal scales to quantify the demand exerted by humans onnatural resources (Wackernagel et al., 1999; Monfreda et al., 2004;Moran et al., 2008; Chapagain and Hoekstra, 2011; McMichael andButler, 2011; Mekonnen and Hoekstra, 2011). These studies aim touncover the indirect effect of consumers on the environment.Though thorough, these studies often only provide generaloverviews of human appropriation of freshwater and land, andonly a few account for the local heterogeneity inherent in resourceutilization (Ridoutt et al., 2011) and consider the changes over timein water and land footprints per unit of production (Zoumideset al., 2014).
In Kenya, meat and milk production shows spatial variationdriven principally by climate related agricultural productionpotential and associated land use. Market-oriented milk produc-tion primarily occurs in high altitude areas, usually classified as thehumid production system (Ngigi, 2005). The latter productionsystem constitutes the main dairy production areas in Kenya,where production is mainly by smallholder dairy farms and marketoriented. The dairy herds comprise mainly exotic-local breedcrosses and the feeding system is largely cut-and-carry anddominated by the use of Napier grass (Pennisetum purpureum)(Thorpe et al., 2000; FAO, 2005). On the other hand are the arid andsemi-arid lands (ASAL) production systems in which about 70% oflivestock is reared and where the main feeding system is extensivegrazing. The production in these systems is mainly for subsistence,with milk supply being the prime production objective. Even so,cattle offtake for beef marketing still accounts for a largeproportion of total output in these systems (Grandin, 1988; Akliluet al., 2002; Onono et al., 2013). About 22% of the cattle offtakewithin this system relates to imported cattle from neighboringcountries (Behnke and Muthami, 2011). However, increasing waterscarcity and changing land tenure arrangements in these systems
progressively hinder optimal use of the expansive land resourcesavailable in these pastoral production systems. So far, there has notbeen any study focusing on the spatial variation in the use offreshwater and land across these production systems in Kenya.
The expected change over time is intensification in both meatand milk production, a common outcome of interventions aimed atintegrating rural within national economies. In Kenya, cattlebreeding programs initially focused on improving beef cattle tomeet rising demands for beef under the Kenya Beef IndustryDevelopment Project (Kosgey et al., 2011). This involved crossingthe indigenous Zebu or Boran cattle with the exotic Simmental, thedual purpose Sahiwal and improved Boran breeds. After indepen-dence in 1963, most of these programs broke down or wereabandoned and emphasis shifted to smallholder dairy productionin the humid areas. This involved cross-breeding the exoticFriesian, Ayrshire, Guernsey and Jersey breeds with the indigenouscattle breeds, thereby increasing – the milk yields of the latterbreeds in the humid systems. The intensification of productionnecessitated by the improved breeds usually entails the use ofelevated levels of input,putting greater strain on the availablenatural resources (Erb, 2004). Given the prevailing scarcity ofresources, the increasing demand for livestock products and thedrive for intensification, especially in developing countries, there isundoubtedly a need for increased efficiency in resource use. Anassessment of the changes in efficiency of production practicesundertaken to meet the growing demands in these systems is thusan essential first step in designing strategies for improving theirefficiencies.
In this paper we use the water and land footprint indicators toexplore spatial and temporal changes in the use of freshwater andland resources for meat and milk production in Kenya. We alsoassess the factors constraining efficiency across the productionsystems between two periods, 1980s and 2000s. We then outlinehow production parameters govern the use of freshwater and landresources and, finally, make recommendations on ways to improveefficiency in water and land use.
2. Methods and data
Our analysis proceeds in four phases. As Kenyan productionsystems can be divided into distinct geographical zones in terms ofagro-ecological characteristics, the main livestock product, thescale of production and husbandry technique, we first delineatethe various production systems in Kenya. Secondly, we estimatethe number of animals and the volumes of meat and milkproduction in each of the production systems. The third stageinvolves the assignment of feed estimates to the various livestockspecies within the various production systems. Finally, wedetermine the water and land footprints of meat and milkproduction per production system in the 1980s (1977–1990) and2000s (2001–2012), and analyze the changes that have occurredover this period.
2.1. Characterizing the production systems
Robinson et al. (2011) give a literature overview of differentclassification schemes of livestock production systems. In thisstudy, we distinguish three broad categories based on a combina-tion of agro-ecological factors and production patterns: humid,semi-arid and arid production systems (Pratt and Gwynne, 1977;Grandin, 1988; Rege, 2001).
Humid production systems are located in areas receiving anaverage rainfall exceeding 800 mm, have soils of high fertility andhence high potential for biomass production and modest pest anddisease problems. In Kenya, this category covers the areas inCentral Kenya, the Central Rift Valley to Western Kenya and most of

38 C.K. Bosire et al. / Agriculture, Ecosystems and Environment 205 (2015) 36–47
the Coastal strip (Ouma et al., 2000). The semi-arid productionsystem has an average annual rainfall between 600 and 800 mm, amedium potential for biomass production and livestock produc-tion is hindered by the prevalence of trypanosomiasis. The areascovered by this production system are located in parts of Southernand Eastern Kenya, areas neighboring the humid productionsystems to the north and south and the coastal strip. The lastsystem, the arid production system, has an average annual rainfallof less than 600 mm, a low potential for biomass production andlivestock production is hindered by the prevalence of variousdiseases (Grandin, 1988; De Leeuw and Rey, 1995; Ndambi et al.,2007). Biomass production varies greatly across the systems from25 kg/ha in the humid systems to as low as 8 kg/ha in the aridsystem (Ouda, 2001). Per production system, we identified theareas within Kenya where the system occurs and collected relevantdata, such as livestock densities, production estimates and diets.
2.2. Livestock numbers in each production system
Livestock densities in the arid and semi-arid productionsystems were estimated from the aerial survey monitoring datacollected by the Kenya Directorate of Resource Surveys and RemoteSensing (DRDRS) covering 1977–2012 as part of an ongoing Kenya-wide rangeland monitoring program, described previously byNorton-Griffiths (1975) and Ottichilo et al. (2000). Flight transectswere oriented in an east-west or north-south direction dependingon the terrain. The altitude of the survey flights averaged about120 m above the ground. Two experienced and well trained rearseat observers count animals located between the rods attached tothe wing struts of the airplane. Groups of more than 10 animalswere photographed and later counted using an overhead projector.
DRSRS has conducted more than 272 aerial surveys in 22administrative counties of Kenya that fall within the arid and semi-
Table 1Parameters used to calculate annual production in three Kenyan production systems.
Parameters Livestock type
Cattle Shoats
Production System Arid Semi-arid Humid Arid
Period 1980s 2000s 1980s 2000s 1980s 2000s 1980s 2000Average number('000s)1
3126 1894 1757 1735 2093a 1638 6800 7324
Area of productionsystem (ha)2
41,510 41,510 8370 8370 7210 7210 41,510 41,510
Average density(TLU*/ha)
18 11 53 52 73 57 41 44
Offtake rate (%/yr)3 0.09 0.1 0.09 0.1 0.079 0.079 0.26 0.25
FCEmeat (kg feed DM/kg meat)3
155 175 155 175 54 56 24 27
Average lifetime (yr) 6 6 10 10 10 10 3 3
Carcass yield (kg/animal)3
127 76 127 76 152 247 13 12
Proportion of dairycattle (%)
404 404 405 405 546 546 404 404
Milk yield (kg/year/animal)3
462 328 462 328 662 1055 69 69
FCEmilk (kg feed DM/kg milk)3
4.8 4.6 4.8 4.6 3.4 3.1 0.33 0.33
Average lifetime (yr) 12 12 10 10 10 10 3 3
* 1 TLU = 250 kg.1 Department of Resource Surveys and Remote Sensing (DRSRS) (Ogutu et al., in pre
proportions of the total population in a given period as in Behnke and Muthami (20112 GIS maps of production system.3 Bouwman et al. (2005).4 De Leeuw and Wilson (1987).5 Behnke and Muthami (2011).6 Staal et al. (2001).7 Hashi, Kamoun et al. (1995).
arid regions. The surveys cover some 437,000 km2. We obtain thenet area of 437,000 km2 by deducting 75,000 km2 designated asprotected areas in which livestock access is explicitly prohibitedfrom the total area survey by DRSRS of 512,000 km2 (Bertzky et al.,2012).
Population estimates were calculated using Jolly’s Method 2(Jolly, 1969). Population size estimates and the density (number/km2) of each livestock species were averaged per grid cell (5 by5 km2) over the two time periods spanning 1977–1990 (1980s) and2001–2012 (2000s) in order to minimize the stochastic variation inthe individual survey counts.
For the humid production system, a dataset on dairy productionin the Kenyan highlands collected in 2005 and consideredrepresentative of intensive smallholder dairy production was used(Waithaka et al., 2006). We derived the 1980s livestock estimatesusing proportional contribution to total livestock numbers by eachproduction system from Behnke and Muthami (2011). To ensureconsistency in reporting of outputs per unit area, the GeographicInformation System (GIS) spatial layers of the production systemand smallholder dairy were overlaid to extract data on thenumbers of dairy cows in the production system in 2005. Toestimate the number of dairy cows in the herd for both datasets,the dominant breeds of cattle and milk production for each of thethree production systems, all the parameters defining herdcomposition and milk output per breed were extracted from theliterature (De Leeuw and Wilson, 1987; Staal et al., 2001; Bebeet al., 2003; Bouwman et al., 2005; Ngigi, 2005).
2.3. Estimating the total annual production of animal products
Various parameters from published studies and gray literaturewere used to estimate both meat and milk production in each ofthe three production systems (Table 1). The data were then used to
Camel
Semi-arid Humid Arid Semi-arid Humid
s 1980s 2000s 1980s 2000s 1980s 2000s 1980s 2000s 1980s 2000s1743 2209 1056b 1178c 718 685 7 9 0 0
8370 8370 7210 7210 41,510 41,510 8370 8370 7210 7210
52 66 37 41 4 4 0.2 0.3 0 0
0.26 0.25 0.33 0.3 0.017 0.017 0.017 0.017 0 024 27 23 24 100 100 100 100 0 0
3 3 3 3 6 6 6 6 0 013 12 9 12 233.4 233.4 233.4 233.4 0 0
405 405 405 405 42 42 42 42 0 0
69 69 0 0 547 547 547 547 0 0
0.33 0.33 0.33 0.33 6.47 6.47 6.47 6.47 0 0
3 3 3 3 10 10 10 10 0 0
ss) where a, b and c are livestock numbers derived from the DRSRS estimatesusing).

C.K. Bosire et al. / Agriculture, Ecosystems and Environment 205 (2015) 36–47 39
quantify the products, the output of each product per animal andper unit of land area. We assume that there is no milk productionby sheep and goats (lumped together during aerial surveys andreferred to as ‘shoats’ throughout this paper) in the humidproduction systems.
The total annual production of meat in each production systemwas then calculated as follows. The meat production (Pmeat[a,s],ton/yr) per animal in category a (beef cattle, camel, sheep and goat)in production system s (arid, semiarid, humid) is estimated bymultiplying the carcass yield per slaughtered animal (CY[a,s]) bythe annual number of animals slaughtered (SA[a,s]):
Pmeat½a;s� ¼ CY a; s½ � � SA a; s½ � (1)
The carcass yields for cattle and shoats were obtained fromBouwman et al. (2005).
The number of animals slaughtered in each production systemwas calculated by multiplying the total animal numbers Pop[a,s] bythe net offtake rate OR[a,s]:
SA½a;s� ¼ Pop a; s½ � � OR a; s½ � (2)
Data on offtake rates were applied as a net offtake ratefollowing Bouwman et al. (2005).
Total annual milk production (tonne) per animal for eachproduction system was calculated as follows:
Pmilk a; s½ � ¼ MY a; s½ � � DC a; s½ � (3)
where Pmilk represents the production of milk per cow or shoat inproduction system s, MY[a,s] (kg) is the milk yield per dairy cow ineach production system and DC[a,s] is the number of dairy cows ineach production system, resulting from the total number of cowsand the proportion of lactating cows from Table 1. The yieldestimate is derived by assigning the yield attributed to thepredominant breed i.e., Zebu, crossbreed or exotic, as the milk yieldestimate within a specific production system (King, 1983; Rege,2001; Staal et al., 2001; Ngigi, 2005).
2.4. Volume and composition of feeds
The diet of livestock in Kenya varies widely and depending onthe agro-ecology as well as the type and level of intensification ofthe production system (Owen et al., 2004). To estimate the spatialdistribution of feed demand, a method that allows the prediction ofdaily feed intake by using information on diet composition andquality, feed conversion efficiency and milk and/or meat produc-tion was employed. The estimation of quantities of feed, feedcomposition, sources of feed and feed yields per unit area withineach production system was made by combining parameters fromthe literature (Tables 1, 2), with the estimates of livestock numbersin (Table 1).
Table 2Feed composition for cattle, shoats and camel in three Kenyan production systems in tSource: East Africa Dairy Development Project Report 2010 (ILRI, 2010) and Ben Lukuy
Parameters Production system and livestock speciesLivestock type Cattle Shoats
Production system Arid Semi-arid Humid Arid
Time frame 1980s 2000s 1980s 2000s 1980s 2000s 1980s 2000Pasture(%) 100 100 100 99 82 79 100 100
Forages(%) 0 0 0 0 6 9 0 0
Crop residues(%) 0 0 0 1 12 12 0 0
Compounded andsupplement feeds(%)
0 0 0 0 0.04 0.04 0 0
To estimate the feed volume in each system, a relationshiplinking the feed conversion factor of the production system to theproduct output was developed (Greer and Thorbecke, 1986):
Feed½a;s� ¼ FCE½a;s� � P½a;s� (4)
Feed[a,s] (ton/yr) is the total amount of feed consumed by ananimal in category a in production system s, FCE[a,s] is the feedconversion efficiency (kg dry mass of feed/kg product) for animal ain production system s and P[a,s] (kg/yr) is the amount of product(milk, meat) produced by animal a in production system s. The feedconversion efficiencies for the 1980s and 2000s were taken fromBouwman et al. (2005) and represent aggregate values.
We distinguish the feeds into four classes: (i) pasture, whichincludes hay and silage; (ii) planted forage; (iii) crop residues; and(iv) compounded feed and supplements. The feed composition inthe humid system for cattle, which focuses on dairy, was obtainedfrom studies carried out at six sites within the East African DairyDevelopment project that estimated feed composition in thisproduction system (ILRI, 2010). For the pastoral systems – arid andsemi-arid – we assumed that livestock diet is derived solely fromnatural grazing resources for the 1980s. In the semi-aridproduction system feed composition for the 2000s, we assume aproportion of crop residue in the diet. In-depth analysis of thedietary composition was not possible due to the large area coveredin this study and the broad array of plant forage species, both ofwhich complicate collection of reliable information on the speciescomposition of the forage plants.
2.5. Water and land footprints calculations
2.5.1. Water footprints of livestock productsFor beef cattle, the calculation of water footprint is most useful
when an animal is considered at the end of its lifetime, because it isthis total that will be allocated to the various resulting products(e.g., meat, leather). For dairy cattle, it is most straightforward tolook at the water footprint of the animal per year, averaged over itslifetime, because one can easily relate this annual animal waterfootprint to its average annual milk production (Mekonnen andHoekstra, 2010b). Therefore, the water footprint of an animal canbe expressed in terms of m3/yr/animal, or, when summed over thelifetime of the animal, in terms of m3/animal. The water footprintof an animal can thus be expressed as:
WF a; s½ � ¼ WFfeed a; s½ � þ WFdrinks a; s½ � þ WFserv a; s½ � (5)
where WFfeed[a,s], WFdrinks[a,s] and WFserv[a,s] represent the waterfootprint of an animal in category a in production system s, relatedto feed, drinking water and service water consumption, respec-tively; the feed water footprint generally dominates the othercomponents by far. Service water refers to the water used forcleaning the area occupied by the animals, washing the animal andcarrying out other services necessary to maintain the environment.
he 1980s and 2000s.u (Pers.com). Where “0”represents no feed of that category in the diet.
Camel
Semi-arid Humid Arid Semi-arid Humid
s 1980s 2000s 1980s 2000s 1980s 2000s 1980s 2000s 1980s 2000s100 100 98 98 0 0 0 0 0 00 0 0 0 100 100 100 100 0 00 0 2 2 0 0 0 0 0 00 0 0 0 0 0 0 0 0 0

Fig. 1. Map of cattle, shoat and camel densities in Kenya in the three productionsystems in the (a) 1980s and (b) 2000s.
40 C.K. Bosire et al. / Agriculture, Ecosystems and Environment 205 (2015) 36–47
The water footprint for drinking and servicing estimates weretaken from Mekonnen and Hoekstra (2010b).
2.5.2. Estimating the water footprint of feed (WFfeed)The water footprint of an animal related to the feed consumed
consists of two parts: (i) the water footprint of the various feedingredients; and (ii) the water that is used to mix the feedingredients:
WFfeed a; s½ � ¼ Sn
p¼1Feed a; s; p½ � � WF�prod p½ �
� �þ WFmixing a; s½ � (6)
where Feed[a,s,p] is the annual amount of feed ingredient pconsumed by an animal in category a in production system s(tonne/yr) and WFmixing[a,s] is the volume of water consumed bymixing the feed for an animal in category a in production system s(m3/yr/animal). WF�prod p½ � is the average water footprint of thevarious crops, roughages and crop by-products p (m3/ton)weighted over the production locations. All other categories offeed than supplemental and compounded feed are assumed to beproduced and consumed within the production system. Supple-mental and compounded feed was further characterized asconsisting of maize as the main cereal. Given that maize in Kenyaoriginates from both domestic and foreign (imported) sources, weuse an average value that is weighted by the relative proportions ofdomestic production and imports (Mekonnen and Hoekstra, 2011).
WF�prod p½ � ¼ P½p� � WFprod p½ � þ Sne VWI p½ �P½p� þ Sne Pne
(7)
where WFprod[p] (m3/tonne) is the water footprint of feed productp produced in Kenya, VWI[p] (m3/tonne) the virtual water importof product p from the feed exporting nation ne,P[p] the quantity offeed product p in Kenya (tonne/yr) and Pne the quantity of theimported feed product p from the exporting country ne (tonne/yr).
2.5.3. The water footprint of feed ingredientsThe water footprints of the various crops, roughages and crop
by-products (WF�prod½p�, m3/ton) that are eaten by cattle and shoatshave been calculated following the method of Hoekstra andChapagain (2008). The water footprints of feed crops wereestimated using a crop water use model that estimates crop waterfootprints at a 5 � 50 spatial resolution globally (Mekonnen andHoekstra, 2011) and aggregated to the scale of the three previouslydescribed Kenyan production systems. Grey water footprints wereestimated by considering only leaching and runoff of nitrogenfertilizers (Mekonnen and Hoekstra, 2010a).
2.5.4. Land footprint of livestock productsOur focus is mainly on production of livestock products, which
includes direct use of pastures, but also the land associated withproduction of animal feed. Therefore, livestock production isassociated with both grassland and cropland. Cropland, the mostproductive land use type, consists of the area required to grow allcrop products. Grazing land has lower productivity than thecroplands and consists of grasslands – cultivated and natural –
used to provide feed to animals (Borucke et al., 2013). Standardcalculations of ecological footprint apply equivalence factors tostandardize land types, since not all land is equally productive(Wackernagel et al., 1999; Borucke et al., 2013). The equivalencefactor ensures that the total land used at the global scale will beequal to the total available land used. Our categorization of theproduction systems based on the agro-ecological factors, accountsfor low productivity of marginal grasslands that differ fromgrasslands in high potential lands. Differences in yield andenvironmental impact on the grasslands in low and high potentiallands determine the use of this resource. As we intend to assess the
actual amount of land used for livestock production in Kenya, wedo not apply the equivalence factors in our calculations.
We attributed land area associated with the production of feedcrops to each livestock product considering (i) the feed consumedper animal, (ii) country specific yields, (iii) domestic productionand import of the different feed crops. Land use associated withgrass production is based on grassland production and corre-sponding yield in the three production systems previously outlinedfor Kenya. By using local yields, we ensure that the calculated areais representative of the actual area used for production in Kenya

C.K. Bosire et al. / Agriculture, Ecosystems and Environment 205 (2015) 36–47 41
(van Vuuren and Smeets, 2000). The land use (ha) within aproduction system is estimated based on the land used fordomestic production minus those related to exports plus thoserelated to imports. For all categories of feed except compoundedfeed and supplements, we assume that there is no import or exportof these feed components from the production system. For thecategory of supplement and compounded feeds, that onlyconsiders maize germ as the main cereal in the feed, we useimport and export values in the calculation by extending Eq. (7) asfollows:
Landusep;s ¼Prodp;s
Yp;sþ S
ne
IMPp;sYp;ne
� EXPp;sY�p;s
(8)
where Land_usep,s (ha) is land area associated with the productionof feed product p in production system s, IMP (tonne/yr) theimported quantity of feed product p from exporting nation ne, EXP(tonne/yr) the quantity of feed product p exported from Kenya. Yp,s(tonne/ha) the annual yield of product p in Kenya, Yp;ne (tonne/ha)the yield of product p in the exporting country and Y�
p;s (tonne/ha)the weighted average of local production yield and import yield.For domestically produced feed we use local yield calculations forthe specific production system. For the exported products we use aweighted average yield, while for imported products, the yields ofthe source countries are used.
3. Results
3.1. Changes in the numbers and distributions of cattle and shoats inthe arid, semi-arid and humid production systems
Cattle, shoat and camel densities showed opposite trendsbetween the 1980s and 2000s as shown in Fig. 1. Cattle numbersdeclined by 22% in the humid and 39% in the arid productionsystems between the 1980s and the 2000s. However, the declinewas not uniform across the production systems as cattle densities
Fig. 2. The total meat and milk production (left vertical axis) and total number (right ver1980s and 2000s.
increased in parts of the semi-arid production system borderingthe coastal strip. Shoat densities increased across all theproduction systems, with the highest increase (27%) recorded inthe semi-arid production system between the 1980s and 2000s.The highest increase in camel density was observed for the semi-arid production system, where their numbers went up by 27%.
3.2. The water and land footprints of milk and meat production
3.2.1. Total water and land footprints of meat and milk productionIn both the 1980s and the 2000s, shoats outnumbered all the
other species (Fig. 2). However, cattle dominated the production ofmeat and milk in both periods and across all the productionsystems. Shoat production of meat and milk in the arid productionsystem in the 2000s was similar to that of cattle despite the factthat shoats were about four times as many. Fig. 3, presents the totalwater and land footprint for milk and meat production. The totalwater footprint of meat production was 15–44 times larger thanthe corresponding water footprint of milk production for all thelivestock species across the production systems. The total waterfootprint of milk and meat production was largest in the aridproduction system. For cattle, the water footprint droppeddramatically between the 1980s and 2000s, except in the humidproduction system. However, the water footprint for shoatproduction showed a persistently larger water footprint in the2000s than the 1980s.
The cattle land footprint showed an overall trend similar to thatfor the water footprint, with a general decrease evident betweenthe 1980s and the 2000s. Production of meat and milk had thelargest land footprint in the arid production system. Land footprintof milk production by cattle was similar between the 1980s in thearid and the 1980s and 2000s in the humid production systems.Cattle land footprint of milk and meat production in the humidproduction system increased by 7% and 25%, respectively, despite a22% decline in cattle numbers between the 1980s and 2000s.
tical axis) of cattle, shoats and camel in Kenya in the three production systems in the

42 C.K. Bosire et al. / Agriculture, Ecosystems and Environment 205 (2015) 36–47
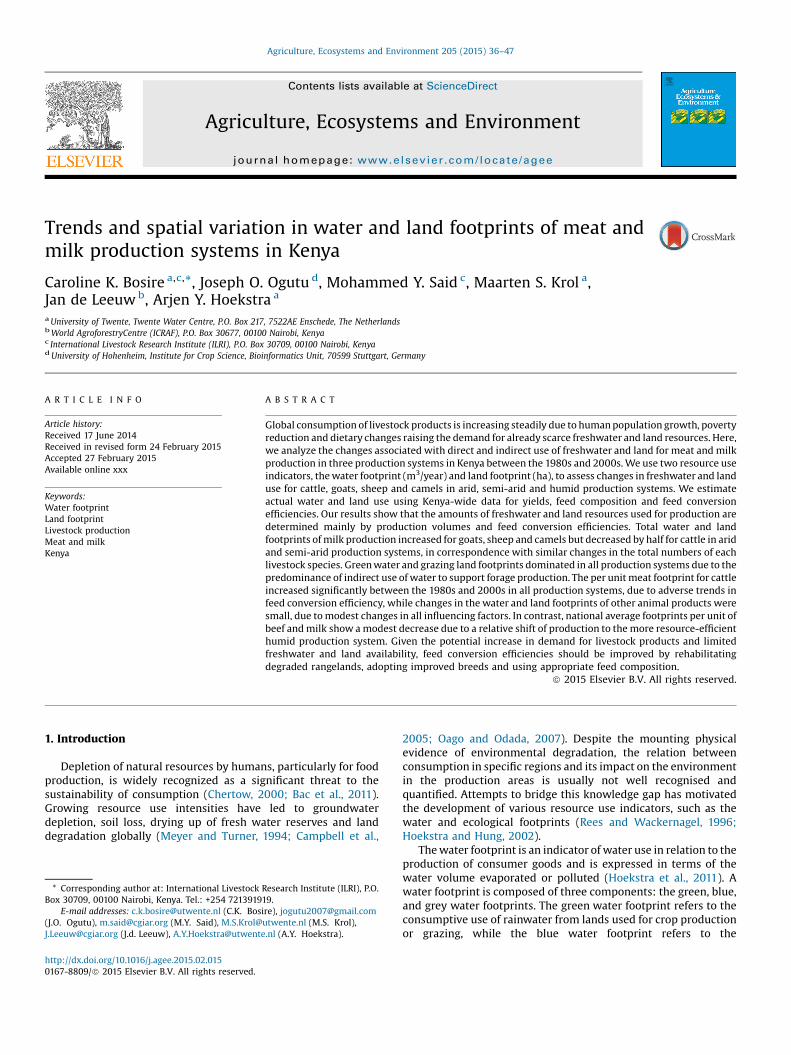
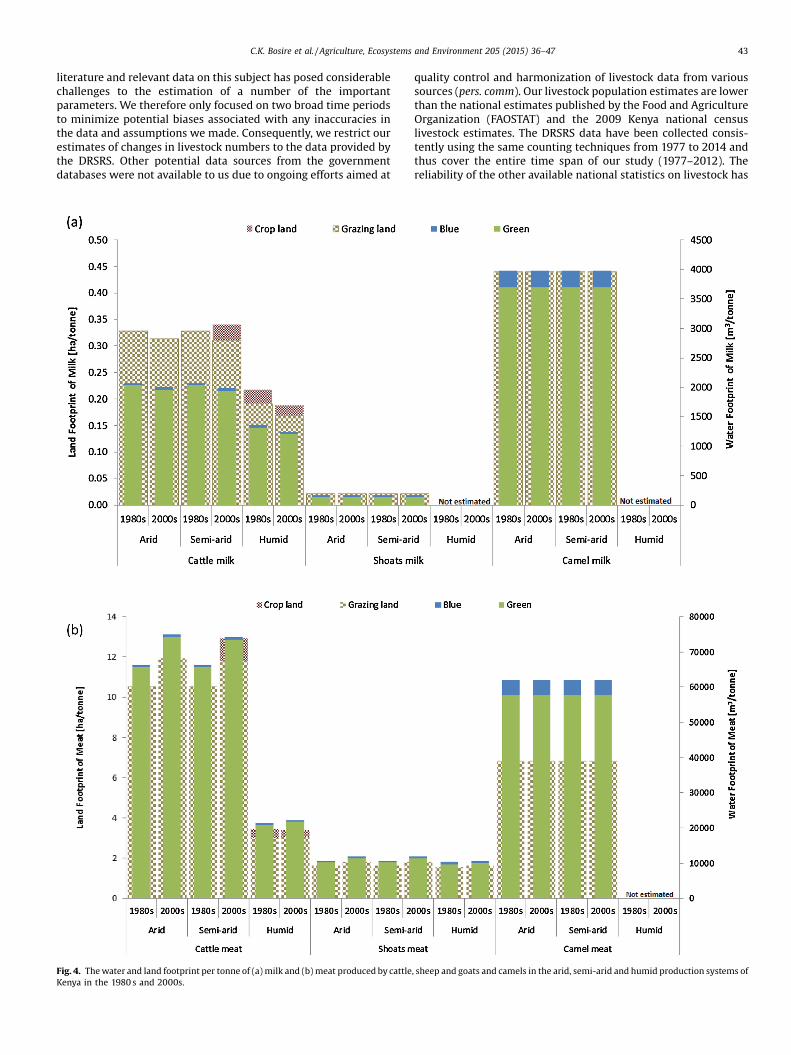
3.2.2. Contribution of green and blue water footprints to productfootprint
Fig. 4 shows the proportion of green and blue water footprintsper tonne of milk and meat produced. There was considerablevariation in the green and blue water footprint of milk and meatacross the production systems. A grey footprint is present butrepresents only a very small proportion of the footprint per tonneof product. The grey footprint therefore does not show in thefigures and we do not carry it forward in the analysis. Milkproduction had a higher proportion of blue to green waterfootprint than meat production did. The contribution of blue waterfootprint to the total water footprint per tonne of milk producedranged from 2% to 19% across all production systems. Milkproduction by shoats showed a higher percentage (19%) of bluewater footprint in the arid and semi-arid production system thanthat exhibited by milk production from cattle (2%) in the samesystems. The blue water footprint of camel milk production of 7%falls between that of cattle and shoats. The green water footprintdominated the production of meat by cattle, shoats and camelsacross all the three production systems. The proportion of bluewater footprint out of the product total, associated with meatproduction ranged from 1 to 7%. The increase in the water and landfootprints per tonne of meat production for both cattle and shoatsbetween the 1980s and the 2000s is mostly due to worsened feedconversion efficiency for meat production; conversely, improvedfeed conversion efficiency for milk production leads to reducingfootprints per tonne of milk for most animal species andproduction systems. In the 1980s, the water footprint of milkproduction in the humid system was closer to that in the arid andsemi-arid systems than in the 2000s. This is indicative of asimilarity in breeds and feeds in all the three production systems inthe 1980s. For the 2000s, there is a huge gap between the milkyield in the arid and semi-arid production systems and the humidsystem due to the enhanced productivity associated with breed
Fig. 3. The total water (left vertical axis) and land (right vertical axis) footprint of meat an
improvement and increase in milk yield per cow, which loweredthe water footprint of productionper tonne.
3.2.3. Grazing and cropland footprint per tonne of animal productThe grazing land footprint dominated the production of milk
and meat across all production systems between the 1980s and2000s (Fig. 4). In the arid and semi-arid production systems, theland footprint of cattle and shoat meat production increasedbetween the 1980s and 2000s. In the humid production system, bycontrast, there was a slight decrease in grazing and croplandfootprints for beef production. There was a decrease in the landfootprint per tonne of cow milk between the 1980s and 2000s. Thegrazing land footprint of beef production was about 30 times largerthan that of the grazing land footprint of milk production.
The grazing land footprint of milk production by cattle waslarger for the arid and semi-arid systems than for the humidproduction system. Similarly, cropland requirement for milkproduction by cattle was higher for the semi-arid than for thehumid production system. Camel milk production had the largestgrazing land footprint, though their feed composition wasassumed to be 100% natural forage. Camel feed is defined asforage but because their range is confined to arid and semi-aridsystems, we assigned their land footprint to the grazing compo-nent. In the arid and semi-arid production systems, the landfootprint of a ton of camel milk was 1.3 and 18 times larger than theland footprint of cattle and shoat milk, respectively. Shoats showedthe smallest land footprint in the humid production system.
4. Discussion
4.1. General limitations of data and scope of conclusions
This study is the first to quantify changes in ruminant numbersand resource use over a 30-year period in Kenya. The dearth of local
d milk production in Kenya in the three production systems in the 1980s and 2000s.
C.K. Bosire et al. / Agriculture, Ecosystems and Environment 205 (2015) 36–47 43
literature and relevant data on this subject has posed considerablechallenges to the estimation of a number of the importantparameters. We therefore only focused on two broad time periodsto minimize potential biases associated with any inaccuracies inthe data and assumptions we made. Consequently, we restrict ourestimates of changes in livestock numbers to the data provided bythe DRSRS. Other potential data sources from the governmentdatabases were not available to us due to ongoing efforts aimed at
Fig. 4. The water and land footprint per tonne of (a) milk and (b) meat produced by cattleKenya in the 1980 s and 2000s.
quality control and harmonization of livestock data from varioussources (pers. comm). Our livestock population estimates are lowerthan the national estimates published by the Food and AgricultureOrganization (FAOSTAT) and the 2009 Kenya national censuslivestock estimates. The DRSRS data have been collected consis-tently using the same counting techniques from 1977 to 2014 andthus cover the entire time span of our study (1977–2012). Thereliability of the other available national statistics on livestock has
, sheep and goats and camels in the arid, semi-arid and humid production systems of

44 C.K. Bosire et al. / Agriculture, Ecosystems and Environment 205 (2015) 36–47
not been quantified and glaring discrepancies were reportedfollowing the 2009 census. These other national livestock statisticsare also not based on the same and consistent samplingmethodology (Dietz et al., 2014; Robinson et al., 2014). The DRSRSdata were also amenable to classification into the broadheterogeneous production systems used in this study, but thiswas not possible to do reliably using the other occasional data sets.Enhancing the consistency, reliability and frequency of thelivestock surveys at the national level in Kenya would be necessaryto ensure accuracy of future parameter estimates by similar studieslooking at long term changes in the livestock production systems.We assumed that the extent of the production systems remainedeffectively unchanged over the 30-year study period. Thisassumption may have been partially violated if agro-climaticchanges in some of the production systems were sufficient toengender substantial transitions in pastoral livelihood strategies(Jones and Thornton, 2009). Although quantifying and incorporat-ing such changes in the production systems in our analysis wouldbe desirable, doing so would add a layer of considerable complexityto the analysis and take us beyond the scope of this study.Additionally, our assumption of limited change over the 1977–2012study period is consistent with the use of 1970–2000 as the baseperiod for defining the livestock production systems (Robinsonet al., 2011).
Our analysis focused on the biophysical processes underlyingresource use and did not consider economic aspects. Additionally,the lack of consistent data sources on the changes in suchparameters as feed composition and carcass and milk yieldsprecluded computing yearly estimates of freshwater and land use.
4.2. Combining water and land footprints to enhance assessment ofresource demands for milk and meat production
Similar patterns and developments were found for the greenand blue water and the grazing and cropland footprints in meatand milk production. The reason is that water and land require-ments largely go together. As a rule we can expect and we observedindeed that greater land requirements are accompanied by greatergreen water consumption. With a shift toward more supplementand compounded feed, we can expect a shift toward greatercropland footprint and, in case of irrigated crops, a greater bluewater footprint. We did not observe such development for thehistorical period studied, because intensification of livestock inKenya hardly occurred.
4.3. Decline in cattle numbers and increased importance of shoats andcamels for subsistence
The increase in the number of shoats and concurrent decline inthe number of cattle between the 1980s and 2000s, whatever itscause, points to the growing importance of small stock to thelivelihoods of the Kenyan pastoral communities. The decline incattle numbers in the arid and semi-arid production systems isreflected in the significant decrease in both the total water and landfootprints of cattle production between the 1980s and 2000s. Inthe same vein, the increase in the number of shoats wasaccompanied by an increase in the total water and land footprintsfor shoats between 1980s and 2000s. This indicates an upsurge inthe importance of shoats as a source of meat and milk. Despitetheir continued increase in numbers, shoats still have the lowestdemand on water and land resources. This finding is bothinteresting and important, especially when considering optionsfor reducing pressure on potentially scarce resources, which wouldfavor a shift toward shoat products. The decrease in the total landand water footprint of milk and meat production by camel in thearid production system and increase in the semi-arid production
system is indicative of increasing adoption of this drought resistantspecies by farmers in the semi-arid system. The livestock declines,especially of cattle, are linked to an increase in the frequency andseverity of droughts between the 1980s and 2000s (Jones andThornton, 2009). The increase in the number of sheep and goats,both of which use less water and land resources than cattle, in thearid and semi-arid production system, offers the livestockproducers the opportunity to continue meeting their meat andmilk production goals in the prevailing more arid climaticconditions.
4.4. Dominance of cattle in freshwater and land use toward milk andmeat production
Despite their decline in total numbers, cattle still contributemost to the total meat and milk production and total water andland footprints of meat and milk production in the three Kenyanproduction systems. This highlights the overall importance ofcattle in resource use for meat and milk production in Kenya. Thetrends observed in water and land use by cattle are, however, notuniform across the systems. For instance, in the semi-aridproduction system, the cropland footprint associated with theproduction of a ton of beef and milk by cattle, is much larger thanthat for the humid system. However, given that the quality andcomposition of the diet of cattle in the humid production systemtends toward intensification of production by the introduction ofcompounded and supplemental feeds, we expect a larger croplandfootprint in the future and possibly a larger blue water footprint inthis system. The poor diets in the semi-arid system between thetwo periods, combined with the declining trend in feed conversionefficiency for meat are the main causes of this apparent largerdemand for cropland. The livestock farmers focus on enhancingyield by upgrading their breeds but not also concurrently investingin feed improvement, so that feeds continue to constrain milk andmeat production in the three production systems.
4.5. Effect of productivity changes on water and land footprints
Table 3 shows the proportion of green and blue water footprintper tonne of milk and meat produced and compares this to thework by Mekonnen and Hoekstra (2012). Our estimates for aridand semi-arid systems can best be compared to the estimates forgrazing systems in Mekonnen and Hoekstra (2012), and ourestimates for the humid system with their estimate for mixedsystems. Our estimates of the water footprints of milk productionare similar to the estimates by Mekonnen and Hoekstra (2012).Beef production showed the largest difference in values betweenthe two, primarily due to differences in the assumed feedconversion efficiency and feed composition. We used detailedlocal and regional data that are a factor of two or larger than thoseused by Mekonnen and Hoekstra (2012). In both studies, greenwater was the predominant water footprint component. A largerproportion of blue water in the total water footprint with thisimproved productivity would be associated with the inclusion of acropland footprint for irrigated feed production. If such improvedproductivity were to be realized, then the resultant increases inblue water footprints and cropland footprints for livestockproduction would potentially enhance competition for naturalresources required for feed and food production. Our study did notinclude data on the industrial livestock production system in Kenyaas it was deemed quantitatively negligible at the national scale ofthis study. The industrial production system reported in Mekonnenand Hoekstra (2012) has a water footprint of an order of magnitudelower than any of the production systems we examined. However,if it were to become prevalent, it would require more cropland thanany of the systems considered in this study, with a potential

Table 3The estimated green, blue and grey water footprint per tonne of milk and meat produced by cattle, shoat and camel compared to the estimates by Mekonnen and Hoekstra(2012).
Parameters Production system
Production system Grazing system Arid and semi-Arid Mixed system Humid Industrial
Kenya Mekonnen and Hoekstra,2012
Current study Mekonnen and Hoekstra,2012
Current study Mekonnen and Hoekstra,2012
Water footprint m3/ton Meat Milk Meat Milk Meat Milk Meat Milk Meat Milk
Cattle Green 38,370 1300 74,300 2000 10,760 900 21,800 1200 3200 –
Blue 180 40 700 50 190 100 500 30 100 –
Grey 0 0 0 0 0 0 0 0 – –
Total 38,540 1300 75,000 2000 10,940 1000 22,300 1240 3300 –
Shoats Green 11,200 11,500 140 5170 10,000 2400 –
Blue 400 600 30 400 600 400 –
Grey 0 0 0 540 0 – –
Total 11,600 12,000 170 6110 10,600 2800 –
Camel Green 577,40 3700Blue 4440 300Grey 0 0Total 62,180 4000
C.K. Bosire et al. / Agriculture, Ecosystems and Environment 205 (2015) 36–47 45
increase in the blue water footprint as well. Our results show thatpoor feed conversion efficiency has a large impact on the efficiencywith which freshwater and land resources are utilized, in accordwith other studies (Herrero et al., 2013). Beef production has largerwater and land footprints per tonne than shoats and camel due tohigher conversion efficiencies for the latter two species. Dietcomposition and quality also determine the magnitude of thewater and land footprints of meat and milk production. Improveddiets translate to better feed conversion and, eventually, to moreefficient use of freshwater and land. This is demonstrated by cattlein the humid system. Their slightly better feed conversionefficiency in the 2000s relative to the 1980s mirrors the increasein the proportions of cross and pure bred cattle and of compoundedand supplemental feeds. Nonetheless, the productivity of theimproved cattle breeds in the humid production system is stillrelatively low because cattle diets have not correspondinglyimproved in Kenya to levels approximating those recommendedfor optimal yields.
5. Conclusion and recommendations
The demand for water and land for meat and milk production ismainly determined by the total numbers, feed conversionefficiency and diet composition of livestock. For cattle milk andmeat, the study revealed that the humid production system hadthe smallest water and land footprints per tonne. Furthermore, thestudy showed that the water and land footprints for milk and meatfrom sheep and goats are much smaller than for cattle and camels.
There are many opportunities to improve the water and landuse efficiency in meat and milk production in the arid and semi-arid production systems. Interventions such as rangeland rehabili-tation to improve biomass availability and diet quality andbreeding to increase growth rates and carcass yields can enhancethe feed conversion efficiency and, in turn, lead to efficiency gainsin natural resources use. Lower water and land requirements bymilk production in these systems, may support the conclusion thatit is better to produce milk and not meat in the arid and semi-aridsystems. However, milk production in the arid and semi-aridsystems is mainly constrained by political, social and environmen-tal impediments such as limited access to markets and inputs,including high quality feeds. Production in the humid system is themost resource efficient way to produce both cattle meat and milk.The proximity to markets and cross-breeding with exotic animalshas favored the focus on milk production. Diet quality has however
not developed in tandem with the improvement in breeds, thusconstraining the feed conversion efficiency. Using fodder cropsthat can be intercropped, and crop residues that do not competedirectly with food production is one way to improve the livestockdiets in the humid system with low potential for conflicts. There isthus a pressing need for research focusing on advancing ourunderstanding of the factors constraining the uptake of betterfeeding strategies and more investment in improved feedproduction.
Although cattle meat and milk in the humid system are moreresource efficient than in the arid and semi-arid systems, there aremany competing claims to the available land and water resources.On the other hand, in arid and semi-arid systems, there are fewercompeting demands other than setting areas aside for wildlifeconservation and emergence of some cropping in the semi-aridregions. We therefore think that meat production should be carriedout in the arid and semi-arid areas insofar possible without conflictwith crop production where viable and wildlife protection.Drought and disease resistance associated with the indigenouslivestock breeds in the arid and semi-arid systems provides anadded advantage to the focus on meat production in these areas.Meat production would also limit the competition with biodiver-sity conservation by minimizing land use changes and indigenousspecies losses (Renwick et al., 2014). In addition, the livestockproduction in the rangelands has other attendant benefits such aswealth accumulation and other cultural roles that are not capturedby the purely biophysical assessment we carried out. If thesealternative attributes of livestock production are incorporated,then there should be a potential further reduction in the water andland use for meat production in these systems. Finally, anunderstanding of the sustainability of the current meat and milkproduction practices and implications of attempts to optimizeinteraction of the production parameters governing resource useefficiency in each system would enrich our capacity to develop themost resource efficient production practices.
Using both water and land footprints as indicators can deepenour appreciation of the interplay between the management of thetwo key resources demanded by livestock production – land andwater. Additionally, we provide empirical evidence that canenhance our understanding of the key constraints to improvingthe efficiency of livestock production in Kenya. Finally, our resultscan guide efforts aimed at improving freshwater and land useefficiency for the specific production systems we studied andpossibly other similar systems elsewhere.

46 C.K. Bosire et al. / Agriculture, Ecosystems and Environment 205 (2015) 36–47
Acknowledgments
CKB was funded by the NUFFIC Netherlands FellowshipProgramme The contribution by MS and JdL was supported bythe CGIAR Research Program on Drylands (CRP 1.1). We thankNicholas Ndiwa, Mats Lannerstad and Ben Lukuyu for suggestionsthat helped improve earlier drafts of this paper. We would also liketo thank two anonymous reviewers for their constructiveassessment of an earlier draft of this paper.
References
Aklilu, Y., Irungu, P., Reda, A., 2002. An audit of the livestock marketing status inKenya, Ethiopia and Sudan. Community-Based Animal Health and ParticipatoryEpidemiology Unit, Pan African Programme for the Control of Epizootics (PACE).Organization of African Unity/Inter African Bureau for Animal Resources (AU-IBAR), Nairobi
Bac, D., Badulescu, A., Lang, E., 2011. Excesses and challenges of the economicgrowth. A brief history: from Malthus to Al Gore. Actual Probl. Econ. 117,281–289.
Bebe, B.O., Udo, H.M.J., Rowlands, G.J., Thorpe, W., 2003. Smallholder dairy systemsin the Kenya highlands: cattle population dynamics under increasingintensification. Livest. Prod. Sci. 82, 211–221.
Behnke, R., Muthami, D., 2011. The Contribution of Livestock to The KenyanEconomy. IGAD LPI Working Paper
Bertzky, B., Corrigan, C., Kemsey, J., Kenney, S., Ravilious, C., Besançon, C., Burgess, N.,2012. Protected Planet Report 2012: Tracking Progress Towards Global TargetsFor Protected Areas. IUCN and UNEP-WCMC, Gland, Switzerland andCambridge, UK
Borucke, M., Moore, D., Cranston, G., Gracey, K., Iha, K., Larson, J., Lazarus, E.,Morales, J.C., Wackernagel, M., Galli, A., 2013. Accounting for demand andsupply of the biosphere’s regenerative capacity: the national footprint accounts’underlying methodology and framework. Ecol. Indic. 24, 518–533.
Bouwman, A.F., Van der Hoek, K.W., Eickhout, B., Soenario, I., 2005. Exploringchanges in world ruminant production systems. Agric. Syst. 84, 121–153.
Campbell, D.J., Lusch, D.P., Smucker, T.A., Wangui, E.E., 2005. Multiple methods inthe study of driving forces of land use and land cover change: a case study of SEKajiado District, Kenya. Hum. Ecol. 33, 763–794.
Chapagain, A., Hoekstra, A.Y., 2003. Virtual water flows between nations in relationto trade in livestock and livestock products. Value of Water Research ReportSeries No. 13, Delft, Netherlands.
Chapagain, A.M., Hoekstra, A.Y., 2011. The blue, green and grey water footprint ofrice from production and consumption perspectives. Ecol. Econ. 70, 749–758.
Chertow, M.R., 2000. The IPAT equation and its variants. J. Ind. Ecol. 4, 13–29.De Leeuw, P., Rey, B., 1995. Analysis of current trends in the distribution patterns of
ruminant livestock in tropical Africa. People 11, 24.De Leeuw, P.N., Wilson, R.T., 1987. Comparative productivity of indigenous cattle
under traditional management in sub Saharan Africa. Quart. J. Int. Agric. 26,377–390.
Dietz, T., Foeken, D., Soeters, S., Klaver, W., 2014. Agricultural dynamics and foodsecurity trends in Kenya. Development Regimes in Africa Project. OverseasDevelopment Institute, London, UK
Erb, K.-H., 2004. Actual land demand of Austria 1926–2000: a variation onecological footprint assessments. Land Use Policy 21, 247–259.
Ewing, B.R., Hawkins, T.R., Wiedmann, T.O., Galli, A., Ercin, A.E., Weinzettel, J., Steen-Olsen, K., 2012. Integrating ecological and water footprint accounting in a multi-regional input–output framework. Ecol. Indic. 23, 1–8.
FAO, 2005. Kenya country report. Irrigation in Africa in Figures, AQUASTAT Survey2005. Food and Agriculture Organisation of the United Nations, Rome, Italy
Fiala, N., 2008. Measuring sustainability: why the ecological footprint is badeconomics and bad environmental science. Ecol. Econ. 67, 519–525.
Grandin, B.E., 1988. Wealth and pastoral dairy production: a case study fromMaasailand. Hum. Ecol. 16, 1–21.
Greer, J., Thorbecke, E., 1986. A methodology for measuring food poverty applied toKenya. J. Develop. Econ. 24, 59–74.
Herrero, M., Havlík, P., Valin, H., Notenbaert, A., Rufino, M.C., Thornton, P.K.,Blümmel, M., Weiss, F., Grace, D., Obersteiner, M., 2013. Biomass use,production, feed efficiencies, and greenhouse gas emissions from globallivestock systems. Proc. Natl. Acad. Sci. 110, 20888–20893.
Hoekstra, A., Chapagain, A., Aldaya, M., Mekonnen, M., 2011. The Water FootprintAssessment Manual: Setting The Global Standard. Earthscan, London, UK
Hoekstra, A.Y., Chapagain, A.K., 2008. The global component of freshwater demandand supply: an assessment of virtual water flows between nations as a result oftrade in agricultural and industrial products. Water Int. 33, 19–32.
Hoekstra, A.Y., Hung, P., 2002. Virtual water trade. A quantification of virtual waterflows between nations in relation to international crop trade. Value of waterresearch report series, 11. UNESCO-IHE, Delft, The Netherlands..
Hoekstra, A.Y., Wiedmann, T.O., 2014. Humanity’s unsustainable environmentalfootprint. Science 344, 1114–1117.
Hubacek, K., Guan, D., Barrett, J., Wiedmann, T., 2009. Environmental implications ofurbanization and lifestyle change in China: ecological and water footprints. J.Clean. Prod. 17, 1241–1248.
ILRI, 2010. East African Dairy Development Project Baseline Survey: Feeds andFeeding Practices. ILRI
Jolly, G., 1969. Sampling methods for aerial censuses of wildlife populations. EastAfr. Agric. Forest. J. 34, 46–49.
Jones, P.G., Thornton, P.K., 2009. Croppers to livestock keepers: livelihoodtransitions to 2050 in Africa due to climate change. Environ. Sci. Policy 12,427–437.
King, J.M., 1983. Livestock water needs in pastoral Africa in relation to climate andforage. Research Reports. International Livestock Centre for Africa, Addis AbabaEthiopia
Kosgey, I., Mbuku, S., Okeyo, A., Amimo, J., Philipsson, J., Ojango, J., 2011. Institutionaland Organizational Frameworks for Dairy and Beef Cattle Recording in Kenya: aReview and Opportunities for Improvement, 48. Animal Genetic ResourcesãFood and Agriculture Organization of the United Nations, pp. 1–11.
McMichael, A.J., Butler, C.D., 2011. Promoting global population health whileconstraining the environmental footprint. Ann. Rev. Public Health 32, 179–197.
Mekonnen, M.M., Hoekstra, A.Y., 2010a. A global and high-resolution assessment ofthe green, blue and grey water footprint of wheat. Hydrol. Earth Syst. Sci. 14,1259–1276.
Mekonnen, M.M., Hoekstra, A.Y., 2010b. The Green, Blue and Grey Water Footprintsof Farm Animals and Animal Products. UNESCO-IHE Institute for WaterEducation
Mekonnen, M.M., Hoekstra, A.Y., 2011. The green, blue and grey water footprint ofcrops and derived crop products. Hydrol. Earth Syst. Sci. 15, 1577–1600.
Mekonnen, M.M., Hoekstra, A.Y., 2012. A global assessment of the water footprint offarm animal products. Ecosystems 15, 401–415.
Changes in Land Use and Land Cover: A Global Perspective. In: Meyer, B.M., Turner,B.L. (Eds.), Press Syndicate of the University of Cambridge, Great Britain
Monfreda, C., Wackernagel, M., Deumling, D., 2004. Establishing national naturalcapital accounts based on detailed Ecological Footprint and biological capacityassessments. Land Use Policy 21, 231–246.
Moran, D.D., Wackernagel, M., Kitzes, J.A., Goldfinger, S.H., Boutaud, A., 2008.Measuring sustainable development – nation by nation. Ecol. Econ. 64, 470–474.
Ndambi, O.A., Hemme, T., Latacz-Lohmann, U., 2007. Dairying in Africa – status andrecent developments. Livest. Res. Rural Develop. 19 Article #111. RetrievedMarch 9, 2015, from http://www.lrrd.org/lrrd19/8/ndam19111.htma
Ngigi, M., 2005. The case of smallholder dairying in Eastern Africa.Norton-Griffiths, M., 1975. Counting Animals. African Wildlife Leadership
FoundationOago, D.O., Odada, E.O., 2007. Sediment impacts in Africa’s transboundary lake/river
basins: case study of the east African great lakes. Aquat. Ecosyst. Health 10,23–32.
Ogutu, J., Piepho, H.-P., Said, M., Ojwang', G., Kifugo, S.C., Wargute, P.W., Njino, L.W.,2015. Extreme wildlife declines and concurrent increase in livestock numbers inKenya rangelands. PLoS One. In press
Onono, J.O., Wieland, B., Rushton, J., 2013. Productivity in different cattle productionsystems in Kenya. Trop. Anim. Health Product. 45, 423–430.
Ottichilo, W.K., Grunblatt, J., Said, M.Y., Wargute, P.W., 2000. Wildlife and livestockpopulation trends in the Kenya rangeland. Wildlife Conservation by SustainableUse. Springer, pp. 203–218.
Ouda, J.O., 2001. Feeding and care of livestock. Managing Dryland Resources. AManual for Eastern and Southern Africa. International Institute for RuralReconstruction (IIRR)
Ouma, E., Staal, S., Omore, A., Wanjohi, P., Njoroge, L., Njubi, D., 2000. ConsumptionPatterns of Dairy Products in Kenya. KARI/MoARD/ILRI Report
Owen, E., Smith, T., Steele, M., Anderson, S., Duncan, A., Herrero, M., 2004.Responding To The Livestock Revolution: The Role Of Globalisation andImplications For Poverty Alleviation. Nottingham University Press
Rangeland Management and Ecology in East Africa. In: Pratt, D.J., Gwynne, M.D.(Eds.), Hodder and Stoughton, London
Rees, W., Wackernagel, M., 1996. Urban ecological footprints: why cities cannot besustainable – and why they are a key to sustainability. Environ. Impact Assess.Rev. 16, 223–248.
Rege, J., 2001. Zebu cattle of Kenya: Uses, performance, farmer preferences,measures of genetic diversity and options for improved use. ILRI (aka ILCA andILRAD).
Renwick, A.R., Vickery, J.A., Potts, S.G., Bolwig, S., Nalwanga, D., Pomeroy, D.E.,Mushabe, D., Atkinson, P.W., 2014. Achieving production and conservationsimultaneously in tropical agricultural landscapes. Agric. Ecosyst. Environ. 192,130–134.
Ridoutt, B.G., Sanguansri, P., Harper, G.S., 2011. Comparing carbon and waterfootprints for beef cattle production in Southern Australia. Sustainability 3,2443–2455.
Robinson, T., Thornton, P., Franceschini, G., Kruska, R., Chiozza, F., Notenbaert, A.,Cecchi, G., Herrero, M., Epprecht, M., Fritz, S., 2011. Global Livestock ProductionSystems. Food and Agriculture Organization of the United Nations (FAO)
Robinson, T.P., Wint, G.R.W., Conchedda, G., Van Boeckel, T.P., Ercoli, V., Palamara, E.,Cinardi, G., D'Aietti, L., Hay, S.I., Gilbert, M., 2014. Mapping the globaldistribution of livestock. Plos One 9, e96084.
Staal, S., Owango, M., Muriuki, H., Kenyanjui, M., Lukuyu, B., Njoroge, L., Njubi, D.,Baltenweck, I., Musembi, F., Bwana, O.,2001. Dairy systems characterisation ofthe greater Nairobi milk shed. Smallholder Dairy Project (SDP (R & D)), MALDM,KARI, ILRI.
Thorpe, W., Muriuki, H., Omore, A., Owango, M., Staal, S., 2000. Dairy developmentin Kenya: the past, the present and the future.

C.K. Bosire et al. / Agriculture, Ecosystems and Environment 205 (2015) 36–47 47
van Vuuren, D.P., Smeets, E.M.W., 2000. Ecological footprints of Benin, Bhutan, CostaRica and the Netherlands. Ecol. Econ. 34, 115–130.
Vanham, D., Bidoglio, G., 2013. A review on the indicator water footprint for theEU28. Ecol Indic. 26, 61–75.
Wackernagel, M., Monfreda, C., Erb, K.-H., Haberl, H., Schulz, N.B., 2004. Ecologicalfootprint time series of Austria, the Philippines, and South Korea for 1961–1999:comparing the conventional approach to an ‘actual land area’ approach. LandUse Policy 21, 261–269.
Wackernagel, M., Onisto, L., Bello, P., Callejas Linares, A., Susana López Falfán, I.,Méndez Garcı’a, J., Isabel Suárez Guerrero, A., Guadalupe Suárez Guerrero, M.,
1999. National natural capital accounting with the ecological footprint concept.Ecol. Econ. 29, 375–390.
Waithaka, M., Thornton, P., Herrero, M., Shepherd, K., 2006. Bio-economicevaluation of farmers' perceptions of viable farms in western Kenya. Agric. Syst.90, 243–271.
Zoumides, C., Bruggeman, A., Hadjikakou, M., Zachariadis, T., 2014. Policy-relevantindicators for semi-arid nations: the water footprint of crop production andsupply utilization of Cyprus. Ecol. Indic. 43, 205–214.