Embed Size (px)
Citation preview

43
Chapter III
Trends and patterns of inequality
The issue of global economic inequality and the underlying economic forces contributing to its evolution constitute one of the most controversial aspects of economic discourse in recent years. Until recently, economic indicators dominated much of the discussion about global inequality, reflecting the pri-ority given to policies promoting economic growth as a panacea for develop-ment ills. Now, however, greater attention is being paid to the non-economic indicators of inequality. Similar to the shift that has taken place in the debate on poverty, the debate on inequality has come to reflect a broader conceptu-alization of the subject in which the focus is not exclusively on measurable economic indicators.
As non-economic aspects of inequality become more widely recognized, the distinctions that will inevitably be drawn between economic and non-economic inequality may create a false dichotomy between phenomena that are intricately related. Inequality is complex and multidimensional and is manifested in various forms at the community, national and global levels. Individuals, groups and countries that lack opportunities at one level gener-ally lack opportunities at other levels as well. For example, in societies with high levels of income inequality, those who control the resources also tend to control the political system, and those without access to either are ne-glected. Likewise, the global marketplace operates to the advantage of richer countries; poor countries are less likely to benefit from globalization and are more vulnerable to its risks and failures (Birdsall, 2002).
This interdependence is one aspect of a complex structural relationship between economic and non-economic inequalities both within and between countries; the many, varied linkages are impossible to isolate, complicating efforts to develop solutions. A key feature of the structural relationship be-tween economic and non-economic inequality is that both are often charac-terized by inequality under the law and inequality of opportunities and con-ditions—issues highlighted at the World Summit for Social Development.
The present chapter describes the magnitude and summarizes the trends and patterns of selected aspects of economic and non-economic inequality at the national and global levels. It begins with a review of trends in economic inequality, measured in terms of income distribution, monetary poverty, and employment. The chapter then summarizes the various trends associ-ated with selected non-economic aspects of inequality, including health, mortality, malnutrition and education.
It is important to note at the outset that while considerable evidence exists with regard to trends in inequality at both the national and interna-

44 The Inequality Predicament
tional levels, data remain incomplete. This is particularly true for developing countries and applies to both economic and non-economic indicators of in-equality. Any interpretation of the levels and trends presented in the sections below (especially short-term trends) should take these data limitations into account.
Economic aspects of inequality
Income inequality between countries
Recent analyses of global inequality patterns suggest that income and con-sumption inequality between countries has been relatively stable during the past 50 years (Berry and Serieux, 2002). However, in general terms, meas-urements of economic growth indicate that there has been an expansion in world income since the 1980s. This overall trend has primarily been driven by the sustained and rapid growth of the economy in China and the continu-ous, though more moderate, economic growth in India; both countries have played a crucial role in the expansion of the world economy in the past two decades. While these and some of the other economies in Asia have grown fairly rapidly, North America and Western Europe have registered only mod-erate levels of economic growth. Following a slowdown in the 1980s and a recession in the early 1990s, the economy in Eastern Europe resumed growth during the mid-1990s. Most countries in Central and South America and the Middle East experienced negative economic growth during the 1980s, and growth rates in sub-Saharan Africa remained negative during most of the 1980s and 1990s (Berry and Serieux, 2002).
Although the issue remains subject to considerable debate, there has probably been a moderate improvement in the overall world distribution of income during the past two decades (Berry and Serieux, 2004; Sala-i-Martin, 2002). Upon further analysis, however, the picture that emerges is not quite so positive. First, most of the improvement in the distribution of world in-come can be explained by the rapid economic growth in China and, to a less-er extent, India (see figure III.1), with a good part of the shift reflecting the gains of the poorer segments of society at the expense of the middle-income groups in these two countries. Second, the share of the richest 10 per cent of the world’s population has increased from 51.6 to 53.4 per cent of total world income (Bourguignon and Morrison, 2002). Third, when China and India are not factored into the analysis, available data show a rise in income inequality owing to the combined effect of higher income disparities within countries and the adverse distributive effect of faster population growth in poorer countries. Fourth, the income gap between the richest and poorest countries has widened in recent decades, as shown in figure III.2 (Berry and Serieux, 2002).
Table III.1 shows inequalities in the distribution of income among world regions, presenting the per capita income in each region as a percentage of per

Trends and patterns of inequality 45
����
����
����
����
����
����
����
����
����
����
����
���� ���� ����
����
��������
�����
�
�������������� �������������� �����������������������
Figure III.2. Per capita gross domestic product in the poorest and richest countries, 1960-1962 and 2000-2002 (in constant 1995 US$, simple average)
Source: A. Berry and J. Serieux, “Riding the elephants: the evolution of world economic growth and income distribution on the end of the 20th century” (unpublished paper).
��� ���
������
������
�
�����
������
������
������
������
������
������
���������� ����������
�������
�������������
�����
������
��
�������������������� ��������������������
Source: World Commission on the Social Dimension of Globalization, A Fair Globalization: Creating Opportunities for All (Geneva, International Labour Organization, February 2004).
Figure III.1. Evolution of income inequality among countries (Gini coefficient values)

46 The Inequality Predicament
Tab
le II
I.1.
Reg
iona
l per
cap
ita in
com
e as
a s
hare
of h
igh-
inco
me
OEC
D c
ount
ries’
aver
age
per
cap
ita in
com
ea (per
cent
age)
Regi
on19
8019
81-1
985
1986
-199
019
91-1
995
1996
-200
020
01
Sub
-Sah
aran
Afr
ica
3,3
3,1
2,5
2,1
2,0
1,9
Sout
h A
sia
1,2
1,3
1,3
1,4
1,5
1,6
Mid
dle
East
and
Nor
th A
fric
a9,
79,
07,
37,
16,
86,
7La
tin A
mer
ica
and
the
Car
ibb
ean
18,0
16,0
14,2
13,5
13,3
12,8
East
Asi
a an
d th
e Pa
cific
1,5
1,7
1,9
2,5
3,1
3,3
Hig
h-in
com
e co
untr
ies
97,7
97,6
97,6
97,9
97,9
97,8
Hig
h-in
com
e no
n-O
ECD
cou
ntrie
s45
,345
,348
,256
,160
,259
,2H
igh-
inco
me
OEC
D c
ount
ries
100,
010
0,0
100,
010
0,0
100,
010
0,0
Sour
ce: A
lem
ayeh
u G
eda,
”O
pen
ness
, ine
qual
ity
and
pov
erty
in A
fric
a: e
xplo
ring
the
role
of
glob
al in
terd
epen
denc
e”, p
aper
pre
sent
ed a
t th
e w
orks
hop
on
regi
onal
stu
dies
of
the
Inte
rnat
iona
l For
um fo
r Soc
ial D
evel
opm
ent,
held
in N
ew Y
ork
on 1
7 an
d 18
Jun
e 20
04.
a In
con
stan
t Uni
ted
Stat
es d
olla
rs.

capita income in the rich OECD countries as a group, as well as the changes in these ratios over the past two decades. A review of the figures indicates that per capita income in all developing regions except South Asia and East Asia and the Pacific has declined relative to that in the high-income OECD countries.
Per capita income levels in sub-Saharan Africa, the Middle East and North Africa, and Latin America and the Caribbean have been steadily declin-ing relative to the average per capita income in the wealthier OECD countries. Between 1980 and 2001 these levels decreased from 3.3 to 1.9 per cent in sub-Saharan Africa, from 9.7 to 6.7 per cent in the Middle East and North Africa, and from 18 to 12.8 per cent in Latin America and Caribbean. The decline in the ratios indicates not that per capita income in developing regions has decreased in absolute terms, but that per capita income has grown faster in the richer regions than in the poorer ones, widening the inequality gap.
The income gap between the wealthy OECD countries and the corre-sponding group of non-OECD countries1 actually narrowed during the pe-riod under review; between 1980 and 2001 the per capita income of the latter as a proportion of the former rose from 45.3 to 59.2 per cent. Asia registered only moderate improvement relative to the high-income OECD countries, with ratios rising from 1.2 to 1.6 per cent in South Asia, and from 1.5 to 3.3 per cent in East Asia and the Pacific.
Income inequality within countries
Some studies contend that within individual countries there has been little or no change in income distribution or levels of income inequality in dec-ades (Gustaffson and Johansson, 1999; Melchior, Telle and Wiig, 2000). An analysis of the information provided in the World Income Inequality Data-base (WIID) shows that within-country income inequality decreased during the 1950s, 1960s and 1970s in most developed, developing and centrally planned economies.2 Since the 1980s, however, this decline has slowed or levelled off, and within many countries income inequality is rising once again (Cornia, 2004). Similar conclusions have been reached using different sets of data, which describe a significant increase in within-country income in-equality over the past two decades (Atkinson, 2003; Harrison and Bluestone, 1988).
An analysis of WIID figures indicates that within-country income in-equality rose between the 1950s and the 1990s in 48 of the 73 countries for which sufficiently reliable data are available (see table III.2). Together, these 48 countries account for 59 per cent of the combined population of the countries included in the analysis. In the early 1980s, 29 of the 73 countries had Gini coefficients3 higher than 0.35-0.40, the threshold beyond which growth and poverty alleviation can be perceptibly affected; by the mid- to late 1990s, the number of countries with such high levels of income inequal-
Trends and patterns of inequality 47

48 The Inequality Predicament
ity had risen to 48. Within-country income inequality remained relatively constant in 16 of the countries under review, though the data suggest that the situation has worsened in three of them during the past few years. Only nine of the countries included in the analysis registered a decline in income inequality between the 1950s and the 1990s; included in this group are the Bahamas, France, Germany, Honduras, Jamaica, Malaysia, the Philippines, the Republic of Korea, and Tunisia (Cornia, Addison and Kiiski, 2004).
Within-country income inequality has risen in many developing coun-tries and in a surprisingly large number of industrialized countries. Although data are not fully comparable across countries, a study of the evolution of income inequality in nine OECD countries generally supports the view that a significant shift has occurred in the distribution of income in all the countries analysed, with the possible exception of Canada. In some countries and coun-try groupings, such as Finland and the United Kingdom of Great Britain and Northern Ireland, there have been increases of more than 10 Gini points in the past three decades. Empirical evidence from the study suggests that these figures have been influenced by technological change and the process of glo-balization, though it is acknowledged in the analysis that the distribution of income is a highly complex phenomenon, and that a single explanation does not suffice for all countries (Atkinson, 2003).
All of the former centrally planned economies of Europe and the former Soviet Union have experienced increases in within-country inequality. Among
Table III.2. Distribution of countries according to trends in Gini coefficients for income distribution between the 1950s and the 1990s (sample of 73 developed, developing and transitional countries)
Trends in Gini coefficients
Number of countries
in group
Sample countries’ percentage share of:
Total population of sample countries
World population
GDP-PPPa of sample countries
World GDP-PPPa
Rising 48 59 47 78 71 Continuously rising/ rising- stable 19 4 3 5 5 U-shaped 29 55 44 73 66Falling 9 5 4 9 8 Continuously falling 6 3 3 7 7 Inverted U-shape 3 2 1 2 1No trend 16 36 29 13 12Not included in sample – – 20 – 9Total 73 100 100 100 100
Source: G.A. Cornia, T. Addison and S. Kiiski, “Income distribution changes and their impact in the post-Second World War period”, in Inequality, Growth and Poverty in the Era of Liberalization and Globalization, A.G. Cornia, ed. (Oxford, Oxford University Press/ United Nations University, World Institute for Economics Research, 2004).a Gross domestic product - purchasing power parity.

Trends and patterns of inequality 49
the transition countries of Central Europe, income concentration increased moderately throughout the 1990s, probably owing to the preservation of the welfare state system (Milanovic, 1998). In the countries of the former Soviet Union and south-eastern Europe, income inequality rose by an average of 10 to 20 Gini points, and the number of people living in poverty jumped from 14 million in 1989 to 147 million in 1996 (Cornia and Kiiski, 2001). The abrupt dismantling of the State-run welfare system after the collapse of the communist regimes in these countries played an important role in this dramatic increase.
A number of South and East Asian countries that were once able to achieve growth with equity have also experienced a sharp increase in income inequal-ity in recent years. The Gini coefficient began rising in some of these countries in the late 1980s; however, in the 1990s rising inequality became a common feature in most. In some cases, the increase in income inequality appears to be closely related to a widening of the urban-rural income gap (Cornia, Addison and Kiiski, 2004).
Historically, the highest levels of income inequality have been found in Africa and Latin America, and in the 1980s and 1990s the situation dete-riorated even further. An analysis by the Economic Commission for Latin America and the Caribbean (ECLAC) shows that, with few exceptions, the Gini coefficients for countries in the region between the 1950s and the be-ginning of the 1970s were among the highest in the world, ranging from 0.45 to 0.55 (Sainz, 2004). During the 1970s, income inequality declined moderately throughout the region, but a series of external shocks and the debt crises in the 1980s affected income distribution, and levels of income inequality rose again in most countries (Altimir, 1996). Those countries that had previously enjoyed a more equal distribution of income were the most profoundly affected by these developments. During the 1990s, income distri-bution trends deteriorated further, as reflected in the higher Gini coefficients in most countries.4
One feature that distinguishes patterns of within-country inequality in Latin America from those in other regions is the share of the richest 10 per cent of households in total income. In the 1990s these wealthier households accounted for more than 30 per cent of total income, with their share reaching 35 or even 45 per cent in some cases. By contrast, the poorest 40 per cent of households in Latin America garnered only 9 to 15 per cent of total income. By the end of the 1990s, the relative share of total income among the wealthi-est 10 per cent of the population had increased in eight countries, declined somewhat in five, and held steady in one.
The largest income gap is in Brazil, where the per capita income of the most affluent 10 per cent of the population is 32 times that of the poorest 40 per cent. The lowest levels of income inequality in the region can be found in Uruguay and Costa Rica, countries in which the respective per capita income levels of the wealthiest 10 per cent are 8.8 and 12.6 times higher than those

50 The Inequality Predicament
of the poorest 40 per cent. Although comparable figures are not available for the rest of the region, other indicators suggest that Cuba has probably maintained a less regressive income distribution than the other countries, despite the strong deterioration of its economy during the first half of the 1990s (Sainz, 2004).
The limited statistics for sub-Saharan Africa show that high levels of in-come inequality have persisted since the 1970s. Income inequality within rural areas has risen in countries that have high land concentration or are extremely dependent on the export of a single commodity, but has remained constant in countries such as Mozambique and Uganda, where small-scale agriculture is common (Bigsten, 2000).
In many countries, especially developing countries, the rise in income inequality at the national level is strongly correlated with increases in rural-urban and regional income inequality. According to an analysis of data from several Asian countries, the rural-urban income gap rose rapidly in China, India and Thailand during the 1990s. In the case of China, half of the overall increase in income inequality since 1985 is attributable to differences in in-come distribution among the country’s various regions. Similar trends have been observed for Thailand and, more recently, for India (Cornia and Kiiski, 2001). Conversely, data from Latin America show that the income gap be-tween rural and urban areas has been narrowing.
Poverty
The negative trends in income distribution imply that monetary poverty has gradually worsened in many parts of the world. As the seriousness of the problem has grown more evident, poverty and poverty reduction strategies have become increasingly prominent in the development discourse. Since the World Summit for Social Development, Governments have intensified their efforts to address poverty, setting national poverty reduction targets and formulating and implementing plans and strategies for poverty eradication. Anti-poverty programmes have focused not only on monetary issues, but also on improving access to basic social services such as health and education, especially for vulnerable groups; promoting employment opportunities; pro-viding social protection; and applying measures to address the adverse effects of financial crises.
At the global level considerable progress has been made in reducing pov-erty over the past two decades, largely as a result of the more focused anti-poverty programmes and policies. Table III.3 indicates that the proportion of the world’s population living in extreme or absolute poverty (surviving on less than US$ 1 a day) declined noticeably between 1981 and 2001, dropping from 40 to 21 per cent. At the regional level, only East Asia and the Pacific, the Middle East and North Africa, and South Asia registered sharp declines during this period.

Trends and patterns of inequality 51
Overall poverty reduction statistics mask wide national and regional dif-ferences and the uneven pace of progress. The advances made in China and India have contributed substantially to the positive picture at the global level. Because these two countries account for 38 per cent of the world’s popula-tion, the rapid expansion of their respective economies has led to a signifi-cant reduction in the number of people living in absolute poverty worldwide; between 1990 and 2000 this figure declined from 1.2 billion to 1.1 billion (International Labour Organization, 2004). In China alone, the proportion of people living on less than US$ 2 a day fell from 88 to 47 per cent between 1981 and 2001, and the number of people living on less than US$ 1 per day was reduced from 634 million to 212 million. In India, the proportion living on less than US$ 2 per day declined from 90 to 80 per cent, and the number living in extreme poverty decreased slightly, from 382 million to 359 million.
The improvements in China and India notwithstanding, in 2001 more than 1.1 billion people worldwide were struggling to survive on less than US$ 1 a day. Poverty is more prevalent and persistent in certain regions. In sub-Saharan Africa, for example, the number of poor people increased by al-most 90 million in a little more than a decade (1990-2001). Even in regions that have achieved significant progress, such as South and East Asia, rates of poverty reduction have been, at best, uneven.
In Europe and Central Asia the total number of people living on less than US$ 1 a day grew by more than 14 million between 1981 and 2001. The incidence of poverty in these regions increased sharply in the 1990s, but by 2001 the upward trend had slowed. Worsening poverty in Eastern Eu-rope and the Commonwealth of Independent States (CIS) has contributed substantially to the trend towards increased poverty in Europe and Central Asia since 1993. By the end of the 1990s, 50 million people were living in poor families in the former socialist countries, and the same was true for 43 million people in the CIS (United Nations Children’s Fund, 2001). During the 1990s, poverty and income inequality rose steadily in the Central Asian Republics. In Tajikistan, a 14 per cent increase in the country’s population was accompanied by a 64 per cent decline in GDP and escalating poverty levels. In Azerbaijan, sound macroeconomic policies have ensured economic stability and high real GDP growth; however, these economic successes have not been reflected in the lives of people, 49 per cent of whom live in poverty. In 2002, about half of the population in Kyrgyzstan lived below the poverty line (United Nations Development Programme, 2004a).
In Latin America and the Caribbean the proportion of those living on less than US$ 1 a day fell slightly overall, declining from 11.3 to 9.5 per cent between 1990 and 2001, though poverty levels increased in many individual countries during this period. The most important exception is Chile, where poverty declined sharply in the 1990s. Rates of poverty and unemployment rose to record highs in Argentina, but the country has enjoyed steady eco-

52 The Inequality Predicament
Tab
le II
I.3.
Pove
rty
rate
s fo
r the
wor
ld, m
ajor
regi
ons,
and
Chi
na a
nd In
dia
Pove
rty
rate
(per
cent
age
livin
g on
less
than
US$
1 p
er d
ay)
Regi
on/c
ount
ry19
8119
8419
8719
9019
9319
9619
9920
01
Wor
ld
4033
2828
2623
2221
Ea
st A
sia
and
the
Paci
fic58
3928
3025
1716
15
Euro
pe
and
Cen
tral
Asi
a1
10
14
46
4
Latin
Am
eric
a an
d th
e C
arib
bea
n10
1211
1111
1111
10
Mid
dle
East
and
Nor
th A
fric
a5
43
22
23
2
Sout
h A
sia
5247
4541
4037
3231
Su
b-S
ahar
an A
fric
a42
4647
4544
4646
47
Chi
na64
4129
3328
1718
17
In
dia
5450
4642
4242
3535
Pove
rty
rate
(per
cent
age
livin
g on
less
than
US$
2 p
er d
ay)
Regi
on/c
ount
ry19
8119
8419
8719
9019
9319
9619
9920
01
Wor
ld67
6460
6160
5654
53
East
Asi
a an
d th
e Pa
cific
8577
6870
6553
5047
Eu
rop
e an
d C
entr
al A
sia
54
35
1721
2420
La
tin A
mer
ica
and
the
Car
ibb
ean
2730
2828
3024
2525
M
iddl
e Ea
st a
nd N
orth
Afr
ica
2925
2421
2022
2423
So
uth
Asi
a89
8787
8685
8278
77
Sub
-Sah
aran
Afr
ica
7376
7675
7575
7677
Chi
na88
7967
7368
5350
47
In
dia
9088
8786
8685
8180

Trends and patterns of inequality 53
Num
ber o
f peo
ple
livin
g on
less
than
US$
2 p
er d
ay (i
n m
illio
ns)
Regi
on/c
ount
ry19
8119
8419
8719
9019
9319
9619
9920
01
Wor
ld2
450
2 48
02
478
2 65
42
764
2 67
42
739
2 73
5
East
Asi
a an
d th
e Pa
cific
1 17
01
109
1 02
81
116
1 07
992
290
086
4
Euro
pe
and
Cen
tral
Asi
a20
1815
2381
9811
393
La
tin A
mer
ica
and
the
Car
ibb
ean
9911
911
512
513
611
712
712
8
Mid
dle
East
and
Nor
th A
fric
a52
5053
5152
6170
70
Sout
h A
sia
821
859
911
958
1 00
51
029
1 03
91
064
Su
b-S
ahar
an A
fric
a28
832
635
538
241
044
748
951
6
Chi
na87
681
473
182
580
365
062
759
4
In
dia
630
662
697
731
770
807
805
826
Sour
ce: W
orld
Ban
k Po
vert
y M
onito
r (ht
tp://
ww
w.w
orld
ban
k.or
g/re
sear
ch/p
ovm
onito
r; ac
cess
ed 7
Feb
ruar
y 20
05).

54 The Inequality Predicament
nomic growth since 2003. This economic expansion has not led to a more balanced distribution of wealth or a reduction in social inequalities, however. For example, in 1994 the income of the richest 10 per cent of the population was nearly 20 times that of the poorest 10 per cent; by 2004 the ratio was 29 to 1 (South-North Development Monitor, 2005).
While the proportion of the world’s population living on less than US$ 1 a day decreased significantly between 1981 and 2001 (from 40 to 21 per cent), the share of those living on less than US$ 2 a day declined less dramatically (from 67 to 53 per cent). In East Asia and the Pacific only 15 per cent of the population was living on less than US$ 1 a day in 2001, but the proportion living on less than US$ 2 a day was close to 50 per cent. Despite China’s re-markable economic progress and its influence on global trends, 47 per cent of the population was living on less than US$ 2 a day in 2001 (see table III.3). The slower decline in the proportion of those living on less than US$ 2 a day reflects the fact that a sizeable number of people have moved from the lowest poverty category into this marginally better income category. The combination of the transfer between poverty categories and various demographic and eco-nomic developments has resulted in a global increase in the number of people living in poverty (those living on less than US$ 2 per day) since the late 1990s (Chen and Ravallion, 2000).
Perhaps even more important than the increasing levels of poverty is the emergence and entrenchment of new patterns of poverty in a number of countries. Developments worth noting include an increased tendency for people to rotate in and out of poverty, a rise in urban poverty and stagnation in rural poverty, and increases in the proportion of informal workers among the urban poor and in the number of unemployed poor.
The tendency for individuals to move in and out of poverty has grown since the 1980s, illustrating how the path out of poverty is often not linear. This phenomenon can lead to some of the worst forms of social exclusion because those who are not classified as poor in a particular period may be over-looked by social assistance programmes. In many African countries around a quarter of the population may be deemed consistently poor; however, up to an additional 60 per cent move in and out of poverty (Economic Commis-sion for Africa, 2003). In Latin America, fluctuations in employment and income account for an increasing share of the population cycling in and out of poverty. In the Russian Federation, nearly half of the households deemed very poor in 1992 were not classified as such a year later, demonstrating that the poor do not constitute a static group. Indeed, some households rose above the poverty level in 1992/93, even as overall poverty levels were in-creasing (World Bank, 1995).
The increasing urbanization of poverty and the lack of notable progress in ameliorating well-entrenched rural poverty present new challenges to de-velopment. Poverty has traditionally been viewed as a primarily rural phe-nomenon, and the depth of poverty remains greater in rural areas; however,

Trends and patterns of inequality 55
a growing number of urban areas are experiencing serious levels of poverty as well. In Latin America, poverty is more prevalent in urban areas. In 1999, for example, only 77 million of the region’s 211 million poor lived in rural areas, while the remaining 134 million lived in urban areas. Nevertheless, the concentration of poverty was still much greater in rural areas, with the poor accounting for 64 per cent of the rural population but only 37 per cent of the urban population. Poverty in rural areas is also more extreme (Sainz, 2004).
In Africa, where the worst forms of poverty exist, an estimated 59 per cent of the rural population live in extreme poverty, compared with 43 per cent of the urban population. Among the factors undermining poverty re-duction efforts in the region are high rates of population growth; the high prevalence of unskilled labour; and the HIV/AIDS epidemic, which has se-riously reduced the overall calibre of the workforce. The net effect of these circumstances is that per capita income in the region did not change between 1990 and 1999 even though aggregate GDP increased by 29 per cent.
In many countries, the lack of sufficient and sustained income growth has been a major obstacle to reducing poverty. Among the 155 developing and transition countries for which data are available, only 30 achieved annual per capita income growth of at least 3 per cent during the 1990s, while 71 registered rates of less than 3 per cent; a total of 54 countries (including 20 in sub-Saharan Africa) experienced a decline in per capita income in this period (United Nations Development Programme, 2003).
Demographic trends have led many households, communities and countries deeper into poverty. High fertility increases poverty by diverting household resources from savings to consumption. It also makes government investment in education and other forms of human capital formation more difficult, as more and more resources have to be allocated to meet the needs of a rapidly growing population. Persistently high fertility produces elevated age dependency ratios, indicating a high proportion of the young (0-14 years) and the old (65 years or above) relative to those in the prime working-age group. Greater dependence places increased pressure on the earnings of a lim-ited workforce in a way that perpetuates poverty even among those who are employed. Internal and international migration are strongly linked to pov-erty as well; sending communities become poorer, as they tend to lose their most economically active members, and in receiving communities migrants are likely to be poorly integrated and without access to decent employment and are therefore vulnerable to extreme poverty.
Unemployment
Of all the inequalities within and between countries, the inability of an in-creasing share of the world’s job-seeking population to secure employment has perhaps the most far-reaching implications. Most of those looking for work are adults with personal and household responsibilities. People who

56 The Inequality Predicament
cannot secure adequate employment are unable to generate an income suf-ficient to cover their health, education and other basic needs and those of their families, or to accumulate savings to protect their households from the vicissitudes of the economy. The unemployed are among the most vulner-able in society and are therefore more likely to suffer from poverty in all its manifestations.
A fundamental component of any successful development strategy is an employment strategy that not only addresses the creation of decent jobs but also promotes adequate working conditions in which freedom, equality, security and dignity figure prominently (United Nations, 2004c). The Pro-gramme of Action of the World Summit for Social Development states that “productive work and employment are central elements of development as well as decisive elements of human identity” (United Nations, 1995, para. 42). It has been 10 years since full employment was identified as a core objec-tive; however, the progress that has been achieved falls far short of expecta-tions. The Summit participants were hopeful that significant strides could be made towards ensuring freely chosen productive employment and work for all; instead, global unemployment levels have risen in the past decade.
It is estimated that between 1993 and 2003 the number of unemployed rose from 140 million to an unprecedented 186 million, representing 6.2 per cent of the total working population (International Labour Organization, 2005c). By the end of this period the ranks of the working poor had swelled to 550 million. In developed countries as a group, the unemployment rate fell from around 8 per cent in 1993 to 6.8 per cent in 2003 (see table III.4), while much of the developing world experienced stagnating or rising unem-ployment during this time. The world regions with the lowest and highest
Table III.4. Unemployment rates, labour force growth rates and GDP growth rates for the world and major regions
Region/country grouping
Unemployment rate
Annual labour force growth rate
Annual GDP growth rate
1993 2002 2003 1993-2003 1993-2003
World 5.6 6.3 6.2 1.8 3.5 Industrialized economies 8.0 6.8 6.8 0.8 2.5 Transition economies 6.3 9.4 9.2 –0.1 0.2 East Asia 2.4 3.1 3.3 1.3 8.3 Latin America and the Caribbean 6.9 9.0 8.0 2.3 2.6 Middle East and North Africa 12.1 11.9 12.2 3.3 3.5 South Asia 4.8 4.8 4.8 2.3 5.5 South-East Asia 3.9 7.1 6.3 2.4 4.4 Sub-Saharan Africa 11.0 10.8 10.9 2.8 2.9
Source: International Labour Organization, "Global trends in employment, productivity and poverty, 2005" (http://www.ilo.org/public/english/employment/strat/download/wr04c1en.pdf; accessed 17 February 2005).

Trends and patterns of inequality 57
levels of unemployment, which remained relatively stable during the decade under review, were East Asia (around 3 per cent) and the Middle East and North Africa (12.2 per cent).
Between 1993 and 2003 unemployment increased by as much as 62 per cent in some parts of South-East Asia and Latin America and the Caribbean. Although the overall level of unemployment rose in East Asia, it remained well below that found in other regions. South-East Asia registered the most substantial increase in unemployment during the period under review, large-ly owing to the high annual labour force growth rate of 2.4 per cent and the fact that some of the countries in the region, including Indonesia (the largest), were slow to recover from the Asian financial crisis of 1997/98. The data indicate that unemployment decreased slightly in South-East Asia and Latin America and the Caribbean between 2002 and 2003, though it should be noted that the changes were relatively small, occurred over a single year, and may reflect only a temporary or cyclical decline.
In sub-Saharan Africa, the labour force grew by 2.8 per cent annually and unemployment declined only slightly between 1993 and 2003, leaving the overall unemployment rate virtually unchanged. In the transition econo-mies unemployment rose by 46 per cent during this period.
Among the countries for which reliable data are available, half have re-ported a decrease and the other half an increase in unemployment rates since 1995 (International Labour Organization, 2005a). Trends have varied from one region to another. In Latin America and the Caribbean, overall unem-ployment has been rising since the 1990s despite the stagnant unemployment situation in Brazil and the decline in unemployment in Mexico (Economic Commission for Latin America and the Caribbean, 2005a). Almost all East Asian and South-East Asian countries have experienced rising unemployment during the past decade as well.
Before 1980, employment in China was growing steadily at about 2.6 per cent, but the rate dropped to 1.1 per cent in the 1990s. India also expe-rienced a significant decline in employment growth in the 1990s, reflecting a slowdown in both rural and urban areas. Between 1993 and 2000 growth in rural employment fell to 0.67 per cent, the lowest rate in the country’s post-independence history. Nonetheless, the unemployment rate in India rose only slightly, whereas the corresponding rates for Bangladesh and Pakistan increased noticeably.
Comparable trend data are not available for most sub-Saharan African countries. However, the extremely high levels of unemployment in the region are worth noting; in 1999, Botswana, Burkina Faso, Niger, South Africa and Tanzania all had unemployment rates of 20 per cent or higher.
It is important to bear in mind that the unemployment rate alone is not a clear indicator of the extent of equality or inequality in the labour force. Beneath the tip of this iceberg are a number of other employment-related factors that may exacerbate or ameliorate inequalities, including the size and

58 The Inequality Predicament
growth of the informal economy, the quality of work and wage levels (see chapter II). The fact is that most of the poor in developing countries are not unemployed. They work but cannot earn enough to raise themselves and their families above the poverty threshold. Further, as mentioned previously, many are subject to exploitation and lack basic rights and protections in the workplace.
Recognizing the critical importance of these issues, the ILO has come up with a “decent work” agenda that constitutes an integral part of the overall United Nations development agenda. The overarching objective of the de-cent work agenda is to promote opportunities for women and men to obtain decent and productive work under conditions of freedom, equality, security and human dignity. The agenda encompasses the following four strategic objectives: (a) the opportunity to be employed doing work that is productive and is fairly remunerated; (b) security in the workplace and social protection for workers and their families; (c) freedom of expression, organization, and participation in activities affecting the lives of workers; and (d) equal oppor-tunities for men and women (International Labour Organization, 2005b). Labour market access and employment are considered vital for social inclu-sion. The ILO is working to protect the rights of all workers and has identified meaningful employment as essential in both eradicating poverty and helping people to fulfil their human potential (International Labour Organization, 2004). The decent work agenda addresses a number of challenges that have arisen from globalization, including the loss of employment, the inequitable distribution of benefits, and the disruption that has been caused in so many people’s lives. Answering these challenges will require the participation of actors at all levels.
Non-economic aspects of inequality
As noted previously, the traditional focus on economic inequality is directed almost exclusively towards income differentials within and between coun-tries, while the social underpinnings are neglected. It is not possible to assess or address inequality until the importance and interconnectedness of its eco-nomic and non-economic aspects are widely acknowledged. Non-economic indicators relating to priorities such as health, education, access to basic ne-cessities (food, water, sanitation and housing) and opportunities for political participation are closely linked to individual, household and national eco-nomic status. Countries that have the poorest education and health profiles are generally at the bottom of the economic development ladder. The present section summarizes patterns and trends relating to selected aspects of non-economic inequality, including health, hunger and malnutrition, and educa-tion. An effort is made to demonstrate how differentials in these areas are linked to some of the economic inequalities that tend to dominate discus-sions of global inequality.

Trends and patterns of inequality 59
Health
Significant advances have been made in recent years in the field of health. The health status of many has improved as a result of this progress, but in-equalities within and between countries have worsened because the benefits of better health have not accrued evenly. The more privileged segments of the population, by virtue of their better education, income, geographical loca-tion or political clout, are often better able to harness the benefits deriving from advances in health. Developing countries are at a distinct disadvantage, as they typically have less access to advanced diagnostic technologies that contribute to the identification and treatment of diseases at advanced stages, to therapeutic remedies such as antiretroviral treatments for HIV and AIDS, and to medicines for preventing or treating endemic diseases such as malaria. Since poverty can contribute to ill health, and poor health can in turn per-petuate poverty, poorer people and countries are often caught in a vicious cycle that deepens their deprivation in relation to non-poor groups.
Health-related inequalities, including differentials in access to health services, have perhaps become the most frequently cited indicators of non-economic inequality. Discussions of causes, effects and possible solutions have been a central feature of the development debate in the international arena, and health figures prominently in the Millennium Development Goals. Within countries, reducing disparities in health and mortality between socio-economic groups, between urban and rural areas, and between regions has been a priority concern of Governments.
Over the past 50 years or so, global efforts to improve health and life expectancy have met with considerable success. Infant and child health has improved, and child mortality rates have declined. More women have gained access to safe and effective contraception, which prevents many unwanted pregnancies and reduces maternal mortality resulting from unsafe abortions. Global health statistics are indicative of enormous progress in these and other areas, but they conceal the wide variability within and between countries and regions. They also obscure the fact that, as a result of asymmetries in globalization, the health benefits accruing to poorer individuals and countries represent a tiny fraction of the benefits made possible by major technological and scientific advances. The inequality predicament is evident regardless of how health status is measured.
Life expectancy
Worldwide, life expectancy has increased from about 47 to 65 years over the past five decades. However, statistics show a gap of up to 36 years between the regions with the lowest and highest life expectancies (see figure III.3). Since 1990-1995, Australia/New Zealand has had the highest life expectancy of 77-79 years; the corresponding figures for other world regions have been either slightly or significantly lower.

60 The Inequality Predicament
�
��
��
��
��
����
����
����
����
��
��
����
��
��
��
��
���
��
����
��
��
��
��
��
����
����������������
������
�����
���������
����������������������������������������������������������������������������
����
����
���
������
�
���������
������������
�����
�������
��
��������
�������
��������
�������
���������
�����
�
�������
�����
����
������
�������
�������
�������
�����
�
�����
����
��������
����
�������
��������
��������
�����
��
��������
�����
��
��������
�������
����
��������
�����
����
�����
�������
�����
��
���
��������
��
���������
���������
������������
�����
�������
��
��������
�������
��������
�������
���������
�����
�
�������
�����
����
������
�������
�������
�������
�����
�
�����
����
��������
����
�������
��������
��������
�����
��
��������
�����
��
��������
�������
����
��������
�����
����
�����
�������
�����
��
���
��������
��
���������
Sour
ce: B
ased
on
data
from
Wor
ld P
opul
atio
n Pr
ospe
cts:
The
200
2 Re
visi
on (
Uni
ted
Nat
ions
pub
licat
ion,
Sal
es N
o. E
.03.
XIII
.8).
Figu
re II
I.3.
Ineq
ualit
ies
in li
fe e
xpec
tanc
y b
etw
een
maj
or w
orld
regi
ons:
dev
iatio
ns o
f reg
iona
l life
exp
ecta
ncy
at b
irth
fr
om th
at o
f Aus
tral
ia/N
ew Z
eala
nd (1
990-
1995
and
200
0-20
05)

Trends and patterns of inequality 61
��
��
��
��
��
��
��
��
��
��
��
������������������
�������
�����
�����
�����
�����
�����
�����
���
��������������������
����
������
�������
������������
��
���������������������������������������������������������������
����
����
Figu
re II
I.4.
Dis
trib
utio
n of
all
coun
trie
s ac
cord
ing
to h
ow fa
r the
ir lif
e ex
pec
tanc
y fa
lls b
elow
that
of J
apan
, 199
0 an
d 20
00
Sour
ce: B
ased
on
data
from
Wor
ld P
opul
atio
n Pr
ospe
cts:
The
200
2 Re
visi
on (U
nite
d N
atio
ns p
ublic
atio
n, S
ales
No.
E.0
3.X
II.8)
.

62 The Inequality Predicament
When inequalities in life expectancy are assessed in terms of the number of regions falling more than 25 years short of the region with the highest life expectancy, it is apparent that the situation has worsened since 1990. In 1990-1995 and 1995-2000, the central, eastern and western regions of Africa were the only regions with life expectancy more than 25 years be-low that of Australia/New Zealand. By 2000-2005, largely as a result of the AIDS epidemic, southern Africa had been placed in the same category. It is worth noting that by 2000-2005 differentials had narrowed somewhat in the regions with higher longevity and also in those with lower longevity, suggesting increasing polarization between the two groups. Life expectancy differentials among the four worst-performing regions have narrowed in particular, even as their performance in relation to the rest of the world has worsened.
Country-level differentials in life expectancy also suggest increased po-larization between the best and worst performers. Figure III.4 shows the distribution of all countries according to how far their life expectancy for 1990-1995 and 2000-2005 fell short of that of Japan, which had the highest life expectancy for both periods. There were many more countries that fell within 10 years of Japan’s life expectancy in 2000-2005 than in 1995-2000, suggesting a degree of improvement in the level of inequality. However, there was also a substantial increase in the number of countries with life expectan-cies 30 to 50 years short of Japan’s (the worst performers). The number of countries in the middle category (with life expectancies 20 to 30 years short of Japan’s) declined by almost half, largely because Haiti and 12 sub-Saharan African countries experienced a regression.
This pattern is consistent with the notion of “club convergence”, in which poor countries tend to have lower average life expectancy while richer countries converge towards a higher level (Mayer-Foulkes, 2001). It is also consistent with the conclusion from recent analysis that inequality in the dis-tribution of health gains has increased (Cornia and Menchini, 2005).
An important aspect of inequalities in life expectancy is the male-female longevity gap. Almost everywhere, life expectancy is higher for females than for males. Underlying this disparity, which is most pronounced in Eastern Europe, are a number of factors associated with lifestyle, including the higher exposure of males to health and mortality risks linked to certain occupations, motor vehicle accidents, and the excessive use of tobacco and alcohol.
Maternal and child health
Child mortality declined between 1990 and 2001, though somewhat more slowly in developing countries. Widespread immunization against killer childhood diseases has contributed significantly to reducing infant and child mortality; over a period of several decades enormously successful vaccination policies and programmes have been implemented in many countries with the

Trends and patterns of inequality 63
Table III.5. Levels of under-five mortality for selected countries and between-country inequality indices
Region/country Year
Under-five mortality (5q0) per 1 000 births
Inequality indexa
Sub-Saharan Africa Gabon 2000 88.6 – Zimbabwe 1999 102.1 13.5 Nigeria 1999 140.1 51.5 Tanzania 2000/2001 146.6 58.0 Uganda 2000/2001 151.5 62.9 Benin 2001 160.0 71.4 Ethiopia 2000 166.2 77.6 Zambia 2001/2002 168.2 79.6 Guinea 1999 176.9 88.3 Malawi 2000 188.6 100.0 Rwanda 1999 196.2 107.6 Burkina Faso 1998/1999 219.1 130.5 Mali 2001 229.1 140.5North Africa/West Asia/Europe Armenia 2000 39.0 – Egypt 2000 54.3 15.3Central Asia Kazakhstan 1999 71.4 – Turkmenistan 2000 94.3 22.9South and South-East Asia Nepal 2001 91.2 – Bangladesh 1999/2000 94.1 2.9 India 1998/1999 94.9 3.7 Cambodia 2000 124.4 33.2Latin America and the Caribbean Colombia 2000 24.9 – Dominican Republic 1999 30.4 5.5 Peru 2000 46.7 21.8 Guatemala 1998/1999 58.7 33.8 Haiti 2000 118.6 93.7
Source: Under-five mortality data obtained from ORC Macro, MEASURE DHS STATcompiler (http://www.measuredhs.com; accessed 15 February 2005).a The inequality index is calculated as the value of 5q0 for the selected country minus the value for the
country with the lowest 5q0 within that region.
assistance of United Nations entities such as the United Nations Children’s Fund (UNICEF) and the World Health Organization (WHO). Since 1974 the proportion of children under the age of one who are immunized against diphtheria, polio, tetanus, measles, tuberculosis (TB) and pertussis (whoop-ing cough) has risen from 5 per cent to nearly 75 per cent.
These positive trends are apparent at the global level but do not reveal the stagnation and even worsening of the child health and mortality situation in certain parts of the world. Since the beginning of the 1990s, for example, global inequalities have widened as mortality among newborns has risen in sub-Saharan Africa but declined in most other regions (World Health Or-

64 The Inequality Predicament
Tab
le II
I.6.
Und
er-fi
ve m
orta
lity
for c
ount
ries
with
the
high
est a
nd lo
wes
t rat
es, 1
995,
200
0 an
d 20
02
Coun
trie
s with
the
high
est m
orta
litya
Und
er-fi
ve m
orta
lity
(per
1 0
00 b
irth
s)
Coun
trie
s with
the
low
est m
orta
litya
Und
er-fi
ve m
orta
lity
(per
1 0
00 b
irth
s)
1995
2000
2002
1995
2000
2002
Cen
tral
Afr
ican
Rep
ublic
180
180
180
Swed
en4
43
Mal
awi
216
188
182
Den
mar
k7
54
Zam
bia
182
182
182
Icel
and
54
4M
aurit
ania
183
183
183
Nor
way
64
4Bu
rund
i19
019
019
0Si
ngap
ore
54
4C
ôte
d’Iv
oire
175
188
191
Aus
tria
75
5C
had
200
200
200
Cze
ch R
epub
lic8
55
Nig
eria
238
205
201
Finl
and
45
5Rw
anda
209
203
203
Ger
man
y7
55
Dem
ocra
tic R
epub
lic o
f the
Con
go20
520
520
5G
reec
e9
65
Moz
amb
ique
221
208
205
Jap
an6
55
Burk
ina
Faso
207
207
207
Rep
ublic
of K
orea
65
5G
uine
a-Bi
ssau
235
215
211
Luxe
mb
ourg
65
5M
ali
233
224
222
Mal
ta11
65
Som
alia
225
225
225
Mon
aco
55
5Li
ber
ia23
523
523
5N
ethe
rlan
ds6
65
Afg
hani
stan
257
257
257
Slov
enia
75
5A
ngol
a26
026
026
0A
ustr
alia
66
6N
iger
295
270
264
Belg
ium
96
6Si
erra
Leo
ne29
328
628
4Br
unei
Dar
ussa
lam
97
6
Sour
ce: U
nite
d N
atio
ns S
tatis
tics
Div
isio
n, M
illen
nium
Indi
cato
rs D
atab
ase
(htt
p://
mill
enni
umin
dica
tors
.un.
org/
unsd
/).
a Ran
ked
acco
rdin
g to
the
leve
l of u
nder
-five
mor
talit
y in
200
2.

Trends and patterns of inequality 65
ganization, 2005b). This increase may be partly attributable to the high risk of mortality among the children of HIV-positive mothers, but poverty and health policies that deny the poor access to health services play a major role as well.
Between-country disparities in under-five mortality are large and persist-ent, despite increased attention and intervention over the past 50 years. Data for selected countries indicate that under-five mortality rates in 2000 ranged from 25 per 1,000 live births in Colombia to 229 per 1,000 live births in Mali (see table III.5). Exceptionally high rates (more than 100 deaths per 1,000 live births) are evident for almost all of sub-Saharan Africa and for Cambodia and Haiti. The 20 countries with the highest rates and the 20 countries with the lowest rates in the world in 2002 are shown in table III.6, along with their respective under-five mortality levels for 1995, 2000 and 2002. The data clearly indicate that the best-performing countries suffer virtually no under-five mortality, while in most of the worst-performing countries more than one in five children die before they reach the age of five. Of the 20 countries with the highest rates, 19 are in sub-Saharan Africa, the region that experi-enced the smallest decline (from 186 to 174 deaths per 1,000 live births, or a reduction of only 2 per cent) between 1990 and 2001.
Large differentials in under-five mortality can also be found within most countries. Data from recent Demographic and Health Surveys (DHS) indi-cate that rates are consistently higher in rural areas than in urban areas (ORC Macro, 2005). The data show that in countries such as Armenia (2000), Brazil (1996), Burkina Faso (1998/99), Colombia (2000), Côte d’Ivoire (1998/99), Egypt (1995), Ghana (1998), Nicaragua (2001) and Peru (2002), rural rates have been at least 1.5 times higher than urban rates of under-five mortality.
Among all the health indicators, maternal mortality rates reflect some of the greatest disparities between developed and developing countries. Ninety-nine per cent of maternal deaths worldwide occur in developing countries, and in poor countries as many as 30 per cent of deaths among women of reproductive age (15-49 years) may be from pregnancy-related causes, com-pared with rates of less than 1 per cent for developed countries. In 2000, there were 400 maternal deaths per 100,000 live births in developing regions, a ratio 19 times higher than in developed regions. The lifetime risk of mater-nal death was 1 in 61 for developing countries, which was 45 times greater than the risk of 1 in 2,800 for developed countries. Even among developing countries, maternal mortality rates varied widely. Disparities were extreme at the regional level; in 2000, the lifetime risk of 1 in 16 for sub-Saharan Africa was 249 times greater than the risk of 1 in 4,000 for Western Europe. Equally disquieting is the extent of morbidity or illness women experience in con-nection with pregnancy and childbirth. Even when they survive childbirth, women who receive inadequate maternity care often suffer from the long-term effects of complications such as obstetric fistula, infection or prolonged anaemia from excessive blood loss during delivery.

66 The Inequality Predicament
Tab
le II
I.7.
Im
mun
izat
ion
cove
rage
am
ong
child
ren
aged
12-
23 m
onth
s, b
y co
untr
y an
d se
lect
ed b
ackg
roun
d ch
arac
teris
tics
Coun
try
Year
Type
of r
esid
ence
Diff
eren
ce
(urb
an m
inus
ru
ral)
Hig
hest
leve
l of e
duca
tion
Diff
eren
ce
(sec
onda
ry
and
high
er
min
us n
o ed
ucat
ion)
Urb
anRu
ral
No
educ
atio
nPr
imar
y ed
ucat
ion
Seco
ndar
y ed
ucat
ion
or h
ighe
r
Arm
enia
2000
73.2
69.1
4.1
––
71.6
–Ba
ngla
desh
1999
/200
069
.658
.611
.053
.860
.172
.518
.7Be
nin
2001
64.4
56.1
8.3
55.7
63.1
75.1
19.4
Burk
ina
Faso
1998
/199
959
.525
.933
.625
.759
.663
.337
.6C
amb
odia
2000
46.3
39.0
7.3
29.1
41.4
58.8
29.7
Col
omb
ia
2000
54.8
46.0
8.8
26.7
46.9
56.6
29.9
Dom
inic
an R
epub
lic
1999
30.5
39.6
–9.1
–29
.940
.3–
Egyp
t 20
0092
.891
.81.
091
.492
.992
.61.
2Et
hiop
ia
2000
42.0
11.0
31.0
10.2
24.8
45.0
34.8
Gab
on20
0017
.85.
712
.119
.310
.217
.3-2
.0G
uate
mal
a19
98/1
999
55.2
62.1
–6.9
52.4
62.1
64.4
12.0
Gui
nea
1999
47.3
26.7
20.6
29.7
39.1
53.9
24.2
Hai
ti 20
0033
.633
.50.
123
.237
.743
.620
.4In
dia
1998
/99
54.8
34.9
19.9
24.7
46.0
61.4
36.7
Kaza
khst
an19
9974
.971
.73.
2–
–73
.1–
Mal
awi
2000
78.6
68.7
9.9
64.0
70.8
87.5
23.5
Mal
i20
0150
.321
.528
.825
.138
.862
.737
.6M
aurit
ania
20
00/2
001
38.0
27.4
10.6
27.4
39.6
30.5
3.1
Nep
al
2001
74.9
65.0
9.9
57.0
83.2
90.0
33.0
Nig
eria
1999
31.7
11.3
20.4
6.3
18.1
36.1
29.8
Peru
2000
60.4
51.1
9.3
43.8
51.7
61.1
17.3
Rwan
da20
0077
.075
.81.
272
.276
.882
.19.
9Ta
nzan
ia
1999
80.5
65.5
15.0
49.5
75.1
72.2
22.7
Turk
men
ista
n 20
0080
.188
.5–8
.474
.110
0.0
84.9
10.8
Uga
nda
2001
/200
242
.136
.06.
128
.337
.251
.122
.8Za
mb
ia19
9976
.967
.29.
758
.070
.676
.318
.3Zi
mb
abw
e 19
9965
.063
.61.
462
.960
.967
.24.
3
Sour
ce: O
RC M
acro
, MEA
SURE
DH
S ST
ATco
mp
iler (
http
://w
ww
.mea
sure
dhs.
com
; acc
esse
d 15
Feb
ruar
y 20
05).

Trends and patterns of inequality 67
Table III.8. Differentials within and between selected countries in access to skilled medical care at delivery for children born three years before the survey
Country Year of survey
Assistance at delivery
Doctor or health professional No birth attendant
Urban Rural Urban Rural
Guatemala 1998/1999 67.2 26.1 – 2.0Guinea 1999 77.1 21.8 2.5 9.0Haiti 2000 54.2 12.0 2.8 4.5India 1998/1999 73.3 33.5 0.1 0.6Kazakhstan 1999 99.1 99.5 – –Malawi 2000 81.1 50.5 1.3 2.6Mali 2001 81.7 27.4 5.4 19.1Mauritania 2000/2001 85.9 29.1 1.6 10.9Nepal 2001 53.7 11.5 4.0 8.4Nigeria 1999 57.9 35.3 9.6 12.1Peru 2000 86.5 27.4 0.4 1.7Rwanda 2000 64.8 18.2 5.5 22.4Tanzania 1999 82.7 33.5 1.0 8.7Turkmenistan 2000 98.4 96.7 0.2 0.1Uganda 2000/2001 81.3 33.4 4.4 15.5Zambia 2001/2002 78.1 27.1 2.8 8.2Zimbabwe 1999 90.0 64.3 1.0 4.4
Source: ORC Macro, MEASURE DHS STATcompiler (http://www.measuredhs.com; accessed 17 February 2005).
Health-related inequalities within and between countries are often the re-sult of differentials in underlying determinants of health, including education, access to health services, sanitation and nutrition. For example, child mortality differentials are governed by disparities in proximate determinants such as ac-cess to skilled medical care, nutrition, immunization and education.
Although it is known that the immunization of all children against killer childhood diseases significantly reduces child mortality, differentials in im-munization status remain wide both within and between countries. Table III.7 shows that within countries, immunization coverage is generally higher in urban areas and among children with more highly educated mothers. Be-tween countries, urban disparities and rural disparities are sizeable. For ex-ample, urban coverage is under 50 per cent in Cambodia, the Dominican Republic, Ethiopia, Gabon, Guinea, Haiti, Mauritania, Nigeria and Uganda but over 80 per cent in Tanzania and Turkmenistan and 93 per cent in Egypt. Similarly, rural coverage remains below 20 per cent in Ethiopia, Gabon and Nigeria but around 90 per cent in Egypt and Turkmenistan. Inequalities are also evident across maternal education categories; women with little or no education are less likely to have their children immunized than are those with secondary or higher education. From a policy perspective, it is disconcerting that the high inequalities in infant and child mortality persist, given that rela-

68 The Inequality Predicament
tively inexpensive preventive and remedial measures such as immunization against measles and other childhood diseases, the protection of drinking wa-ter, the practice of basic hygiene, and increased reliance on oral rehydration therapy and breastfeeding could prevent millions of deaths among children under the age of five every year. With regard to immunization, it is surprising that significant within-country differentials remain even though vaccination programmes specifically targeting underserved areas of developing countries have been in place for many years.
Inequalities characterizing child and maternal health and mortality are also closely linked to underlying inequalities within the health system, es-pecially differentials in access to prenatal care, skilled care at delivery and emergency obstetric care. Table III.8 shows within- and between-country disparities in women’s access to health professionals for the delivery of their babies. In Kazakhstan and Turkmenistan, almost 100 per cent of both urban and rural births are attended by a doctor or other health professional, putting those countries on par with developed countries. In contrast, fewer than 60 per cent of urban births in Haiti, Nepal and Nigeria are attended by a health professional, and the percentage is even lower for rural areas. In some coun-tries large proportions of rural births (19 per cent in Mali and 22 per cent in Rwanda) are attended by no one, raising the risks of both child and maternal mortality.
HIV/AIDS and other diseases
The HIV/AIDS epidemic is worsening in parts of Africa and Asia, while throughout most of Europe and North America significant progress is being made in controlling the epidemic and averting mortality; it is situations such
Table III.9. Adults and children affected by HIV/AIDS: the world and major regions, 2004
Regions
Adults and children
living with HIV
Adults and children
newly infected with HIV
Adult HIV prevalence
(percentage)
Adult and child
deaths due to AIDS
World 39.4 million 4.9 million 1.1 3.1 million Sub-Saharan Africa 25.4 million 3.1 million 7.4 2.3 million North Africa and Middle East 0.54 million 92 000 0.3 28 000 East Asia 1.1 million 290 000 0.1 51 000 South and South-East Asia 7.1 million 890 000 0.6 490 000 Latin America 1.7 million 240 000 0.6 95 000 Caribbean 440 000 53 000 2.3 36 000 Eastern Europe and Central Asia 1.4 million 210 000 0.8 60 000 Western and Central Europe 0.61 million 21 000 0.3 6 500 North America 1.0 million 44 000 0.6 16 000
Source: UNAIDS, AIDS Epidemic Update, December 2004 (http://www.unaids.org/wad2004/report.html; ac-cessed 13 April 2005).

Trends and patterns of inequality 69
as this that epitomize the strong link between poverty and health inequalities. The number of people living with HIV has been rising in every region, with especially steep increases in East Asia and in Eastern Europe and Central Asia; sub-Saharan Africa, with more than 25 million infected adults and children, has been the region hardest hit by the epidemic (see table III.9) (UNAIDS, 2004). The health and mortality gulf between developed and developing countries will continue to widen, as many of the countries most seriously affected by the HIV/AIDS epidemic have some of the lowest life expectan-cies recorded in recent history and are likely to experience continued high mortality over the next 50 years, while in the developed world the epidemic will have no perceptible impact on life expectancy.
One important reason for the inequalities generated by the HIV/AIDS epidemic relates to the availability and affordability of treatment. The rel-atively high cost of antiretroviral therapy prevents poorer individuals and Governments from obtaining treatments that can both reduce the risk of HIV transmission and prolong the lives of those who are already infected. Inequalities in the global pharmaceutical market and in national science and technology infrastructures have contributed to the predicament; poorer countries cannot afford the expensive drug therapies available abroad and are unable to produce cheaper generic equivalents locally, in part owing to their perennial lack of manufacturing capacity.5
The impact of the HIV/AIDS epidemic has extended beyond the health sector and, again, has been most widely felt in the poorest countries. The epidemic is linked to widening inequalities in poverty, social status, access to education and employment. In those countries in which HIV/AIDS is most prevalent, the epidemic is rapidly eroding the progress made in reduc-ing within- and between-country gender inequalities in access to educational
Table III.10. Women living with HIV: the world and major regions, 2004
Region
Number of women aged 15-49 years
living with HIV
Women as a proportion of adults
aged 15-49 years living with HIV (percentage)
World 17.6 million 47 Sub-Saharan Africa 13.3 million 57 Middle East and North Africa 250 000 48 East Asia 250 000 22 South and South-East Asia 2.1 million 30 Latin America 610 000 36 Caribbean 210 000 49 Eastern Europe and and Central Asia 490 000 34 Western and Central Europe 160 000 25 North America 260 000 25
Source: UNAIDS, AIDS Epidemic Update, December 2004 (http://www.unaids.org/wad2004/report.html; accessed 13 April 2005).

70 The Inequality Predicament
and employment opportunities. In East Asia, North America, and Western and Central Europe only about a quarter of HIV-infected individuals aged 15-49 years are women, but in sub-Saharan Africa women make up almost 60 per cent of this same group (see table III.10) and around 75 per cent of HIV-infected individuals aged 15-24 years (UNAIDS, 2004).
In addition to being at a disproportionately higher risk of acquiring HIV, females in the regions most seriously affected by the epidemic are more likely to bear the burden of caring for infected or affected family members. Girls, who often assume the responsibility of caring for sick parents and younger siblings, suffer the consequences of a truncated education, early entry into the unskilled labour force, possible exploitation and abuse, and subsequent poverty and social exclusion. The AIDS epidemic threatens to reverse the progress made in the past two decades in reducing the gender gap, particu-larly in access to education.
Within-country inequalities linked to HIV/AIDS are most evident in the area of human rights. The stigmatization of those infected and affected by HIV/AIDS has led to some of the worst forms of discrimination and isola-tion within communities. Women are especially vulnerable to discrimination when they become infected with HIV. In addition, inequalities under the law in some areas of the world frequently leave women who survive the death of an infected male relative without access to property or resources, driving them deeper into poverty.
A number of other diseases also contribute to the disparities in health and mortality indicators within and between countries. Malaria, in particu-lar, takes a heavy toll in areas in which the disease is endemic. WHO esti-mates that malaria kills at least 1 million people every year and contributes to another 2 million deaths. Since about 90 per cent of global malaria deaths occur in sub-Saharan Africa, and the overwhelming majority of those who die are young children, the human and monetary costs of the disease fall heavily on the region.
It is estimated that approximately 2 billion people are infected with the bacteria that cause TB, though healthy individuals may never develop active disease (Global Fund to Fight AIDS, Tuberculosis and Malaria, 2005). Each year there are about 8 million new cases of TB, and approximately 2 million people with suppressed immune systems die of the disease. Although TB is more prevalent in developing countries, it persists in developed countries as well, especially among lower socio-economic groups and those with HIV (United States General Accounting Office, 2000). Lack of compliance with treatment regimens has contributed to the emergence of drug-resistant strains of TB, undermining efforts to bring the disease under control. Drug-resistant strains of TB are present everywhere in the world but are particularly preva-lent in Africa, Central Asia and Eastern Europe (United States General Ac-counting Office, 2000).

Trends and patterns of inequality 71
In addition to being primary causes of illness and death, both malaria and TB may serve as complicating factors affecting the acquisition, progress or outcome of other diseases. According to the Global Fund to fight AIDS, Tuberculosis and Malaria, one third of people with HIV will also develop TB, as the weakening of the immune system leaves them more vulnerable to opportunistic infections. Most of the deaths associated with TB occur among those between the ages of 15 and 54, depriving communities of their most productive adults.
Hunger and malnutrition
Improvements in agricultural productivity and the development of food manufacturing and preservation technologies during the twentieth century have produced a world of abundance. Since the early 1970s, global food pro-duction has tripled and the price of major cereals has fallen by about 76 per cent. There is more than enough food in the world for all its inhabitants, and low-cost food supplies are produced in quantities sufficient to meet the needs of the growing global population. If food was distributed equitably around the world, enough would be available for everyone to consume an average of 2,760 calories a day (World Ecology Report, 2005). In spite of these facts and possibilities, appalling nutritional inequalities persist throughout the world.
Food emergencies, which can lead to famines or crises in which starva-tion from insufficient food intake combined with high rates of disease are associated with sharply increased death rates, have risen dramatically in the past several decades. The number of these emergencies has increased from an average of 15 per year during the 1980s to more than 30 per year since 2000. Most of the crises have taken place in Africa, where the average number of food emergencies every year has almost tripled in two decades. As of July 2004, 35 countries were experiencing food crises requiring emergency assist-ance (Food and Agriculture Organization of the United Nations, 2004).
In many parts of the world a significant proportion of the population suffers sustained nutritional deprivation, characterized by inadequate intake of protein and micronutrients and by frequent infections or disease. This long-term condition rarely receives media coverage, but more people may die from its indirect effects than from famine. Malnutrition affects around 852 million people worldwide, including 815 million in developing countries, 28 million in transition countries, and 9 million in the industrialized world. In the developing world 20 per cent of the total population is undernourished (Food and Agriculture Organization of the United Nations, 2004).
Malnutrition is one of the primary causes of child mortality, account-ing for about half of the 10.4 million child deaths occurring annually in the developing world. Malnourished children who survive often experience the long-lasting effects of disease and disability, reduced cognitive ability and school attendance in childhood, and lower productivity and lifetime earn-

72 The Inequality Predicament
ings in adulthood. The height and weight of almost a third of all children in developing countries fall far enough below the normal ranges for their age to signal chronic undernutrition, and WHO estimates that more than 3.7 mil-lion child deaths in 2000 were directly linked to the children being seriously underweight. In economic terms, every year that hunger remains at current levels, developing countries lose around US$ 500 billion or more in produc-tivity and earnings forgone as a result of premature death and disability (Food and Agriculture Organization of the United Nations, 2004). This burden is mainly borne by those who can least afford it, namely the poorest in society.
There are no clear signs that these trends will be reversed anytime soon. According to the Food and Agriculture Organization of the United Nations (FAO), the number of undernourished people in the developing world fell by 27 million between 1990-1992 and 2000-2002 but rose at an annual rate of almost 4 million between 1995-1997 and 2000-2002, seriously offsetting the gains achieved in previous years and resulting in a net reduction of only 9 million for the decade as a whole (1990-1992 to 2000-2002) (Food and Agriculture Organization of the United Nations, 2004).
There are added dimensions to the patterns of inequality characterizing food crises and sustained nutritional deprivation. In these situations, food may not be divided equitably among household members, with women, children (especially girls), and the elderly receiving proportionately less than adult men. Different studies of famines have helped explain the largely hu-man-induced economic, social and political factors that may contribute to food crises. Whether these situations are the result of man-made or natural disasters or a variable combination of the two, they reflect the inability of large groups of people to gain access to food in the societies in which they live, so the impact they have on the population depends on the way society is organized (Dreze and Sen, 1989). A study of the drought-induced famine in Wollo, Ethiopia, describes how the peasantry were engaged in subsistence agriculture and were generally able to manage until rising taxes and other obligations reduced many of them to acute poverty, leaving them with few resources or reserves with which to weather the drought (Dessalegn, 1987).
At the other end of the food spectrum, overnutrition (excessive calorie intake) is also becoming a global problem. There are more than 1 billion overweight adults in the world, at least 300 million of whom are clinically obese (Chopra, Galbraith and Darnton-Hill, 2002). Obesity levels have risen sharply in Australia, Canada, Europe and the United States during the past several decades (Flegal and others, 1998). The issue of overnourishment is addressed further in chapter IV.
Education
Substantial global inequalities persist in the realm of education. Although a number of developing countries, principally in Central Asia, East Asia and

Trends and patterns of inequality 73
the Pacific, Latin America and the Caribbean, and North Africa, are on track to achieving primary school enrolment ratios that are consistent with the Millennium Development Goals, significantly lower levels of educational progress and achievement are still being registered in sub-Saharan Africa and South and West Asia. In many countries school enrolment has improved, though in a number of areas completion rates remain low, especially among girls. Africa, especially sub-Saharan Africa, lags behind other developing re-gions, and a redoubling of efforts is required to overcome the region’s unfa-vourable initial conditions in terms of human capital.
Table III.11 illustrates the wide disparities in the educational status of household members both within and between selected developing countries.6 Incorporating two separate groupings, the table shows the countries with the highest and lowest proportions of uneducated males in the household, along with the extent of gender-specific educational inequality within and between countries for urban, rural and all households. Overall, the proportions of male household members who have had no education range from just under 3 per cent in Armenia to more than 70 per cent in Burkina Faso and Niger. Even more striking are the wide disparities in household educational attain-ment within countries. There are significant urban-rural differentials, with rural residents far more likely to have no education. In virtually every coun-try, female household members in both urban and rural areas are more likely than males to be uneducated.
Existing gaps in the educational attainment of household members reflect decades of unequal educational opportunities. Table III.12 shows the differ-ences in primary school enrolment between world regions. The net primary school enrolment ratio of 84 per cent at the global level conceals the much better performance of Central Asia, East Asia and the Pacific, Latin America and the Caribbean, and North America and Western Europe, all of which have ratios of over 90 per cent for 2001; it also fails to convey the much worse situation in sub-Saharan Africa, where net enrolment is only 62.8 per cent. Female enrolment ratios are generally lower than those of males.
The three regions faring the worst had the most substantial increases in primary school enrolment between 1998 and 2001, and two of them had very large numbers of students enrolled at this level. In sub-Saharan Africa alone, primary enrolment jumped by more than 11 million during this short period. While higher enrolment helps narrow the gaps in access to education, it also places increased pressure on the education systems of countries that are least able to handle it. Consequently, the quality of public education has suf-fered in many countries, and those who have sufficient resources and opt for a more expensive private education are augmenting their social and economic advantage over the poorer segments of society.
Studies indicate that inequality declines as the average years of schooling increase, with secondary education producing the greatest pay-off, especially for women (Cornia and Court, 2001). Given this fact, the global situation

74 The Inequality Predicament
Tab
le II
I.11.
Pe
rcen
tage
s of
tota
l, ur
ban
and
rura
l hou
seho
ld p
opul
atio
ns w
ith n
o ed
ucat
ion,
by
sex
Coun
try
Year
Tota
lU
rban
are
asRu
ral a
reas
Mal
esFe
mal
es
Diff
eren
ce
(fem
ales
-m
ales
Mal
esFe
mal
es
Diff
eren
ce
(fem
ales
-m
ales
)M
ales
Fem
ales
Diff
eren
ce
(fem
ales
-m
ales
)
Cou
ntrie
s w
ith th
e lo
wes
t pro
por
tion
of u
nedu
cate
d m
ales
Arm
enia
20
002.
82.
90.
12.
11.
9-0
.23.
74.
40.
7Ka
zakh
stan
19
994.
24.
90.
73.
04.
01.
05.
25.
70.
5Ky
rgyz
stan
1997
4.2
6.0
1.8
4.1
5.2
1.1
4.3
6.4
2.1
Phili
pp
ines
19
984.
24.
30.
12.
32.
3--
6.0
6.5
0.5
Boliv
ia
1998
4.9
13.7
8.8
2.0
6.6
4.6
10.3
27.4
17.1
Dom
inic
an R
epub
lic
1999
4.9
6.4
1.5
3.1
5.0
1.9
7.8
9.2
1.4
Uzb
ekis
tan
1996
5.7
6.2
0.5
4.8
5.0
0.2
6.2
7.0
0.8
Para
guay
19
905.
97.
61.
73.
95.
21.
37.
710
.42.
7Tu
rkm
enis
tan
2000
5.9
7.2
1.3
5.3
6.2
0.9
6.3
8.0
1.7
Peru
20
006.
112
.96.
83.
57.
03.
510
.824
.213
.4
Cou
ntrie
s w
ith th
e hi
ghes
t pro
por
tion
of u
nedu
cate
d m
ales
Côt
e d
’Ivoi
re
1998
/199
943
.657
.213
.629
.742
.412
.751
.766
.414
.7M
oroc
co19
9243
.964
.921
.025
.543
.417
.960
.083
.123
.1C
omor
os
1996
44.3
59.1
14.8
31.9
45.9
14.0
49.4
64.2
14.8
Eritr
ea
1995
54.4
67.3
12.9
19.7
36.6
16.9
67.7
80.5
12.8
Cha
d 19
96/1
997
56.1
77.7
21.6
39.6
57.9
18.3
62.1
83.4
21.3
Gui
nea
19
9959
.876
.416
.633
.851
.717
.971
.987
.115
.2Et
hiop
ia
2000
61.5
76.7
15.2
24.3
39.8
15.5
67.7
83.9
16.2
Mal
i 20
0166
.077
.011
.040
.455
.715
.376
.085
.19.
1Bu
rkin
a Fa
so
1998
/199
972
.183
.911
.832
.945
.312
.479
.790
.811
.1N
iger
19
9872
.783
.610
.941
.954
.612
.781
.090
.99.
9
Sour
ce: O
RC M
acro
, MEA
SURE
DH
S ST
ATco
mp
iler (
http
://w
ww
.mea
sure
dhs.
com
; acc
esse
d 23
Feb
ruar
y 20
05).

Trends and patterns of inequality 75
Tab
le II
I.12.
In
equa
litie
s in
prim
ary
scho
ol e
nrol
men
t: th
e w
orld
and
maj
or re
gion
s, 1
998
and
2001
Coun
try
or te
rrito
ry
Scho
ol-a
ge
popu
latio
n 20
01
(tho
usan
ds)
Enro
lmen
t in
prim
ary
educ
atio
nN
et e
nrol
men
t rat
io in
prim
ary
educ
atio
n (p
erce
ntag
e)
Tota
l (t
hous
ands
)Fe
mal
es
(per
cent
age)
Tota
lM
ales
Fem
ales
1998
2001
1998
2001
1998
2001
1998
2001
1998
2001
Wor
ld64
8 59
365
6 53
865
1 91
347
4784
.284
.087
.386
.580
.981
.5
Cou
ntrie
s in
tran
sitio
n14
259
15 9
3014
767
4949
84.6
90.1
85.0
90.3
84.1
89.8
D
evel
oped
cou
ntrie
s67
948
70 4
0665
552
4949
96.4
95.6
96.5
95.4
96.4
95.9
D
evel
opin
g co
untr
ies
566
386
570
207
569
617
4646
82.7
82.5
86.3
85.3
78.9
79.5
A
rab
Sta
tes
39 3
9634
725
36 2
5246
4678
.181
.182
.385
.173
.776
.9
Cen
tral
and
Eas
tern
Eur
ope
24 0
7925
484
23 6
7748
4886
.788
.888
.189
.985
.387
.7
Cen
tral
Asi
a6
627
6 94
96
667
4949
87.5
94.1
88.0
95.0
87.0
93.2
Ea
st A
sia
and
the
Paci
fic18
9 55
721
9 91
221
1 10
848
4896
.093
.796
.193
.795
.893
.6
Latin
Am
eric
a an
d th
e C
arib
bea
n58
064
78 5
8569
660
4948
94.2
95.7
94.8
95.6
93.5
95.9
N
orth
Am
eric
a an
d W
este
rn E
urop
e51
664
52 8
5849
643
4949
96.3
95.4
96.3
95.1
96.4
95.7
So
uth
and
Wes
t Asi
a17
0 87
415
8 09
616
0 39
844
4480
.279
.087
.584
.772
.373
.0
Sub
-Sah
aran
Afr
ica
108
332
80 4
0691
972
4546
57.6
62.8
61.4
66.4
53.8
59.2
Sour
ce: U
nite
d N
atio
ns E
duca
tiona
l, Sc
ient
ific
and
Cul
tura
l Org
aniz
atio
n, E
duca
tion
for A
ll G
loba
l Mon
itorin
g Re
port
, 200
5: T
he Q
ualit
y Im
pera
tive
(Par
is, 2
005)
.
Not
e: R
egio
nal a
vera
ges
are
wei
ghte
d m
eans
.

76 The Inequality Predicament
with regard to secondary and higher education is even more disquieting than the situation at the elementary school level. In table III.13, school enrolment statistics for the major regions and the world as a whole are used to show the extent of educational inequality at the secondary level; data on tertiary enrol-ment are more incomplete and less comparable. The table indicates that net enrolment ratios were significantly lower at the secondary level than at the primary level in 2001. Central Asia, Central and Eastern Europe, and North America and Western Europe had the highest levels of secondary enrolment, with ratios of over 80 per cent, while secondary enrolment in sub-Saharan Africa was a very low 21 per cent. The data for 2001 indicate that females were less likely to be enrolled in secondary school, except in Latin America and the Caribbean and in North America and Western Europe. Between 1998 and 2001 net secondary enrolment among young women improved markedly in Latin America and the Caribbean; Africa also registered a small increase.
Education is typically seen as a means of narrowing inequalities, and among those who receive it, that purpose is served; however, education also represents a medium through which the worst forms of social stratification and segmentation are created. Inequalities in educational attainment often translate into differentials in employment, occupation, income, residence and social class. In Latin America, for example, where inequalities within and between countries are considerable, the wide disparities in occupational earnings are directly attributable to the manner in which the market remu-nerates those with different levels of education (Instituto de Promoción de la Economía Social, 1999). Although there are differences between coun-tries, those with six years of education earn, on average, 50 per cent more than those with no education, and those with 12 years of education earn more than twice as much as those with no education. The study from which this information is taken notes that educational differentials explain 25 to 33 per cent of the income concentration in the countries of Latin America. Analysis of data from the Netherlands adds an intergenerational perspective by confirming that while a certain degree of mobility exists across income groups from one generation to the next, there is a strong tendency for edu-cational segmentation to persist across generations (de Graaf and Kalmijn, 2001).
In summary, the huge and persistent inequalities in education have far-reaching effects, leading to inequalities in employment, wages, health, power and social integration. To redress educational imbalances and thereby re-duce the inequalities they engender or perpetuate, effective policies and pro-grammes that target disadvantaged groups but also focus more broadly on improving educational access and quality for all must be implemented. The gender gap in education requires particular attention to ensure that neither sex is favoured over the other. The quality of education also needs to be addressed.
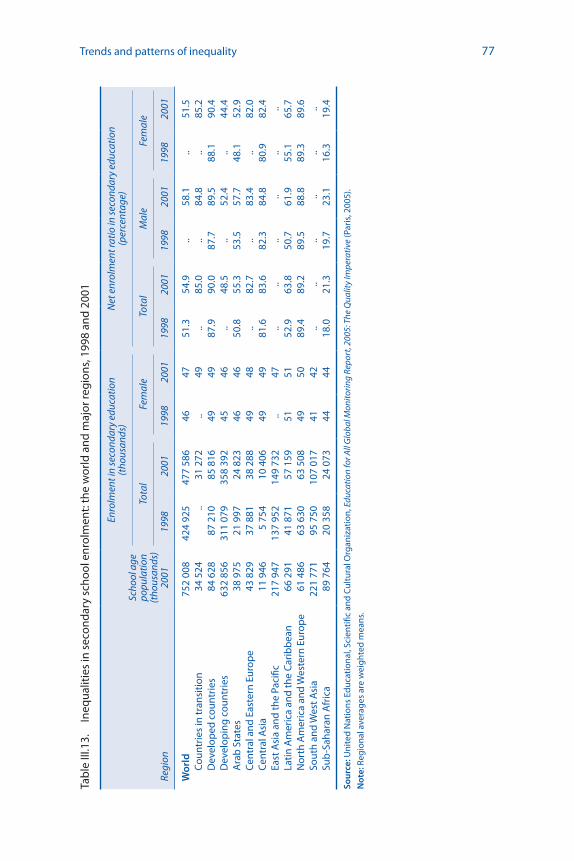
Trends and patterns of inequality 77
Tab
le II
I.13.
In
equa
litie
s in
sec
onda
ry s
choo
l enr
olm
ent:
the
wor
ld a
nd m
ajor
regi
ons,
199
8 an
d 20
01
Regi
on
Scho
ol a
ge
popu
latio
n (t
hous
ands
) 20
01
Enro
lmen
t in
seco
ndar
y ed
ucat
ion
(tho
usan
ds)
Net
enr
olm
ent r
atio
in se
cond
ary
educ
atio
n (p
erce
ntag
e)
Tota
lFe
mal
eTo
tal
Mal
eFe
mal
e
1998
2001
19
9820
01
1998
2001
1998
2001
1998
2001
Wor
ld75
2 00
842
4 92
547
7 58
646
4751
.354
.9..
58.1
..51
.5
Cou
ntrie
s in
tran
sitio
n34
524
..31
272
..49
..85
.0..
84.8
..85
.2
Dev
elop
ed c
ount
ries
84 6
2887
210
85 8
1649
4987
.990
.087
.789
.588
.190
.4
Dev
elop
ing
coun
trie
s63
2 85
631
1 07
935
8 39
245
46..
48.5
..52
.4..
44.4
A
rab
Sta
tes
38 9
7521
997
24 8
2346
4650
.855
.353
.557
.748
.152
.9
Cen
tral
and
Eas
tern
Eur
ope
43 8
2937
881
38 2
8849
48..
82.7
..83
.4..
82.0
C
entr
al A
sia
11 9
465
754
10 4
0649
4981
.683
.682
.384
.880
.982
.4
East
Asi
a an
d th
e Pa
cific
217
947
137
952
149
732
..47
....
....
....
La
tin A
mer
ica
and
the
Car
ibb
ean
66 2
9141
871
57 1
5951
5152
.963
.850
.761
.955
.165
.7
Nor
th A
mer
ica
and
Wes
tern
Eur
ope
61 4
8663
630
63 5
0849
5089
.489
.289
.588
.889
.389
.6
Sout
h an
d W
est A
sia
221
771
95 7
5010
7 01
741
42..
....
....
..
Sub
-Sah
aran
Afr
ica
89 7
6420
358
24 0
7344
4418
.021
.319
.723
.116
.319
.4
Sour
ce: U
nite
d N
atio
ns E
duca
tiona
l, Sc
ient
ific
and
Cul
tura
l Org
aniz
atio
n, E
duca
tion
for A
ll G
loba
l Mon
itorin
g Re
port
, 200
5: T
he Q
ualit
y Im
pera
tive
(Par
is, 2
005)
.
Not
e: R
egio
nal a
vera
ges
are
wei
ghte
d m
eans
.

78 The Inequality Predicament
Conclusion
A mixed picture emerges from the recent developments relating to factors that may influence levels of inequality within and between countries. There has been progress, especially in reducing inequalities in health and education, but there have also been significant setbacks. The sources of existing inequali-ties are often deep-rooted, ranging from economic liberalization policies that have both created and sustained inequalities to sociocultural factors that have impeded efforts to address them.
A number of factors have influenced the patterns and trends examined in this chapter. With respect to income distribution, for example, the evidence clearly suggests that overall gains at the global level derive largely from the exceptional economic growth in China and India; most other countries have not benefited from that growth. Within-country inequality in income distri-bution has worsened, even for a large group of industrialized countries. Pov-erty reduction efforts have been reasonably successful in some regions, while the poverty situation has stagnated or deteriorated in others. For example, the number of people in China living on less than US$ 1 a day plummeted from 634 million to 212 million between 1981 and 2000, but in sub-Saharan Af-rica the ranks of the abject poor increased by almost 90 million over a 10-year period (1990-2000). In Latin America, economic recession and stagnation occurring in the 1980s and 1990s had a significant impact on poverty levels. Among other regions the evidence paints more of a mixed picture.
Many countries continue to face deeply entrenched obstacles and chal-lenges that undermine poverty eradication efforts. At the socio-political level, these inhibiting factors include social exclusion and discrimination, which translate into a lack of opportunities and political power. In some countries poverty is exacerbated by disease and premature mortality, which deprive families and communities of their most productive members. Progress in re-ducing poverty is constrained in many instances by poor governance and by the burden of geography, particularly for small and landlocked countries. A number of economic factors hinder sustained poverty reduction as well, in-cluding low or unevenly distributed economic growth, high unemployment, heavy external debt, trade barriers, high levels of income inequality and com-modity dependency.
Economic growth is considered essential for sustained poverty reduc-tion. Liberalization policies, for example, are premised on the expectation that the benefits of increased economic growth will eventually filter down to the poor. There is growing recognition, however, that regardless of how much economic expansion a country experiences, poverty reduction is more likely to take place in countries in which Governments have implemented policies and programmes that promote equality, including initiatives to improve ac-cess to resources, income, education and employment.
Non-economic indicators are also linked to the persistence and deep-ening of various forms of inequality. All of the world’s regions have made

Trends and patterns of inequality 79
progress towards achieving education for all; however, large disparities are still evident in access to both primary and higher levels of schooling, and the quality of education remains uneven both within and between countries.
The HIV/AIDS epidemic has exacerbated both economic and non-economic inequalities. Infected and affected individuals and families are be-coming increasingly vulnerable; there is often a denial of or failure to enforce legal rights, and many lack access to basic education and health services. The situation is particularly alarming in sub-Saharan Africa; this region, which has been hardest hit by the epidemic, is performing poorly with respect to most economic and non-economic indicators, and the gaps between many countries in the region and the rest of the world are widening.
Gender inequalities are often deeply embedded in the fabric of socie-ties. There are persistent gender gaps in access to education and decent jobs, and in remuneration for equal work. In most countries the numbers and proportions of women in the workforce have risen over the past two dec-ades; however, the narrowing gender gap masks the deterioration in the terms and conditions of work among women (Razavi, 2005). The concentration of women in the lower-paying occupations remains high, which limits both their actual income and their opportunities for advancement (income poten-tial). Women constitute a disproportionate share of the world’s poor because they often have limited access to land, capital and labour markets, and they are more likely to be engaged in unpaid housework or low-paid domestic work. Women’s unequal access to economic and non-economic opportuni-ties is often at the root of their lower status in many societies, and those who are particularly vulnerable may be subject to abuse and sexual exploitation and rendered voiceless in issues related to their own welfare.
Notes
1 High-income non-OECD countries and territories, as classified by the World Bank, include Andorra, Antigua and Barbuda, Aruba, Bahamas, Bahrain, Barbados, Ber-muda, Brunei Darussalam, Cayman Islands, Channel Islands, Cyprus, Faeroe Islands, French Polynesia, Greenland, Guam, Hong Kong Special Administrative Region of China, Isle of Man, Israel, Kuwait, Liechtenstein, Macao, Malta, Monaco, Nether-lands Antilles, New Caledonia, Puerto Rico, Qatar, San Marino, Singapore, Slovenia, United Arab Emirates, and Virgin Islands.
2 The World Income Inequality Database (WIID), established and maintained by the United Nations University’s World Institute for Development Economics Research (UNU/WIDER), collects and stores information on income inequality for developed, developing and transition countries. The WIID was compiled over the period 1997-1999 by extending the data collected by Klaus Deininger and Lyn Squire for the UNU/WIDER-UNDP project “Rising income inequality and poverty reduction: Are they compatible?”, overseen by Giovanni Andrea Cornia, former Director of WID-ER. As more observations were added to the database, WIDER decided to make the database available to the public in order to facilitate further analysis and debate on

80 The Inequality Predicament
inequality (see the UNU/WIDER World Income Inequality Database, version 2.0 beta, 3 December 2004).
3 A common measure of national inequality is the Gini coefficient, which assesses the variation across individuals in a particular context. The Gini coefficient ranges from 0 (perfect equality) to 1 (perfect inequality).
4 In analyses conducted by ECLAC and the World Bank it is agreed that regional trends are worsening. However, the analyses differ in defining trends for some of the individual countries. While the World Bank indicates an improvement in the distribution of income in Brazil during the 1990s, ECLAC does not confirm this trend. In addition, the improvement observed by ECLAC in the Gini coefficient for Uruguay is not confirmed by the World Bank. Despite these differences, ECLAC and the World Bank reach the same conclusion for the region as a whole (J.A. Ocampo, “Latin America’s growth and equity frustrations during structural reforms”, Journal of Economic Perspectives, vol. 18, No. 2 [Spring 2004], p. 82).
5 Some of the countries hardest hit by the HIV/AIDS epidemic (including a number of least developed countries) do not have to abide by the provisions of the WTO Agree-ment on Trade-Related Aspects of Intellectual Property Rights (TRIPS Agreement) until 2016; the Doha Declaration on Public Health states that countries can make use of article 31 of the TRIPS Agreement and produce the drugs they need (the restric-tions are on exports of generics). The difficulty therefore lies not in obtaining produc-tion rights but in the lack of manufacturing capacity and the limits on the exports of generics from those countries that have to conform with the provisions of the WTO agreements (such as India, which has issued a new law).
6 The table includes data obtained at the household level for developing countries that have undertaken national Demographic and Health Surveys.