Embed Size (px)
Citation preview

Ecological Engineering 12 (1999) 13–25
Treatment of domestic and agricultural wastewaterby reed bed systems
Jurgen Kern *, Christine Idler
Department of Biological Engineering, Institute of Agricultural Engineering, Max-Eyth-Allee 100,14469 Potsdam, Germany
Abstract
The purification capacity and seasonal variability of two newly created reed bed systemswas monitored over 1 year. In one of the systems treating domestic wastewater, the reductionin the concentrations of chemical oxygen demand (COD), total N, total P and fecal coliformbacteria (FC) ranged from 80 to 99%. In the second system, treating a mixture of domesticand agricultural wastewater produced by a cheese dairy, treatment efficiency ranged between13 and 99%. The removal rates did not show any seasonal pattern for domestic wastewater,in contrast to the mixture of domestic and agricultural wastewater with increased removalrates in the summer. Bacteria which are involved in N metabolism was estimated by the mostprobable number-test (MPN). In both reed bed systems the MPN of proteolytic bacteria,ammonifiers, nitrifiers and denitrifiers/g DW of gravel substrate were of the orders ofmagnitude of 104–106, 105–107, 101–105 and 0–103, respectively. On the basis of themicrobial assemblage there is a need to improve the conditions for both nitrification anddenitrification to enhance the efficiency of N removal. © 1999 Elsevier Science B.V. All rightsreserved.
Keywords: Constructed wetlands; Wastewater treatment; Nitrogen dynamics; Denitrification
* Corresponding author. Tel.: +49 331 5699123; fax :+49 331 5699849;e-mail: [email protected]
0925-8574/99/$ - see front matter © 1999 Elsevier Science B.V. All rights reserved.
PII S0925-8574(98)00051-2

J. Kern, C. Idler / Ecological Engineering 12 (1999) 13–2514
1. Introduction
Wastewater disposal is a major problem in the new federal states of Germany,particularly in the rural areas of the state of Brandenburg. Very often thewastewater, derived from households and agricultural processes, is dischargeddirectly or indirectly into the soils due to a lack of sewerage reticulation and surfacewaters. Because the soils of Brandenburg are very sandy, the wastewater mayrapidly reach deeper layers of the soil and eventually pollute the groundwater.Groundwater concentrations of up to 50 mg l−1 NO3
−�N have already beenmeasured in various communities of Brandenburg.
In recent years there has been a growing interest in wetlands due to theirpotential in the removal of nutrients. Hanson et al. (1994) showed that up to 50%of the groundwater NO3
− may be removed by denitrification within riparianwetlands. The use of constructed wetlands opens up a vast area for the treatmentof various types of wastewater (Hammer, 1989; Moshiri, 1993). Reed bed systemshave proved to be an appropriate technology for cleaning municipal wastewater(Manfrinato et al., 1990; Brix, 1994a; Ansola et al., 1995; Cooper and Green, 1995;Li et al., 1995). However, relatively little information exists about the treatment ofagricultural wastewaters by reed beds. This may be linked with operational prob-lems that can occur as a result of high concentrations of suspended solids, N, P andfat in these wastewaters (van Oostrom and Cooper, 1990; Gray et al., 1990; Tanner,1994). To realize a high purification of agricultural wastewater, a pretreatment hasbeen considered as very important (Cronk, 1996). van Oostrom and Cooper, (1990)concluded that in the case of meat processing effluents, the use of constructedwetlands seemed to be restricted to a polishing stage after anaerobic or aerobictreatment. For dairy farm wastewater, constructed wetlands showed a considerablecleaning potential as reported by Tanner et al. (1995a,b).
With special focus on the microbial decomposition and on the fate of nitrogencompounds, this paper will discuss the performance of two reed bed systemsreceiving different types of wastewater.
2. Materials and methods
2.1. Study site and experimental design
The two reed bed systems studied each consist of two parallel reed beds, plantedwith Phragmites australis. One of these systems (two beds, each 16×4×1 m deep)treats the domestic wastewater from the School and Research Institute of Horticul-ture Großbeeren/Werder e.V. (Großbeeren) located south of Berlin (52°21%N,13°18%E). The other system (two beds, each 10×7×1.8 m deep), located at theOrganisation for Biodynamic Management Marienhohe e.V. (Marienhohe) near thevillage Bad Saarow (52°17%N, 14°01%E) receives a mixture of wastewater fromhouseholds and a cheese dairy with relative proportions of about 7:1. The waste-water flow in the Großbeeren system is horizontal, whereas at Marienhohe the

J. Kern, C. Idler / Ecological Engineering 12 (1999) 13–25 15
wastewater has a vertical flow. Fig. 1 shows the cross sections of the two reed bedsystems. In both systems the wastewater is pretreated in a settling tank. Hydraulicloading is intermittent, controlled by a siphon in Marienhohe and a float valve anda pump which are installed inside the settling tank in Großbeeren.
Both beds are rubber lined and filled to 0.6 and 1.5 m, respectively, with gravel(2–16 mm diameter) and operated as subsurface flow systems. The water table levelin the reed bed was controlled in Großbeeren 20–30 cm and in Marienhohe 100 cmbelow the gravel surface by an adjustable outflow pipe leading to a pond and intoan outlet tank, respectively. The low water table level in the Marienhohe reed bedwas a new management practice after the reconstruction of the reed bed had beenfinished in December, 1995. Formerly the reed bed that was filled with sand(0.3–2.0 mm diameter) had shown serious clogging problems.
The main data of the two reed bed systems under study are given in Table 1. Themean loading rate of wastewater treated at Großbeeren is half that treated atMarienhohe. Hydraulic residence times are 8 and 3 days in the Großbeeren andMarienhohe reed beds, respectively. After passing the reed bed and the outlet tankthe treated wastewater reaches a pond, in Großbeeren by natural flow, in Marien-hohe by pumping from the outlet tank into the pond.
Fig. 1. Cross sections of the reed bed systems at Großbeeren and Marienhohe, Germany.
J. Kern, C. Idler / Ecological Engineering 12 (1999) 13–2516
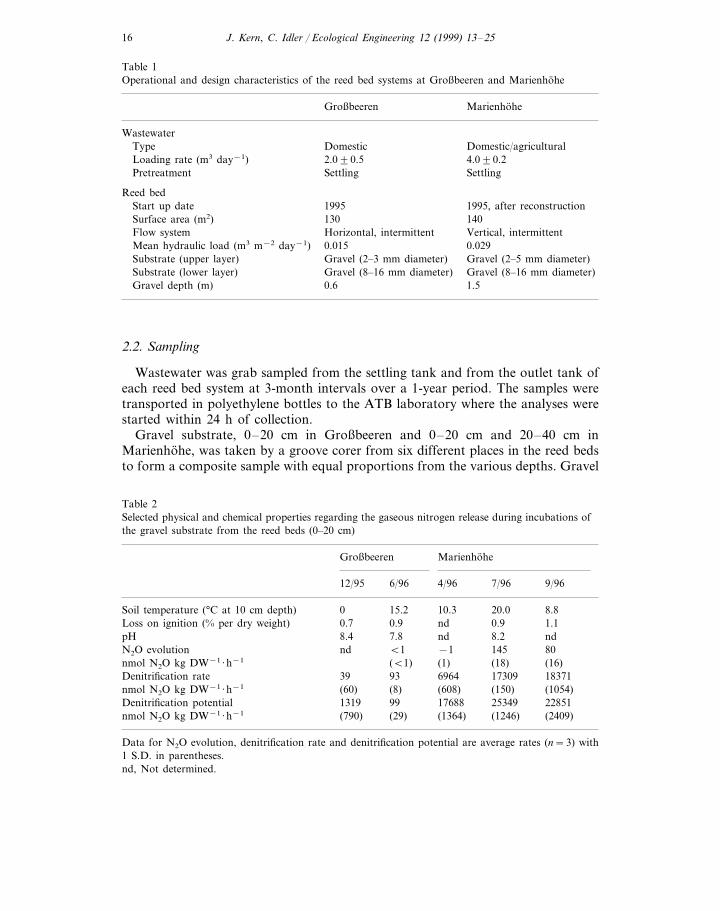
Table 1Operational and design characteristics of the reed bed systems at Großbeeren and Marienhohe
Großbeeren Marienhohe
WastewaterType Domestic Domestic/agricultural
4.090.22.090.5Loading rate (m3 day−1)SettlingSettlingPretreatment
Reed bed1995, after reconstructionStart up date 1995140130Surface area (m2)
Horizontal, intermittent Vertical, intermittentFlow system0.0290.015Mean hydraulic load (m3 m−2 day−1)Gravel (2–5 mm diameter)Gravel (2–3 mm diameter)Substrate (upper layer)
Gravel (8–16 mm diameter) Gravel (8–16 mm diameter)Substrate (lower layer)Gravel depth (m) 0.6 1.5
2.2. Sampling
Wastewater was grab sampled from the settling tank and from the outlet tank ofeach reed bed system at 3-month intervals over a 1-year period. The samples weretransported in polyethylene bottles to the ATB laboratory where the analyses werestarted within 24 h of collection.
Gravel substrate, 0–20 cm in Großbeeren and 0–20 cm and 20–40 cm inMarienhohe, was taken by a groove corer from six different places in the reed bedsto form a composite sample with equal proportions from the various depths. Gravel
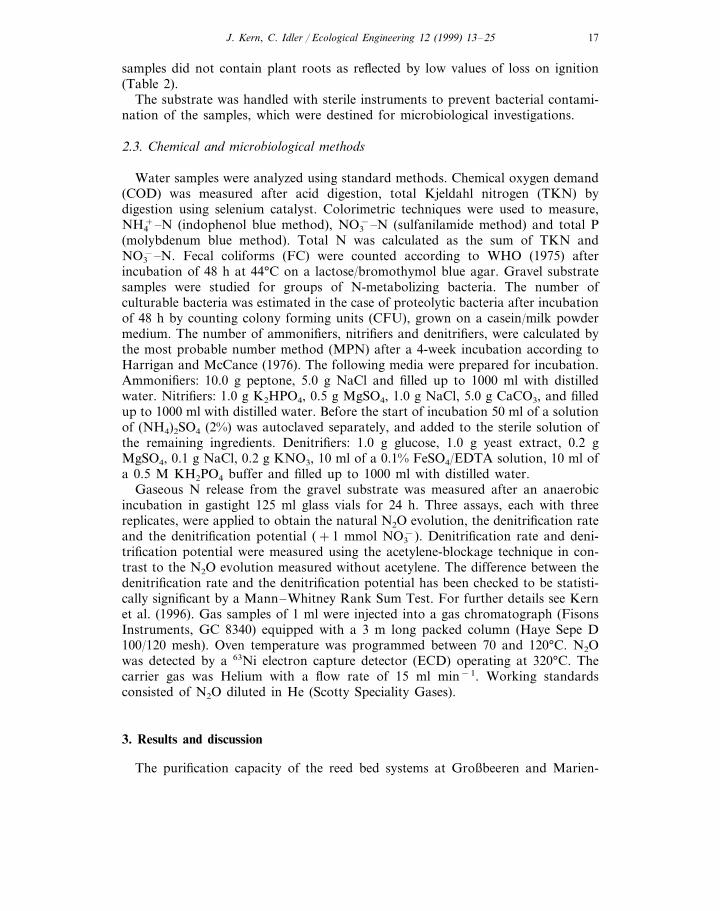
Table 2Selected physical and chemical properties regarding the gaseous nitrogen release during incubations ofthe gravel substrate from the reed beds (0–20 cm)
MarienhoheGroßbeeren
9/9612/95 6/96 4/96 7/96
20.0 8.80Soil temperature (°C at 10 cm depth) 15.2 10.30.9 1.10.9ndLoss on ignition (% per dry weight) 0.7
nd8.4 7.8 nd 8.2pHnd 145 80B1N2O evolution −1
(18) (16)(B1)nmol N2O kg DW−1 ·h−1 (1)18371173096964Denitrification rate 9339
(150)(60) (1054)(8) (608)nmol N2O kg DW−1 ·h−1
1319 99Denitrification potential 17688 25349 22851(1364)(29)(790) (1246)nmol N2O kg DW−1 ·h−1 (2409)
Data for N2O evolution, denitrification rate and denitrification potential are average rates (n=3) with1 S.D. in parentheses.nd, Not determined.
J. Kern, C. Idler / Ecological Engineering 12 (1999) 13–25 17
samples did not contain plant roots as reflected by low values of loss on ignition(Table 2).
The substrate was handled with sterile instruments to prevent bacterial contami-nation of the samples, which were destined for microbiological investigations.
2.3. Chemical and microbiological methods
Water samples were analyzed using standard methods. Chemical oxygen demand(COD) was measured after acid digestion, total Kjeldahl nitrogen (TKN) bydigestion using selenium catalyst. Colorimetric techniques were used to measure,NH4
+�N (indophenol blue method), NO3−�N (sulfanilamide method) and total P
(molybdenum blue method). Total N was calculated as the sum of TKN andNO3
−�N. Fecal coliforms (FC) were counted according to WHO (1975) afterincubation of 48 h at 44°C on a lactose/bromothymol blue agar. Gravel substratesamples were studied for groups of N-metabolizing bacteria. The number ofculturable bacteria was estimated in the case of proteolytic bacteria after incubationof 48 h by counting colony forming units (CFU), grown on a casein/milk powdermedium. The number of ammonifiers, nitrifiers and denitrifiers, were calculated bythe most probable number method (MPN) after a 4-week incubation according toHarrigan and McCance (1976). The following media were prepared for incubation.Ammonifiers: 10.0 g peptone, 5.0 g NaCl and filled up to 1000 ml with distilledwater. Nitrifiers: 1.0 g K2HPO4, 0.5 g MgSO4, 1.0 g NaCl, 5.0 g CaCO3, and filledup to 1000 ml with distilled water. Before the start of incubation 50 ml of a solutionof (NH4)2SO4 (2%) was autoclaved separately, and added to the sterile solution ofthe remaining ingredients. Denitrifiers: 1.0 g glucose, 1.0 g yeast extract, 0.2 gMgSO4, 0.1 g NaCl, 0.2 g KNO3, 10 ml of a 0.1% FeSO4/EDTA solution, 10 ml ofa 0.5 M KH2PO4 buffer and filled up to 1000 ml with distilled water.
Gaseous N release from the gravel substrate was measured after an anaerobicincubation in gastight 125 ml glass vials for 24 h. Three assays, each with threereplicates, were applied to obtain the natural N2O evolution, the denitrification rateand the denitrification potential (+1 mmol NO3
−). Denitrification rate and deni-trification potential were measured using the acetylene-blockage technique in con-trast to the N2O evolution measured without acetylene. The difference between thedenitrification rate and the denitrification potential has been checked to be statisti-cally significant by a Mann–Whitney Rank Sum Test. For further details see Kernet al. (1996). Gas samples of 1 ml were injected into a gas chromatograph (FisonsInstruments, GC 8340) equipped with a 3 m long packed column (Haye Sepe D100/120 mesh). Oven temperature was programmed between 70 and 120°C. N2Owas detected by a 63Ni electron capture detector (ECD) operating at 320°C. Thecarrier gas was Helium with a flow rate of 15 ml min−1. Working standardsconsisted of N2O diluted in He (Scotty Speciality Gases).
3. Results and discussion
The purification capacity of the reed bed systems at Großbeeren and Marien-

J. Kern, C. Idler / Ecological Engineering 12 (1999) 13–2518
Fig. 2. Influent and effluent concentrations in the reed bed systems at Großbeeren and Marienhohe.Percentage reductions are shown above effluent concentrations and the nitrate component of effluenttotal N identified.
hohe, expressed in terms of influent and effluent concentrations, was monitoredover four seasons during 1995/1996 (Fig. 2). Generally the wastewater ofGroßbeeren was less polluted than that of Marienhohe, except the influent total N
J. Kern, C. Idler / Ecological Engineering 12 (1999) 13–25 19
concentration was always higher in Großbeeren due to the dominance of toilet water.Considering the difference between influent and effluent, the removal rates in the reedbed of Großbeeren generally exceeded those of Marienhohe during the whole studyperiod. The reduction in the concentrations of COD, total N, total P and FC rangedfrom 80 to 99% and from 13 to 99% in Großbeeren and Marienhohe, respectively.
Due to the fatty constituents of the cheese dairy wastewater in the influent atMarienhohe, it showed high COD concentrations of between 500–800 mg l−1. CODremoval was highest in summer probably reflecting the impact of temperature on themicrobial processes. This seasonal pattern also occurred for total N, total P and FCremoval. The removal of total N at Marienhohe ranging between 13 and 63%, wasrelatively low (Fig. 2). A significant amount of the nitrogen in the effluent was inthe form of NH4
+ (24.8 mg N/l) and NO3− (31.8 mg N/l), indicating that nitrification
and denitrification were incomplete (Table 3).High numbers of proteolytic (10−4–10−6) and ammonifying bacteria (10−5–
10−7) reflect an intensive mineralization of organic N, although there seems to beno correlation between the total N of the influent (Fig. 2) and the bacterial numbersin the gravel substrate (Fig. 3). Much lower however, were the numbers of nitrifiersand denitrifiers. Compared with Großbeeren, the reed bed in Marienhohe seemed tohave a relatively high number of nitrifiers with a large range (10−1–10−5) reflectinga high nitrifying potential. This may be linked generally with high NO3
−-Nconcentrations in the effluent. However, considering the mean NH4-N concentrationsin the effluent, the removal rate in Großbeeren (95.8%) is obviously higher than thatin Marienhohe (66.6%). Consequently, the estimated number of nitrifiers does notappear to reflect the real activity of ammonium oxidizing bacteria. On the otherhand, the reduction of NO3
− to N2 and N2O at Marienhohe might have been retardedby low numbers of denitrifying bacteria, and an environment that was not suitablefor denitrification. Denitrification at Marienhohe was probably limited by thepresence of atmospheric oxygen, which could penetrate the reed bed easily, due tothe coarse gravel substrate, the low water table level and the intermittent verticalwater flow. To overcome these problems and to enhance the N removal bydenitrification, further efforts have to be made to improve the design criteria atMarienhohe. A combination of two stages with low and high water table levels mightbe helpful. Recently, different strategies for advanced nitrogen removal fromdomestic wastewater have been tested by Laber et al. (1997). By recirculation ofnitrified effluent from the soil filter back to the settling tank at the influent, theremoval rate of total N could be enhanced from 34 to 72%. Another approach addingmethanol as a carbon source for denitrifying bacteria let increase the removal rateof total N during intermittent loading from 28 to 78%.
In spite of a low MPN of denitrifiers and low total N removal under laboratoryconditions, there was high denitrifying activity at Marienhohe, which was muchhigher than at Großbeeren (Table 2).
This may reflect the more favorable conditions for denitrification achieved by theanaerobic atmosphere within the incubation vessels. It is not clear, however, whythe MPN of denitrifiers, which was obtained under anaerobic conditions as well,was so low. Principally, the MPN test for denitrifiers may be criticized because it

J. Kern, C. Idler / Ecological Engineering 12 (1999) 13–2520
Tab
le3
Ave
rage
influ
ent
and
efflu
ent
conc
entr
atio
nsan
dco
rres
pond
ing
rem
oval
rate
sof
chem
ical
oxyg
ende
man
d,to
tal
N,
NH
4+-N
,N
O3−
-N,
tota
lP
and
feca
lco
lifor
ms
inth
ere
edbe
dsof
this
and
othe
rst
udie
s
Tot
alN
NH
4�N
NO
3�N
Tot
alP
Fec
alco
lifor
ms
Ref
eren
ces
Typ
eof
was
tew
ater
Hyd
raul
iclo
adC
OD
(m3
d−1
per
m−
2)
0.01
5D
omes
tic
9.9
2900
Thi
sst
udy,
Gro
ßbee
ren,
0.7
Influ
ent
(mg
l−1)
183.
420
9.9
317.
66.
81.
226
Ger
man
y25
.618
.87.
8E
fflue
nt(m
gl−
1)
Rem
oval
(%)
87.9
99.1
91.9
91.0
95.8
0
0.02
9C
hees
eda
iry/
dom
esti
c10
.484
000
0T
his
stud
y,M
arie
nhoh
e,In
fluen
t(m
gl−
1)
628.
297
.074
.10.
64.
733
000
Ger
man
y31
.824
.8E
fflue
nt(m
gl−
1)
63.1
88.8
66.6
054
.896
.1R
emov
al(%
)85
.935
.0
0.04
7M
unic
ipal
4.8
2.1
0.9
8100
Li
etal
.(1
995)
,C
hina
Influ
ent
(mg
l−1)
547.
014
.40.
48
0.6
Effl
uent
(mg
l−1)
103.
02.
05.
173
.255
.399
.981
.264
.659
.4R
emov
al(%
)
van
Oos
tron
and
Coo
per
(199
0),
Mea
tpr
oces
sing
0.04
615
.0N
ewZ
eala
ndIn
fluen
t(m
gl−
1)
94.0
125.
015
31.0
11.0
330.
099
.094
.0E
fflue
nt(m
gl−
1)
27.0
78.0
21.0
0.0
Rem
oval
(%)
Che
ese
dair
y0.
022
0.4
10.4
3410
Zus
tan
dSc
honb
eron
(199
4),
537.
726
.0In
fluen
t(m
gl−
1)
14.9
1.3
5.0
37Sw
itze
rlan
d95
.314
.210
.4E
fflue
nt(m
gl−
1)
51.9
98.9
0.0
Rem
oval
(%)
30.4
45.3
82.2

J. Kern, C. Idler / Ecological Engineering 12 (1999) 13–25 21
Tab
le3
(Con
tinu
ed)
Tot
alN
NH
4�N
NO
3�N
Tot
alP
Fec
alco
lifor
ms
Ref
eren
ces
Typ
eof
was
tew
ater
CO
DH
ydra
ulic
load
(m3
d−1
per
m−
2)
Dai
ryfa
rm0.
2111
.214
35T
anne
ret
al.
(199
5a),
Influ
ent
(mg
l−1)
21.6
38.2
—88
Tan
ner
etal
.(1
995b
),—
—E
fflue
nt(m
gl−
1)
*71.
074
.093
.9N
ewZ
eala
ndR
emov
al(%
)*7
5.0
Dai
ryfa
rm0.
073
11.2
1890
Tan
ner
etal
.(1
995a
),38
.2In
fluen
t(m
gl−
1)
21.6
Effl
uent
(mg
l−1)
—45
0T
anne
ret
al.
(199
5b),
——
*37.
076
.2N
ewZ
eala
nd*4
8.0
Rem
oval
(%)
*34.
0
*%
rem
oval
isba
sed
onm
ass
flow
s.

J. Kern, C. Idler / Ecological Engineering 12 (1999) 13–2522
relies on the development of a gas bubble without specific analysis as done by theacetylene-blockage technique. A low MPN can also be explained by a mediumwhich was not appropriate for denitrifiers. The intensity of denitrification seems tobe highly dependent on the supply of a suitable carbon source (Isaacs and Henze,1995; Laber et al., 1997). That means, the high denitrifying activity at Marienhohe,
Fig. 3. Mean number of bacteria in 0–20 and 20–40 cm depth samples of gravel substrate from the reedbeds at Großbeeren and Marienhohe. nd, Not detected.
J. Kern, C. Idler / Ecological Engineering 12 (1999) 13–25 23
measured as accumulation of N2O, may be due to the high influent COD at thissite.
The natural N2O evolution rate was less than 1% of the denitrification rate whenthe acetylene block technique was used (Table 2). An important factor controllingthe N2/N2O ratio is the pH value (Gale et al., 1993). Because the pH of the gravelin both the Großbeeren and Marienhohe reed beds, was high (7.8–8.4), denitrifica-tion could run mainly to N2 (Table 2). The denitrification potential was significantlyhigher (P=0.05) than the denitrification rate except at Großbeeren on June 1996,indicating that denitrifying enzymes were not saturated with NO3
− during thedenitrification test.
The removal of N in constructed wetlands is very often lower than for COD(Table 3). The operational design has to guarantee both oxic conditions fornitrification and anoxic conditions for denitrification. In contrast to the reed bedsat Marienhohe, in which primarily denitrification was limited, other studies haveshown that N removal in wetlands can also be limited above all by insufficientnitrification (van Oostrom and Cooper, 1990; Zust and Schonborn, 1994). Thewastewater studied by Zust and Schonborn (1994), which was derived from a cheesedairy and therefore had characteristics similar to those of Marienhohe, showednearly the same concentration of COD and total P. High numbers of FC in theinfluent and effluent at Marienhohe may be explained by the lack of disinfectants,which are never applied during the production of milk and cheese. Nevertheless, thepercentage efficiency for the reduction of FC showed similar results to those inother reed beds (Table 3).
Another factor which affects the purification process is the hydraulic loadingrate, which typically ranges between 0.025–0.050 m3 m2−1 day in reed beds (Brix1994b). An increase of the hydraulic loading rate within this range correspondswith a decrease in the removal rate as shown in Table 3 and reported by Phipps andCrumpton (1994) and Tanner et al. (1995a,b). Despite some uncertainties in dailyhydraulic loadings we can assume low hydraulic loading rates in the reed bedsunder study. In contrast to Marienhohe, the Großbeeren system had a greatervariability due to the varying school attendance of the Research Institute. Thismight have affected the removal rates, as possibly found in September 1996 wherethere was a slight decrease in the removal rates of COD, total N and total P.
Although the data set is limited, the results give some information about the earlyperfomance of two newly created reed bed systems. Rootzone depth has not beenmeasured. However, due to the short period of operation of both systems, plantroots should not have reached the maximum depth and thus the purificationcapacity is likely to become considerably higher than it was during the study period.
Acknowledgements
This study is part of a cooperation between the Institute of AgriculturalEngineering Bornim e.V., the School and Research Institute of HorticultureGroßbeeren/Werder e.V. and the Organisation for Biodynamic Management

J. Kern, C. Idler / Ecological Engineering 12 (1999) 13–2524
Marienhohe e.V. The authors acknowledge the technical assistance of GundulaCarlow, Ulrike Knuth and Harald Fuchs.
References
Ansola, G., Fernandez, C., De Luis, E., 1995. Removal of organic matter and nutrients from urbanwastewater by using an experimental emergent aquatic macrophyte system. Ecol. Eng. 5, 13–19.
Brix, H., 1994a. Constructed wetlands for municipal wastewater treatment in Europe. In: Mitsch, W.J.(Ed.), Global Wetlands. Elsevier Science B.V., Amsterdam, pp. 325–333.
Brix, H., 1994b. Use of constructed wetlands in water pollution control: historical development, presentstatus, and future perspectives. Water Sci. Tech. 30, 209–223.
Cooper, P., Green, B., 1995. Reed bed treatment systems for sewage treatment in the UnitedKingdom—The first 10 years experience. Water Sci. Tech. 32, 317–327.
Cronk, J.K., 1996. Constructed wetlands to treat wastewater from dairy and swine operations: a review.Agric. Ecosyst. Environ. 58, 97–114.
Gale, P.M., Devai, I., Reddy, K.R., Graetz, D.A., 1993. Denitrification potential of soils fromconstructed and natural wetlands. Ecol. Eng. 2, 119–130.
Gray, K.R., Biddlestone, A.J., Job, G., Galanos, E., 1990. The use of reed beds for the treatment ofagricultural effluents. In: Cooper, P.F., Findlater, B.C. (Eds.), Constructed Wetlands in WaterPollution Control. Pergamon Press, Oxford, pp. 333–346.
Hammer, D.A., 1989. Constructed wetlands for wastewater treatment. Lewis Publishers, Boca Raton,pp. 831.
Hanson, G.C., Groffmann, P.M., Gold, A.J., 1994. Denitrification in riparian wetlands receiving highand low groundwater nitrate inputs. J. Environ. Qual. 23, 917–922.
Harrigan, W.F., McCance, M.E., 1976. Laboratory Methods in Food and Dairy Microbiology.Academic Press, London.
Isaacs, S.H., Henze, M., 1995. Controlled carbon source addition to an alternating nitrification-denitrifi-cation wastewater treatment process including biological P removal. Water Res. 29, 77–89.
Kern, J., Darwich, A., Furch, K., Junk, W.J., 1996. Seasonal denitrification in flooded and exposedsediments from the Amazon floodplain at Lago Camaleao. Microb. Ecol. 32, 47–57.
Laber, J., Perfler, R., Haberl, R., 1997. Two strategies for advanced nitrogen elimination in vertical flowconstructed wetlands. Water Sci. Tech. 35, 71–77.
Li, S.R., Ding, T., Wang, S., 1995. Reed-bed treatment for municipal and industrial wastewater inBeijing, China. J. Chart. Inst. Water Env. Manag. 9, 581–588.
Manfrinato, E.S., Filho, E.S., Salati, E., 1990. Water supply system utilizing the edaphic-phytodepura-tion technique. In: Cooper, P.F., Findlater, B.C. (Eds.), Constructed Wetlands in Water PollutionControl. Pergamon Press, Oxford, pp. 591–594.
Moshiri, G.A., 1993. Constructed Wetlands for Water Quality Improvement. Lewis Publishers, BocaRaton, pp. 632.
Phipps, R.G., Crumpton, W.G., 1994. Factors affecting nitrogen loss in experimental wetlands withdifferent hydrologic loads. Ecol. Eng. 3, 399–408.
Tanner, CC, 1994. Treatment of dairy farm wastewaters in horizontal and up-flow gravel-bed con-structed wetlands. Water Sci. Tech. 29, 85–93.
Tanner, C.C., Clayton, J.S., Upsell, M.P., 1995a. Effect of loading rate and planting on treatment ofdairy farm wastewaters in constructed wetlands-I. Removal of oxygen demand, suspended solids andfaecal coliforms. Water Res. 29, 17–26.
Tanner, C.C., Clayton, J.S., Upsell, M.P., 1995b. Effect of loading rate and planting on treatment ofdairy farm wastewaters in constructed wetlands-II. Removal of nitrogen and phosphorus. Water Res.29, 27–34.
van Oostrom, A.J., Cooper, R.N., 1990. Meat processing effluent treatment in surface-flow andgravel-bed constructed wastewater wetlands. In: Cooper, P.F., Findlater, B.C. (Eds.), ConstructedWetlands in Water Pollution Control. Pergamon Press, Oxford, pp. 321–332.

J. Kern, C. Idler / Ecological Engineering 12 (1999) 13–25 25
WHO, 1975. World Health Organisation, Regional Office for Europe. Manual on Analysis for WaterPollution Control, Chapter III: Bacteriological Examination. EURO 3110 (7)/5, Geneva.
Zust, B., A. Schonborn, 1994. Naturnahe Reinigung von Kasereiabwasser. Zentrum fur angewandteO8 kologie, Schattweid, 49.
..