Embed Size (px)
Citation preview

Treatment and Potential Uses of
Wastewater
Narayan C. Ghosh, Ph. D
Scientist-G & Head
Groundwater Hydrology Division
National Institute of Hydrology, Roorkee
Email : [email protected]
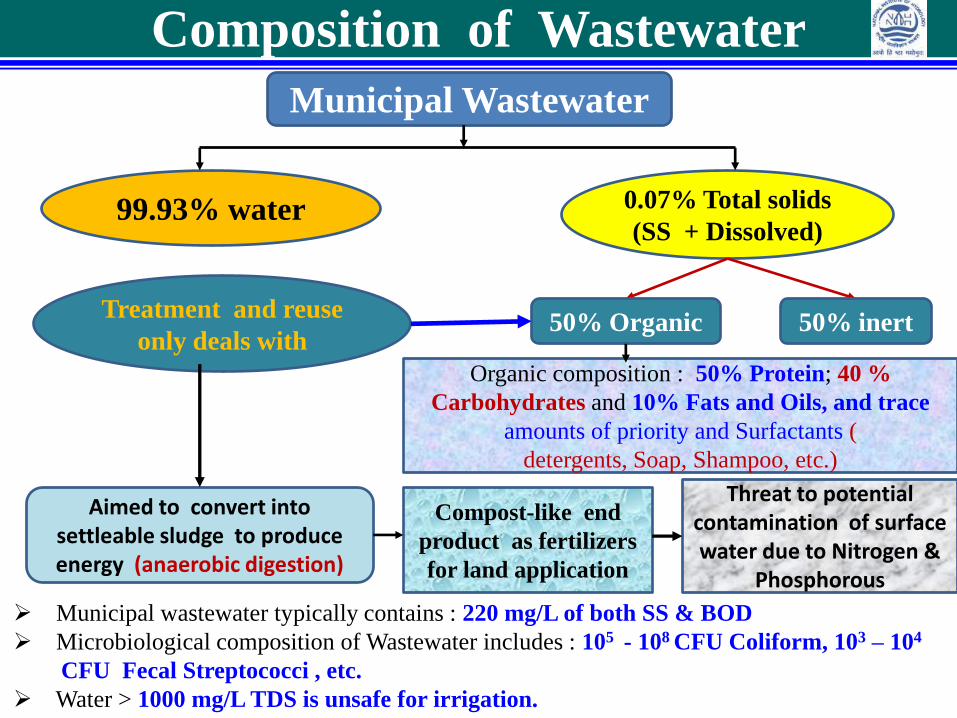
Composition of Wastewater
Municipal Wastewater
99.93% water 0.07% Total solids
(SS + Dissolved)
Aimed to convert into settleable sludge to produce energy (anaerobic digestion)
Compost-like end
product as fertilizers
for land application
Threat to potential contamination of surface water due to Nitrogen &
Phosphorous
Municipal wastewater typically contains : 220 mg/L of both SS & BOD
Microbiological composition of Wastewater includes : 105 - 108 CFU Coliform, 103 – 104
CFU Fecal Streptococci , etc.
Water > 1000 mg/L TDS is unsafe for irrigation.
50% Organic 50% inertTreatment and reuse
only deals with
Organic composition : 50% Protein; 40 %
Carbohydrates and 10% Fats and Oils, and trace
amounts of priority and Surfactants (
detergents, Soap, Shampoo, etc.)

Composition of Wastewater contd..
Industrial Wastewater (Point Source Pollution)
Sector Pollutant
Iron and Steel BOD, COD, Oil, Metals, Acids, Phenols and Cyanide
Textiles and Leather BOD, Solids, Sulfates and Chromium
Pulp and Paper BOD, COD, Solids, Chlorinated organic compounds
Petrochemicals and
Refineries
BOD, COD, Mineral oils, Phenols, and Chromium
Chemicals COD, Organic Chemicals, Heavy metals, SS and
Cyanide
Non-ferrous metals Fluorine and SS
Microelectronics COD and Organic Chemicals
Mining SS, Metals, Acids and Salts

Composition of Wastewater contd..
Agricultural Wastewater (Nonpoint and point Source Pollution )
Source Pollutant
Sediment Runoff SS and Turbidity
Nutrient Runoff Nitrogen, Phosphorous, and Sludge
Pesticides Active ingredients and other ingredients
Animal Wastes Strong Organic contents, Nitrate and
Phosphorous, Solid concentration, Antibiotics,
Hormones, Parasites, Pathogenic Bacteria, etc
Piggery Wastes Same as animal wastes, and elevated Copper.
Milking Parlor wastes Organic pollutants, Disinfection chemicals, etc.
Slaughtering Wastes Same as Milking Parlor
Vegetable Washing
Water
Soil and Vegetable Pieces, and Pesticides

Potential Treatment Techniques
Municipal Wastewaters
Natural Treatment Techniques (NTTs): Stabilization or oxidation
ponds, Natural and Constructed Wetlands, Phyto and Bio-remediation.
(Land Footprint is more).
Mechanized Treatment Techniques : Aerated Lagoon, Trickling
Filters, Conventional Treatment Techniques, etc.
(Costly and recurring energy foot print and O & M cost).
Combination of NTT & Mechanized system : CW followed by
oxidation or stabilization pond , Or, Aerated Lagoon followed by
oxidation pond. ( Marginal land and Energy foot prints).
Advanced Technique : Blasted Sand Flocculation (BSF) together
with mechanized system. ( Efficient &
Reduced land foot prints)
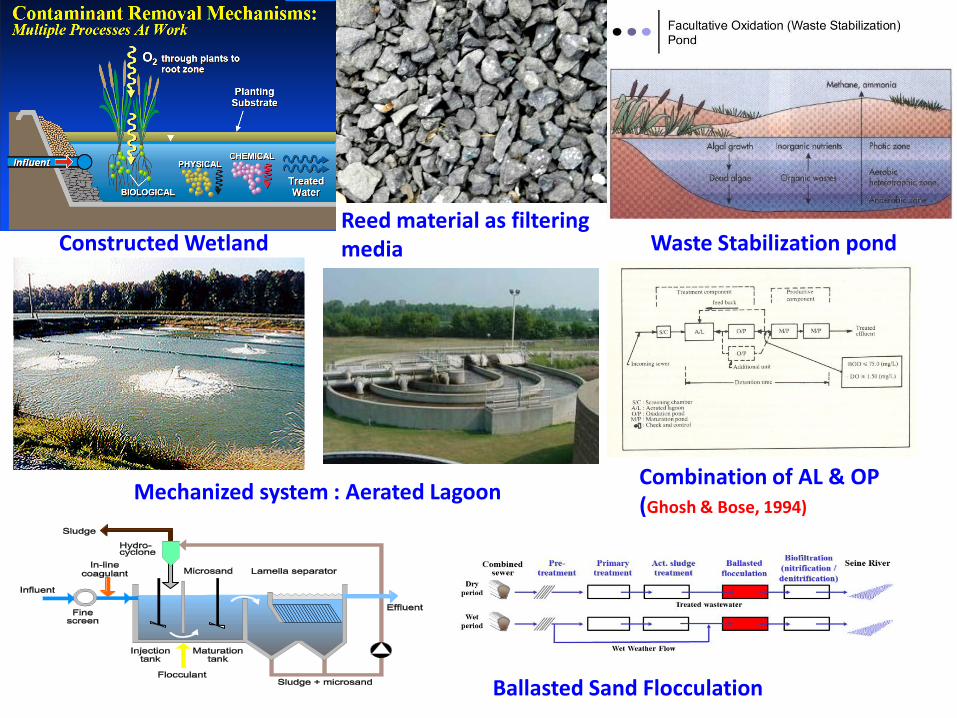
Constructed Wetland Reed material as filtering media Waste Stabilization pond
Mechanized system : Aerated LagoonCombination of AL & OP(Ghosh & Bose, 1994)
Ballasted Sand Flocculation

Potential Treatment Techniques contd..
Industrial Wastewater
Techniques :Mechanized techniques vary from types ofIndustrial effluents.
Primary – Secondary-Tertiary Treatment of Wastewater

Potential Uses of Reclaimed Wastewaters
• Urban uses
• Industrial uses • Agricultural purposes• Habitat restoration/enhancement and recreational uses• Groundwater recharge
Uses of Treated Wastewater
Municipal Industrial
IndustriesGroundwater RechargeUrban useRecreation Agriculture
Concerns
Public Health Public acceptance
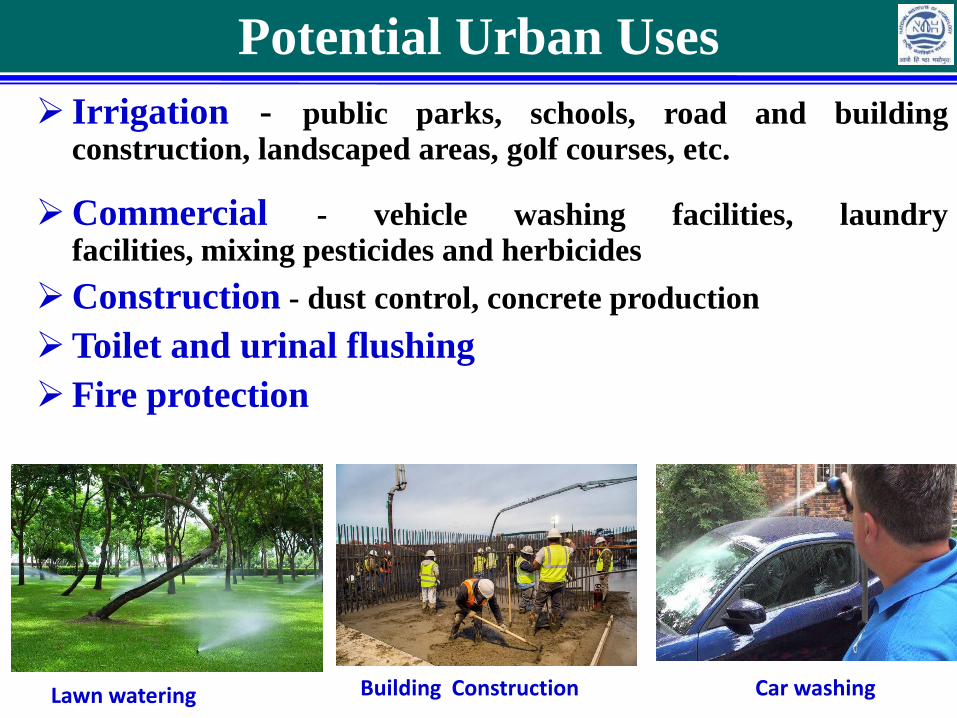
Potential Urban Uses
Irrigation - public parks, schools, road and building
construction, landscaped areas, golf courses, etc.
Commercial - vehicle washing facilities, laundry
facilities, mixing pesticides and herbicides
Construction - dust control, concrete production
Toilet and urinal flushing
Fire protection
Lawn watering Building Construction Car washing

High concentrations of nutrients
May eliminate need for fertilizer
Long-term soil enrichment
Decreases demand on potable water
supply
Additional treatment in soil
Agricultural uses
Health risk from associated pathogens
Health risk from other contaminants
( e.g. metals, chemicals, pharmaceuticals)
Decrease in soil quality from accumulation
of metals and acidification.
Contamination of groundwater
Benefits Limitations
Potential Agricultural Uses

• Establish saltwater intrusion barriers
• Provide further treatment for future
reuse
• Provide storage of reclaimed water
for subsequent retrieval and reuse
• Control or prevent ground subsidence
• No evaporation, taste and odor
• Extensive land areas needed forspreading basins
• Costs of treatment, water qualitymonitoring, and injection/infiltrationfacilities may be expensive.
• Recharge may increase danger toaquifer contamination due toinadequate pretreatment.
• Inadequate institutional arrangementor groundwater laws
Groundwater Recharge
Advantages Limitations
Potential Uses for GW Recharge
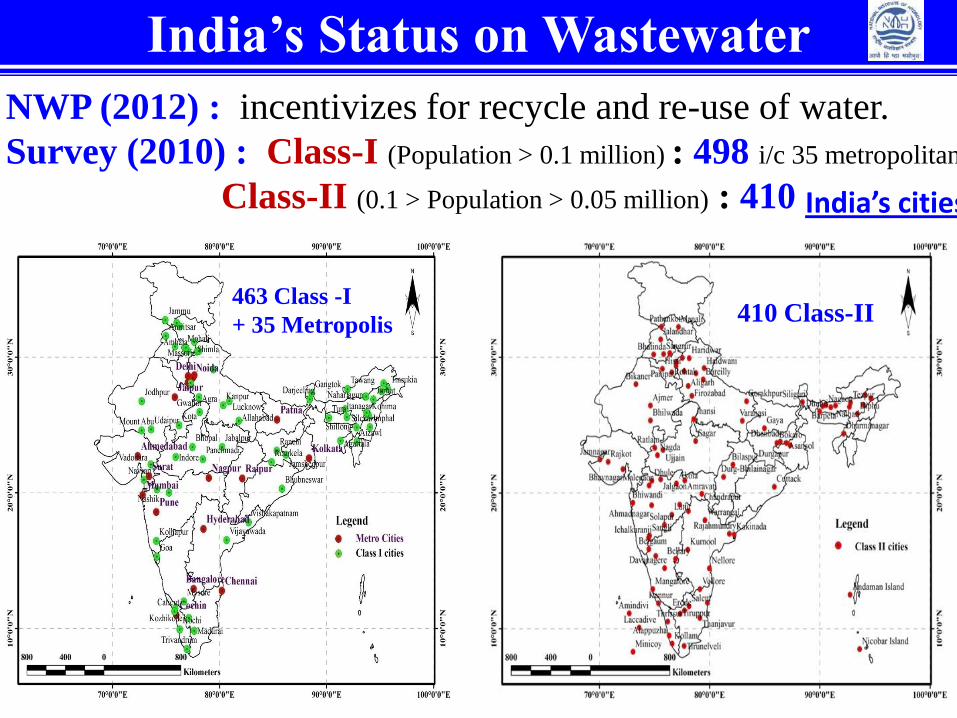
India’s Status on Wastewater
NWP (2012) : incentivizes for recycle and re-use of water.
Survey (2010) : Class-I (Population > 0.1 million) : 498 i/c 35 metropolitan
Class-II (0.1 > Population > 0.05 million) : 410
463 Class -I
+ 35 Metropolis410 Class-II
India’s cities

India’s Status of Municipal Wastewater
Wastewater generation• Class-I cities : 35,558 MLD ( 44% from Metropolitan cities)
• Class-II towns : 2,697 MLD (Source : CPCB, 2009)
Existing capacity of wastewater treatment
• Class I cities : 11,553 MLD (32 % of wastewater generated)
• Class-II towns : 233.7 MLD ( 8.66% of wastewater generated).
Water supply &
Wastewater generationClass-I Class - IIWater supply &Wastewater generation

Status of Municipal Wastewater treatment in urban
areas (source : CPCB-CUPS/70/2009-2010)
Metropolitan cities (35)
Population > 1 million
Class-I cities (463)
1 million > Population
> 0.1 million
Class-II cities (410)0.1 million> Population >
0.05 million
Sewage generation
15,664 MLD
Sewage generation19,894 MLD
Sewage generation
2696 MLD
Sewage treatment capacity
(8,040 MLD)
Sewage treatment capacity
(3,513 MLD)
Sewage treatment capacity
(233.7 MLD)
Treatment capacity
51.3%
Treatment capacity
17.66%
Treatment capacity8.66 %

Status of Municipal water supply, wastewater
generation and treatment in India
Category No. of cities
Total water supply (MLD)
Wastewater generation (MLD)
% wastewater generation to water supply
% of wastewater treated
Class-I
(i/c Metropolitan )
498 44,769 35,558 79 % 32 %
Class-II 410 3,324 2696.7 81 % 8.66%
Total 908 48,093 38,254.7 79.5% 30.8%
• Untreated wastewaters flow onto/to overland, streams, and
surface water bodies
Status of Municipal Wastewater treatment in urban areas (source :
CPCB-CUPS/70/2009-2010)
Industrial wastewaters: About 57,000 polluting industries
generate about 13,468 MLD (nearly, 60% treated).

Water supply and sewage disposal status in class I cities
142 603
8638
7007
2756
2121023
15191
12145
2485
2991281
20607
16662
4037
423
1850
29782
23826
6955
0
5000
10000
15000
20000
25000
30000
35000
Number Popn (lakh) Water supply Wastewater Treatment
1978
1988
1995
2003
Showed a rising trend in all sectors
Source : R. C. Trevedi, (CPCB, 2005)
Water Supply and Sewage Treatment in Class-I Cities

Water supply and wastewater generation and treatment in class
II towns of India
190128
1533
1226
67
241 207
1622
1280
27
345236
1936
1650
62
498370
3035
2428
89
0
500
1000
1500
2000
2500
3000
3500
Number Popn (lakh) Water supply Wastewater Treatment
1978
1988
1995
2003
Showed not much improvement to wastewater treatment side
Source : R. C. Trevedi, (CPCB, 2005)
Water Supply and Sewage Treatment in Class-II Cities

Status of municipal sewage generation in Ganga Basin
Category Sewagegeneration (MLD)
Treatment (%) Disposal to/on
Class – I cities2637.7 44.5% Ganga River
7841.5 46.8% Tributaries of Ganga
907.4 16% Land
Class-II cities
122 13.4% Ganga River
134.6 6.6% Tributaries of Ganga
767.3 7% Land
Total 12,410.5
Status of Ganga Basin (2005-06) :
Ganga river : 1569.6 MLD of untreated sewage
Tributaries : 4297.4 MLD of untreated sewage
Land : 1475.8 MLD of untreated sewage
Total : 7342.8 MLD of untreated sewage

WQ status of the River Ganga
• Total length the river : 2525 km• In Uttarakhand & Uttar Pradesh : 1450 km• U. P. & Bihar boundary : 110 km• Bihar : 445 km• West Bengal : 520 km
Length Up to Haridwar from source, : 253 km

WQ status of River Ganga – in Uttarakhand)
FC > 5000 MPN/100 ml
TC > 5000 MPN/100 ml
BOD > 3 mg/L

WQ status of the River Ganga – U. P. (upper stretch)
DO < 6 mg/l
BOD > 3 mg/l

WQ status of Ganga river –U.P (Upper stretch)
FC > 5000 MPN/100 ml
TC > 5000 MPN/100 ml

WQ status of Ganga river – in Bihar
In Bihar Upper stretchconsiderable
improvement in DO & BOD

WQ status of Ganga river in Bihar

WQ status of Ganga river in West Bengal
Avg. DO > 6.5 mg/l
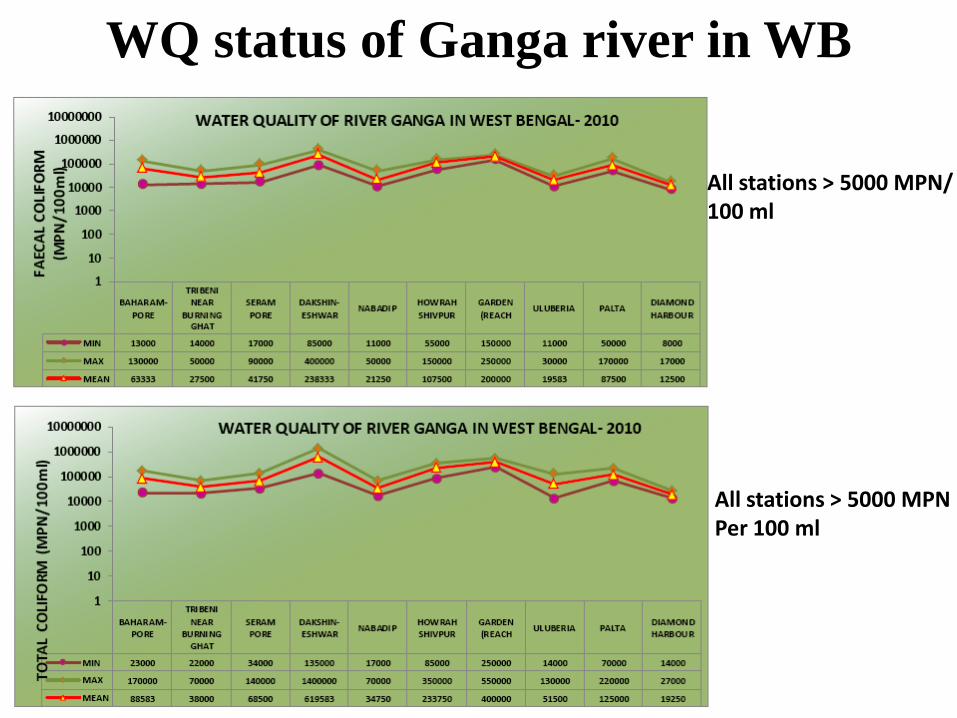
WQ status of Ganga river in WB
All stations > 5000 MPN/ 100 ml
All stations > 5000 MPNPer 100 ml
Concluding Remarks Municipal wastewater typically contains 99.93% water and
0.07% total solids. Of 0.07% TS, 50% Organic contains and
balance 50% inert. Treatment is concern to remove organic
contents, which can be used as nutrients for agricultural purposes.
Hence, treated effluents have a lot of potential for different
beneficial uses such as, Urban, Agricultural, and groundwater
recharge.
Industrial wastewater composition varies based on types of
Industries and typically contains high COD, trace metals, and toxic
elements and hence need mechanized treatment before allowing
effluents to flow out of Industries.
NTT, such as, CW, Stabilization ponds, Phyto and Bio
Remediation techniques , which require considerable land foot print
, can be used for Municipal Wastewater Treatment.
Wastewater is not a waste, it has a lot of productive values, and can
be regarded as potential recourses of water.

Thanks