Embed Size (px)
Citation preview
Treatment and energy recovery of waste in China
——A paradox for municipal solid waste incineration in China
Prof. Dr. Zhao Youcai
Tongji University [email protected]
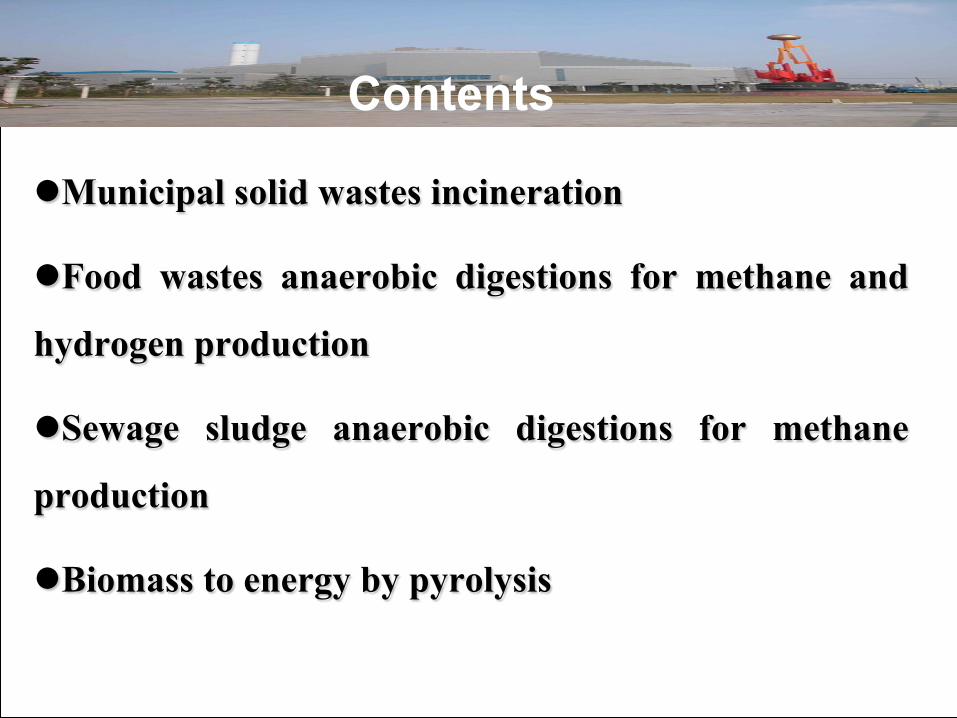
l Municipal solid wastes incineration
l Food wastes anaerobic digestions for methane and
hydrogen production
l Sewage sludge anaerobic digestions for methane
production
l Biomass to energy by pyrolysis
Contents
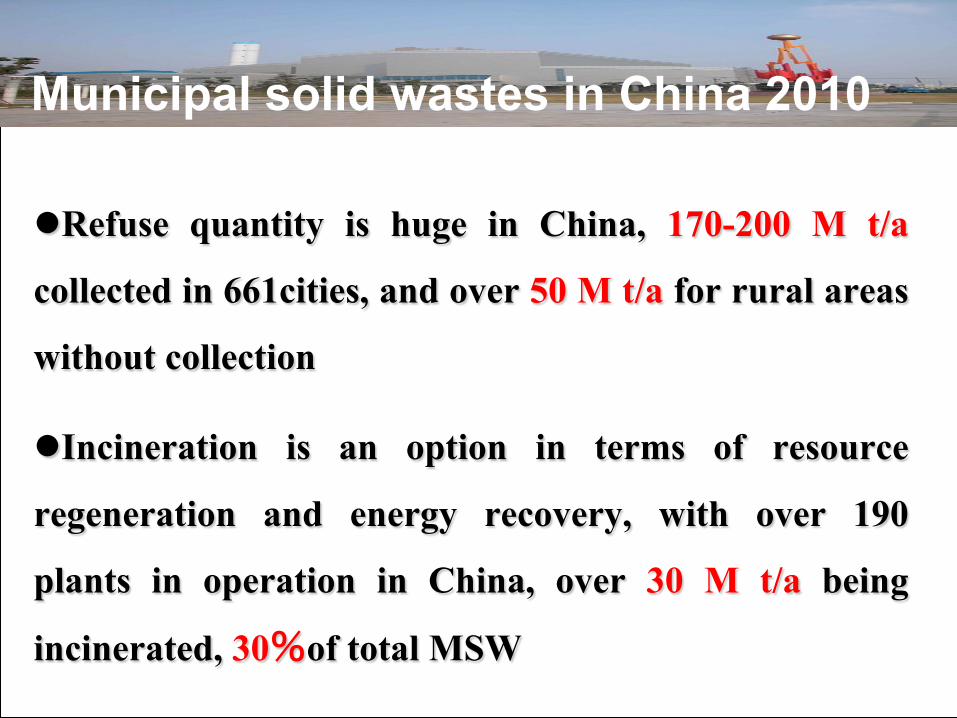
l Refuse quantity is huge in China, 170-200 M t/a
collected in 661cities, and over 50 M t/a for rural areas
without collection
l Incineration is an option in terms of resource
regeneration and energy recovery, with over 190
plants in operation in China, over 30 M t/a being
incinerated, 30%of total MSW
Municipal solid wastes in China 2010
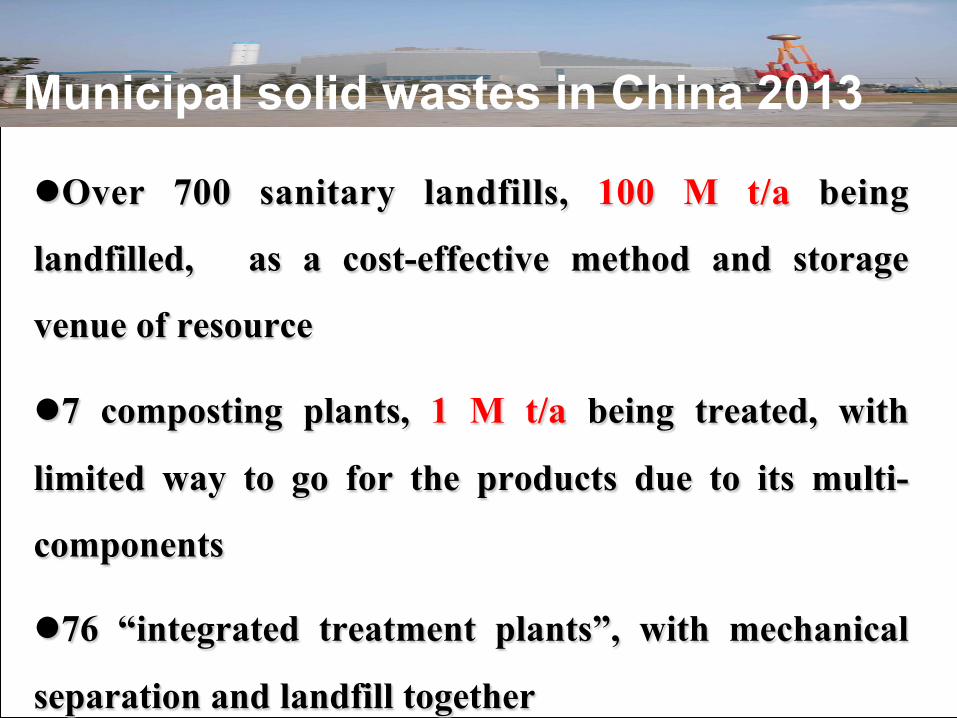
l Over 700 sanitary landfills, 100 M t/a being
landfilled, as a cost-effective method and storage
venue of resource
l 7 composting plants, 1 M t/a being treated, with
limited way to go for the products due to its multi-
components
l 76 “integrated treatment plants”, with mechanical
separation and landfill together
Municipal solid wastes in China 2013
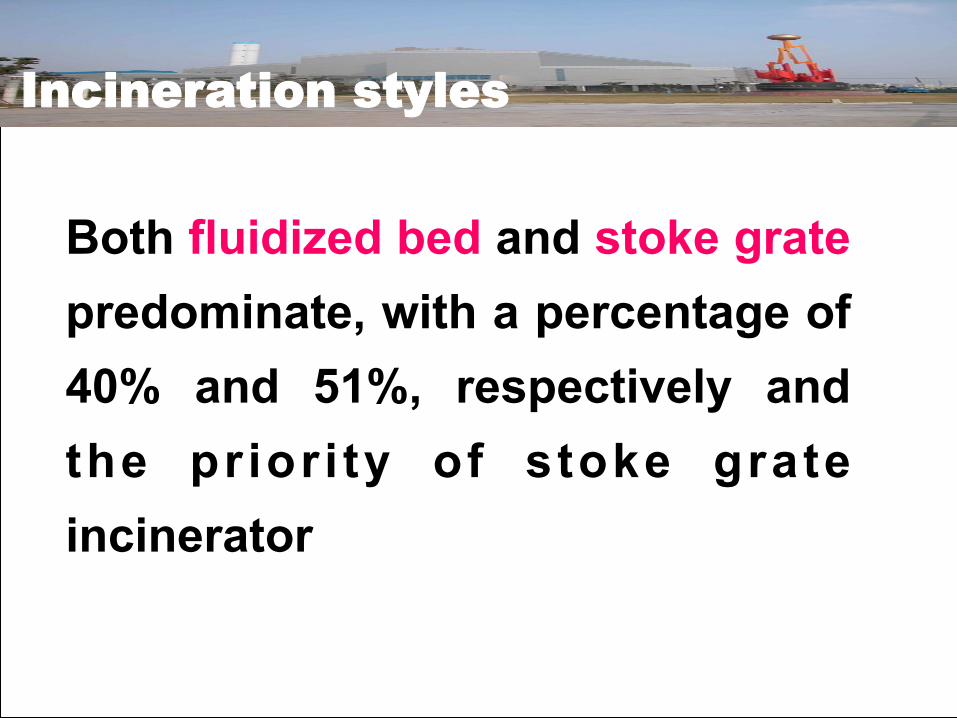
Incineration styles
Both fluidized bed and stoke grate predominate, with a percentage of 40% and 51%, respectively and the priori ty of stoke grate incinerator
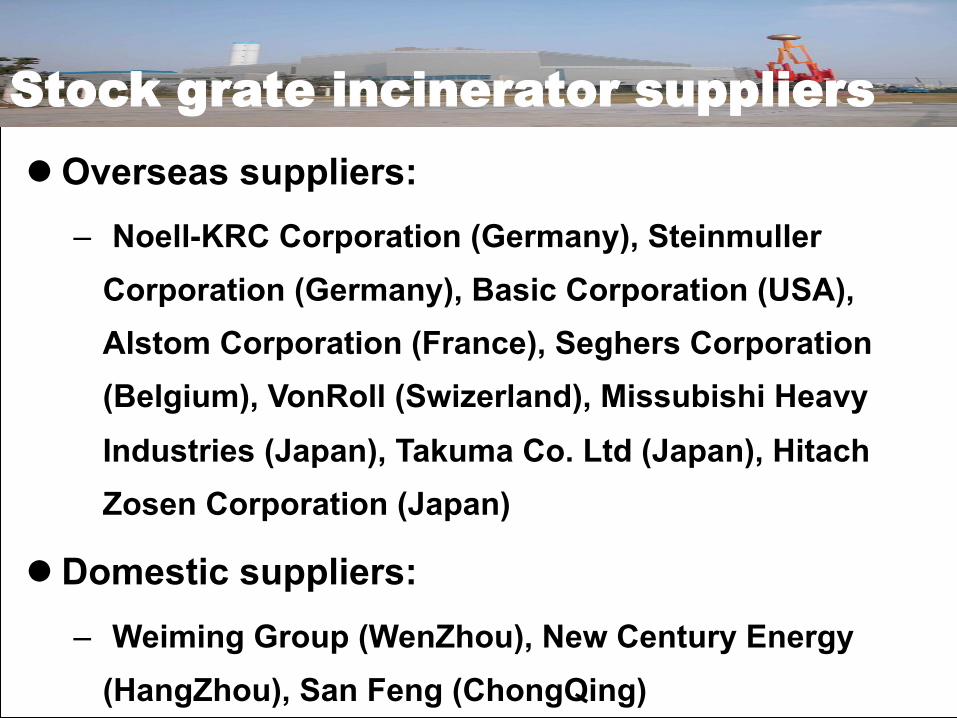
Stock grate incinerator suppliers
l Overseas suppliers: – Noell-KRC Corporation (Germany), Steinmuller
Corporation (Germany), Basic Corporation (USA), Alstom Corporation (France), Seghers Corporation (Belgium), VonRoll (Swizerland), Missubishi Heavy Industries (Japan), Takuma Co. Ltd (Japan), Hitach Zosen Corporation (Japan)
l Domestic suppliers: – Weiming Group (WenZhou), New Century Energy
(HangZhou), San Feng (ChongQing)
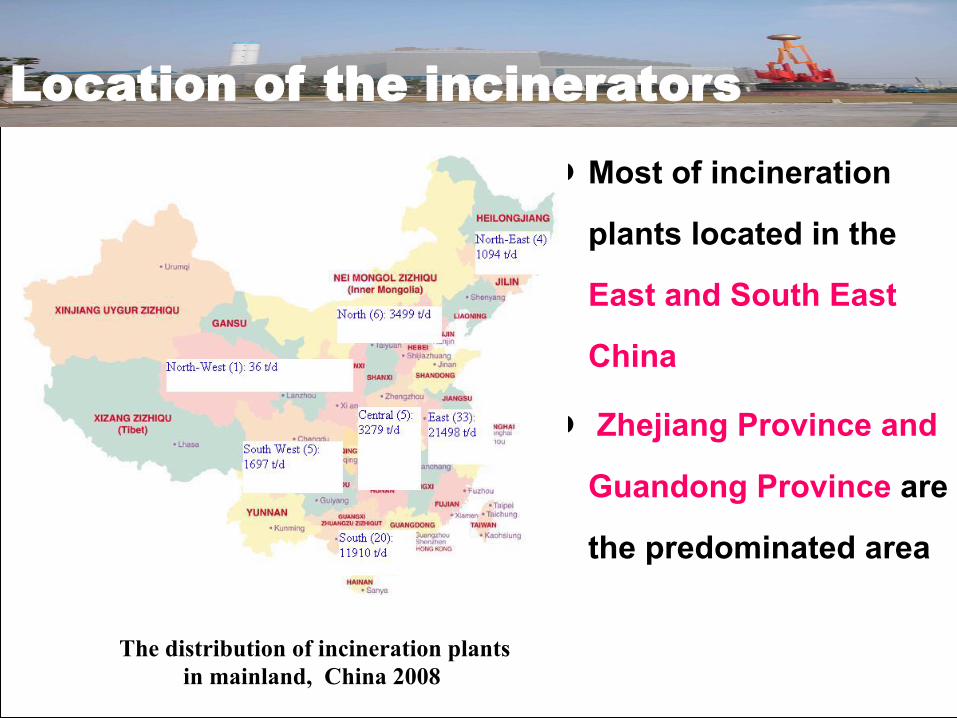
l Most of incineration
plants located in the
East and South East
China
l Zhejiang Province and
Guandong Province are
the predominated area
The distribution of incineration plants in mainland, China 2008
Location of the incinerators
Motivation driven for incineration
l Variation of waste composition l The promotion activity of incineration plants
– a power-for-money deal situation – a leading technology -“the face-saving project” or
“achievement Project"
l The policy of tax preference, electricity price policies and compensation for refuse treatment: 0.5-0.7 Yuan RMB/kwh, higher than that of 0.25 Yuan RMB/kwh from coal power plant
Motivation driven for incineration
l Dominated companies” pushing” and “low cost” concepts, with over-negative towards to landfill
l Technological superiority — Volumn reduction: reduction rate 80%~90% — End-of-pipe disposal:850℃~900℃, disinfection in high temperature — Waste-to-energy:generating capacity 300~350kwh per ton refuse ,amount to 120~140kg standard coal
Cost and health worry
l Very expensive, complicated to operate, wasteful of resources and the release of some by-products
l One survey cited by China Daily:
– 92% of residents thought the incinerator would harm their health, and 97% were opposed to its construction
Paradox of incineration plant
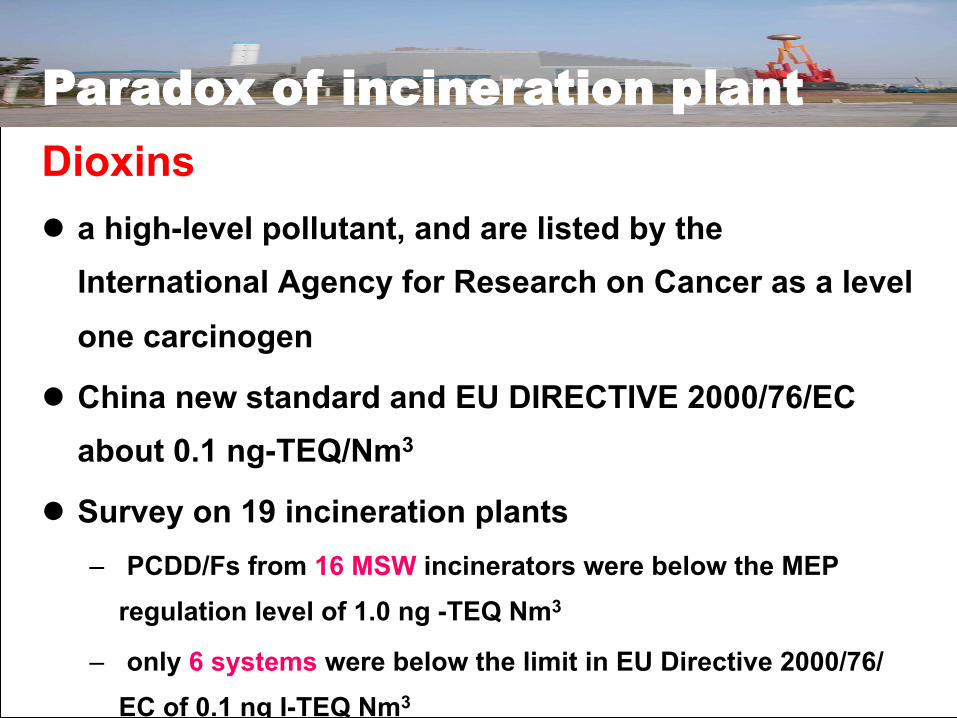
Challenge - Dioxin Dioxins l a high-level pollutant, and are listed by the
International Agency for Research on Cancer as a level one carcinogen
l China new standard and EU DIRECTIVE 2000/76/EC about 0.1 ng-TEQ/Nm3
l Survey on 19 incineration plants – PCDD/Fs from 16 MSW incinerators were below the MEP
regulation level of 1.0 ng -TEQ Nm3
– only 6 systems were below the limit in EU Directive 2000/76/EC of 0.1 ng I-TEQ Nm3
Paradox of incineration plant
Challenge - Dioxin Dioxins l Low treatment fee from the local government:
5 US$, 8 US$, 10 US$, per ton waste!
l Use of little active carbon for dioxin absorption, and even use of a few lime for flue gas treatment
l Delay of the treatment fee payment from the authorities concerned
Paradox of incineration plant
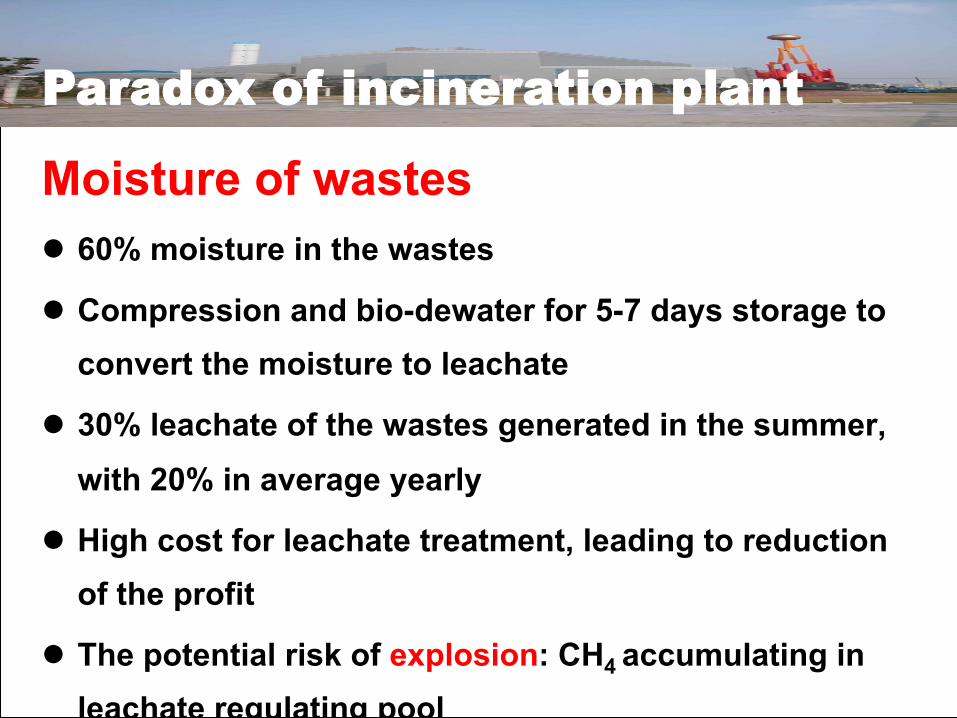
Challenge - Dioxin Moisture of wastes l 60% moisture in the wastes
l Compression and bio-dewater for 5-7 days storage to convert the moisture to leachate
l 30% leachate of the wastes generated in the summer, with 20% in average yearly
l High cost for leachate treatment, leading to reduction of the profit
l The potential risk of explosion: CH4 accumulating in leachate regulating pool
Paradox of incineration plant
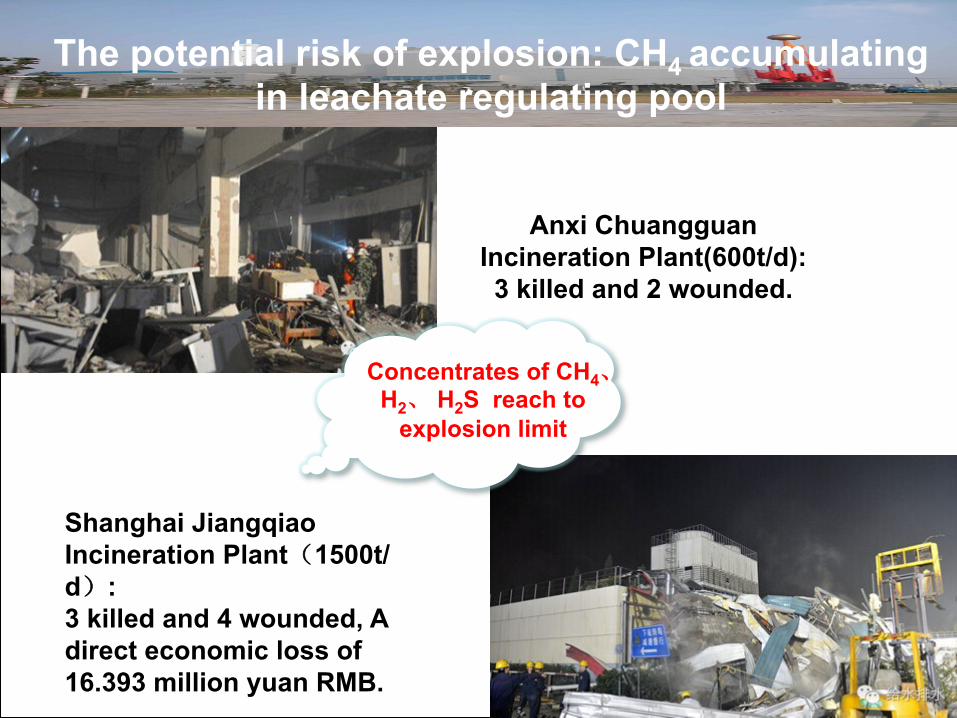
Anxi Chuangguan Incineration Plant(600t/d): 3 killed and 2 wounded.
Shanghai Jiangqiao Incineration Plant(1500t/d): 3 killed and 4 wounded, A direct economic loss of 16.393 million yuan RMB.
Concentrates of CH4、H2、 H2S reach to
explosion limit
The potential risk of explosion: CH4 accumulating in leachate regulating pool
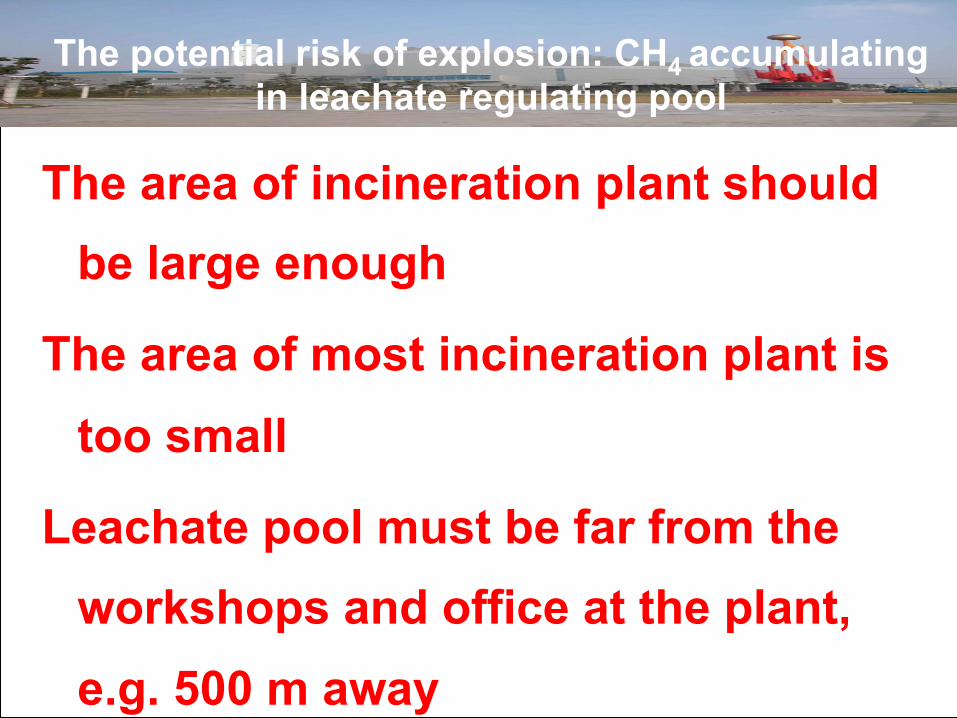
Challenge - Dioxin The area of incineration plant should be large enough
The area of most incineration plant is too small
Leachate pool must be far from the workshops and office at the plant, e.g. 500 m away
The potential risk of explosion: CH4 accumulating in leachate regulating pool
Challenge - Dioxin Pollutants in flue gas - Regulation limits l only 10% in the flue gases to be limited to “standard”
l 90% pollutants discharged into the air, even EU limit
l A huge CO2 generated
l Environmental capacity load increase. In terms of environmental management , how many incineration plants does a city need? How to plan site selection and layout?
Paradox of incineration plant
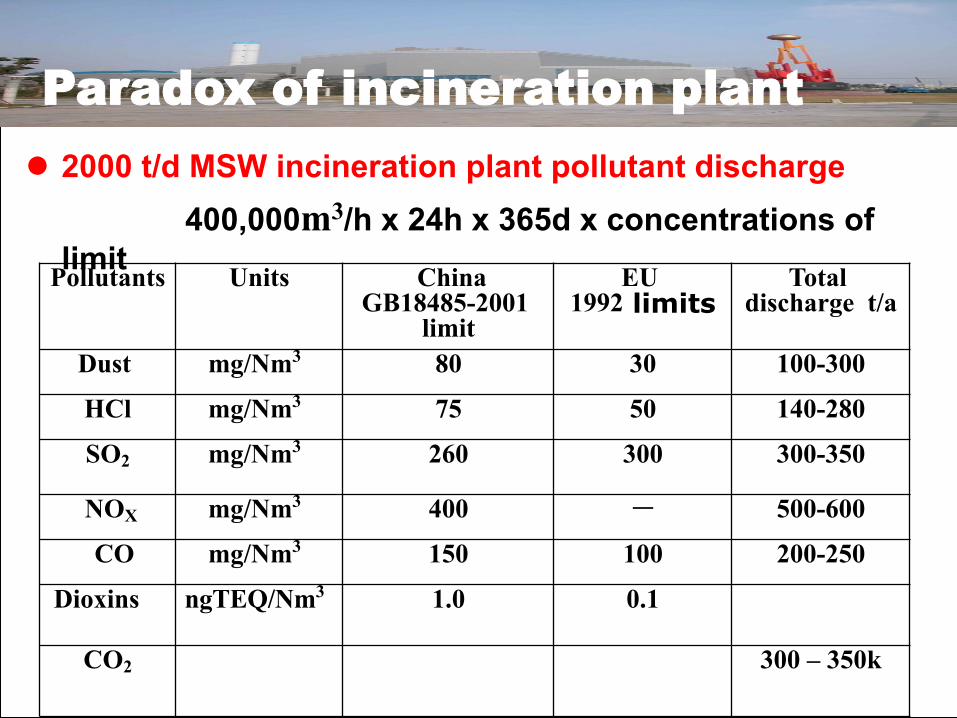
l 2000 t/d MSW incineration plant pollutant discharge 400,000m3/h x 24h x 365d x concentrations of
limitPollutants Units China GB18485-2001
limit EU
1992 limitsTotal
discharge t/a
Dust mg/Nm3 80 30 100-300
HCl mg/Nm3 75 50 140-280
SO2 mg/Nm3 260 300 300-350
NOX mg/Nm3 400 - 500-600
CO mg/Nm3 150 100 200-250
Dioxins ngTEQ/Nm3 1.0 0.1 CO2 300 – 350k
Paradox of incineration plant
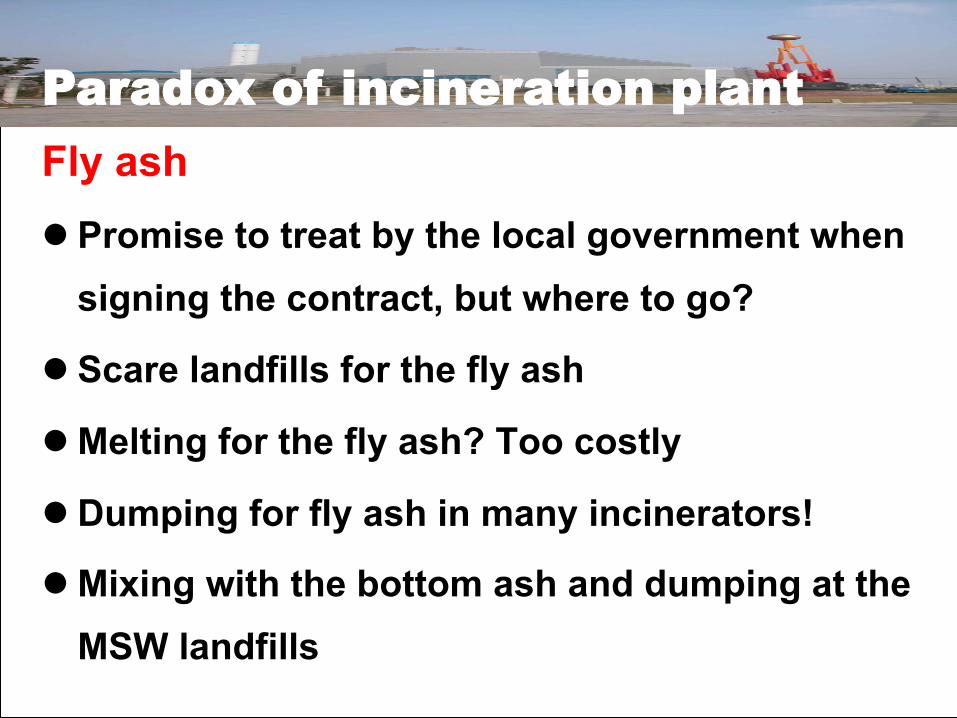
Challenge - Dioxin Fly ash l Promise to treat by the local government when
signing the contract, but where to go?
l Scare landfills for the fly ash
l Melting for the fly ash? Too costly
l Dumping for fly ash in many incinerators!
l Mixing with the bottom ash and dumping at the MSW landfills
Paradox of incineration plant
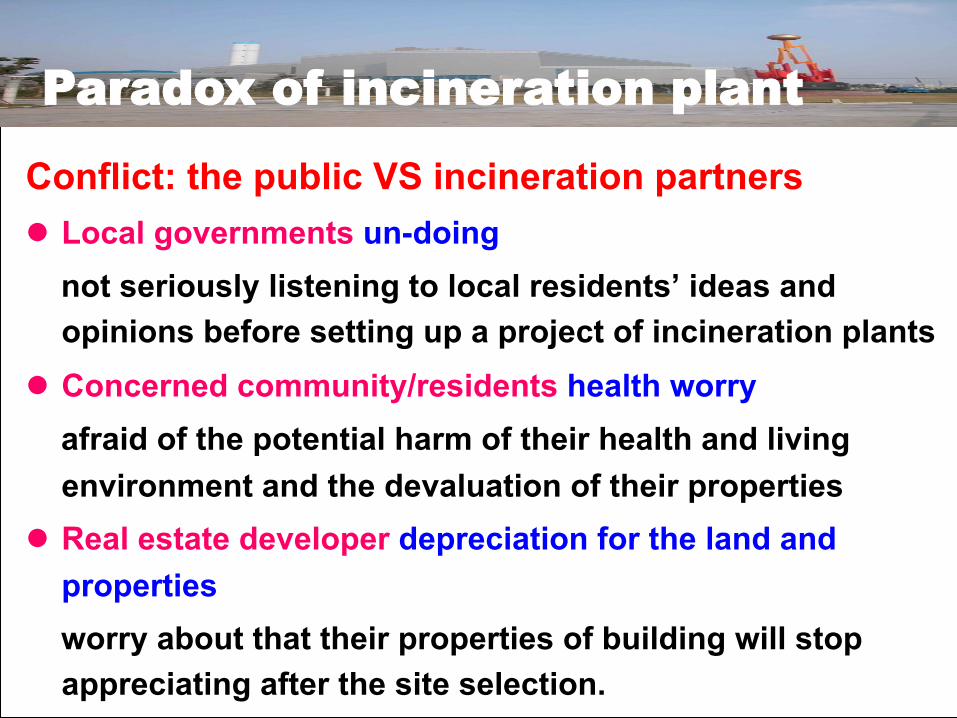
Conflict: the public VS incineration partners l Local governments un-doing not seriously listening to local residents’ ideas and
opinions before setting up a project of incineration plants l Concerned community/residents health worry afraid of the potential harm of their health and living
environment and the devaluation of their properties l Real estate developer depreciation for the land and
properties worry about that their properties of building will stop
appreciating after the site selection.
Paradox of incineration plant
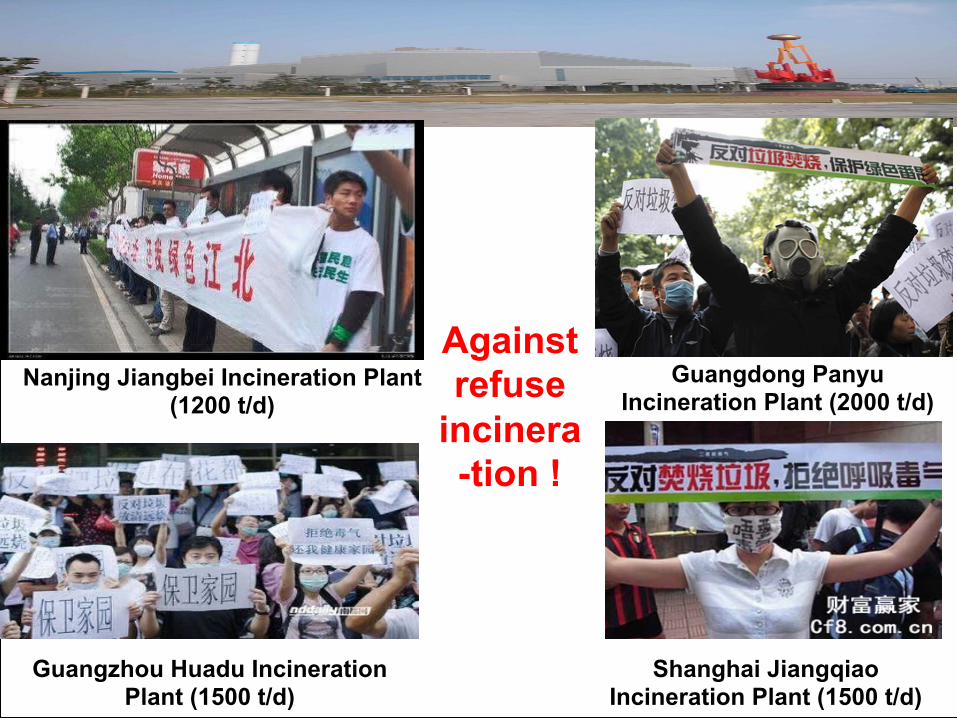
Nanjing Jiangbei Incineration Plant (1200 t/d)
Guangdong Panyu Incineration Plant (2000 t/d)
Guangzhou Huadu Incineration Plant (1500 t/d)
Shanghai Jiangqiao Incineration Plant (1500 t/d)
Against refuse
incinera-tion !
Challenge - Dioxin Source reduction at home and on site l Extremely difficult, practiced for over 20 years
l Many scavengers and poor people as well as real estate keepers acted as the separators on sites
l Nothing valuables in the wastes to be landfilled and incinerated, and MUST be landfilled or incinerated
Solution for the obstacles
Challenge - Dioxin Dewatering of the wastes l Separate collection of water melon and other
high moisture wastes – seemingly difficult?
l Good cover for the garbage collection and storage bins - seemingly difficult?
l Modification for the incineration furnace to improve the high moisture wastes burning
Solution for the obstacles
Challenge - Dioxin Sitting l 300 m away for the inhabitants dewelling from
the incinerators for the new standard (draft) proposed, possible? Impossible!
l At least 3000 m, enough? Where to sit?
l Extremely difficult for sitting of new incinerators, with slow step for the incineration increase in recent 2 years
Solution for the obstacles
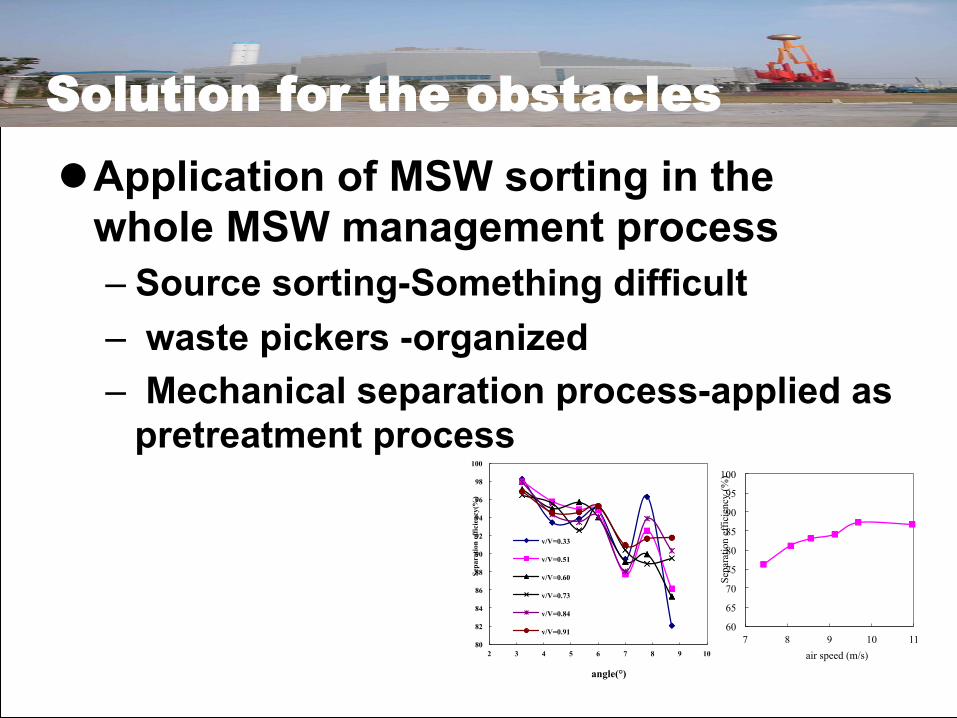
l Application of MSW sorting in the whole MSW management process – Source sorting-Something difficult – waste pickers -organized – Mechanical separation process-applied as
pretreatment process
60
65
70
75
80
85
90
95
100
7 8 9 10 11
Sepa
ratio
n ef
ficie
ncy
(%)
air speed (m/s) 80
82
84
86
88
90
92
94
96
98
100
2 3 4 5 6 7 8 9 10
Sepa
ratio
n ef
ficie
ncy(
%)
angle(°)
v/V=0.33
v/V=0.51
v/V=0.60
v/V=0.73
v/V=0.84
v/V=0.91
Solution for the obstacles
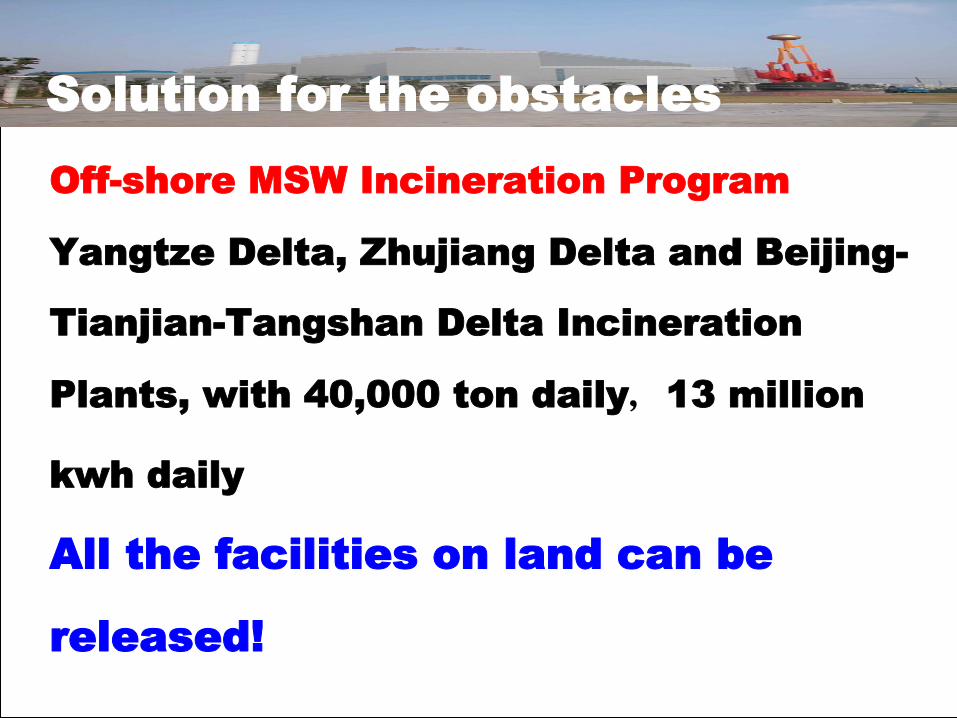
Off-shore MSW Incineration Program
Yangtze Delta, Zhujiang Delta and Beijing-
Tianjian-Tangshan Delta Incineration
Plants, with 40,000 ton daily,13 million
kwh daily
All the facilities on land can be
released!
Solution for the obstacles
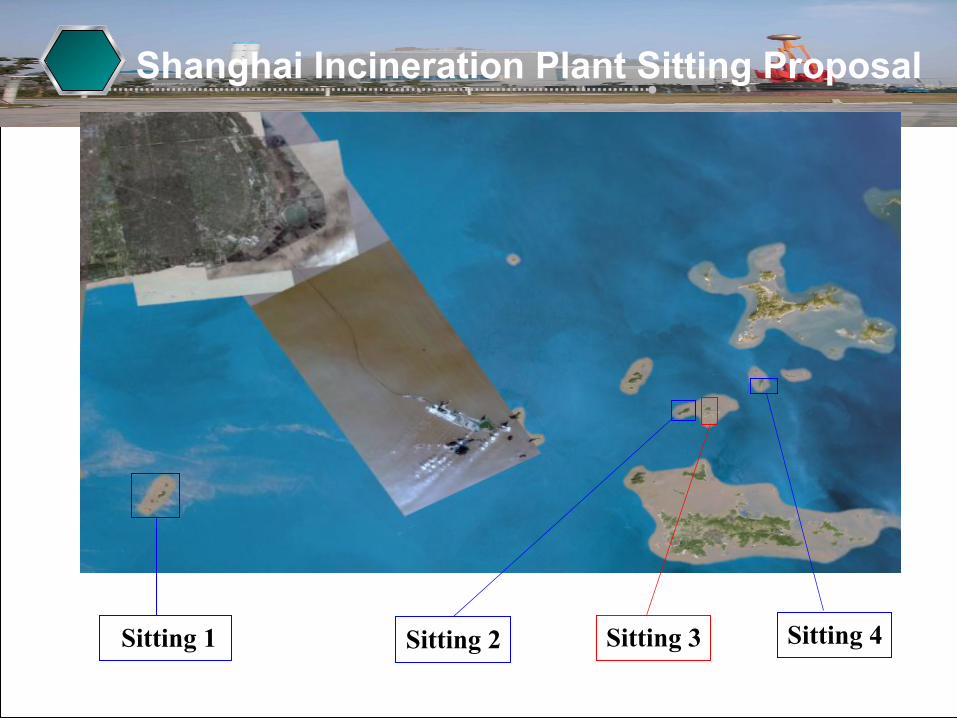
Sitting 4 Sitting 2 Sitting 1 Sitting 3
Shanghai Incineration Plant Sitting Proposal
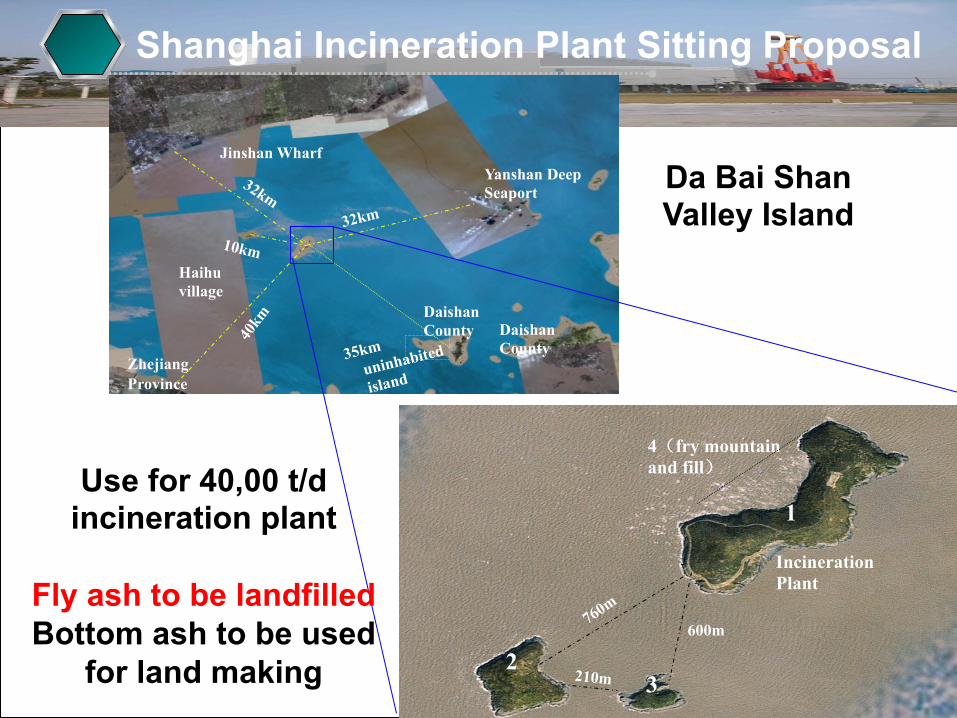
Incineration Plant
210m
600m
1
2 3
4(fry mountain and fill)
uninhabited
island
Yanshan Deep Seaport
Haihu village
10km
32km
Zhejiang Province
Daishan County
Daishan County
35km
Da Bai Shan Valley Island
Shanghai Incineration Plant Sitting Proposal
Use for 40,00 t/d incineration plant
Fly ash to be landfilled Bottom ash to be used
for land making
Jinshan Wharf
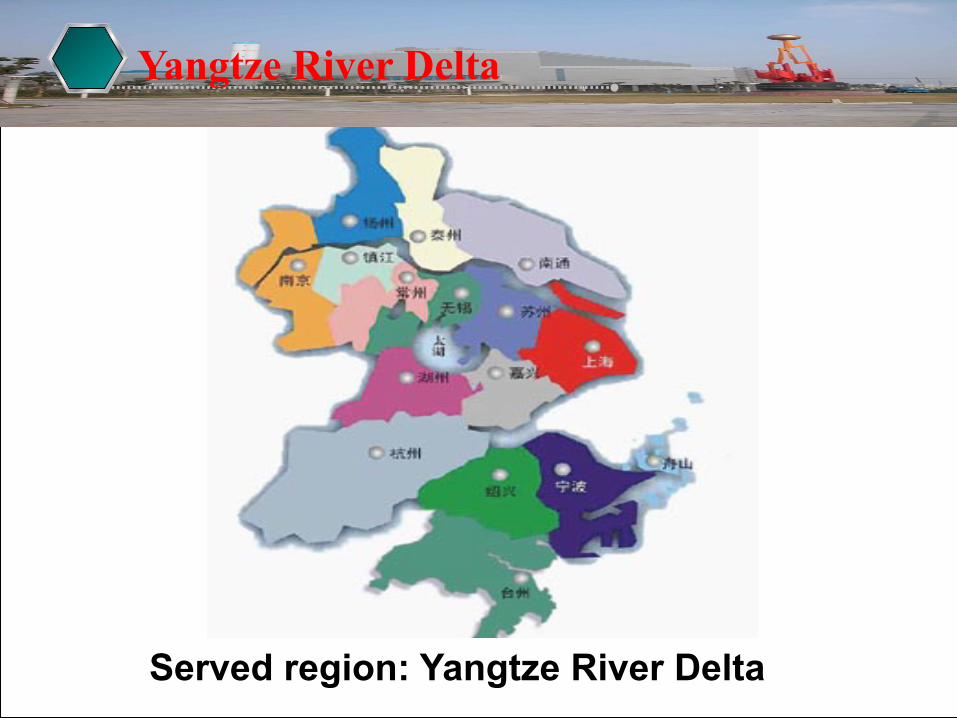
Yangtze River Delta
Served region: Yangtze River Delta
有机废物厌氧发酵
Food wastes anaerobic digestion
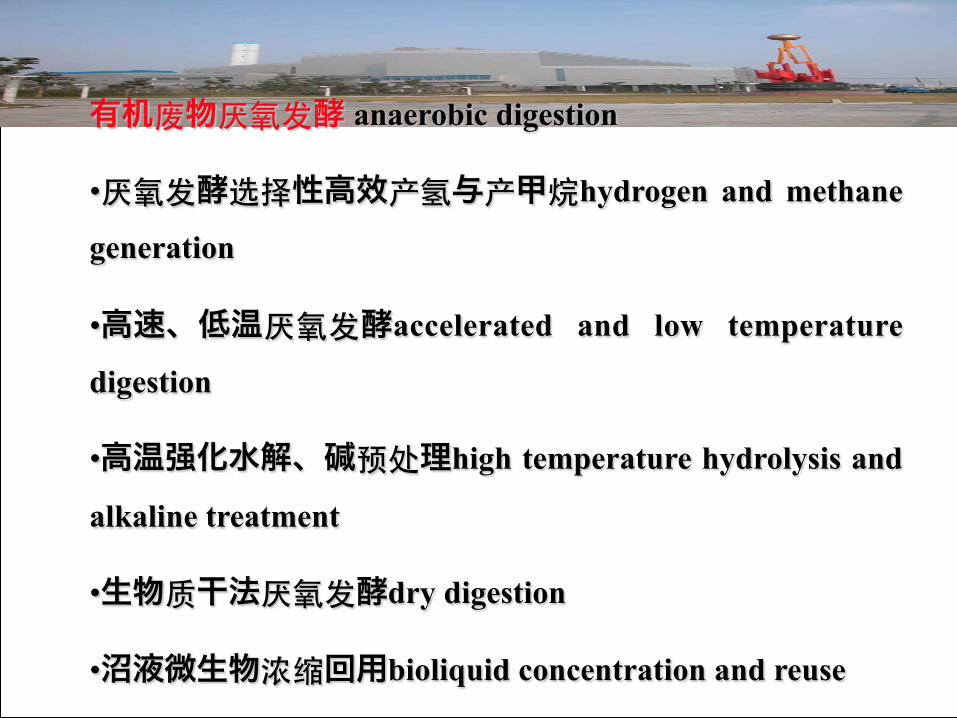
有机废物厌氧发酵 anaerobic digestion
• 厌氧发酵选择性高效产氢与产甲烷hydrogen and methane
generation
• 高速、低温厌氧发酵accelerated and low temperature
digestion
• 高温强化水解、碱预处理high temperature hydrolysis and
alkaline treatment
• 生物质干法厌氧发酵dry digestion
• 沼液微生物浓缩回用bioliquid concentration and reuse
生物质热解气化技术 Pyrolysis or gasification of
biomass
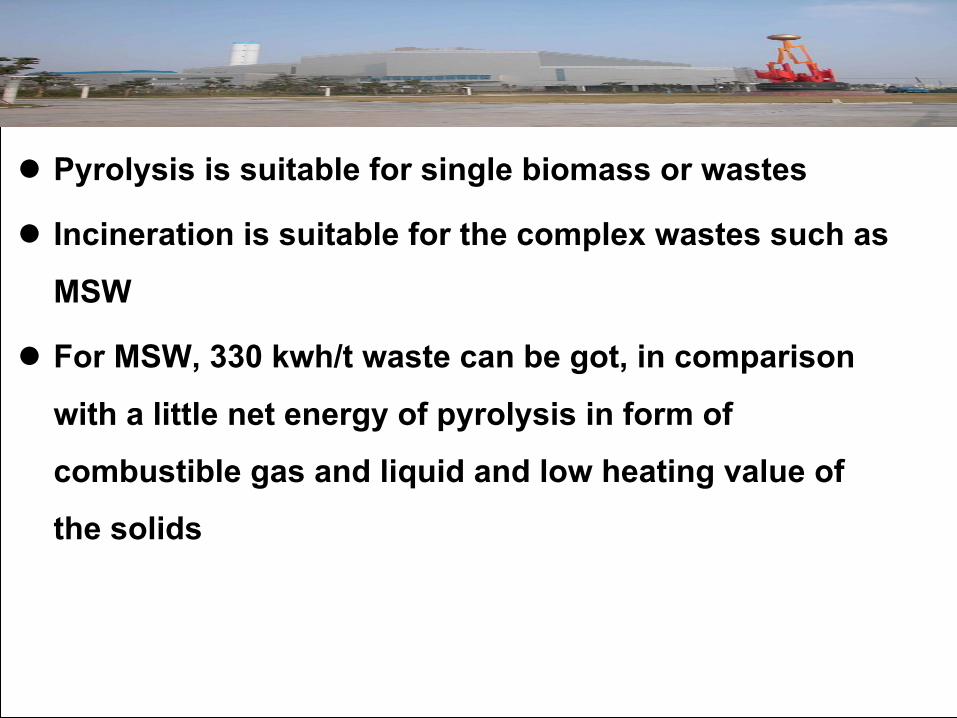
l Pyrolysis is suitable for single biomass or wastes
l Incineration is suitable for the complex wastes such as
MSW
l For MSW, 330 kwh/t waste can be got, in comparison
with a little net energy of pyrolysis in form of
combustible gas and liquid and low heating value of
the solids
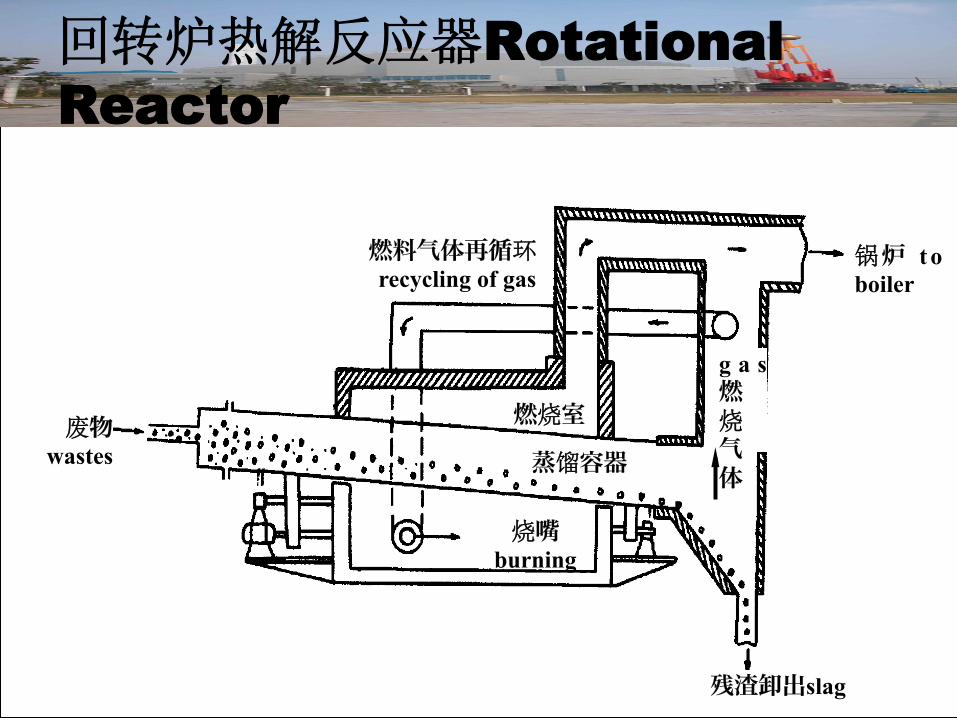
回转炉热解反应器Rotational Reactor
废物 wastes!
烧嘴burning !
燃烧室!
蒸馏容器!
g a s燃!烧!气!体!
锅炉 t o boiler!
残渣卸出slag!
燃料气体再循环recycling of gas!
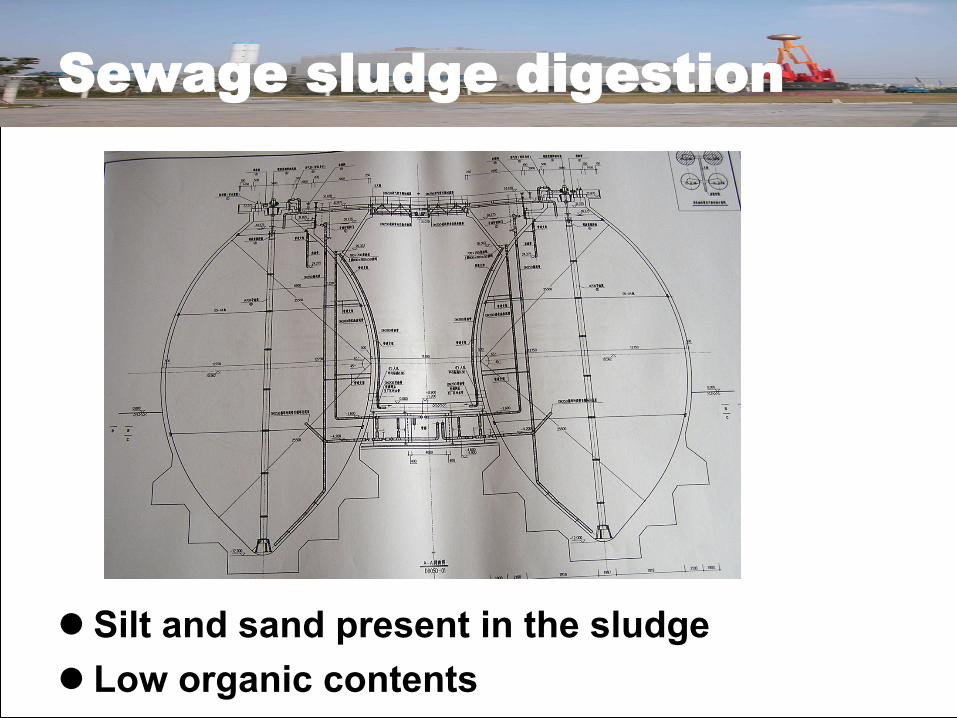
Sewage sludge digestion
l Silt and sand present in the sludge l Low organic contents
Tongji University
Refuse Incineration Technology Development for China
Prof. Dr. Zhao Youcai
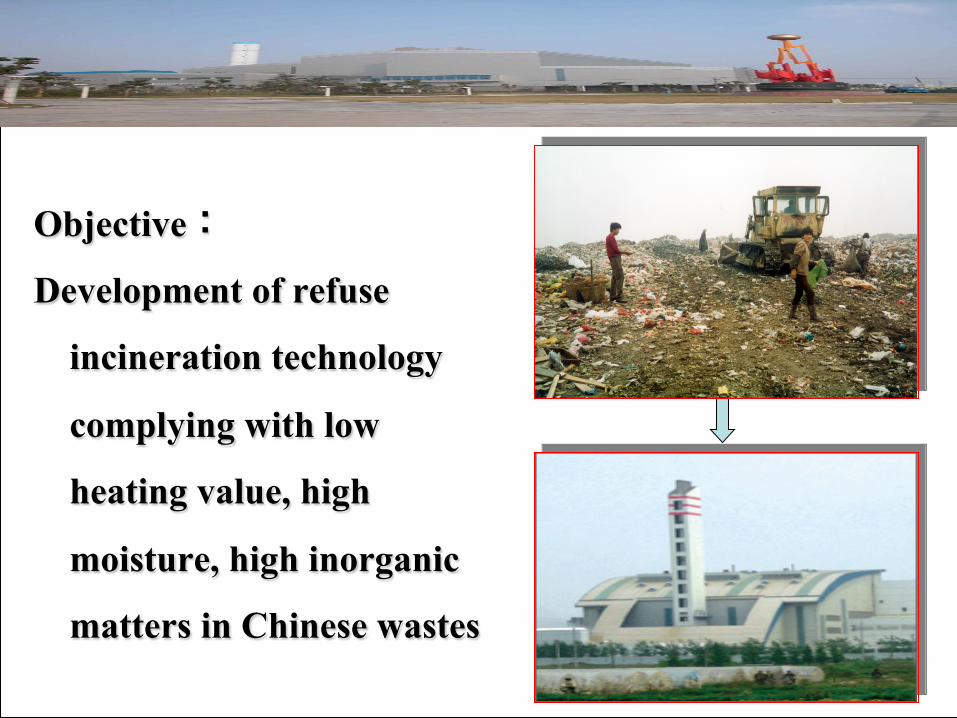
Objective:
Development of refuse
incineration technology
complying with low
heating value, high
moisture, high inorganic
matters in Chinese wastes
Findings
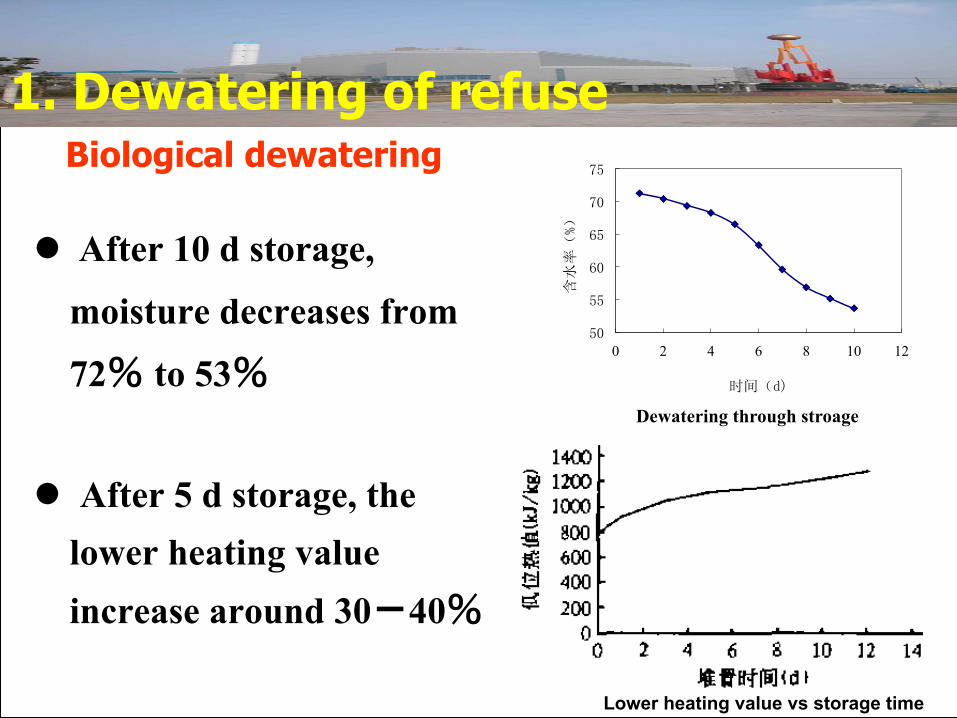
1. Dewatering of refuse
l After 10 d storage,
moisture decreases from
72% to 53% l After 5 d storage, the
lower heating value increase around 30-40%
Dewatering through stroage
Lower heating value vs storage time
50
55
60
65
70
75
0 2 4 6 8 10 12
含水率(%)
时间(d)
Biological dewatering
0
20
40
60
80
100
120
03.11-12 4 8 12 4 8 12 4 8 12 4 8 12 4 8
时间(月)
垃圾减量率(%)
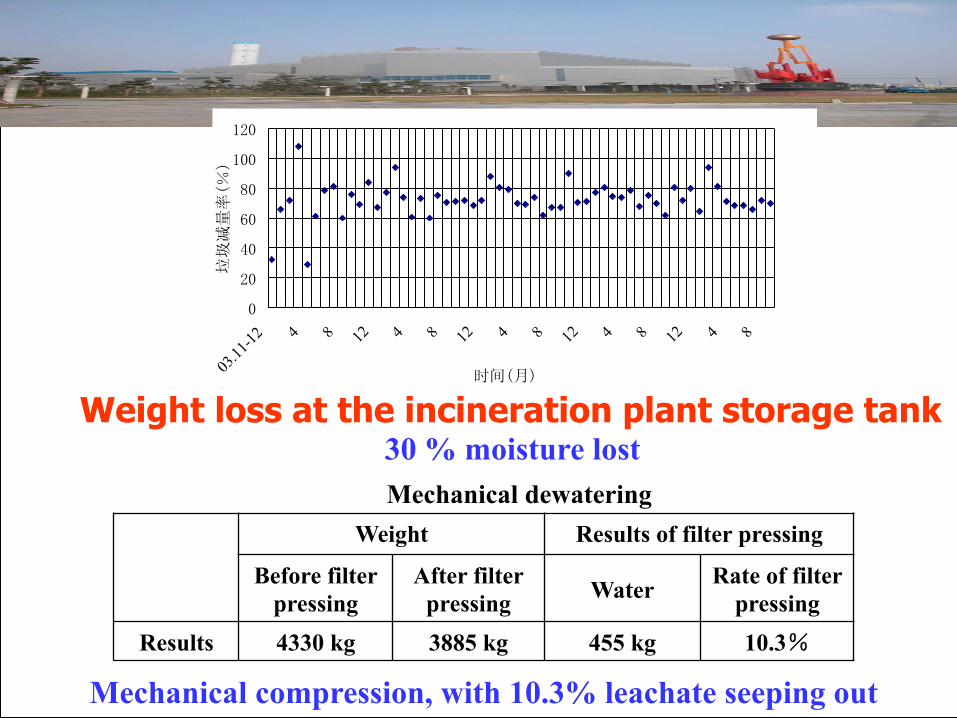
Weight loss at the incineration plant storage tank
Mechanical dewatering Weight Results of filter pressing
Before filter pressing
After filter pressing Water Rate of filter
pressingResults 4330 kg 3885 kg 455 kg 10.3%
Mechanical compression, with 10.3% leachate seeping out
30 % moisture lost
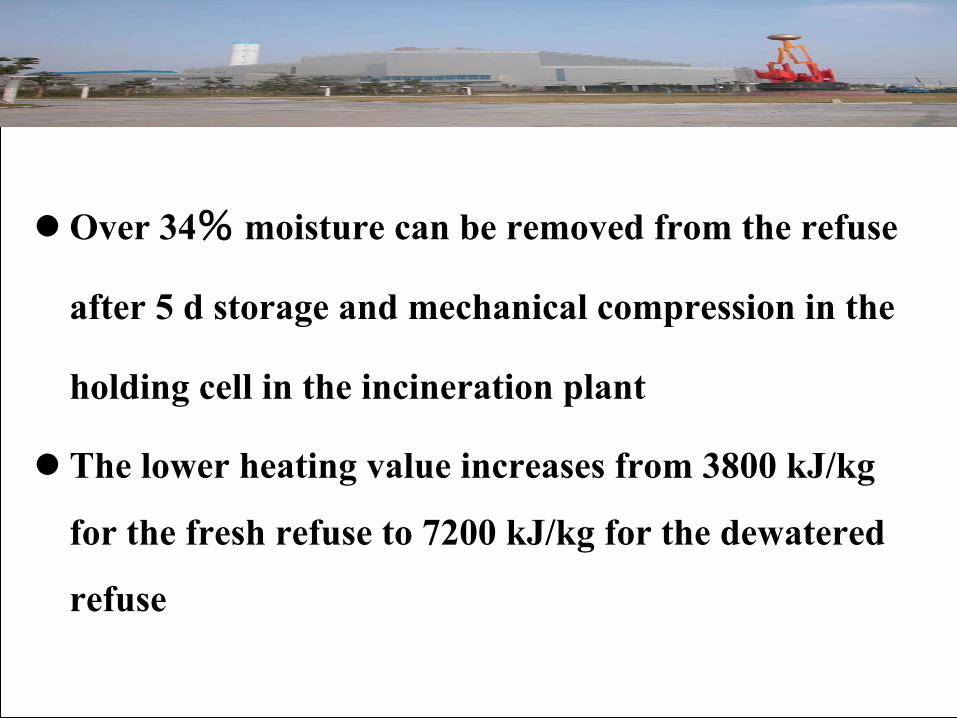
l Over 34% moisture can be removed from the refuse
after 5 d storage and mechanical compression in the
holding cell in the incineration plant
l The lower heating value increases from 3800 kJ/kg
for the fresh refuse to 7200 kJ/kg for the dewatered
refuse
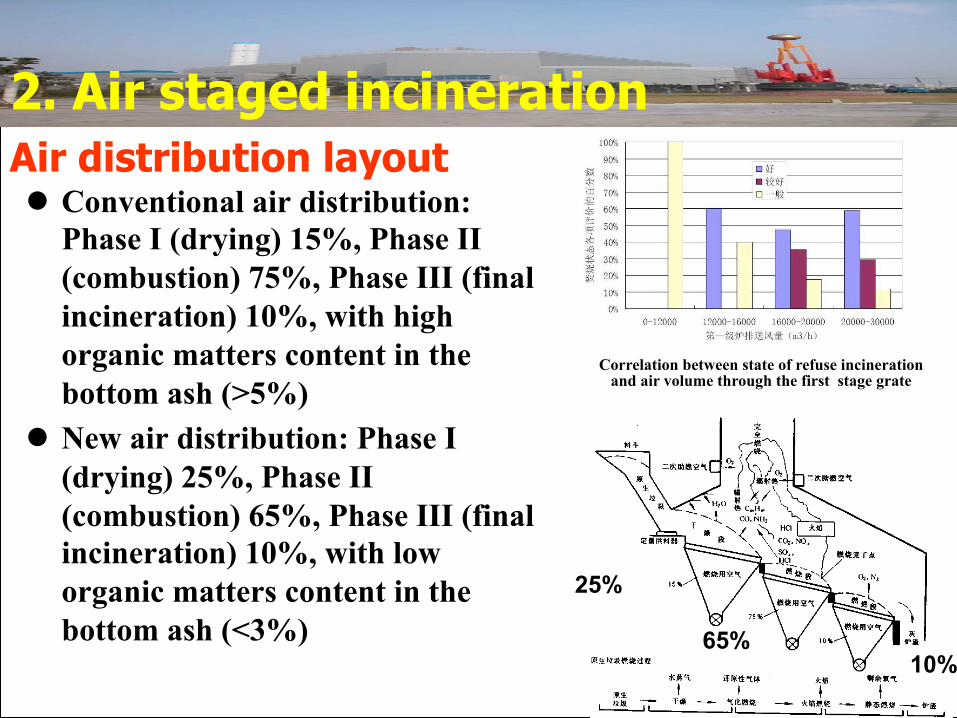
Air distribution layout l Conventional air distribution:
Phase I (drying) 15%, Phase II (combustion) 75%, Phase III (final incineration) 10%, with high organic matters content in the bottom ash (>5%)
l New air distribution: Phase I (drying) 25%, Phase II (combustion) 65%, Phase III (final incineration) 10%, with low organic matters content in the bottom ash (<3%)
Correlation between state of refuse incineration and air volume through the first stage grate
25%
65% 10%
2. Air staged incineration
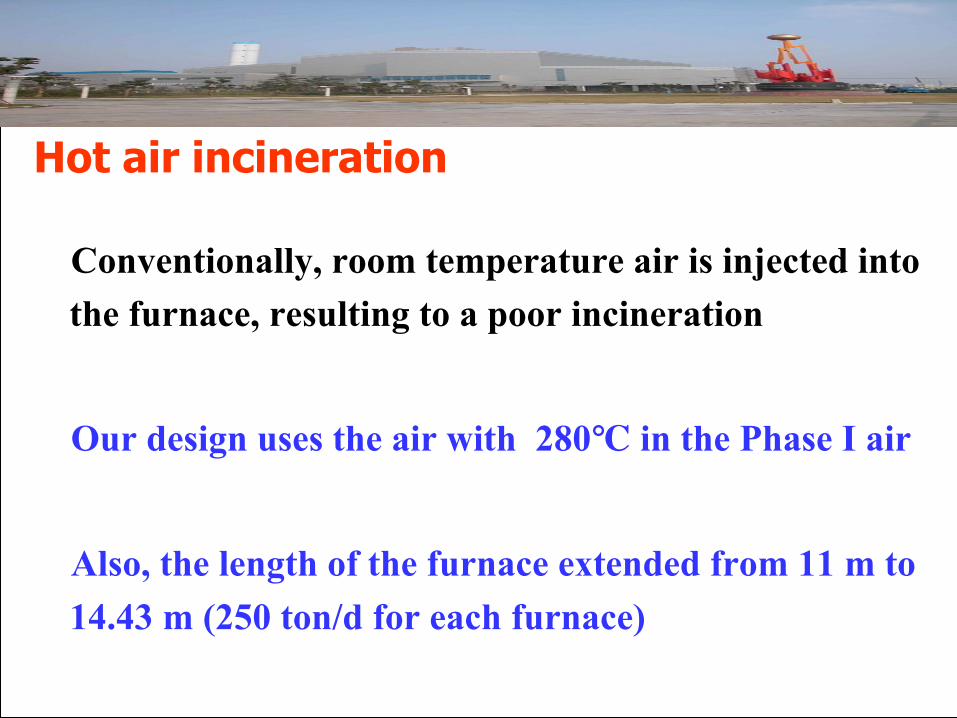
Hot air incineration
Conventionally, room temperature air is injected into the furnace, resulting to a poor incineration
Our design uses the air with 280℃ in the Phase I air
Also, the length of the furnace extended from 11 m to 14.43 m (250 ton/d for each furnace)
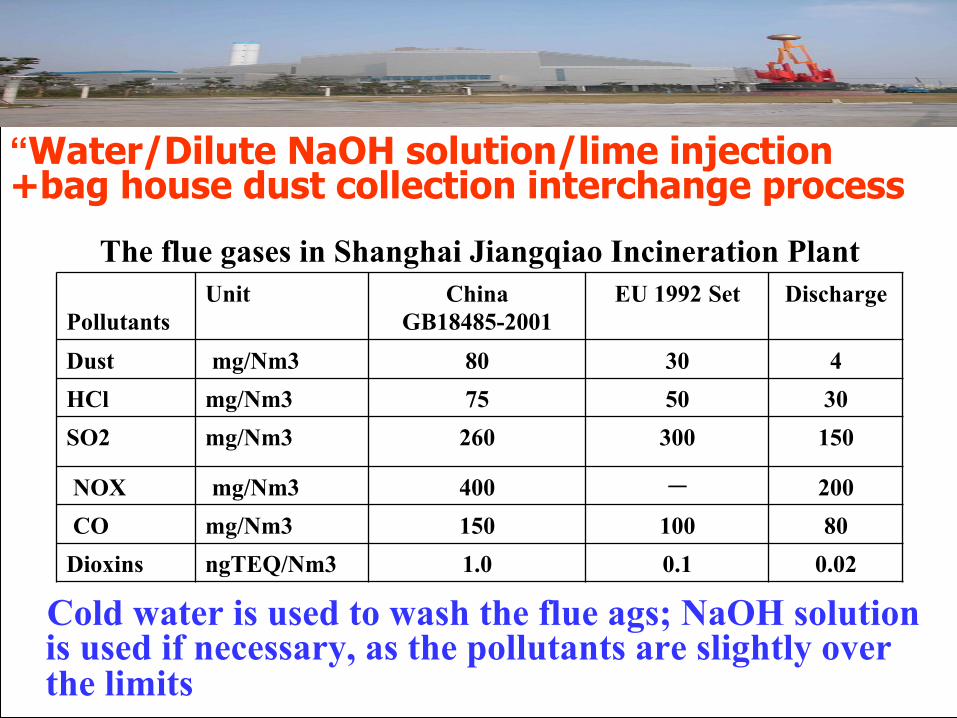
“Water/Dilute NaOH solution/lime injection +bag house dust collection interchange process
Cold water is used to wash the flue ags; NaOH solution is used if necessary, as the pollutants are slightly over the limits
The flue gases in Shanghai Jiangqiao Incineration Plant Pollutants Unit China
GB18485-2001 EU 1992 Set Discharge Dust mg/Nm3 80 30 4 HCl mg/Nm3 75 50 30 SO2 mg/Nm3 260 300 150 NOX mg/Nm3 400 - 200 CO mg/Nm3 150 100 80 Dioxins ngTEQ/Nm3 1.0 0.1 0.02
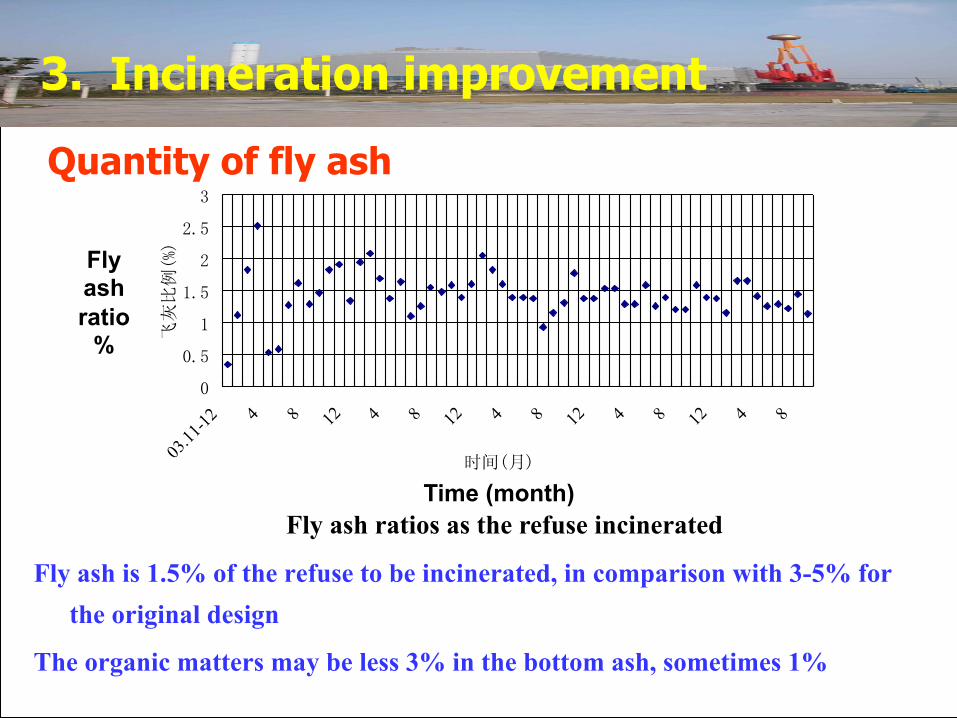
Fly ash is 1.5% of the refuse to be incinerated, in comparison with 3-5% for the original design
The organic matters may be less 3% in the bottom ash, sometimes 1%
0
0.5
1
1.5
2
2.5
3
03.11-12 4 8 12 4 8 12 4 8 12 4 8 12 4 8
时间(月)
飞灰比例(%)
Fly ash ratios as the refuse incinerated
3. Incineration improvement
Quantity of fly ash
Fly ash ratio
%
Time (month)
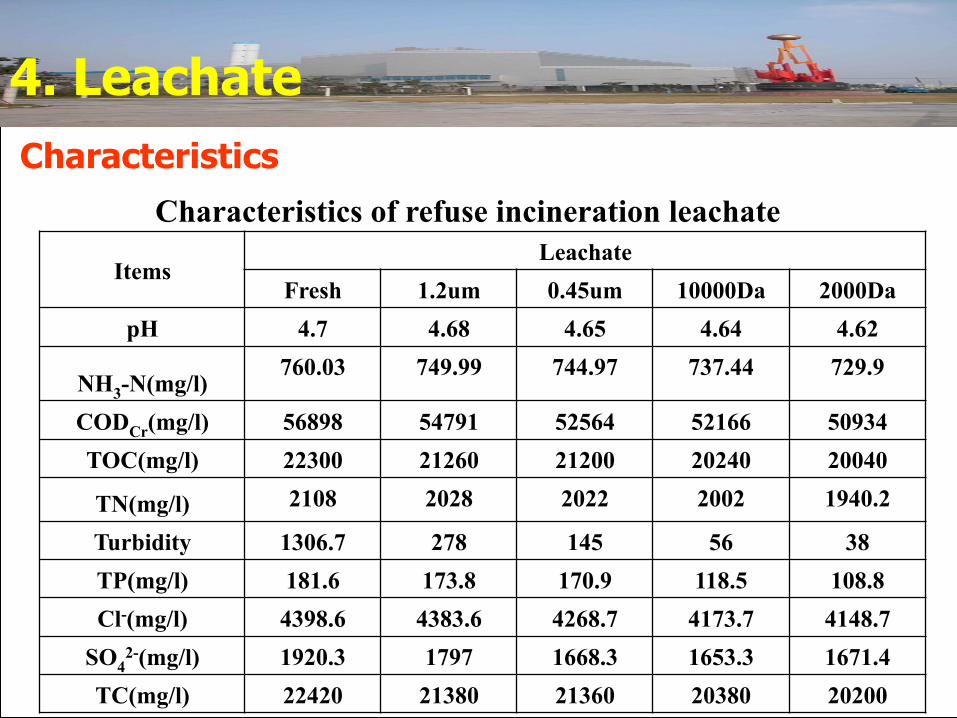
4. Leachate
Items Leachate Fresh 1.2um 0.45um 10000Da 2000Da
pH 4.7 4.68 4.65 4.64 4.62 NH3-N(mg/l) 760.03 749.99 744.97 737.44 729.9 CODCr(mg/l) 56898 54791 52564 52166 50934 TOC(mg/l) 22300 21260 21200 20240 20040 TN(mg/l) 2108 2028 2022 2002 1940.2 Turbidity 1306.7 278 145 56 38 TP(mg/l) 181.6 173.8 170.9 118.5 108.8 Cl-(mg/l) 4398.6 4383.6 4268.7 4173.7 4148.7
SO42-(mg/l) 1920.3 1797 1668.3 1653.3 1671.4
TC(mg/l) 22420 21380 21360 20380 20200
Characteristics of refuse incineration leachate
Characteristics
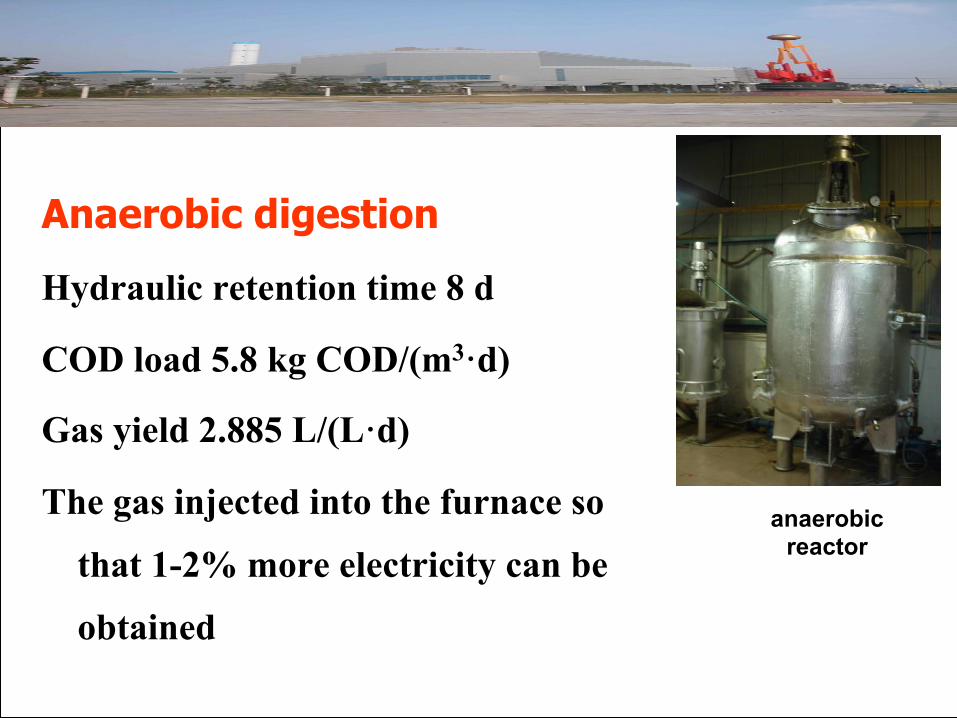
Anaerobic digestion
Hydraulic retention time 8 d
COD load 5.8 kg COD/(m3·d)
Gas yield 2.885 L/(L·d)
The gas injected into the furnace so
that 1-2% more electricity can be
obtained
anaerobic reactor
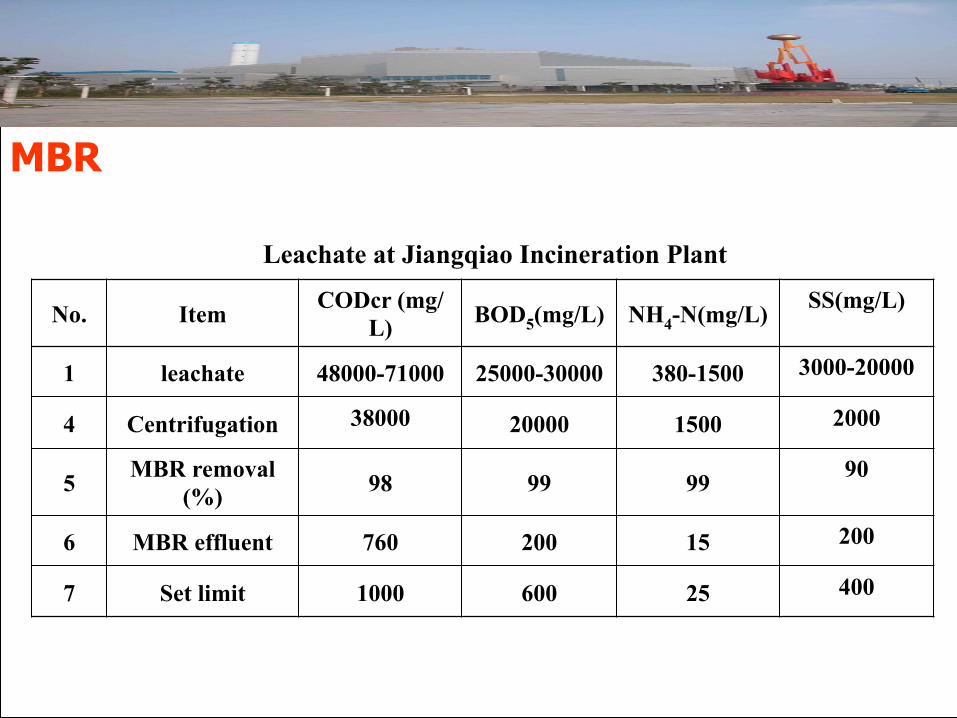
MBR
Leachate at Jiangqiao Incineration Plant No. Item CODcr (mg/
L) BOD5(mg/L) NH4-N(mg/L) SS(mg/L)
1 leachate 48000-71000 25000-30000 380-1500 3000-20000 4 Centrifugation 38000 20000 1500 2000 5 MBR removal
(%) 98 99 99 90 6 MBR effluent 760 200 15 200 7 Set limit 1000 600 25 400
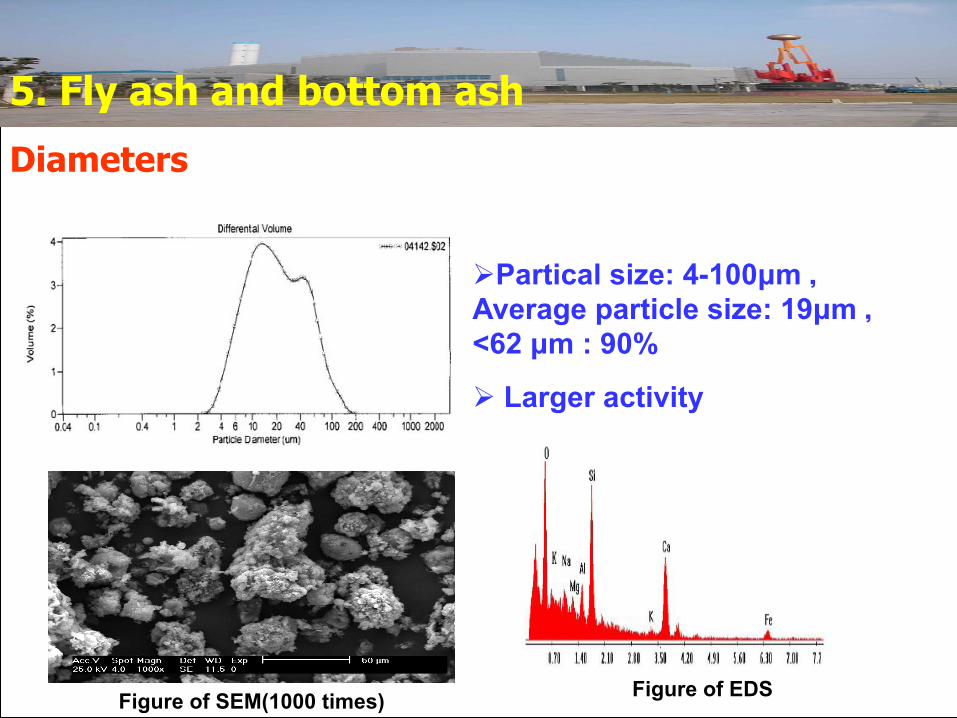
Diameters
Ø Partical size: 4-100µm , Average particle size: 19µm ,<62 µm : 90%
Ø Larger activity
5. Fly ash and bottom ash
Figure of SEM(1000 times) Figure of EDS
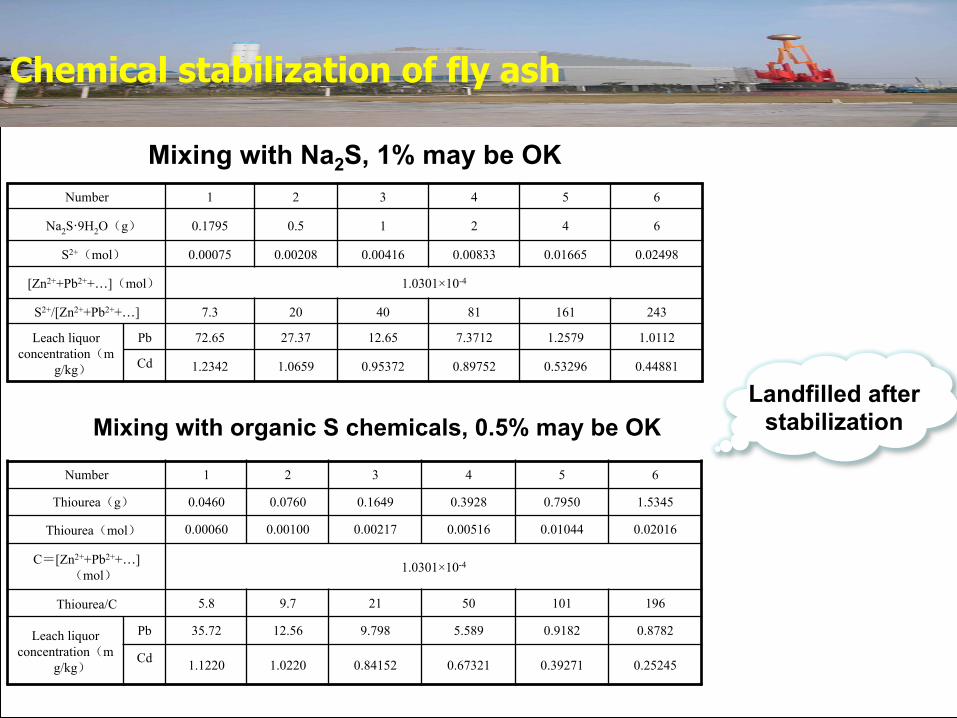
Number 1 2 3 4 5 6 Na2S·9H2O(g) 0.1795 0.5 1 2 4 6
S2+(mol) 0.00075 0.00208 0.00416 0.00833 0.01665 0.02498 [Zn2++Pb2++…](mol) 1.0301×10⁻⁴
S2+/[Zn2++Pb2++…] 7.3 20 40 81 161 243 Leach liquor
concentration(mg/kg)
Pb 72.65 27.37 12.65 7.3712 1.2579 1.0112 Cd 1.2342 1.0659 0.95372 0.89752 0.53296 0.44881
Mixing with Na2S, 1% may be OK
Number 1 2 3 4 5 6 Thiourea(g) 0.0460 0.0760 0.1649 0.3928 0.7950 1.5345
Thiourea(mol) 0.00060 0.00100 0.00217 0.00516 0.01044 0.02016 C=[Zn2++Pb2++…]
(mol) 1.0301×10⁻⁴ Thiourea/C 5.8 9.7 21 50 101 196
Leach liquor concentration(m
g/kg)
Pb 35.72 12.56 9.798 5.589 0.9182 0.8782 Cd 1.1220 1.0220 0.84152 0.67321 0.39271 0.25245
Mixing with organic S chemicals, 0.5% may be OK
Chemical stabilization of fly ash
Landfilled after stabilization
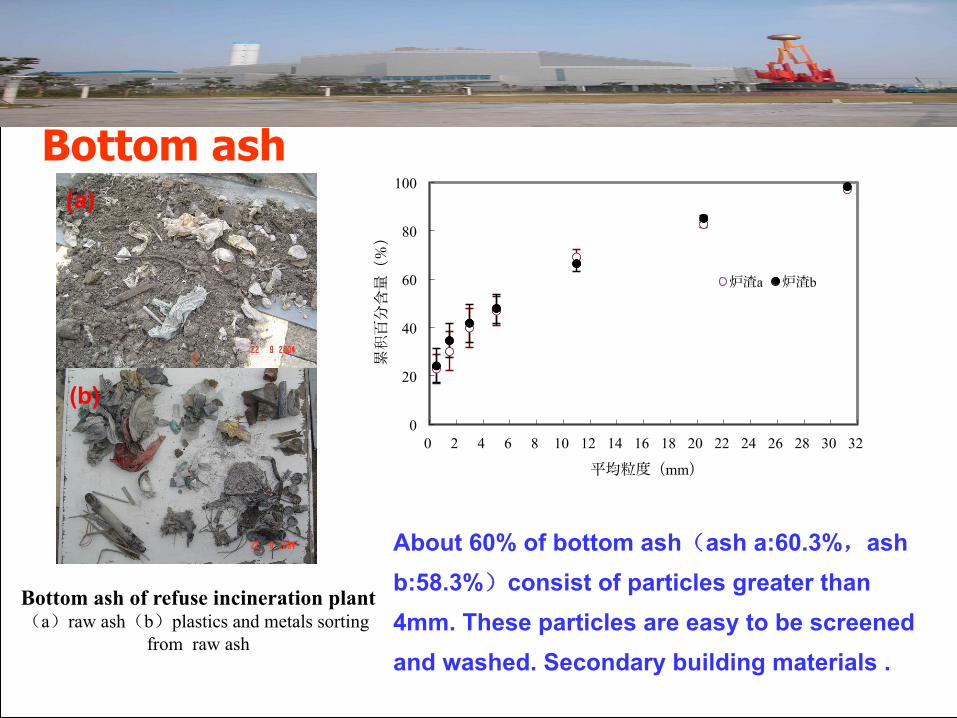
Bottom ash
0
20
40
60
80
100
0 2 4 6 8 10 12 14 16 18 20 22 24 26 28 30 32
累积百分含量(%)
平均粒度(mm)
炉渣a 炉渣b
About 60% of bottom ash(ash a:60.3%,ash b:58.3%)consist of particles greater than 4mm. These particles are easy to be screened and washed. Secondary building materials .
Bottom ash of refuse incineration plant(a)raw ash(b)plastics and metals sorting
from raw ash
(a)
(b)
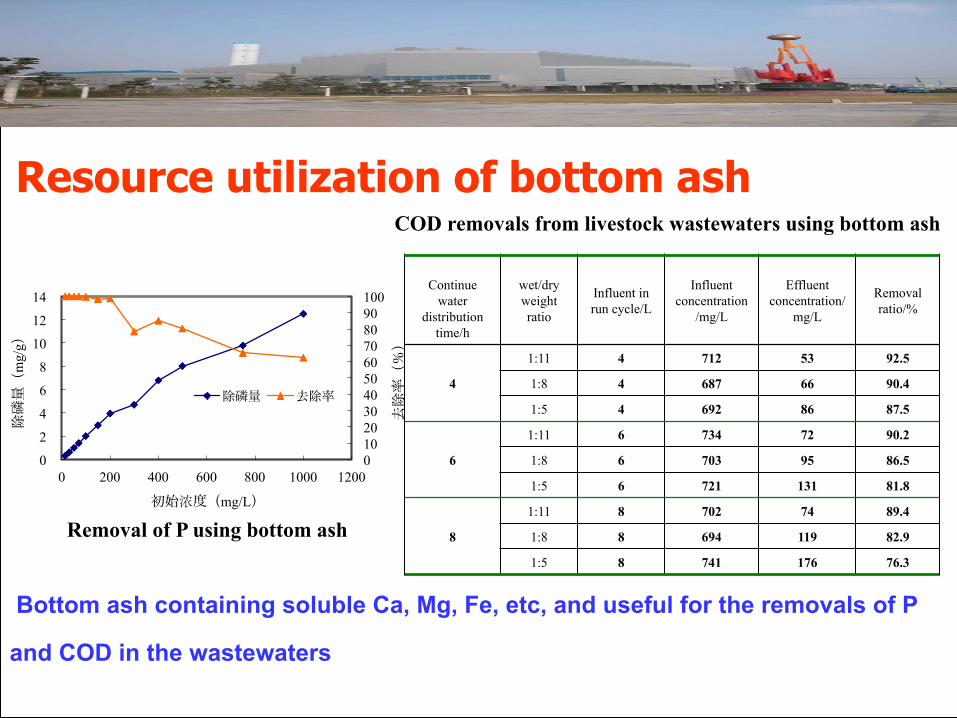
0 10 20 30 40 50 60 70 80 90 100
0
2
4
6
8
10
12
14
0 200 400 600 800 1000 1200
去除率(%)
除磷量(
mg/
g)
初始浓度(mg/L)
除磷量 去除率
Removal of P using bottom ash
COD removals from livestock wastewaters using bottom ash
Continue
water distribution
time/h
wet/dry weight ratio
Influent in run cycle/L
Influent concentration
/mg/L Effluent
concentration/mg/L
Removal ratio/%
4 1:11 4 712 53 92.5 1:8 4 687 66 90.4 1:5 4 692 86 87.5
6 1:11 6 734 72 90.2 1:8 6 703 95 86.5 1:5 6 721 131 81.8
8 1:11 8 702 74 89.4 1:8 8 694 119 82.9 1:5 8 741 176 76.3
Bottom ash containing soluble Ca, Mg, Fe, etc, and useful for the removals of P
and COD in the wastewaters
Resource utilization of bottom ash
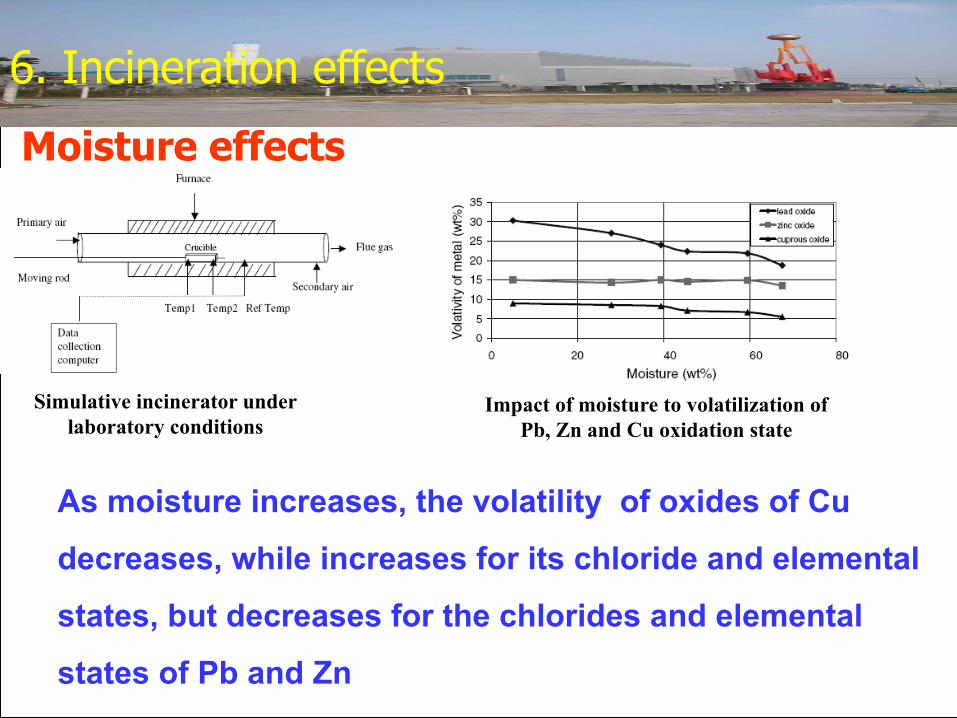
Moisture effects
Simulative incinerator under laboratory conditions
Impact of moisture to volatilization of Pb, Zn and Cu oxidation state
As moisture increases, the volatility of oxides of Cu
decreases, while increases for its chloride and elemental
states, but decreases for the chlorides and elemental
states of Pb and Zn
6. Incineration effects
0.00 0.18 0.36 0.54 0.72 0.900
10
20
30
40
50
60
70
80
90
Zn Pb Cr Cu
挥发率
(%)
Cl/Sludge(摩尔/质量) (10-3mol/g)
" Volatility of Zn increases by 13.0% , Pb by 6.5%, Cr by 6.2% and Cu by 4.5%
Presence of CaCl2
0.00 0.18 0.36 0.54 0.72 0.900
10
20
30
40
50
60
70
80
90
100
Zn Pb Cr Cu
挥发率
(%)
Cl/Sludge(摩尔/质量) (10-3mol/g)
" The volatility of Zn, Pb and Cu increase bu 11.2%, 18.4%,12.0%,higher than the presence of CaCl2,NaCl and FeCl3; Cr volatility increases slightly
Presence of PVC