Embed Size (px)
Citation preview

Appendix 1
South Northamptonshire Council
Treasury Management Strategy Statement and Investment Strategy
2016/17 to 2018/19
Contents:
1. Background
2. External Context
3. Local Context
4. Borrowing and Rescheduling Strategy
5. Annual Investment Strategy
6. Investment Strategy
7. Policy on the use of Financial Derivatives
8. Balanced Budget Requirement
9. 2016-17 Minimum Revenue Provision (MRP) Statement
10. Monitoring and Reporting on the Treasury Outturn and Prudential
Indicators
11. Other Items
Appendices:
Appendix A - Existing Investment & Debt Portfolio Position
Appendix B - Prudential Indicators Appendix C - Economic & Interest Rate Forecast
Appendix D - Recommended Sovereign and Counterparty List

2
1. Background
1.1 The Chartered Institute of Public Finance and Accountancy’s (CIPFA’s) Code of Practice 2011 for Treasury Management in Public Services (the “CIPFA TM Code”) and the Prudential Code require local authorities to determine their Treasury Management Strategy Statement (TMSS) and Prudential Indicators (PIs) on an annual basis. The TMSS also includes the Annual Investment Strategy (AIS) that is a requirement of the CLG’s Investment Guidance.
1.2 The purpose of this TMSS is, therefore, to approve:
Revisions to the Treasury Management Strategy and Prudential Indicators for 2015/16;
Treasury Management Strategy for 2016/17 (including for the remainder of 2015/16);
Annual Investment Strategy for 2016/17 (including for the remainder of 2015/16);
Prudential Indicators for 2016/17, 2017/18 and 2018/19;
Minimum Revenue Provision (MRP) Statement.
1.3 Treasury Management is about the management of risk. The Authority is
responsible for its treasury decisions and activity. No treasury management
activity is without risk.
1.4 As part of the requirements of the Prudential Code, the Authority adopted the CIPFA Treasury Management Code (the revised 2011 version) at a meeting of its Full Council on 27 February 2013.
1.5 All treasury activity will comply with relevant statute, guidance and accounting standards.
2. External Context
2.1 Economic background:
UK economic growth softened in Q3 2015 but remained reasonably robust;
the first estimate for the quarter was 0.5% and year-on-year growth fell
slightly to 2.3%.
Household spending has been the main driver of GDP growth through 2014
and 2015 and remains key to growth. Consumption will continue to be
supported by real wage and disposable income growth.
Annual average earnings growth was 3.0% (including bonuses) in the three
months to August. Given low inflation, real earnings and income growth
continue to run at relatively strong levels and could feed directly into unit
labour costs and household’s disposable income.
3
Improving productivity growth should support pay growth in the medium term.
The development of wage growth is one of the factors being closely monitored
by the MPC.
Business investment indicators continue to signal strong growth. However, the
outlook for business investment may be tempered by the looming EU
referendum, increasing uncertainties surrounding global growth and recent
financial market shocks.
Inflation is currently very low and, with a further fall in commodity prices, will
likely remain so over the next 12 months. The CPI rate is likely to rise towards
the end of 2016.
(Arlingclose 27/11/2015)
Credit outlook:
The varying fortunes of different parts of the global economy are reflected in
market indicators of credit risk.UK banks operating in the Far East and parts
of mainland Europe have seen their perceived risk increase, while those with
a more domestic focus continue to show improvement. The sale of most of
the government’s stake in Lloyds and the first sale of its shares in RBS have
generally been seen as credit positive.
Bail-In legislation, which ensures that large investors including local
authorities will rescue failing banks instead of taxpayers in the future, has
now been fully implemented in the UK, USA, and Germany. The rest of the
European Union will follow suit in January 2016, while Australia, Canada and
Switzerland are well advanced with their own plans. Meanwhile, changes to
the UK Financial Services Compensation Scheme and similar European
schemes in July 2015 mean that most of the private sector investors are now
partially or fully exempt from contributing to a bail-in. The credit risk
associated with making unsecured bank deposits has therefore increased
relative to the risk of other investment options available to the Authority;
returns from cash deposits however remain stubbornly low.
Interest rate forecast:
The Authority’s treasury management advisor Arlingclose forecasts the first
rise in official interest rates in September 2016 and a gradual pace of
increases thereafter, with the average for 2016/17 being around 0.75%.
Arlingclose believes the normalised level of the Bank Rate post-crisis to
range between 2% and 3%. Persistent low inflation, subdued global growth
and potential concerns over the UK’s position in Europe mean that the risks
to this forecast are weighted towards the downside.
4
The uncertainties surrounding the timing of UK and US interest rate rises are
likely to prompt short term volatility in gilt yields.
(Arlingclose Dec 2015)
3. Local Context
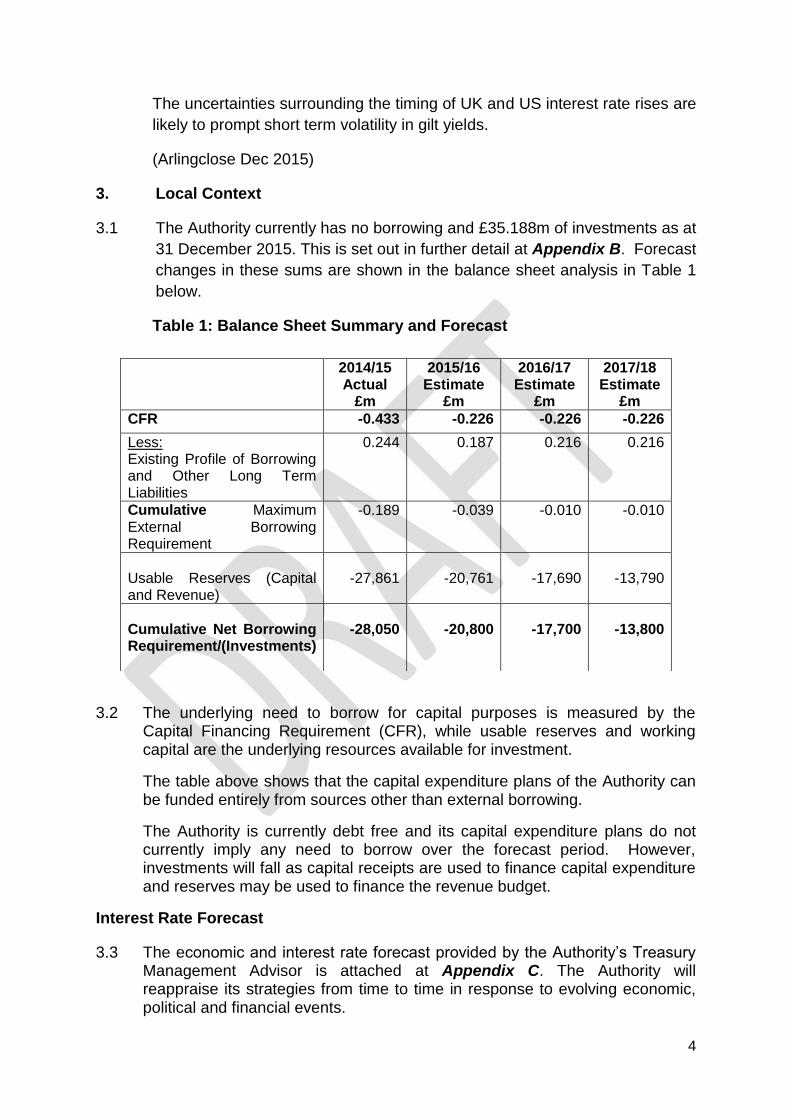
3.1 The Authority currently has no borrowing and £35.188m of investments as at
31 December 2015. This is set out in further detail at Appendix B. Forecast
changes in these sums are shown in the balance sheet analysis in Table 1
below.
Table 1: Balance Sheet Summary and Forecast
3.2 The underlying need to borrow for capital purposes is measured by the Capital Financing Requirement (CFR), while usable reserves and working capital are the underlying resources available for investment.
The table above shows that the capital expenditure plans of the Authority can be funded entirely from sources other than external borrowing.
The Authority is currently debt free and its capital expenditure plans do not currently imply any need to borrow over the forecast period. However, investments will fall as capital receipts are used to finance capital expenditure and reserves may be used to finance the revenue budget.
Interest Rate Forecast
3.3 The economic and interest rate forecast provided by the Authority’s Treasury Management Advisor is attached at Appendix C. The Authority will reappraise its strategies from time to time in response to evolving economic, political and financial events.
2014/15 Actual
£m
2015/16 Estimate
£m
2016/17 Estimate
£m
2017/18 Estimate
£m
CFR -0.433 -0.226 -0.226 -0.226
Less: Existing Profile of Borrowing and Other Long Term Liabilities
0.244 0.187 0.216 0.216
Cumulative Maximum External Borrowing Requirement
-0.189 -0.039 -0.010 -0.010
Usable Reserves (Capital and Revenue)
-27,861
-20,761
-17,690
-13,790
Cumulative Net Borrowing Requirement/(Investments)
-28,050
-20,800
-17,700
-13,800

5
4. Borrowing and Rescheduling Strategy
4.1 As indicated in Table 1 the Authority is currently debt free and its capital expenditure plans do not currently imply any external borrowing requirement over the forecast period.
4.2 The Authorised Limit sets the maximum level of external borrowing on a gross basis (i.e. not net of investments) for the Council. This Prudential Indicator separately identifies borrowing from other long term liabilities such as finance leases. It is consistent with the Council’s existing commitments, its proposals for capital expenditure and financing and its approved treasury management policy statement and practices.
4.3 The Authorised Limit has been set on the estimate of the most likely, prudent (but not worst case scenario) with sufficient headroom over and above this to allow for unusual cash movements.
4.4 The Authorised Limit is the statutory limit determined under Section 3(1) of the Local Government Act 2003 (referred to in the legislation as the Affordable Limit).
4.5 The Operational Boundary links directly to the Council’s estimates of the CFR and estimates of other cash-flow requirements. This indicator is based on the same estimates as the Authorised Limit reflecting the most likely, prudent (but not worst case scenario) but without the additional headroom included within the Authorised Limit.
Authorised Limit
for External Debt
2014/15
Approved
£m
2015/16
Estimate
£m
2016/17
Estimate
£m
2017/18
Estimate
£m
2018/19
Estimate
£m
Borrowing 6.500 6.500 6.500 6.500 6.500
Other Long-term
Liabilities 0.244 0.187 0.216 0.216 0.216
Total 6.744 6.687 6.716 6.716 6.716
4.6 Arlingclose comment: ordinarily, the Authorised Limit will be equal to or greater than the Operational Boundary. That said, the CFO has the ability to move the amounts between Borrowing and Other Long Term Liabilities, so long as their total remains within the approved limit.
4.7 The Director of Resources has delegated authority, within the total limit for any individual year, to effect movement between the separately agreed limits for borrowing and other long-term liabilities. Decisions will be based on the outcome of financial option appraisals and best-value considerations. Any movement between these separate limits will be reported to the next meeting of the Full Council.

6
5. Annual Investment Strategy
5.1 In accordance with Investment Guidance issued by the CLG and best practice, this Authority’s primary objectives in relation to the management and investment of public funds are security of the funds, liquidity or accessibility of the funds followed by yield on investments in that order.
The Authority holds significant invested funds, representing income received in advance of expenditure plus balances and reserves held. In the past 12 months, the Authority’s investments have ranged between £27.2 million and £35.2 million, and similar levels are expected to be maintained in the forthcoming year.
5.2 Given the increased risk and continued low returns from short-term unsecured bank investments (due to new Bail-In legislation July 2015), the Authority aims to diversify into more secure and high yielding asset classes during 2016/17. Our advisors, Arlingclose, have recommended a property fund that can be used by Local Authorities. It would involve setting aside a larger amount of investment for a longer period of time, but would still fall within our investment criteria. This diversification will represent a substantial change in direction from the 2015/16 operational investing strategy.
5.3 Investments are categorised as “Specified” or “Non-Specified” within the investment guidance issued by the CLG.
Specified investments are sterling denominated investments with a maximum maturity of one year. They also meet the “high credit quality” as determined by the Authority and are not deemed capital expenditure investments under Statute. Non-specified investments are, effectively, everything else.
5.4 The types of investments that will be used by the Authority and whether they are specified or non-specified are as follows:
Operational
Boundary for
External Debt
2014/15
Approved
£m
2015/16
Estimate
£m
2016/17
Estimate
£m
2017/18
Estimate
£m
2018/19
Estimate
£m
Borrowing 4.000 4.000 4.000 4.000 4.000
Other Long-term
Liabilities 0.244 0.187 0.216 0.216 0.216
Total 4.244 4.187 4.187 4.216 4.216

7
Specified and Non-Specified Investments
Investment Specified Non-Specified
Term deposits with banks and building societies - Unsecured
Term deposits with other UK local authorities - Unsecured
Investments with Registered Providers (RPs) of Social Housing,
i.e. Housing Associations
Certificates of deposit with banks & building societies- Unsecured
Gilts
Treasury Bills (T-Bills)
Bonds issued by Multilateral Development Banks
Local Authority Bills
Commercial Paper
Corporate Bonds – Secured (i.e. with collateral or other cover)
Corporate Bonds - unsecured
Money Market Funds offering same-day liquidity
Money Market Funds
Call Deposit Accounts offering same-day liquidity
Money Market Funds
Enhanced Money Market Funds
Pooled funds such as those investing in sovereign and corporate
bonds, equity income funds, & property funds - Secured
Debt Management Account Deposit Facility
Investments with other organisations ***
*** Subject to an external credit assessment and specific advice from Arlingclose
5.5 Registered Providers (RP’s) have been included within the specified and non-specified investments for 2016/17. Investments with RPs will be analysed on an individual basis and discussed with Arlingclose prior to investing.
5.6 Secured Bonds: These are bonds with banks and building societies where the
investment is secured on the institution’s assets, which limits the potential
losses in the unlikely event of insolvency, and means that they are exempt
from bail-in. Where the bond issue or collateral upon which the investment is
secured has a credit rating, the highest of the issue/collateral credit rating and
the counterparty credit rating will be used to determine cash and time limits.
The combined secured and unsecured investments in any one bank will not
exceed the cash limit for secured investments.
5.7 Unsecured Corporate Bonds: These will include loans, bonds and commercial
paper issued by companies other than banks/building societies and registered
providers. These investments are not subject to bail-in, but are exposed to the
risk of the company going insolvent. The credit assessment will be made
through the credit rating of the bond and the bond issuer as well as other
credit metrics such as credit default swaps of the corporate, if available.

8
5.8 Enhanced Money Market Funds and other Pooled Funds: These funds have
the advantage of providing wide diversification of investment risks, coupled
with the services of a professional fund manager in return for a fee. Pooled
funds whose value changes with market prices will be considered and
evaluated for use for the proportion of the Authority’s cash balances which are
estimated to be available for longer than 1 year.
Short-term money market funds that offer same-day liquidity and very low or
no volatility will be used in conjunction with Instant Access Bank Accounts.
Bond, equity income and property funds offer enhanced returns over the
longer term than is available from short-dated cash investment, but are likely
to be more volatile in the short term. These funds allow the Authority to
diversify into asset classes other than cash without the need to own and
manage the underlying investments. Because these funds have no defined
maturity date, but are available for withdrawal after a notice period (for
example property funds may only have one withdrawal date per month or
quarter), their performance and continued suitability in meeting the Authority’s
investment objectives will be monitored regularly.
5.9 Investments with other organisations have been included as a non-specified
investment category for 2016-17 This would include investment opportunities
with small and medium sized enterprises (SMEs) and other businesses across
the UK. Because of the higher perceived credit risk of SMEs, such investments
may provide considerably higher rates of return. An external credit assessment
will be undertaken and advice from Arlingclose will be sought (where available)
before any investment decision is made.
5.10 Specified Investments: The CLG Guidance defines specified investments as
those:
• denominated in pound sterling,
• due to be repaid within 12 months of arrangement,
• not defined as capital expenditure by legislation, and
• invested with one of:
o the UK Government,
o a UK local authority, parish council or community council, or
o a body or investment scheme of “high credit quality”.
The Authority defines “high credit quality” organisations and securities as
those having a credit rating of A- or higher that are domiciled in the UK or a
foreign country with a sovereign rating of AA+ or higher. For money market
funds and other pooled funds “high credit quality” is defined as those having a
credit rating of [A-] or higher.

9
All other investments are defined as ‘Non Specified’. The Authority does not
intend to make any investments denominated in foreign currencies, nor any
that are defined as capital expenditure by legislation, such as company
shares.
5.11 The other credit characteristics, in addition to credit ratings, that the Authority
monitors are listed in the Prudential Indicator on Credit Risk
Any institution will be suspended or removed should any of the factors
identified above give rise to concern. Specifically credit ratings are monitored
by the Authority on a monthly basis. Arlingclose advises the Authority on
ratings changes and appropriate action to be taken.
The countries and institutions that currently meet the criteria for investments
are included in Appendix D.
5.12 Delegated authority is granted to the Director of Resources, in consultation
with the Resources portfolio holder to amend the lending criteria and
counterparty limits detailed above as required to ensure that investments can
continue to be made in a rapidly changing financial environment and the
security of investments are maximised if this is deemed by him to be the most
appropriate course of action.
5.13 Authority’s Banker – The Authority banks with NatWest Bank (part of the RBS
Group). At the current time, it does not meet the minimum credit criteria of A-
(or equivalent) long-term (It has a rating of BBB+). Although the credit-rating
has fallen below the Authority’s minimum criteria, NatWest will, when
appropriate, continue to be used for short term liquidity requirements
(overnight and weekend investments) and business continuity arrangements.
5.14 The Director of Resources under delegated powers will undertake the most
appropriate form of investments in keeping with the investment objectives,
income and risk management requirements and Prudential Indicators.
Decisions taken on the core investment portfolio will be reported to Cabinet.
6. Investment Strategy
6.1 With short term interest rates low for even longer, an investment strategy will typically result in a lengthening of investment periods, where cash flow permits, in order to lock into higher rates of acceptable risk adjusted returns. The problem in the current environment is finding an investment counterparty providing acceptable levels of counterparty risk.
10
6.2 In order to diversify an investment portfolio largely invested in cash, investments will be placed with approved counterparties over a range of maturity periods. Maximum investment levels for each counterparty will be set to ensure prudent diversification is achieved.
6.3 Money Market Funds (MMFs) operating to a Constant Net Asset Value [CNAV] including Enhanced Money Market Funds (EMMFs) will be utilised but good treasury management practice prevails and whilst MMFs provide good diversification the Authority will also seek to mitigate operational risk by utilising more than one MMF and Instant Access Deposit Accounts.
The Authority will also restrict its exposure to Constant Net Asset Value MMFs with lower levels of funds under management and will not exceed 0.5% of the net asset value of the MMF, as these are funds which are used by investors for liquidity purposes and subject to a high volume of daily trading. In the case of Government MMFs, the Council will ensure exposure to each Fund does not exceed 2% of the net asset value of the Fund
7. Policy on the Use of Financial Derivatives
7.1 Local authorities have previously made use of financial derivatives embedded into loans and investments both to reduce interest rate risk (e.g. interest rate collars and forward deals) and to reduce costs or increase income at the expense of greater risk.
The general power of competence in section 1 of the Localism Act 2011 removes much of the uncertainty over local authorities’ use of standalone financial derivatives i.e. those that are not embedded into a loan or investment. The CIPFA Code requires authorities to clearly detail their policy on the use of derivatives in the annual strategy.
7.2 The Authority will only use standalone financial derivatives (such as swaps, forwards, futures and options) where they can be clearly demonstrated to reduce the overall level of financial risks that the Authority is exposed to. Additional risks presented, such as credit exposure to derivative counterparties, will be taken into account when determining the overall level of risk. Embedded derivatives will not be subject to the policy, although the risks they present will be managed in line with the overall treasury risk management strategy.
7.3 Financial derivative transactions may be arranged with any organisation that meets the approved investment criteria. The current value of any amount due from a derivative counterparty will count against the counterparty credit limit and the relevant foreign country limit.
7.4 The local authority will only use derivatives after seeking expert advice, a legal opinion and ensuring officers have the appropriate training for their use.
11
8. Balanced Budget Requirement
8.1 The Authority complies with the provisions of Section 32 of the Local Government Finance Act 1992 to set a balanced budget.
9. 2016-17 Minimum Revenue Provision (MRP) Statement
9.1 The Local Authorities (Capital Finance and Accounting) (England) (Amendment) Regulations 2008 (SI 2008/414) places a duty on local authorities to make prudent provision for debt redemption. Guidance on Minimum Revenue Provision (MRP) has been issued by the Secretary of State and local authorities are required to “have regard” to such Guidance under section 21(1A) of the Local Government Act 2003.
9.2 The four MRP options available are:
- Option 1: Regulatory Method; - Option 2: CFR Method; - Option 3: Asset Life Method; - Option 4: Depreciation Method.
NB This does not preclude other prudent methods.
9.3 MRP in 2016-17: Options 1 and 2 may be used only for supported (i.e. financing costs deemed to be supported through Revenue Support Grant from Central Government) Non-HRA capital expenditure funded from borrowing. Methods of making prudent provision for unsupported Non-HRA capital expenditure include Options 3 and 4.
9.4 This MRP Statement is being submitted before the start of the 2016-17 financial year. If it is ever proposed to vary the terms of the original MRP Statement during the year, a revised statement will be submitted at the time.
The Authority will apply Option 3 in respect of supported and unsupported Non-HRA capital expenditure funded from borrowing.
9.5 The MRP in respect of leases’ schemes which were brought onto the Balance Sheet under the International Financial Reporting Standards (IFRS) Accounting Code of Practice will match the annual principal repayment for the associated deferred liability.
10. Monitoring and Reporting on the Treasury Outturn and Prudential
Indicators
10.1 The Director of Resources will report to the Audit Committee and Cabinet on Treasury Management activity and Performance Indicators as follows:
- Quarterly against the strategy approved for the year. The Authority will produce an outturn report on its treasury activity no later than 30th September after the financial year end;
- The Audit Committee will be responsible for the scrutiny of treasury management activity and practices.

12
11. Other Items
11.1 Training
CIPFA’s Code of Practice requires the Responsible Officer to ensure that all Officers and Members tasked with treasury management responsibilities, including scrutiny of the treasury management function, receive appropriate training relevant to their needs and fully understand their roles and responsibilities.
The Council’s approach is:
To identify Members and Officers who require training;
To assess the level of training required and procure training from an external organisation with expertise in this area, including the Council’s Treasury Advisor, Arlingclose;
To monitor the ongoing training needs of Members and Officers based on legislative, regulatory and best-practice requirements.
11.2 Treasury Management Advisors
The Council manages its funds internally. Advice is available and can be sought specifically from the Council’s treasury management advisors when any core funding re-investment is being considered.
Acknowledgement:
This Treasury Management Strategy statement is prepared using an Arlingclose template for guidance – Arlingclose are the Council’s externally contracted Treasury Advisors up until March 31 2016.

13
Appendix A – Existing Investment & Debt Portfolio Position
31/12/15
Actual Portfolio
£m
External Borrowing:
- Total External Borrowing 0
Other Long Term Liabilities:
- Finance Leases ( Estimated)
0.187
Total Gross External Debt 0.187
Investments:
Managed in-house
- Short-term monies (Term Deposits/ monies on call / notice
accounts / Certificates of Deposit/MMFs)
- Long-term investments
Managed externally
- By Fund Managers
- Pooled Funds (please list)
35.188
0
0
0
Total Investments 35.188

14
Appendix B Prudential Indicators 2015/16 – 2018/19
1. Background:
It is a requirement under the Local Government Act 2003 for local authorities to
have regard to CIPFA’s Prudential Code for Capital Finance in Local Authorities
(the “CIPFA Prudential Code”) when setting and reviewing their Prudential
Indicators.
2. Gross Debt and the Capital Financing Requirement:
This is a key indicator of prudence. In order to ensure that over the medium-term debt will only be for a capital purposes, the council needs to ensure that the debt does not, except in the short term, exceed the total of the capital financing requirement in the preceding year plus the estimates of any additional increases to the capital financing requirement for the current and next two financial years.
The Director of Resources reports that the council had no difficulty meeting this requirement in 2015-166, nor are there any difficulties envisaged for future years. This view takes into account current commitments, existing plans and the proposals in the approved budget.
Debt 31.03.16
Estimate £m
31.03.17
Estimate £m
31.03.18
Estimate £m
31.03.19
Estimate £m
Borrowing (CFR) -0.226 -0.226 -0.226 -0.226
Finance Leases 0.187 0.216 0.216 0.216
PFI Liabilities 0 0 0 0
-0.039 -0.010 -0.010 -0.010
3. Estimates of Capital Expenditure:
3.1 This indicator is set to ensure that the level of proposed capital expenditure remains within sustainable limits and, in particular, considers the impact on Council Tax.
Capital
Expenditure
2014/15
Actual
£m
2015/16
Estimate
£m
2016/17
Estimate
£m
2017/18
Estimate
£m
Total 3.260 3.316 0.793 1.000

15
3.2 Capital expenditure will be financed or funded as follows:
Capital Financing 2014/15
Actual
£m
2015/16
Estimate
£m
2016/17
Estimate £m
2017/18
Estimate £m
Capital receipts 3.111 3.167 0.793 1.000
Government Grants 0.149 0.149 0 0
Revenue
contributions
0 0 0 0
Total Financing 3.260 3.316 0.793 1.000
Supported borrowing 0 0 0 0
Unsupported
borrowing
0 0 0 0
Total Funding 0 0 0 0
Total Financing
and Funding
3.260 3.316 0.793 1.000
4. Ratio of Financing Costs to Net Revenue Stream:
4.1 This is an indicator of affordability and highlights the revenue implications of existing and proposed capital expenditure by identifying the proportion of the revenue budget required to meet financing costs.
The definition of financing costs is set out in the Prudential Code.
4.2 The ratio is based on costs net of investment income.
Ratio of Financing
Costs* to Net
Revenue Stream
2014/15
Actual
%
2015/16
Estimate
%
2016/17
Estimate
%
2017/18
Estimate
%
2018/19
Estimate
%
Total -2.22 -2.24 -1.76 -1.44 -1.30
* Financing costs will include investment income foregone where capital receipts /
reserves are used in lieu of debt to finance capital expenditure.

16
5. Capital Financing Requirement:
5.1 The Capital Financing Requirement (CFR) measures the council’s underlying
need to borrow for a capital purpose. The calculation of the CFR is taken from
the amounts held in the Balance Sheet relating to capital expenditure and its
financing.
Note: The CFR can be a negative amount in situations where resources required to be set aside under the 1989 Act regime exceeded the underlying need to borrow.
7. Incremental Impact of Capital Investment Decisions:
7.1 This is an indicator of affordability that shows the impact of capital investment decisions on the Council Tax. The incremental impact is calculated by comparing the total revenue budget requirement of the current approved capital programme with an equivalent calculation of the revenue budget requirement arising from the proposed capital programme.
7.2 The council’s capital plans, as estimated in forthcoming financial years, have a neutral impact on council tax. This reflects the fact that capital expenditure is predominantly financed from internal resources (grants, contributions, revenue and capital receipts) and that any increase in the underlying need to borrow is supported through the Revenue Support Grant system.
8. Adoption of the CIPFA Treasury Management Code:
8.1 This indicator demonstrates that the council has adopted the principles of best practice.
Adoption of the CIPFA Code of Practice in Treasury Management
The council approved the adoption of the CIPFA Treasury Management Code at its Full
Council meeting on 27th February 2013.
The council has incorporated the changes from the revised CIPFA Code of Practice into its treasury policies, procedures and practices.
8.2 This council is aware that there is now an indicator on net debt which has been
considered; however, this is not detailed further as there are no current plans to go into debt during the 2016/17 financial year.
Capital Financing
Requirement
2014/15
Actual
£m
2015/16
Estimate
£m
2016/17
Estimate
£m
2017/18
Estimate
£m
2018/19
Estimate
£m
Total CFR -0.189 -0.039 -0.010 -0.010 -0.010

17
9. Upper Limits for Fixed Interest Rate Exposure and Variable Interest Rate
Exposure:
9.1 These indicators allow the council to manage the extent to which it is exposed to changes in interest rates.
9.2 The upper limit for variable rate exposure has been set to ensure that the council is not exposed to interest rate rises which could adversely impact on the revenue budget. The limit allows for the use of variable rate debt to offset exposure to changes in short-term rates on investments:
Existing level
(or
Benchmark
level) at
31/03/15 %
2015/16
Approved
£m or %
2015/16
Revised
£m or %
2016/17
Estimate
£m or %
2017/18
Estimate
£m or %
2018/19
Estimate
£m or %
Upper Limit for Fixed
Interest Rate Exposure
-£0.030 -£0.030 -£0.030 -£0.030 -£0.030 -£0.030
Upper Limit for Variable
Interest Rate Exposure
-£0.012 -£0.012 -£0.012 -£0.012 -£0.012 -£0.030
9.3 The limits above provide the necessary flexibility within which decisions will be made for drawing down new loans on a fixed or variable rate basis; the decisions will ultimately be determined by expectations of anticipated interest rate movements as set out in the council’s treasury management strategy.
9.4 As the council’s investments are substantially in excess of its borrowing, these calculations have resulted in a negative figure.
10. Maturity Structure of Fixed Rate borrowing:
10.1 This indicator highlights the existence of any large concentrations of fixed rate debt needing to be replaced at times of uncertainty over interest rates and is designed to protect against excessive exposures to interest rate changes in any one period, in particular in the course of the next ten years.
10.2 It is calculated as the amount of projected borrowing that is fixed rate maturing in each period as a percentage of total projected borrowing that is fixed rate. The maturity of borrowing is determined by reference to the earliest date on which the lender can require payment.

18
Maturity structure of fixed rate
borrowing
Existing level (or
Benchmark level)
at 31/03/15
%
Lower Limit
for 2016/17
%
Upper Limit
for 2016/17
%
Less than twelve months 0% 0% 100%
12 months – 10 years 0% 0% 100%
10 years plus 0% 0% 100%
11. Credit Risk:
11.1 The council considers security, liquidity and yield, in that order, when making investment decisions.
11.2 Credit ratings remain an important element of assessing credit risk, but they are not a sole feature in the council’s assessment of counterparty credit risk.
11.3 The council also considers alternative assessments of credit strength, and information on corporate developments of and market sentiment towards counterparties. The following key tools are used to assess credit risk:
Published credit ratings of the financial institution (minimum A- or equivalent) and its sovereign (minimum AA+ or equivalent for non-UK sovereigns);
Sovereign support mechanisms (although these are fast diminishing with the bail-in regimes being adopted for resolving failing financial institutions);
Credit default swaps (where quoted);
Share prices (where available);
Economic fundamentals, such as a country’s net debt as a percentage of its GDP);
Corporate developments, news, articles, markets sentiment and momentum;
Subjective overlay.
11.4 The only indicators with prescriptive values remain to be credit ratings. Other indicators of creditworthiness are considered in relative rather than absolute terms.
11.5 The council has adopted a voluntary measure of its exposure to credit risk by monitoring the value-weighted average credit score of its investment portfolio. This is calculated by applying a score to each investment (AAA=1, AA+=2, etc) and taking the arithmetic average, weighted by the size of each investment.
Target
Portfolio value –weighted average credit score 6
19
The target score which the council will aim to achieve is ‘6’ which equates to an average credit rating of ‘A’; this target is one notch above the council’s minimum rating criteria of A-.
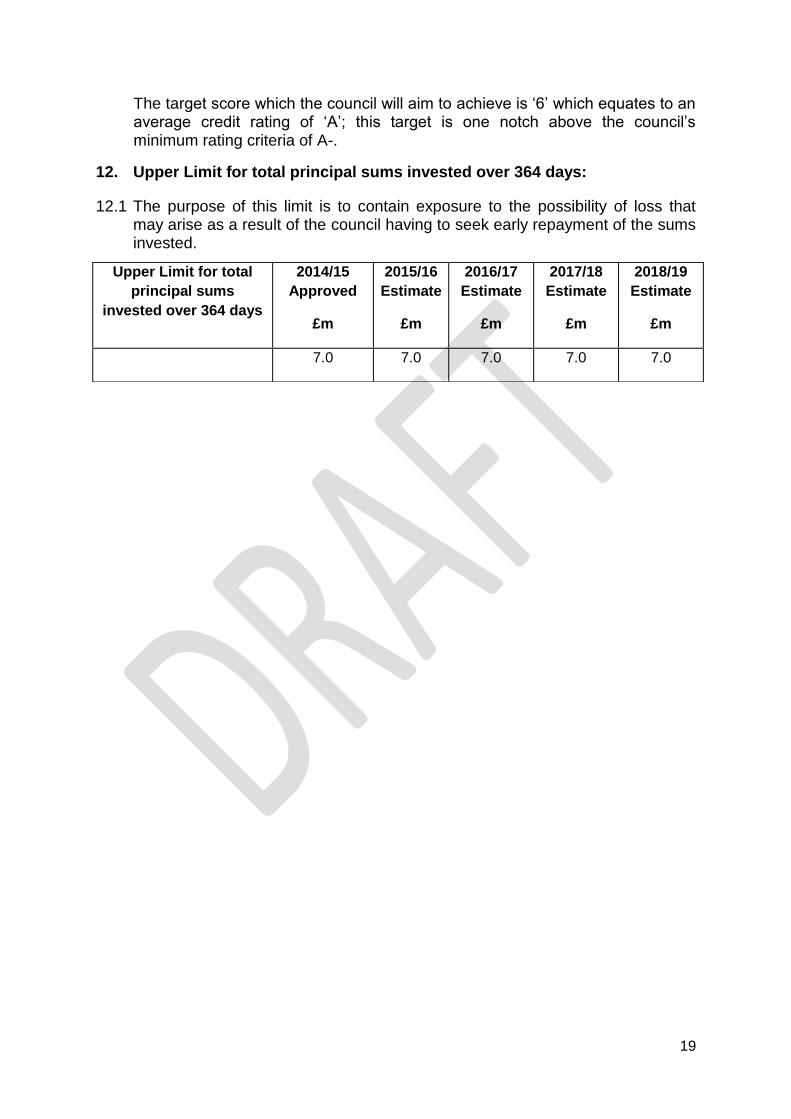
12. Upper Limit for total principal sums invested over 364 days:
12.1 The purpose of this limit is to contain exposure to the possibility of loss that may arise as a result of the council having to seek early repayment of the sums invested.
Upper Limit for total
principal sums
invested over 364 days
2014/15
Approved
£m
2015/16
Estimate
£m
2016/17
Estimate
£m
2017/18
Estimate
£m
2018/19
Estimate
£m
7.0 7.0 7.0 7.0 7.0

20
Appendix C – Economic & Interest Rate Forecast
Underlying assumptions: Arlingclose (Nov2015):
Underlying assumptions:
UK economic growth softened in Q3 2015 but remained reasonably robust; the first
estimate for the quarter was 0.5% and year-on-year growth fell slightly to 2.3%. Negative
construction output growth offset fairly strong services output, however survey estimates
suggest upwards revisions to construction may be in the pipeline.
Household spending has been the main driver of GDP growth through 2014 and 2015 and
remains key to growth. Consumption will continue to be supported by real wage and
disposable income growth.
Annual average earnings growth was 3.0% (including bonuses) in the three months to
August. Given low inflation, real earnings and income growth continue to run at relatively
strong levels and could feed directly into unit labour costs and households' disposable
income. Improving productivity growth should support pay growth in the medium term. The
development of wage growth is one of the factors being closely monitored by the MPC.
Business investment indicators continue to signal strong growth. However the outlook for
business investment may be tempered by the looming EU referendum, increasing
uncertainties surrounding global growth and recent financial market shocks.
Inflation is currently very low and, with a further fall in commodity prices, will likely
remain so over the next 12 months. The CPI rate is likely to rise towards the end of 2016.
Longer term rates will be tempered by international uncertainties and weaker global
inflation pressure.

21
Forecast:
Arlingclose forecasts the first rise in UK Bank Rate in Q3 2016. Further weakness in
inflation, and the MPC's expectations for its path; suggest policy tightening will be pushed
back into the second half of the year. Risks remain weighted to the downside. Arlingclose
projects a slow rise in Bank Rate, the appropriate level of which will be lower than the
previous norm and will be between 2 and 3%.
The projection is for a shallow upward path for medium term gilt yields, with continuing
concerns about the Eurozone, emerging markets and other geo-political events, weighing
on risk appetite, while inflation expectations remain subdued.
The uncertainties surrounding the timing of UK and US monetary policy tightening, and
global growth weakness, are likely to prompt short term volatility in gilt yields.

22
Appendix D – Recommended Sovereign and Counterparty List Group Limits - For institutions within a banking group, the limit will be that of the parent bank
within that group.
**Instrument **Country/ Domicile
**Counterparty **Maximum
Counterparty Limit
UK Bank Summary
Term Deposits / CDs UK
Bank of Scotland (Lloyds Banking Group)
£3m
Term Deposits / CDs UK
Lloyds TSB (Lloyds Banking Group)
£3m
Term Deposits / CDs UK Barclays Bank Plc £3m
Term Deposits / CDs UK HSBC Bank Plc £3m
Term Deposits / CDs UK Nationwide Building Society £3m
Term Deposits / CDs UK Standard Chartered Bank £3m
Term Deposits / CDs UK
Santander UK Plc (Banco Santander Group)
£3m
Non – UK Bank Summary
Term Deposits / CDs Australia
Australia and NZ Banking Group
£3m
Term Deposits / CDs Australia
Commonwealth Bank of Australia
£3m
Term Deposits / CDs Australia
National Australia Bank Ltd (National Australia Bank
Group) £3m
Term Deposits / CDs Australia Westpac Banking Corp £3m
Term Deposits / CDs Canada Bank of Montreal £3m
Term Deposits / CDs Canada Bank of Nova Scotia £3m
Term Deposits / CDs Canada
Canadian Imperial Bank of Commerce
£3m
Term Deposits / CDs Canada Royal Bank of Canada £3m
Term Deposits / CDs Canada Toronto-Dominion Bank £3m
Term Deposits / CDs Finland Nordea Bank Finland £3m
Term Deposits / CDs Finland Pohjola £3m
Term Deposits / CDs Germany Deutsche Bank AG £3m

23
Term Deposits / CDs Netherlands ING Bank NV £3m
Term Deposits / CDs Netherlands Rabobank £3m
Term Deposits / CDs Netherlands
Bank Nederlandse Gemeenten
£3m
Term Deposits / CDs Singapore DBS Bank Ltd £3m
Term Deposits / CDs Singapore
Oversea – Chinease4 Banking Corporation (OCBC)
£3m
Term Deposits / CDs Singapore United Overseas Bank (UOB) £3m
Term Deposits / CDs Sweden Svenska Handelsbanken £3m
Term Deposits / CDs Switzerland Credit Suisse £3m
Term Deposits / CDs USA JP Morgan £3m
**Please note this list could change if, for example, a counterparty/country is upgraded, and meets our other creditworthiness tools. Alternatively, if a counterparty is downgraded, the list may be shortened. Non-Specified Investments
Instrument Maximum maturity
Max %/£M of portfolio
Term deposits with banks, building societies which meet the specified
investment criteria 2 years 15%
Term deposits with banks, building societies whose credit ratings meet the
non-specified specified investment criteria 100 days 15%
Term deposits with local authorities 5 years 25%
CDs and other negotiable instruments with banks and building societies which meet
the specified investment criteria 2 years 15%
Deposits with registered providers 5 years 15%
Gilts 10 years 25%
Bonds issued by multilateral development banks
10 years 25%
Money Market Funds operating on constant net asset value basis and
Instant Access Call Deposit Accounts n/a 50%
Debt instruments issued by corporate bodies purchased from 01/04/12 onwards
5 years 15%

24
Covered Bonds and investments with underlying collateral
5 years 25%
Enhanced Money Market Funds - up to value of 10% of total investment portfolio
per Money Market Fund n/a 40%
Other Pooled Funds, e.g. Bond Funds, Equity Income Funds, Property Funds as
per Arlingclose Advice 5 years 40%
The Authority may only have a maximum of 50% of its investment portfolio in non-
specified investments.