Embed Size (px)
Citation preview

WorldTRAVEL & TOURISM
A WORLD OF OPPORTUNITY
The 2003 Travel & Tourism Economic Research

CHAIRMAN:Sir Ian ProsserChairmanSix Continents PLC
VICE CHAIRMEN:Donald CartyChairman, President & CEOAmerican Airlines
Jean-Marc Espalioux Chairman of Management Board& CEOAccor S.A.
André JordanChairman Lusotur S.A.
Jonathan S. LinenVice ChairmanAmerican Express Company
Vincent A.WolfingtonChairmanCarey International, Inc.
EXECUTIVE COMMITTEE:Peter Armstrong President & CEORocky Mountaineer Railtours
Stephen BollenbachPresident & CEOHilton Hotels Corporation
Club Méditerranée
Sebastián EscarrerVice ChairmanSol Meliá
Edouard EttedguiManaging DirectorMandarin Oriental Hotel Group
Maurice FlanaganGroup Managing DirectorEmirates
Bernard D. FrelatPresident & CEORail Europe Group, Inc.
Michael FrenzelChairmanTUI A.G
David House Group President, Global Networkand Establishment Services American Express Company
Richard R. KelleyChairmanOutrigger Enterprises, Inc
Geoffrey J.W. KentChairman & CEOAbercrombie & Kent
J.W. Marriott, Jr.Chairman & CEOMarriott International, Inc
David MichelsChief ExecutiveHilton Group
Curtis NelsonPresident and CEOCarlson Consumer Group
P.R.S. OberoiChief ExecutiveThe Oberoi Group
Henry SilvermanChairman & CEOCendant Corporation
Jonathan TischChairman & CEOLoews Hotels
Brett TollmanVice ChairmanThe Travel Corporation
GLOBAL MEMBERS:Akbar Al BakerCEOQatar Airways
Giovanni AngeliniCEO & Managing DirectorShangri-La Hotels & Resorts
David BabaiChairmanGullivers Travel Associates
Phil BakesChairman & CEOFAR&WIDE Travel Corporation
Ted BalestreriChairman & CEOCannery Row Company
Henrik BartlHead of Specialized PropertyFinanceAareal Bank AG
Gordon BethuneChairman of the Board & CEOContinental Airlines
Paul BlackneyPresident & CEOWorldspan
Richard BrownChairman & CEOEurostar Group
Regis Bulot President Relais & Chateaux
Marilyn Carlson NelsonChairman & CEOCarlson Companies, Inc
Alun CathcartDeputy ChairmanAvis Europe Plc
U. Gary CharlwoodFounder, Chairman & CEOUniglobe Travel (International)Inc.
Jennie ChuaPresident & COORaffles International Ltd.
David CliftonManaging Director, Europe &AsiaInterval International
Glen DavidsonSenior VP,Worldwide TravelInsurance & Related ServicesAmerican International GroupInc.
Dinesh DhamijaChairman & CEOebookers plc
Lloyd DorfmanChairman & Chief ExecutiveTravelex plc
Rod EddingtonChief Executive British Airways plc
Manuel Fernando Espírito SantoPresidentGroup Espirito Santo
Sam GaleotosPresident & CEOGalileo International
Laurence GellerChairman & CEOStrategic Hotel Capital
Maurice H. GreenbergChairman & CEOAmerican International Group,Inc.
Philip HaanExecutive VP International,Sales & Information ServicesNorthwest Airlines
Anthony HarrisChief ExecutiveHilton International
Richard HelferChairman & CEORaffles International Ltd.
James HensleyPresidentAllied Europe
James HoganPresident and Chief ExecutiveGulf Air
Stephen HolmesChairman & CEO, HospitalityDivisionCendant Corporation
Raimund HoschPresident & CEOMesse Berlin GmbH
Dieter HuckesteinPresident, Hotel Operations,Owned & ManagedHilton Hotels Corporation
Xabier de IralaChairman & CEOIberia
Clive JacobsChairman & CEOHoliday Autos Group
Nuno Trigoso JordãoPresident & CEO.Sonae Turismo Gestao Servicos
Sol KerznerChairmanKerzner International Ltd.
Nigel KnowlesManaging PartnerDLA
Craig KochPresident & CEOThe Hertz Corporation
Krishna KumarManaging DirectorThe Taj Group of Hotels
Hans LerchPresident & CEOKuoni Travel Holding Ltd.
Paolo MantegazzaPresident & CEOGlobus & Cosmos Inc
Manuel MartinPartnerCyberDodo Productions Ltd.
Paul McManusPresident & CEOThe Leading Hotels of the World
David MongeauVice PresidentCIBC World Markets
Alan MulallyPresident & CEOBoeing Commercial Airplanes
John M Noel President & CEOTravel Guard International
Tom NutleyChairmanReed Travel Exhibitions
Alan ParkerManaging DirectorWhitbread Hotel Company
Jean Gabriel PérèsPresident & CEOMövenpick Hotels & Resorts
Dionísio PestanaChairmanGroup Pestana
Stefan PichlerChairman & CEOThomas Cook AG
Fernando PintoChief Executive OfficerTAP - Air Portugal
David RadcliffeChief ExecutiveHogg Robinson
Jay RasuloPresident Walt Disney Parks & Resorts
Bonnie ReitzSenior VP, Marketing & Sales Continental Airlines
Kurt RitterPresident & CEORezidor SAS Hospitality
Peter RogersPresident & CEODiners Club International
Carl RudermanChairmanUniversal Media
Bruno SchöpferCEO & Managing DirectorMövenpick Group
Robert SelanderPresident & CEOMasterCard International
Per SetterbergCEOGlobal Refund Holdings A.B.
Eric SpeckExecutive Vice President Group President,TravelMarketing & DistributionSabre Holdings Corporation
Barry SternlichtChairman & CEOStarwood Hotels & ResortsWorldwide, Inc
Ron StringfellowExecutive ChairmanSouthern Sun Group
Lalit SuriChairman & Managing DirectorBharat Hotels Ltd.
Ian SwainChairman & CEOSwain Travel Services Inc
Kathleen TaylorPresident,Worldwide BusinessOperationsFour Seasons Hotels and Resorts
José Antonio TazónPresident & CEOAmadeus Global TravelDistribution
Jeffrey TofflerChairmanCoventry Partners
Mustafa TürkmenCEO & Managing DirectorEnternasyonal TourismInvestments, Inc.Yapi Kredi Bankof Turkey
Patrice VinetPartnerAccenture
Trevor de VriesDeputy Managing DirectorMondial Assistance S.A.
Jurgen WeberChairmanLufthansa German Airlines
Peter YesawichManaging PartnerYesawich, Pepperdine, Brown &Russel
HONORARY MEMBERS:Lord Marshall of KnightsbridgeChairmanBritish Airways plc
Sir Frank Moore,AOChairmanTaylor Byrne Tourism Group
Frank OlsonChairman of the BoardThe Hertz Corporation
Gérard PélissonCo-Chairman, Supervisory BoardAccor S.A.
Tommaso ZanzottoPresidentTZ Associates Ltd.
CHAIRMAN EMERITUS:James D. Robinson IIIGeneral PartnerRRE Ventures
IMMEDIATE PASTCHAIRMEN:Harvey Golub Retired Chairman & CEOAmerican Express Co.
PRESIDENT:Jean-Claude Baumgarten
Correct as at 14 February 2003
© 2003 WORLD TRAVEL & TOURISM COUNCIL1-2 QUEEN VICTORIA TERRACE.SOVEREIGN COURT.LONDON E1W 3HA. UNITED KINGDOMTEL: +44 (0) 870 727 9882 or + 44 (0) 207 481 8007 • FAX: +44 (0) 870 728 9882 or + 44 (0) 207 488 1008 • [email protected] • www.wttc.org
This 2003 report for World is the third set of Tourism Satellite Accounting research that Oxford Economic Forecasting (OEF) has prepared for WTTC. The first, commissioned in 2001, re-engineered the models previously developed during the 1990s. The second, prepared in 2002, held the research fairly static to provide a much-needed variance analysis for September 11, used to quantify the tragic events of the previous year. Now in 2003, WTTC has taken the opportunity of this third iteration to significantly upgrade and enhance the quality, sophistication and precision of the TSA research. In fact, the improvements are so significant, we are tempted to categorize the 2003 research as the WTTC/OEF TSA 2.0
Beyond the enhancements itemized at the end of this report, this 2003 research updates the historical results, estimates the current performance of World’s Travel &Tourism, and provides short and long-term forecasts based on the most recent national and international data sources and econometric models developed by Oxford Econometric Forecasting.
The message from this report is clear. In 2003, World’s Travel & Tourism Industry is expected to generate 3.7 per cent of GDP and 67,441,100 jobs, while the broader Travel & Tourism Economy is expected to total 10.2 per cent of GDP and 194,562,000 jobs. Looking ahead, the forecast for Travel & Tourism Demand is expected to total 2.9 per cent real growth in 2003, and 4.6 per cent real growth per annum between 2004 and 2013.
This WTTC research quantifies and documents the Travel & Tourism economics for World, the first step towards addressing mission-critical issues such as tourism management, tourism marketing and promotion, tourism infrastructure, taxation, aviation policy and much more.
We hope that by raising awareness of previous performance, current conditions and the, as yet unrealized, potential of Travel & Tourism in World, this report will act as a catalyst, encouraging industry and government to continue to work together to create the conditions necessary to realize the industry’s true promise.
As always, this new TSA research quantifies all aspects of Travel & Tourism demand, from personal consumption to business purchases, capital investment, government spending and exports. It then translates this information into economic concepts of production, such as gross domestic product and employment, which can be compared with other industries and the economy as a whole to provide credible statistical information that will assist in policy and business decision processes.
The War Scenario
The possibility of a war in Iraq has caused WTTC/Oxford to re-assess this 2003 TSA research. The base case presented in this report reflects the assumption of no war or quick, decisive, and contained military action. The "War Scenario" on Page 18 illustrates the impact vis-à-vis the base case assuming a drawn-out, less decisive, uncontained military action.
Jean-Claude Baumgarten Sir Ian ProsserPresident, World Travel & Tourism Council Chairman, World Travel & Tourism Council
Chairman, Six Continents Hotels & Resorts PLC
With the Chief Executives of more than one hundred of the world’s leading companies inmembership, WTTChas auniquemandate and overviewon allmatters related to success inTravel&Tourism.
THE WORLD TRAVEL & TOURISM COUNCIL (WTTC) IS THE BUSINESS LEADERS’ FORUM FOR TRAVEL & TOURISM, WORKING WITH GOVERNMENTS TO RAISE AWARENESS OF THE IMPORTANCE OF THE WORLD’S LARGEST GENERATOR OF WEALTH AND JOBS.


CONTENTSTRAVEL & TOURISM – A WORLD OF OPPORTUNITY
ECONOMIC IMPACT ________________________________________________________________________________ 4
GROWTH __________________________________________________________________________________________________ 5
TRAVEL & TOURISM SATELLITE ACCOUNTTOURISM SATELLITE ACCOUNTING ______________________________________________________________________________ 6
WTTC’S APPROACH TO TSA RESEARCH __________________________________________________________________________ 7
TSA CONCEPTS & STRUCTURE____________________________________________________________________________________ 8
TRAVEL & TOURISM’S ECONOMIC IMPACT ______________________________________________________________________ 10
TSA CHARTS_____________________________________________________________________________________________________ 12
RANKING AND RANGE __________________________________________________________________________________________ 14
CONTRIBUTION AND GROWTH _________________________________________________________________________________ 15
SATELLITE ACCOUNT TABLES____________________________________________________________________________________ 16
THE WAR SCENARIOOVERVIEW ______________________________________________________________________________________________________ 18
ANALYSIS & SUMMARY __________________________________________________________________________________________ 20
THE COMPETITIVENESS MONITOR_______________________________________________________ 22
APPENDIXWTTC / OEF TSA RESEARCH: THE 2003 UPDATE __________________________________________________________________ 24
2003/2002 VARIANCE CHARTS ____________________________________________________________________________________ 27
Use of Material is Authorized, Provided Source is Acknowledged

US$ 1,280.4
US$ 3,526.9
US$ 1,009.9
US$ 686.0
US$ 224.1
4
ECONOMIC IMPACTIN 2003, WORLD'S TRAVEL & TOURISM IS EXPECTED TO GENERATE US$4,544.2 BILLION OF ECNOMIC ACTIVITY (TOTAL DEMAND). THE INDUSTRY'S DIRECT IMPACT INCLUDES:
billion …..of Gross Domestic Product (GDP) equivalent to 10.2 per cent of total GDP.
HOWEVER, SINCE TRAVEL & TOURISM TOUCHES ALL SECTORS OF THE ECONOMY, ITS REAL IMPACT IS EVEN GREATER. WORLD'S TRAVEL &TOURISM ECONOMY DIRECTLY AND INDIRECTLY ACCOUNTS FOR:
194,562,000
billion …..of Gross Domestic Product (GDP) equivalent to 3.7 per cent of total GDP.
jobs….representing 2.6 per cent of total Employment.
jobs….representing 7.6 per cent of total Employment.
67,441,100
billion of Exports, services & merchandise….or 11.2 per cent of total Exports.
billion of Capital Investment….or 9.6 per cent of total investment.
billion of Government Expenditures….or 3.9 per cent share.

2.9%
1.1%
0.1%
4.6%
3.6%
2.2%
7.1%
4.3%
3.0%5
OVER THE NEXT TEN YEARS,WORLD'S TRAVEL &TOURISM IS EXPECTED TO ACHIEVE ANNUALIZED REAL GROWTH (REAL DECLINE) OF:
….in Travel & Tourism Industry GDP to US$1,280.4 billion for the industry directly and 2.0 per cent to US$ 3,526.9 billion for the Travel & Tourism Economy overall (direct and indirect expenditures).
GROWTHIN 2003, TRAVEL & TOURISM IN WORLD IS FORECAST TO SEE REAL GROWTH (REAL DECLINE) OF:
….in Travel & Tourism Industry Employment (direct impact only), to 67,441,100 jobs, and 1.5 per cent to 194,562,000 jobs in the Travel & Tourism Economy overall (direct and indirect).
….in total Travel & Tourism Demand to US$4,544.2 billion.
US$ 2,279.2 billion in 2013 for the industry directly and to US$6,461.4 billion for the Travel & Tourism Economy overall.
….in terms of Government Expenditures to US$378.2 billion in 2013.
….in Travel & Tourism Employment, to 83,893,600 jobs directly in the industry, and 2.4 per cent to 247,205,000 jobs in the Travel & Tourism Economy overall in 2012.
….in total Travel & Tourism Demand to US$8,939.7 billion in 2013.
….in Visitor Exports, rising to US$1,332.1 billion by 2013.
….in terms of Capital Investment, increasing to US$1,308.6 billion in 2013.

TRAVEL & TOURISMSATELLITE ACCOUNTTOURISM SATELLITE ACCOUNTING
THIS REPORT FOLLOWS THE CONCEPT OF SATELLITE ACCOUNTINGDEFINED IN THE TOURISM SATELLITE ACCOUNT: RECOMMENDEDMETHODOLOGICAL FRAMEWORK (TSA:RMF), AND DEVELOPED UNDERTHE AUSPICES OF THE WORLD TOURISM ORGANIZATION.
Over the last three decades, countries have estimated the economic impact of Travel &Tourism through a range of measures using a variety of definitions and methodologies. Suchapproaches have prevented meaningful comparisons among nations. Even for the same nationover different periods of time, they have frustrated business and government attempts to drawvalid conclusions about the nature and course of Travel & Tourism demand in nationaleconomies.This regime has obscured the substantial, positive role the industry plays in nationaleconomies and has thwarted business and government attempts to optimize economicprogrammes and policies.
The World Travel & Tourism Council (WTTC) recognized the dearth of crucial Travel& Tourism intelligence from the time of its establishment in 1990 and it published the firstdetailed estimates of world tourism's economic impact that same year.
Since then WTTC has worked to improve its methodologies and to encourage individualcountries to enhance their measurement and understanding of tourism’s impact on theirnational economies. Furthermore, in the spirit of joining forces to enhance worldcomprehension of the role of Travel & Tourism in national economies,WTTC has stronglysupported the programmes of the World Tourism Organization (WTO) to improve tourismstatistics worldwide.
WTTC’S RESEARCHWTTC and its economic consultants/research partners – Oxford Economic Forecasting,(OEF), since 1999, and Global Insight (previously known as DRI•WEFA), from 1990-1999,have developed and published research on the economic contribution of Travel & Tourism tothe world, regional and national economies.
Starting in 1990,WTTC’s research team has been working to develop practical, real-worldmodels to illustrate Travel & Tourism’s economic contribution based on the needs of privatesector leaders, public sector policy-makers and industry researchers, and on the interpretationof the system of national accounts. The research is now firmly anchored in the internationalstandard for tourism satellite accounting that was developed by WTO, OECD and Eurostat,and approved by the United Nations Statistical Commission in 2000. It was launched at theTSA Conference held in Vancouver in May 2001 and published as the Tourism SatelliteAccount: Recommended Methodological Framework (TSA:RMF) in 2001.
Since 1999, WTTC's research has assumed the conceptual framework of the UN-approved standard with a number of discretionary extensions, and it combines the mostsophisticated economic modelling and forecasts available with the most up-to-date, publiclyavailable data to generate a comprehensive implementation of Travel & Tourism satelliteaccounting.
The 2003 update of the WTTC TSA research is the third annual update undertaken forWTTC by OEF. In carrying out the work, OEF has drawn extensively on the methodologydeveloped over the years by WTTC to develop TSAs as operational tools. However, it hasalso taken the opportunity in a number of areas to review and enhance the modellingtechniques, assumptions used and data sources applied.
6

WTTC’S APPROACH TOTSA RESEARCHWTTC HAS ENDEAVOURED TO IMPLEMENT AND PRODUCE THE MOSTCOMPREHENSIVE TSA PROVIDED FOR WITHIN THE TSA:RMF, BYDEVELOPING THE NARROW CONCEPT OF THE ‘TRAVEL & TOURISMINDUSTRY’ IN ADDITION TO THE BROADER CONCEPT OF THE ‘TRAVEL &TOURISM ECONOMY’.
WTTC advocates full implementation of the TSA as defined in the TSA:RMF in order toachieve the highest level of benefits for industry and governments. These include:• A wealth of customer and consumer information on tourism-related purchases (before,
during and after trips – whether domestic or international, imported or exported – as wellas services, durables and non-durables) that has never been identified until now;
• Comprehensive documentation and analysis of the full tourism-product service chain andgovernment’s ability to deliver quality and timely service to visitors;
• Linkages between Travel & Tourism and other sectors of the economy such as agricultureand manufacturing to illustrate the flow-through of spending;
• Complete outlook for public works that benefit visitors and Travel & Tourism companiesin order to leverage public sector plans and priorities for growth;
• Focused opportunities for domestic production, as well as incentives from the publicsector, to aid in the growth of businesses that help alleviate trade balance issues;
• Demand- and supply-side information on employment that allows for human resourceplanning and development.
WTTC has worked towards developing a comprehensive TSA – not because it is eager toexaggerate the size of Travel & Tourism’s impact, but because the information that can begarnered from the exercise by governments and industry is crucial for making intelligent andinformed policy and business decisions. WTTC believes that history will document itspioneering implementation of the simulated TSA as one of the most important turning pointsfor Travel & Tourism’s long overdue economic recognition.
In the WTTC research, no country receives special treatment or favours. WTTC usesinternationally available data sources and the same scope of tourism satellite accounting for allcountries, as well as the same basic assumptions through the same system of models. WTTC’sTSA research utilizes a universal and internally consistent modelling framework and generatesharmonized results and forecasts for more than 160 countries around the world. Details of themethodology used by WTTC/OEF in its TSA research are available on WTTC's website(www.wttc.org).
7

(US$ billion, '000 of Jobs)
Personal Travel & Tourism Business Travel
Government Expenditures (Individual)
Visitor ExportsGovernment Expenditures (Collective)
Capital Investment
Exports(Non-Visitor)
2,019.9 468.1 90.7 492.7 120.0 647.0 421.7
Imports
718.41,130.4
Imports
917.3
Comp. Indirect TaxesOperating Surplus - Subsidies
Depreciation
#N/A #N/A #N/A #N/A
T&T Industry Employment
T&T Economy Employment Property Taxes
67,363.8 191,770.0 #N/A
Personal Income Taxes Indirect Taxes Corporate
Taxes#N/A #N/A #N/A
8
3,342.4
Travel & Tourism Taxes
#N/A
1,222.4 4,259.7
Travel & TourismEconomy GDP
(Direct and Indirect)
Travel & Tourism Economy SupplyT&T Industry
GDP (Indirect)Travel & Tourism
Industry GDP(Direct Only)
Travel & Tourism Industry Supply
3,071.2
Travel & Tourism Economy Supply(Residual)
1,188.5
TSA CONCEPTS& STRUCTURE
Travel & Tourism Consumption
3,071.3
4,259.7
Travel & Tourism Demand

This Travel & Tourism Satellite Accounting research reflectsa comprehensive simulation of the new internationalstandard adopted by the United Nations following the EnzoPaci World Conference on the Economic Impact ofTourism (Nice, France, June 1999), twelve years of modeldevelopment and TSA experience by WTTC and OxfordEconomic Forecasting (OEF), and application of OEF’s latestmacro-economic forecasts.
TSA Economic ConceptsThe Travel & Tourism Satellite Account is based on a‘demand-side’ concept of economic activity, because theindustry does not produce or supply a homogeneous productor service like traditional industries (agriculture, electronics,steel, etc). Instead, Travel & Tourism is an industrial activitydefined by the diverse collection of products (durables andnon-durables) and services (transportation, accommodations,food and beverage, entertainment, government services, etc)that are delivered to visitors. There are two basic aggregatesof demand in the TSA:I Travel & Tourism Consumption represents the value of
products and services that have been consumed byvisitors. It is the basic demand-side aggregate used toconstruct an explicitly defined production-side ‘industry’equivalent for comparison with all other industries.Travel & Tourism Consumption includes:• Personal Travel & Tourism, more formally known as
consumer expenditures, which captures spending byeconomy residents on traditional Travel & Tourismservices (lodging, transportation, entertainment, meals,financial services, etc) and goods (durable andnondurable) used for Travel & Tourism activities.
• Business Travel by government and industry, whichmirrors Personal Travel & Tourism’s spending ongoods and services (transportation, accommodation,meals, entertainment, etc), but represents intermediateinputs used in the course of business or governmentwork.
• Government Expenditures (Individual) by agenciesand departments which provide visitor services such ascultural (art museums), recreational (national park) orclearance (immigration/ customs) to individualvisitors.
• Visitor Exports, which include spending byinternational visitors on goods and services.
II Travel & Tourism Demand builds on Travel & Tourismconsumption to include Travel & Tourism products andservices associated with residual components of finaldemand. It is used to construct a broader ‘economy-wide’ impact of Travel & Tourism. The residualelements of Travel & Tourism demand are:• Government Expenditures (Collective) made by
agencies and departments associated with Travel &Tourism, but generally made on behalf of the
community at large, such as tourism promotion,aviation administration, security services and resortarea sanitation services.
• Capital Investment by Travel & Tourism providers(the private sector) and government agencies (thepublic sector) to provide facilities, equipment andinfrastructure to visitors.
• Exports (Non-Visitor) which include consumer goodssent abroad for ultimate sale to visitors (such asclothing, electronics or petrol) or capital goods sentabroad for use by industry service providers (such asaircraft or cruise ships).
By employing input/output modelling separately tothese two aggregates (Travel & Tourism Consumption andTravel & Tourism Demand), the Satellite Account is able toproduce two different and complementary aggregates ofTravel & Tourism Supply: the Travel & Tourism Industryand the Travel & Tourism Economy.The former capturesthe explicitly defined production-side ‘industry’ equivalent,direct impact only, for comparison with all other industries,while the latter captures the broader ‘economy-wide’ impact,direct and indirect, of Travel & Tourism.Through thisprocess, the Satellite Account is also able to determine thatportion of supply, which it Imports from abroad.
Next, the satellite account breaks down both aggregatesof supply (Industry and Economy) into the direct andindirect impacts of Gross Domestic Product (GDP), the maindescriptor of economic production, as well as the variouscomponents of GDP (Wages & Salaries, Indirect/TransactionTaxes, Operating Surplus, Depreciation and Subsidies).Beyond the regular TSA accounts, a separate analysis is alsoprovided of Personal Income Taxes paid by Travel &Tourism generated employment and Corporate and PropertyTaxes paid by Travel & Tourism companies. Finally, one ofthe most important elements of the Travel & TourismSatellite Account are the Employment results, which cannow be quantified for the basic Travel & Tourism Industryand the broader Travel & Tourism Economy.• T&T Industry Employment generally includes those
jobs with face-to-face contact with visitors (airlines,hotels, car rental, restaurant, retail, entertainment, etc).
• T&T Economy Employment includes T&T IndustryEmployment plus those faceless jobs associated with:•• Industry suppliers (airline caterers, laundry services,
food suppliers, wholesalers, accounting firms, etc).•• Government agencies, manufacturing and
construction of capital goods and exported goods usedin Travel & Tourism.
•• Supplied commodities (steel producers, lumber, oilproduction, etc).
9

In World, Travel & Tourism's economic impact includes:
Total DemandTravel & Tourism is expected to generate US$4,544.2 billion of economic activity (Total Demand) in year 2003, growing (nominal terms) to US$8,939.7 billion by 2013. Travel & Tourism Demand is expected to grow by 4.6% per annum, in real terms, between 2003 and 2013.
Gross Domestic Product - Travel & Tourism IndustryThe T&T Industry is expected to contribute 3.7 per cent to Gross Domestic Product (GDP) in 2003 (US$1,280.4 billion), rising in nominal terms to US$2,279.2 billion (3.8 per cent of total) by 2013.
Gross Domestic Product - Travel & Tourism EconomyThe T&T Economy contribution (percent of total) should rise from 10.2 per cent (US$3,526.9 billion) to 10.8 per cent (US$6,461.4 billion) in this same period.
EmploymentIn 2003, T&T Economy employment is estimated at 194,562,000 jobs or 7.6 per cent of total employment, which is 1 in every 13.2 jobs. By 2013, this should total 247,205,000 jobs, 8.4 per cent of total employment or 1 in every 11.9 jobs. The 67,441,100 T&T Industry jobs account for 2.6 per cent of total employment in 2003 and are forecast at 83,893,600 jobs or 2.8 per cent of the total by 2013.
ExportsTravel & Tourism is expected to generate 11.2 per cent of total exports (US$1,009.9 billion) in 2003, growing (nominal terms) to US$2,519.1 billion (11.4 per cent of total) in 2013.
Capital InvestmentCapital investment is estimated at US$686.0 billion or 9.6 per cent of total investment in year 2003. By 2013, this should reach US$1,308.6 billion or 10.1 per cent of total.
10
TRAVEL & TOURISM'SECONOMIC IMPACTTRAVEL & TOURISM – ENCOMPASSING TRANSPORT, ACCOMMODATION, CATERING, RECREATION AND SERVICES FOR VISITORS – IS ONE OF THE WORLD’S HIGHEST PRIORITY INDUSTRIES AND EMPLOYERS.

2003 2013
World US$ bn % of Tot Growth1 US$ bn % of Tot Growth2
Personal Travel & Tourism 2,135.9 9.9 2.2 3,862.3 10.8 3.7
Business Travel 488.8 --- 0.6 871.7 --- 3.7
Government Expenditures 224.1 3.9 2.8 378.2 4.1 3.0
Capital Investment 686.0 9.6 2.8 1,308.6 10.1 4.3
Visitor Exports 530.9 5.9 3.0 1,332.1 6.0 7.1
Other Exports 479.0 5.3 8.9 1,187.0 5.4 7.2
Travel & Tourism Demand 4,544.2 --- 2.9 8,939.7 --- 4.6
T&T Industry GDP 1,280.4 3.7 1.1 2,279.2 3.8 3.6
T&T Economy GDP 3,526.9 10.2 2.0 6,461.4 10.8 3.9
T&T Industry Employment 67,441.1 2.6 0.1 83,893.6 2.8 2.2
T&T Economy Employment 194,562.0 7.6 1.5 247,205.0 8.4 2.4
12003 Real Growth Adjusted for Inflation (Percent); 22004-2013 Annualized Real Growth Adjusted for Inflation (Percent); '000 of Jobs
2003 2013
World US$ bn % of Tot Growth1 US$ bn % of Tot Growth2
Personal Travel & Tourism 2,136 9.9 2.2 3,862 10.8 3.7
Business Travel 489 --- 0.6 872 --- 3.7
Government Expenditures 224 3.9 2.8 378 4.1 3.0
Capital Investment 686 9.6 2.8 1,309 10.1 4.3
Visitor Exports 531 5.9 3.0 1,332 6.0 7.1
Other Exports 479 5.3 8.9 1,187 5.4 7.2
Travel & Tourism Demand 4,544 --- 2.9 8,940 --- 4.6
T&T Industry GDP 1,280 3.7 1.1 2,279 3.8 3.6
T&T Economy GDP 3,527 10.2 2.0 6,461 10.8 3.9
T&T Industry Employment 67,441.1 2.6 0.1 83,893.6 2.8 2.2
T&T Economy Employment 194,562.0 7.6 1.5 247,205.0 8.4 2.4
12003 Real Growth Adjusted for Inflation (Percent); 22004-2013 Annualized Real Growth Adjusted for Inflation (Percent); '000 of Jobs
11
WORLD ESTIMATES AND FORECASTS
WORLD ESTIMATES AND FORECASTS
WORLD ESTIMATES AND FORECASTS
Pe
rce
nt
of
To
tal
Ca
teg
ory
An
nu
ali
zed
R
ea
l G
row
th

TSA CHARTS
Year 2003 Split Cumulative Real Growth(%)
1990 Constant US$ bn
'000 of Jobs Cumulative Real Growth(%)
T&T Economy Employment as% of Total Employment
Light Blue Bar is T&T Industry Jobs; Light/Dark Blue Combination is T&T Economy Jobs
1990 Constant US$ bn Cumulative Real Growth(%)
T&T Economy GDP as% of Total GDP
Light Blue Bar is T&T Industry GDP; Light/Dark Blue Combination is T&T Economy GDP
12
TRAVEL & TOURISM DEMAND
TRAVEL & TOURISM EMPLOYMENT
TRAVEL & TOURISM GROSS DOMESTIC PRODUCT
Personal T&T
Business T&T
Gov't Expenditures
Capital Investment
Visitor Exports
Other Exports
0.0
50,000.0
100,000.0
150,000.0
200,000.0
250,000.0
1999 2000 2001 2002 2003 2004
0.0
500.0
1,000.0
1,500.0
2,000.0
2,500.0
3,000.0
3,500.0
1999 2000 2001 2002 2003 2004
0
10
20
30
40
50
60
70
80
90
1990 2000 2010
0102030405060708090
100
1990 2000 2010
0
10
20
30
40
50
60
70
1990 2000 2010
3,400.0
3,500.0
3,600.0
3,700.0
3,800.0
3,900.0
4,000.0
4,100.0
4,200.0
1999 2000 2001 2002 2003 2004
9.4%
9.6%
9.8%
10.0%
10.2%
10.4%
10.6%
10.8%
11.0%
1988 1992 1996 2000 2004 2008 2012
0.0%
1.0%
2.0%
3.0%
4.0%
5.0%
6.0%
7.0%
8.0%
9.0%
1988 1992 1996 2000 2004 2008 2012
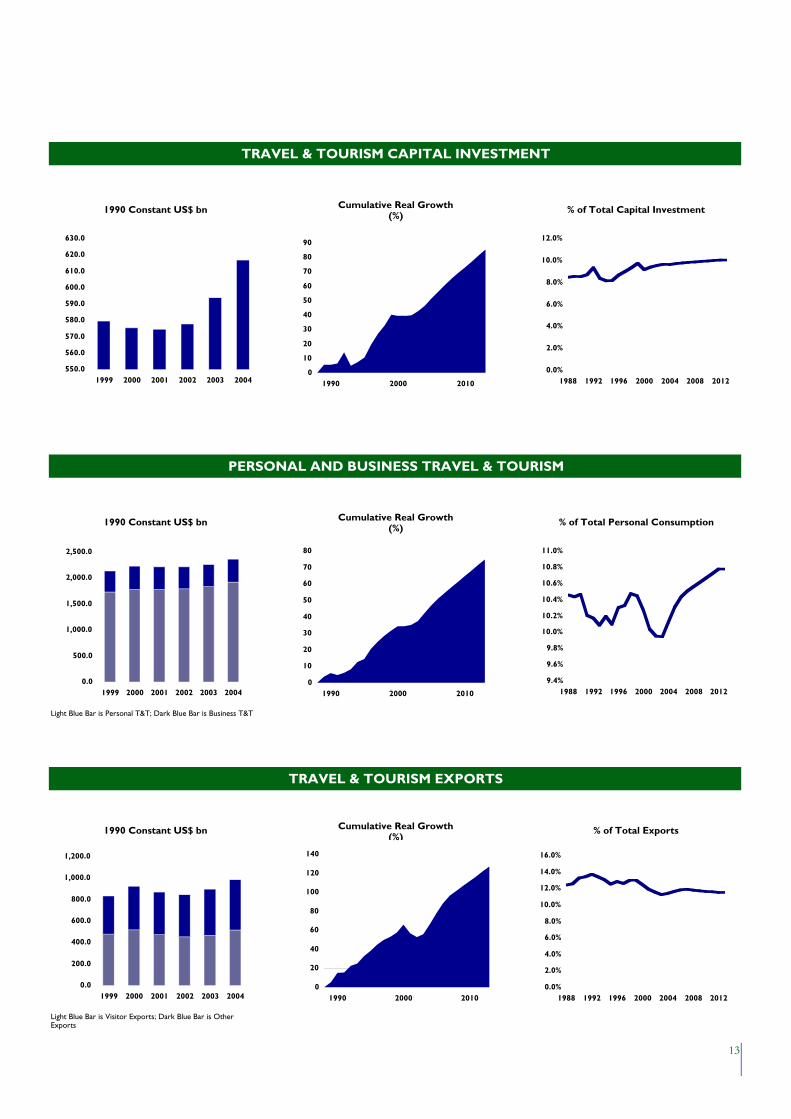
1990 Constant US$ bn Cumulative Real Growth(%)
% of Total Capital Investment
1990 Constant US$ bn Cumulative Real Growth(%)
% of Total Personal Consumption
Light Blue Bar is Personal T&T; Dark Blue Bar is Business T&T
1990 Constant US$ bn Cumulative Real Growth(%)
% of Total Exports
Light Blue Bar is Visitor Exports; Dark Blue Bar is Other Exports
13
TRAVEL & TOURISM CAPITAL INVESTMENT
PERSONAL AND BUSINESS TRAVEL & TOURISM
TRAVEL & TOURISM EXPORTS
550.0
560.0
570.0
580.0
590.0
600.0
610.0
620.0
630.0
1999 2000 2001 2002 2003 2004
0.0
500.0
1,000.0
1,500.0
2,000.0
2,500.0
1999 2000 2001 2002 2003 2004
0.0
200.0
400.0
600.0
800.0
1,000.0
1,200.0
1999 2000 2001 2002 2003 2004
0
10
20
30
40
50
60
70
80
90
1990 2000 2010
0
10
20
30
40
50
60
70
80
1990 2000 2010
0
20
40
60
80
100
120
140
1990 2000 2010
0.0%
2.0%
4.0%
6.0%
8.0%
10.0%
12.0%
1988 1992 1996 2000 2004 2008 2012
9.4%
9.6%
9.8%
10.0%
10.2%
10.4%
10.6%
10.8%
11.0%
1988 1992 1996 2000 2004 2008 2012
0.0%
2.0%
4.0%
6.0%
8.0%
10.0%
12.0%
14.0%
16.0%
1988 1992 1996 2000 2004 2008 2012

RANKING AND RANGE
2003 2013World Absolute Size Relative Size Growth1 Absolute Size Relative Size Growth2
Personal Travel & Tourism na na na na na naBusiness Travel na --- na na --- naGovernment Expenditures na na na na na naCapital Investment na na na na na naVisitor Exports na na na na na naOther Exports na na na na na naTravel & Tourism Demand na --- na na --- naT&T Industry GDP na na na na na naT&T Economy GDP na na na na na naT&T Industry Employment na na na na na naT&T Economy Employment na na na na na na
12003 Real Growth Adjusted for Inflation; 22004-2013 Annualized Real Growth Adjusted for Inflation
Total 161 Countries or 13 Regions (Largest/Highest/Best is Number 1; Smallest/Lowest/Worst is Number 161 or 13)
14
Year 2003 Country Rankings for World within World Countries List
Year 2003 % of Total Estimates for World within World Countries Range
Ten Year (2004-2013) Growth Estimates for World Within World Countries Range
0
20
40
60
80
100
120
Personal Travel
& T
ourism
Governm
entExpenditures
Capital
Investment
Visitor Exports
Other Exports
T&
T IndustryG
DP
T&
T Econom
yG
DP
T&
T Industry
Employm
ent
T&
T Econom
yEm
ployment
TSA Concepts
% o
f To
tal C
ateg
ory
-4
-2
0
2
4
6
8
10
12
14
16
Personal Travel
& T
ourism
Business Travel
Governm
entExpenditures
Capital
Investment
Visitor Exports
Other Exports
Travel &
Tourism
Dem
and
T&
T IndustryG
DP
T&
T Econom
yG
DP
T&
T Industry
Employm
ent
T&
T Econom
yEm
ployment
TSA Concepts
Ann
ualiz
ed %
Rea
l Gro
wth

CONTRIBUTION AND GROWTHTravel & Tourism Industry GDP Contribution and Growth - All Countries
Travel & Tourism Industry Employment Contribution and Growth - All Countries
Travel & Tourism Capital Investment Contribution and Growth - All Countries
World Data Point Indicated in Yellow and Red
15
0%
5%
10%
15%
20%
25%
30%
35%
40%
0% 2% 4% 6% 8% 10% 12%
Annualized Real Growth (2003-2013)
% o
f Tot
al G
DP
(200
3)
0%
5%
10%
15%
20%
25%
30%
35%
40%
45%
-2% 0% 2% 4% 6% 8% 10% 12%
Annualized Real Growth (2003-2013)
% o
f To
tal G
DP
(20
03)
High GrowthLow Contribution
High GrowthHigh Contribution
0%
10%
20%
30%
40%
50%
60%
70%
80%
-4% -2% 0% 2% 4% 6% 8% 10% 12%
Annualized Real Growth (2003-2013)
% o
f To
tal G
DP
(20
03)
Low GrowthLow Contribution
Low GrowthHigh Contribution
High GrowthLow Contribution
High GrowthHigh Contribution
Low GrowthHigh Contribution
Low GrowthLow Contribution
Low GrowthHigh Contribution
High GrowthHigh Contribution
High GrowthLow Contribution
Low GrowthLow Contribution

SATELLITE ACCOUNT TABLES
1998 1999 2000 2001 2002E 2003E 2013P
Travel & Tourism - US$ billion
Personal Travel & Tourism 1,907.88 1,981.47 1,995.74 1,960.84 2,019.91 2,135.86 3,862.27
Business Travel & Tourism 438.69 459.46 493.73 470.14 468.06 488.77 871.72
Corporate 379.38 396.75 427.06 406.97 404.96 422.99 758.98
Government 59.29 62.70 66.68 63.17 63.10 65.77 112.73
Gov't Expenditures - Individual 80.90 85.37 88.10 85.33 90.69 96.24 156.92
Visitor Exports 517.53 533.73 552.34 496.73 492.66 530.91 1,332.08
Travel & Tourism Consumption 2,944.77 3,060.39 3,129.72 3,012.89 3,071.25 3,251.69 6,222.86
Gov't Expenditures - Collective 98.76 104.02 106.45 113.46 119.98 127.92 221.36
Capital Investment 610.46 658.83 641.56 631.93 647.03 685.96 1,308.62
Exports (Non-Visitor) 380.05 392.07 428.43 411.44 421.73 478.95 1,186.99
Travel & Tourism Demand 4,034.08 4,215.38 4,305.50 4,169.40 4,259.71 4,544.24 8,939.73
Travel & Tourism Industry Aggregates (Direct Impact Only)
Employment ('000) 69,334.80 70,370.90 71,091.50 69,212.00 67,363.80 67,441.10 83,893.60
Gross Domestic Product 1,182.94 1,226.10 1,241.42 1,201.29 1,222.38 1,280.35 2,279.20
Travel & Tourism Economy Aggregates (Direct and Indirect Impacts)
Employment ('000) 187,640.00 191,461.00 194,825.00 191,764.00 191,770.00 194,562.00 247,205.00
Gross Domestic Product 3,194.62 3,330.21 3,358.23 3,271.44 3,342.36 3,526.85 6,461.36
Travel & Tourism Accounts as % of National Accounts
Personal Travel & Tourism 10.47 10.45 10.26 10.04 9.95 9.94 10.84
Gov't Expenditures 3.76 3.81 3.83 3.88 3.89 3.90 4.07
Capital Investment 9.34 9.74 9.15 9.39 9.54 9.64 10.08
Exports 12.99 12.98 12.43 11.90 11.53 11.25 11.44
T&T Imports 12.44 12.56 12.01 11.75 11.50 11.24 10.96
Travel & Tourism Industry Aggregates (Direct Impact Only)
Employment 2.87 2.88 2.87 2.76 2.66 2.63 2.85
Gross Domestic Product 3.96 3.95 3.90 3.81 3.74 3.69 3.82
Travel & Tourism Economy Aggregates (Direct and Indirect Impacts)
Employment 7.76 7.83 7.86 7.65 7.57 7.58 8.39
Gross Domestic Product 10.68 10.73 10.54 10.37 10.24 10.18 10.82
Travel & Tourism Real Growth (per annum except 2012 = 10-year annualized)
Personal Travel & Tourism 3.59 3.06 2.77 0.09 0.75 2.20 3.74
Business Travel & Tourism 6.43 4.80 10.45 -3.02 -2.86 0.56 3.68
Gov't Expenditures 2.99 4.29 4.36 3.86 3.76 2.80 3.02
Capital Investment 5.76 7.37 -0.68 -0.17 0.55 2.78 3.46
Visitor Exports 3.63 4.14 8.44 -8.88 -4.25 3.03 7.12
Other Exports 7.37 3.56 13.61 -1.97 -0.66 8.89 5.84
Travel & Tourism Consumption 4.03 3.55 5.01 -2.06 -0.59 2.08 4.33
Travel & Tourism Demand 4.55 4.14 4.89 -1.54 -0.30 2.93 4.65
16

1998 1999 2000 2001 2002E 2003E 2013P
Travel & Tourism Industry Aggregates (Direct Impact Only)
Gross Domestic Product 4.18 3.07 3.49 -1.56 -0.48 1.13 3.59
Employment 5.38 1.49 1.02 -2.64 -2.67 0.11 2.21
Travel & Tourism Economy Aggregates (Direct and Indirect Impact)
Gross Domestic Product 4.55 3.65 3.13 -0.97 -0.02 1.95 3.90
Employment 4.57 2.04 1.76 -1.57 0.00 1.46 2.43
Travel & Tourism - US$ billion
Personal Travel & Tourism 1,907.88 1,981.47 1,995.74 1,960.84 2,019.91 2,135.86 3,862.27
Business Travel & Tourism 438.69 459.46 493.73 470.14 468.06 488.77 871.72
Corporate 379.38 396.75 427.06 406.97 404.96 422.99 758.98
Government 59.29 62.70 66.68 63.17 63.10 65.77 112.73
Gov't Expenditures - Individual 80.90 85.37 88.10 85.33 90.69 96.24 156.92
Visitor Exports 517.53 533.73 552.34 496.73 492.66 530.91 1,332.08
Travel & Tourism Consumption 2,944.77 3,060.39 3,129.72 3,012.89 3,071.25 3,251.69 6,222.86
Gov't Expenditures - Collective 98.76 104.02 106.45 113.46 119.98 127.92 221.36
Capital Investment 610.46 658.83 641.56 631.93 647.03 685.96 1,308.62
Exports (Non-Visitor) 380.05 392.07 428.43 411.44 421.73 478.95 1,186.99
Travel & Tourism Demand 4,034.08 4,215.38 4,305.50 4,169.40 4,259.71 4,544.24 8,939.73
Travel & Tourism Industry Aggregates (Direct Impact Only)
Employment ('000) 69,334.80 70,370.90 71,091.50 69,212.00 67,363.80 67,441.10 83,893.60
Gross Domestic Product 1,182.94 1,226.10 1,241.42 1,201.29 1,222.38 1,280.35 2,279.20
Travel & Tourism Economy Aggregates (Direct and Indirect Impacts)
Employment ('000) 187,640.00 191,461.00 194,825.00 191,764.00 191,770.00 194,562.00 247,205.00
Gross Domestic Product 3,194.62 3,330.21 3,358.23 3,271.44 3,342.36 3,526.85 6,461.36
Travel & Tourism - 1990 Constant US$ billion
Personal Travel & Tourism 1,675.34 1,726.67 1,774.50 1,776.02 1,789.37 1,828.78 2,640.29
Business Travel & Tourism 386.57 405.12 447.46 433.96 421.54 423.89 607.77
Gov't Expenditures - Individual 71.40 74.42 78.79 78.63 81.32 82.89 108.58
Visitor Exports 457.54 476.48 516.71 470.81 450.78 464.44 920.99
Travel & Tourism Consumption 2,590.84 2,682.69 2,817.22 2,759.30 2,742.90 2,799.92 4,277.57
Gov't Expenditures - Collective 85.88 89.61 92.46 99.23 103.22 106.81 146.75
Capital Investment 539.64 579.39 575.46 574.47 577.64 593.72 902.19
Exports (Non-Visitor) 344.03 356.30 404.79 396.82 394.22 429.28 862.39
Travel & Tourism Demand 3,560.31 3,707.88 3,889.19 3,829.42 3,817.79 3,929.54 6,188.83
Gross Domestic Product
Travel & Tourism Industry 1,038.54 1,070.45 1,107.83 1,090.59 1,085.36 1,097.65 1,561.32
Travel & Tourism Economy 2,810.11 2,912.66 3,003.88 2,974.85 2,974.22 3,032.34 4,445.98
17

THE WAR SCENARIOOVERVIEW
IN RECENT MONTHS THE RISK OF A MILITARY CONFLICT WITH IRAQAPPEARS TO HAVE INCREASED. THIS ANALYSIS ASSESSES THE POTENTIALIMPLICATIONS OF A PESSIMISTIC “WAR SCENARIO” AND THE IMPACT ONTRAVEL & TOURISM.
IntroductionWhat happened last time we went to war with Iraq? In August 1990, Iraq invaded Kuwait.This ultimately led to a military engagement, with UN forces led by the US driving the Iraqisout of Kuwait in ‘Operation Desert Storm’, which came to a successful conclusion in February1991.
During the course of those months, oil prices rose sharply, and a number of developedeconomies around the world slipped towards recession. But it is difficult to know how muchof the blame for that recession should be attached the Gulf War. The Gulf War itself had animpact on growth via three main channels:
• Oil prices increased sharply.• Equity prices fell sharply across most developed economies.• Both business and consumer confidence were hit.
Certain sectors suffered particularly badly, including tourism and aviation. Somecommentators believe that the Gulf War tipped the already weak US economy into recession,while others believe that a recession or something close to a recession would have occurred inany case. The truth is it is impossible to identify the confidence effects that came from the GulfWar separately from other adverse effects at the time.
What might be the economic impact this time? The economic impact of renewedhostilities in the Gulf would come through the same three channels as above with a directeffect also from higher US and UK government defence spending to finance the War.
The distinction between the base case scenario presented throughout this TSA report andthis extraordinary War Scenario is essentially the length of time for which oil supplies (andtherefore prices) are disrupted. In the base case, the war is short and contained, with theimpact on long-term oil supplies minimal. In the second, pessimistic case, for whatever reason,oil supplies are substantially reduced into the medium or long term. In either scenario, themacroeconomic impact would almost certainly have a disproportionate effect on tourism andaviation sectors, as was the case during the last Gulf War.
Base Case:Diplomatic solution or victory after a short, contained war
Optimists will argue that a short, contained war could have a positive impact on growth.Whatever the outcome, higher government spending will boost growth in the short run. Asuccessful war would remove an important source of global uncertainty and insecurity (longterm as well as short term), and create new opportunities in a region that has stagnated for overa decade. Conceivably – except in the very short term - it might even reduce oil prices.
Our base case essentially assumes there is little difference in terms of economic growthbetween a diplomatic solution and a contained war, since most of the negative effects expectedin the event of war are already happening - a loss of consumer confidence, investmentdecisions being postponed, and so on. It is possible that war itself would generate a further lossof confidence towards international travel, and therefore that the knock-on effects on Travel &Tourism would be greater than on the economy as a whole. Even here, it is likely that thedifference between no war and a speedy contained war would not be that great.
18

Base Case Assumptions:• Quick, decisive victory or diplomatic solution• No use of weapons of mass destruction (WMD) against US troops, Israel or region• No reduction in OPEC oil production/exports• No challenges to Arab governments in region• New Iraqi government installed and in control• No damage to oil producing capacity in Iraq, or elsewhere
THE WAR SCENARIO:VICTORY, WITH REGIONAL DISRUPTION
Temporary spikes in oil prices have small effects on global growth. But the key longer-termrisk to the global economy deriving from any potential Iraqi conflict is that of sustaineddisruption to oil supplies. In addition, persistently higher oil prices, and an inconclusive orprolonged military engagement, would probably undermine confidence and equity markets bya larger amount and for a longer time than in the contained war scenario. In this scenario, weassume a further hit to consumer spending and investment in all developed economies,particularly marked in the second and third quarters of 2003. We would also expect a rapiddrop in world trade, hitting exports for the leading economies.
Taking all these factors into account, a disruptive war scenario could see both US and UKGDP fall by 1-2%. And some of the vulnerable economies would be in need of emergencyfunds, while even previously robust economies like China could also see growth dented in2003 and 2004. A major casualty could be Japan where the economy stays in recession from2002 to 2004. Among the smaller economies, the IMF and World Bank would need to beactive to help avoid defaults and serious dislocation effects.
In the event of a more disruptive war with some terrorist attacks outside the region, it islikely that the effects on Travel & Tourism will be more severe. Our scenario assumes that theloss of confidence in international travel that could be caused would lead to a further 6-7% lossof visitor exports around the world, rather than the modest recovery we expect in the morebenign case. As a result of this and weaker demand more generally from weaker worldgrowth, the scenario shows would TT industry output falling by 1_% this year before somerecovery next year.
War Scenario Assumptions:• Iraq attacks oil facilities in region, with limited damage but political and economic effects• Iraq attacks Israel, US troops but not with WMD effective enough to trigger a major
response or have highly lethal effects• Unexpected protracted Iraqi military resistance• Limited Israeli intervention in war; rising political unrest in region• Low level civil tensions and clashes in Iraq after military conflict over• Some terrorist attacks on US interests
19

WAR SCENARIO ANALYSISTravel & Tourism Demand
1990 Constant US$ bn TRAVEL & TOURISM DEMAND
In 2003, the World base case TSA expects Travel & Tourism demand to generate real term growth(loss) of 2.9 per cent over 2002 results. In contrast, the War Scenario forecasts a real term growth(loss) of 0.3 per cent for 2003. The difference, -2.7 per cent real loss for World Travel & Tourism, is the additional negative impact associated with a inconclusive or prolonged military engagement. In nominal terms, this War Scenario impact is expected to total US$-120.0 billion. The area in red on the chart indicates the War Scenario loss.
Travel & Tourism Visitor Exports1990 Constant US$ bn TRAVEL & TOURISM EXPORTS
Visitor exports is usually the hardest hit component of Travel & Tourism demand in periods of conflict, terrorism and political uncertainty. The WTTC/OEF base case forecast for World's visitor export growth in 2003 is 3.0 per cent over 2002 results. The War Scenario has restated World's visitor export growth at -6.7 per cent, a loss of -9.8 per cent or US$-50.5 billion vis-à-vis the base case forecast. The area in red on the chart indicates the War Scenario loss.
Travel & Tourism Industry GDP1990 Constant US$ bn TRAVEL & TOURISM GROSS DOMESTIC PRODUCT
A proper analysis of the War Scenario's potential impact must also isolate the likely change to Travel & Tourism Industry GDP, since some elements of T&T Demand such as government expenditures and capital investment tend to lag current events. Plus, history has shown that Travel & Tourism behavior and consumption change during periods of conflict with domestic travel replacing some portion of international travel. For World, Travel & Tourism Industry GDP is expected to decrease in the War Scenario by -2.4 per cent (US$-31.3 billion) vis-à-vis the base case. The area in red on the chart indicates the War Scenario loss.
Travel & Tourism Economy Empl.'000 of Jobs TRAVEL & TOURISM EMPLOYMENT
Finally, Travel & Tourism economy employment, in its broadest sense, is the most comprehensive and personal gauge of war, conflict and terrorism on our industry. In 2003, Travel & Tourism economy employment in World is expected to total 194,562,000 jobs under our base case TSA research (diplomatic solution or victory after a short, contained war). Under the War Scenario (victory with regional disruption) the total jobs forecast is pegged at 191,414,000. The difference, -3,148,000 lost jobs, is the employment impact in World associated with the War Scenario. The area in red on the chart indicates the War Scenario loss.
20
0.00
100.00
200.00
300.00
400.00
500.00
600.00
20
01
20
02
20
03
20
04
3,600.00
3,700.00
3,800.00
3,900.00
4,000.00
4,100.00
4,200.00
20
01
20
02
20
03
20
04
1,020.00
1,040.00
1,060.00
1,080.00
1,100.00
1,120.00
1,140.00
1,160.00
20
01
20
02
20
03
20
04
186,000.0
188,000.0
190,000.0
192,000.0
194,000.0
196,000.0
198,000.0
200,000.0
202,000.0
20
01
20
02
20
03
20
04

-2.7%
-9.8%
-2.4%
-3,148,000
21
….loss in total Travel & Tourism Economy jobs.
THIS ANALYSIS AND RECENT HISTORY HAS SHOWN THAT THE TRAVEL & TOURISM INDUSTRY IS PARTICULARLY VULNERABLE TO SEVERE BUSINESS DOWNTURNS DURING PERIODS OF TERRORISM, POLITICAL UNCERTAINTY AND MILITARY CONFLICT.
WTTC CALLS ON GOVERNMENT LEADERS AROUND THE WORLD TO RECOGNIZE THE SEVERE ECONOMIC AND EMPLOYMENT IMPACT EXPERIENCED BY TRAVEL & TOURSIM AND IMPLEMENT, WHEN NECESSARY AND APPROPRIATE, STRATEGIC POLICY MEASURES TO MITIGATE THE LONG-TERM CONSEQUENCES ON THE INDUSTRY AND NATIONAL ECONOMIES.
….loss in total Travel & Tourism Visitor Exports.
WAR SCENARIO SUMMARY
….loss in total Travel & Tourism Industry GDP.
….loss in total Travel & Tourism Demand.
IN THE EVENT THAT THE SITUATION IN IRAQ ESCALATES INTO AN INCONCLUSIVE OR PROLONGED MILITARY ENGAGEMENT CAUSING DISRUPTION TO OIL SUPPLIES, UNDERMINING CONSUMER CONFIDENCE AND EQUITY MARKETS FOR AN EXTENDED PERIOD OF TIME, WE EXPECT THE 2003 IMPACT ON TRAVEL & TOURISM IN WORLD TO TOTAL:
COMPETITIVENESS MONITORTHE WORLD TRAVEL & TOURISM COMPETITIVENESS MONITOR TRACKS AWIDE RANGE OF INFORMATION, WHICH INDICATES TO WHAT EXTENT ACOUNTRY OFFERS A COMPETITIVE ENVIRONMENT FOR TRAVEL &TOURISM DEVELOPMENT.
The Competitiveness Monitor, launched in 2001, is based on a set of social and economic data that areavailable and comparable across countries. The Monitor is useful for governments, policy makers, Travel& Tourism companies, investors, academics and all other interested parties. The Monitor uses a trafficlight system to indicate the relative positions - rather than the absolute performance - of differentcountries. Green, amber and red lights indicate respectively, above average, average and below averageperformance. White is data not available.
PRICE COMPETITIVENESSTourism Price Competitiveness Index (TPCI) shows the tourism price index across countries where theindex value of '0' shows the least price competitive country and '100' represents the most pricecompetitive country. It is computed using the Hotel Price Index and Purchasing Power Parity Index.
HUMAN TOURISMThe International Human Tourism Index measures the achievement of human development in terms oftourism activity. The Travel & Tourism Sector takes account of people's influence in various areas oftourism activity. It includes indices that looks at the economic impact of Travel & Tourism demand,consumption, exports, imports, balance, personal and business travel and the numbers of arrivals anddepartures.
INFRASTRUCTUREInfrastructure Index shows the level of infrastructure development, combining the Road Index, theSanitation Index and the Water Access Index. The Railway Index is not included because of the limiteddata available. Index value of '0' represents the country with the least infrastructure while the value of'100' is for the country with the highest infrastructure. Source: The World Bank (2001), WorldDevelopment Indicators.
ENVIRONMENTThis indicates governments’ awareness towards environmental aspects of development usingpopulationdensity, CO2 emissions and the ratification of environmental treaties as appropriateindicators.. An index value of '0' shows the least environmentally friendly country and '100' is for themost environmentally friendly country.
TECHNOLOGYThis shows the advances in modern technological systems and infrastructure using data regardingtelephone mainlines, mobile phones, high technology exports and Internet hosts. An index value of '0'shows the least technologically advanced country and '100' is for the most technologically advancedcountry.
HUMAN RESOURCESHuman resources development is an important part of Travel & Tourism. Using data regarding lifeexpectancy, illiteracy rates, education, employment, population, training, skills and gender indicatorsthis shows the competitiveness of the quality of human resources in each country.
OPENNESSThese indices take into account tourism openness using data including: visa requirements, the extent towhich a country is open to international tourism, trade openness and taxes on international trade. Thisinformation has often been ignored in past research. It accords with the economic growth literaturefindings that a country’s openness to trade is a further significant determinant of growth.
SOCIALSocial Development is an important index that indicates a country’s development in social issues usingdata from daily newspapers, personal computers, television sets and total crimes recorded.
22

World Index Value Ranking
Price Competitiveness #N/A #N/A
Human Tourism #N/A #N/A
Infrastructure #N/A #N/A
Environment #N/A #N/A
Technology #N/A #N/A
Human Resources #N/A #N/A
Openness #N/A #N/A
Social #N/A #N/A
Index Value (Least Competitive is 0.0; Most Competitive is 100.0)
Ranking ( Most Competitive is Number 1; Least Competitive is Number 206)
23
Competitiveness Monitor 2003 - World
The relevant data are presented so that comparison across countries can be made. The value of each index ranges from 0 to 100 to show the level of performance of each country relative to other countries. An index value of 0 represents the lowest achievement and 100 shows the highest achievement. The index values of 0 and 100 also correspond to the minimum and maximum values of the actual data, so that the comparison of achievement is a relative comparison.
Per
cent
of T
ota
l Cat
ego
ry
1nnua
lized
Rea
l G
row
th
0
10
20
30
40
50
60
70
80
90
100
PriceC
ompetitiveness
Hum
an Tourism
Infrastructure
Environment
Technology
Hum
anR
esources
Openness
SocialL
east
……
……
……
……
....
....
Mo
stC
om
pet
itiv
e

WTTC/OEF TSA RESEARCHTHE 2003 UPDATETHIS YEAR’S RESEARCH BY OXFORD ECONOMIC FORECASTING ONWTTC’S SIMULATED TOURISM SATELLITE ACCOUNTS REPRESENTS AFURTHER SIGNIFICANT ADVANCE ON OUR EXISTING WORK.
Similar to previous years, data sources have been updated and a review of their use madewhere appropriate. This year however, our review has also enabled us to take a number ofareas of the work a stage further than before. We will be issuing an updated version of ourdetailed methodological paper in due course, setting out as always a full description of howthese simulated TSAs are produced. In the meantime, however, this note records the mostsignificant enhancements made to our existing methodology.
TRAVEL & TOURISM EMPLOYMENT
Perhaps the most obvious revision to last year’s simulated accounts is in our estimates of T&Temployment for those countries where this is based on the ‘pool equation’ approach. Thedetailed methodology paper explains this approach in more detail, but the underlying principleis that for non-OECD countries, where we have not carried out specific country studies, weuse data derived from those countries that have been studied in detail to estimate therelationship between T&T variables we are interested in and other variables for which data orestimates are available for each country. In the case of T&T employment, the most importantdriver of our estimate is T&T GDP, but we have taken the opportunity provided by havingcompleted a number of additional country studies since this relationship was last estimated tolook again at the best way of using the T&T GDP figures to estimate the correspondingemployment.
Clearly we would expect this relationship to depend on how expensive it is to employsomeone – the cheaper labour is, the more workers are likely to be used to generate the sameamount of GDP. This relationship is very clear in the chart below, which plots these data forthe non-OECD countries, where detailed country studies have been carried out by WTTCand its partners.
B
B
B
B
B
B
B
B
BB
0
500
1000
1500
2000
2500
3000
3500
4000
4500
5000
0 500 1000 1500
Lab
ou
r C
ost
s (G
DP
per
Em
plo
yee)
199
5 U
S$
'000
T&T Employment ('000) per US$ bn Output
T&T Employment and Labour Costs
However, the same is true of other industries as well, and if we look at the number ofworkers used to generate a given level of output in Travel & Tourism relative to the sameconcept for the economy as a whole, a rather different picture emerges. The chart belowcompares this relativity with an indicator of how ‘advanced’ an economy is, measured here byGDP per employee.
24

B B
B
B
B
B
B
B
0
5
10
15
20
0.7 0.8 0.9 1.0 1.1 1.2 1.3
Lab
ou
r C
ost
s (G
DP
per
Em
plo
yee)
199
5 U
S$
'000
T&T Employment Share/GDP Share
Relative T&T Productivty and GDP
It is clear from these figures that for poorer economies, Travel & Tourism is relativelyproductive compared with the average across the whole economy (though clearly we wouldnot generally expect it to be productive relative to Travel & Tourism in richer economies,since cheaper labour will encourage relatively labour-intensive ways of delivering services).Conversely, for richer economies, Travel & Tourism has relatively lower productivity than theaverage across the whole economy. This is the relationship we have used to construct ourrevised estimates of T&T employment across different economies where we do not have moredetailed results on which to rely.
Business Travel
This year we have added additional information from balance of payments (BoP) statistics toenable us to refine our estimates of how much businesses spend on hotels. We continue to usedata on the number of hotel rooms, estimated room rates and occupancy rates, and surveys ofthe business share of the market, to estimate overall business spending in a country. As usual,new data has led to some of these assumptions being updated/amended, and we have lookedagain at estimated room rates to ensure they look consistent across countries. But the mainmethodological change we have made this year has been to incorporate BoP data to improveestimates of the extent to which spending by an individual country’s businesses differs fromspending by businesses on hotels within the individual country. Countries with detailed BoPstatistics for services record imports and exports of travel and the business share of these, so thatthe net exports of travel attributable to businesses can be added to the estimated spendingwithin the country or vice versa. Where less detailed BoP statistics exist we have, as usual, hadto estimate certain elements of this calculation.
T&T Trade in Goods
Estimates of T&T trade in goods continue to be based on a detailed commodity breakdown oftrade – as described in the main methodological report, we use the compilation of UnitedNations data put together by Statistics Canada to split imports and exports of goods into 18categories with varying importance for Travel & Tourism, and apply estimated T&T shares toeach of these. So, for example, the majority of imports and exports of aircraft are for T&Tpurposes, while imports and exports of cars are less T&T intensive since the majority of cartravel is for other purposes than business Travel & Tourism. This year we have enhanced ouruse of these T&T shares when looking at imports, to reflect how important overall T&Tdemand is within an economy. So for countries where tourism accounts for a large part ofaggregate demand in the economy, T&T is also assumed to account for a larger share of, forexample, imports of clothing and footwear than for an economy where T&T is of only minorimportance. To an extent, this differentiation is already allowed for in the use of thecommodity breakdown of trade combined with different shares for different commodities.But this year’s enhancement reflects the fact that in practice the commodity breakdown is notsufficiently detailed to pick up all the variation in import shares likely to result from thediffering importance of T&T demand in different countries.
25

T&T Trade in Services
Any changes here are primarily a result of revised data sources. World Tourism Organizationdata on foreign tourism spending and receipts no longer covers spending on fares, whether thisconsists of a country’s residents buying air tickets on foreign airlines or foreign visitors buyingtickets from domestic airlines. Instead, the WTO data focus on residents’ spending on goodsand services while abroad, and foreign visitors’ spending on goods and services within thecountry in question. We continue to use these data from the WTO, but we havesupplemented them with data on fares spending from the detailed balance of payments statisticscollated by the IMF. In the majority of cases, this allows us to update the series previouslycollected by the WTO, but in some cases the IMF historical data does not appear consistentwith the data we previously used from the WTO. In these cases, our preference has been,wherever possible, to use IMF BoP statistics for the historical data as well, since this is thesource we expect at this stage to be using for these series in the future.
T&T Investment
Our primary methodology for estimating T&T investment for those non-OECD countrieswhere we have not carried out specific country studies is, as for employment, based on a ‘poolequation’ linking T&T investment to overall investment in the economy and the importanceof tourism for the economy as a whole. This has not changed in our most recent work.However, our detailed study of the trade data has revealed one enhancement to this where wehave been able to incorporate specific data. This is derived from the data for imports ofaircraft, which generally have a high T&T content. Since the proportion of imported aircraft,which is assessed to be for T&T use, is deducted from T&T demand in arriving at ourestimates of T&T GDP, it is clearly appropriate to ensure the corresponding demand for thoseimports is also included in our estimate of T&T demand, and it is equally clear in the specificcase of aircraft that that demand is for investment. We have therefore improved our estimatesof T&T investment by adding a specific element to the pool equation estimates to reflect theT&T element of imported aircraft.
Coverage
The only changes to the coverage of the results this year are that we have added Croatia to thecountries included, as a result of a specific study carried out in the autumn, and that we haveredefined the local currency results for all the countries in the eurozone to reflect their use ofthe euro rather than individual local currencies. This latter change affects the level of some ofour estimates in constant 1990 dollars since the Eurostat national accounts data for thesecountries is calculated in 1995 prices and not all currencies moved against the dollar at thesame rate as the euro between 1990 and 1995.
26

2003/2002 VARIANCE CHARTSPersonal Travel & Tourism
1990 Constant US$ bnPersonal Travel & Tourism
% of Total ConsumptionBusiness Travel & Tourism
1990 Constant US$ bn
Travel & Tourism Govt Expenditures1990 Constant US$ bn
Travel & Tourism Govt Expenditures% of Total Govt Expenditures
Travel & Tourism Visitor Exports1990 Constant US$ bn
Travel & Tourism Exports% of Total Exports
Travel & Tourism Consumption1990 Constant US$ bn
Travel & Tourism Capital Investment1990 Constant US$ bn
Travel & Tourism Capital Investment% of Total Capital Investment
Travel & Tourism Demand1990 Constant US$ bn
OEF's Year 2003 Estimates OEF's Year 2002 EstimatesSolid Dark Blue Dashed Light Blue
27
0.00
500.00
1,000.00
1,500.00
2,000.00
2,500.00
3,000.00
1988
1990
1992
1994
1996
1998
2000
2002
2004
2006
2008
2010
2012
9.4
9.6
9.8
10.0
10.2
10.4
10.6
10.8
11.0
1988
1990
1992
1994
1996
1998
2000
2002
2004
2006
2008
2010
2012
0.00
100.00
200.00
300.00
400.00
500.00
600.00
700.00
1988
1990
1992
1994
1996
1998
2000
2002
2004
2006
2008
2010
2012
0.00
50.00
100.00
150.00
200.00
250.00
300.00
1988
1990
1992
1994
1996
1998
2000
2002
2004
2006
2008
2010
2012
3.2
3.3
3.4
3.5
3.6
3.7
3.8
3.9
4.0
4.1
4.2
1988
1990
1992
1994
1996
1998
2000
2002
2004
2006
2008
2010
2012
0.00
1,000.00
2,000.00
3,000.00
4,000.00
5,000.00
6,000.00
7,000.00
1988
1990
1992
1994
1996
1998
2000
2002
2004
2006
2008
2010
2012
0.0
2.0
4.0
6.0
8.0
10.0
12.0
1988
1990
1992
1994
1996
1998
2000
2002
2004
2006
2008
2010
2012
0.00
100.00
200.00
300.00
400.00
500.00
600.00
700.00
800.00
900.00
1,000.00
1988
1990
1992
1994
1996
1998
2000
2002
2004
2006
2008
2010
2012
0.00
100.00
200.00
300.00
400.00
500.00
600.00
700.00
800.00
900.00
1,000.00
1988
1990
1992
1994
1996
1998
2000
2002
2004
2006
2008
2010
2012
0.0
2.0
4.0
6.0
8.0
10.0
12.0
14.0
16.0
1988
1990
1992
1994
1996
1998
2000
2002
2004
2006
2008
2010
2012
0.00
500.00
1,000.00
1,500.00
2,000.00
2,500.00
3,000.00
3,500.00
4,000.00
4,500.00
1988
1990
1992
1994
1996
1998
2000
2002
2004
2006
2008
2010
2012

Travel & Tourism Industry GDP1990 Constant US$ bn
Travel & Tourism Industry GDP% of Total GDP
Travel & Tourism Economy GDP1990 Constant US$ bn
Travel & Tourism Economy GDP% of Total GDP
Travel & Tourism Industry Empl.'000 of Jobs
Travel & Tourism Industry Empl.% of Total Employment
Travel & Tourism Economy Empl.'000 of Jobs
Travel & Tourism Economy Empl.% of Total Employment
OEF's Year 2003 Estimates OEF's Year 2002 EstimatesSolid Dark Blue Dashed Light Blue
28
0.00
200.00
400.00
600.00
800.00
1,000.00
1,200.00
1,400.00
1,600.00
1,800.00
1988
1990
1992
1994
1996
1998
2000
2002
2004
2006
2008
2010
2012
0.00
500.00
1,000.00
1,500.00
2,000.00
2,500.00
3,000.00
3,500.00
4,000.00
4,500.00
5,000.00
1988
1990
1992
1994
1996
1998
2000
2002
2004
2006
2008
2010
2012
3.3
3.4
3.5
3.6
3.7
3.8
3.9
4.0
1988
1990
1992
1994
1996
1998
2000
2002
2004
2006
2008
2010
2012
0.0
0.5
1.0
1.5
2.0
2.5
3.0
3.5
1988
1990
1992
1994
1996
1998
2000
2002
2004
2006
2008
2010
2012
0.0
50,000.0
100,000.0
150,000.0
200,000.0
250,000.0
300,000.0
1988
1990
1992
1994
1996
1998
2000
2002
2004
2006
2008
2010
2012
0.0
1.0
2.0
3.0
4.0
5.0
6.0
7.0
8.0
9.0
1988
1990
1992
1994
1996
1998
2000
2002
2004
2006
2008
2010
2012
0.00
10,000.00
20,000.00
30,000.00
40,000.00
50,000.00
60,000.00
70,000.00
80,000.00
90,000.00
100,000.00
1988
1990
1992
1994
1996
1998
2000
2002
2004
2006
2008
2010
2012
9.00
9.20
9.40
9.60
9.80
10.00
10.20
10.40
10.60
10.80
11.00
1988
1990
1992
1994
1996
1998
2000
2002
2004
2006
2008
2010
2012

WTTC would like to express its sincere appreciation to the entire research and economics teamassociated with this 2003 Tourism Satellite Accounting Research
Oxford Economic Forecasting•
Adrian Cooper, Managing DirectorAlan Wilson, Director of Consulting ServicesErik Britton, Director of Consulting Services
Simon Knapp, Senior EconomistKeith Edmonds, Senior Economist
The OEF Macroeconomic Forecasting and Technical Teams
World Travel & Tourism Council•
Richard Miller, Vice President, Research and Economics