Embed Size (px)
Citation preview
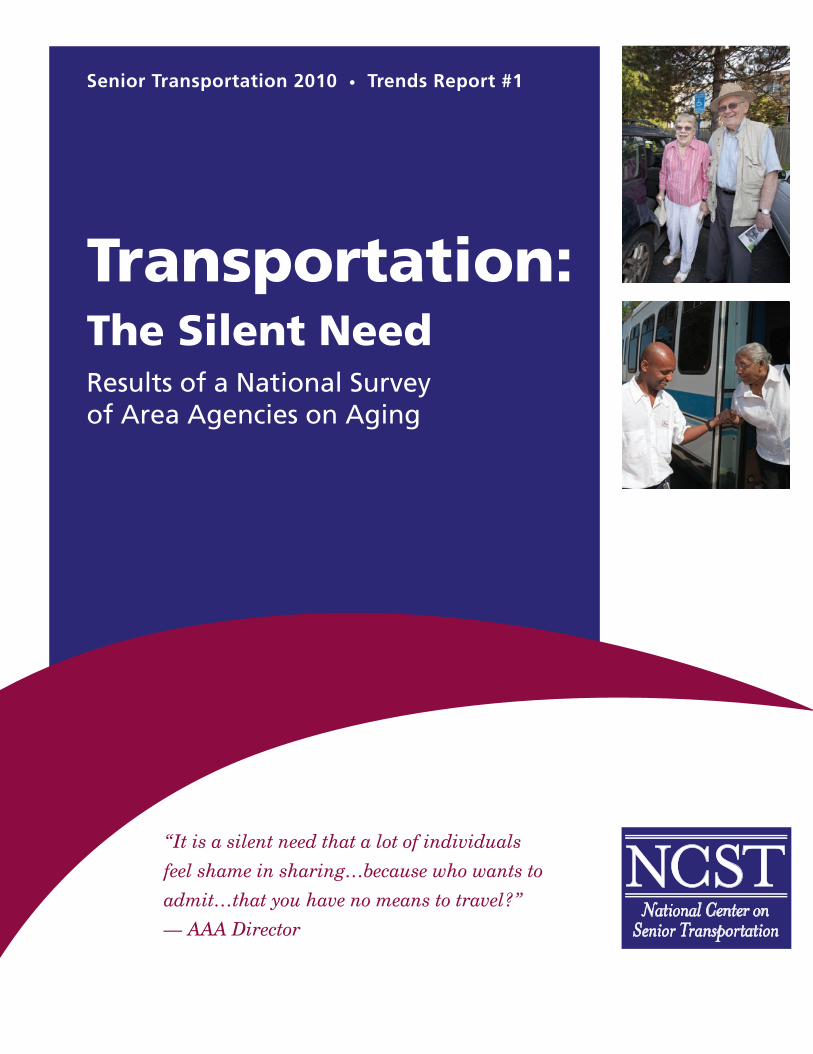
Senior Transportation 2010 • Trends Report #1
Results of a National Survey of Area Agencies on Aging
Transportation:The Silent Need
“It is a silent need that a lot of individuals
feel shame in sharing…because who wants to
admit…that you have no means to travel?”
— AAA Director

Senior Transportation 2010 • Trends Report # 1
Results of a National Survey of Area Agencies on Aging
TransportationThe Silent Need National Center on Senior Transportation (NCST)
Based in Washington, D.C., the National Center on Senior Transportation is administered by Easter Seals, Inc. in partnership with the National Associa-tion of Area Agencies on Aging through a cooperative agreement with the U.S. Department of Transportation, Federal Transit Administration, and with guidance from the U.S. Department of Health and Human Services, Administra-tion on Aging. The contents of this publication are solely the responsibility of the authors and do not necessarily represent the official views of the Federal Transit Administration.
NCST Trends Reports 2010This document is the first in a series of Trends Reports, to be developed by the National Center on Senior Transportation, focusing on current challenges and new developments that impact senior mobility. Subsequent reports will address senior transportation in Indian country, transportation for older diverse populations, and senior mobility and livable communities.
AcknowledgementsHeartfelt thanks are extended to the directors and staff of the 367 Area Agencies on Aging (AAAs) that responded to the survey, many of whom not only answered the questions but generously shared their thoughts, experi-ences and frustrations. All of the quotes that appear in this report are taken from the comments AAAs included with their survey responses.

1
Transportation: The Silent NeedResults of a National Survey of Area Agencies on Aging
PrefaceThe work of the National Center on Senior Transportation (NCST) is founded on the premise that a more accessible and better coordinated transportation system will provide a wealth of benefits to our growing aging population. According to the Fourth National Survey (2008) conducted by the U.S. Administration on Aging, almost half (47.9%) of transportation users served by the Aging Services Network relied on transportation services under the Older American Act for almost all of their rides; 45.6% of the riders described themselves as “mobility impaired” (i.e., have no car, do not drive or do not live within ¾ mile of a fixed route stop). Given their extensive present commitment to senior transporta-tion and an expanding senior population over the next decade, the network’s involvement in transportation will inevitably increase.
Area Agencies on Aging (AAAs) are community agencies, charged under the Older Americans Act with representing the interests of older people and creating a service infrastructure to address their needs. With their connections to seniors and caregivers and role as a trusted source of information on a wide spectrum of aging services, AAAs are key informants about the state of senior trans-portation at the community level. As advocates for older persons, AAAs also have a keen interest in ensuring that older people have access to a range of transportation services responsive to individual needs.
In keeping with its mission to increase the availability of senior transportation options and support seniors’ ability to live indepen-dently, the NCST is currently engaged in outreach efforts targeted to the Aging Services Network. This document represents the first step in that effort and details the results of a nationwide survey of the AAAs, conducted by the NCST during the late summer/fall of 2009.* The report provides baseline information about AAAs’ involvement in transportation advocacy, planning and service delivery, as well as information about the availability of senior transportation nationwide.
February 2010
“It is a silent need that a lot of individuals feel shame in sharing…because who wants to admit…that you have no means to travel?”
* The NCST is also gathering information from the national network of Title VI Services Programs, which serve Native American seniors, and will release a separate report on the findings later this year. Information will also be gathered from state agencies on aging and aging network transportation providers as part of the Aging Network Initiative.
2
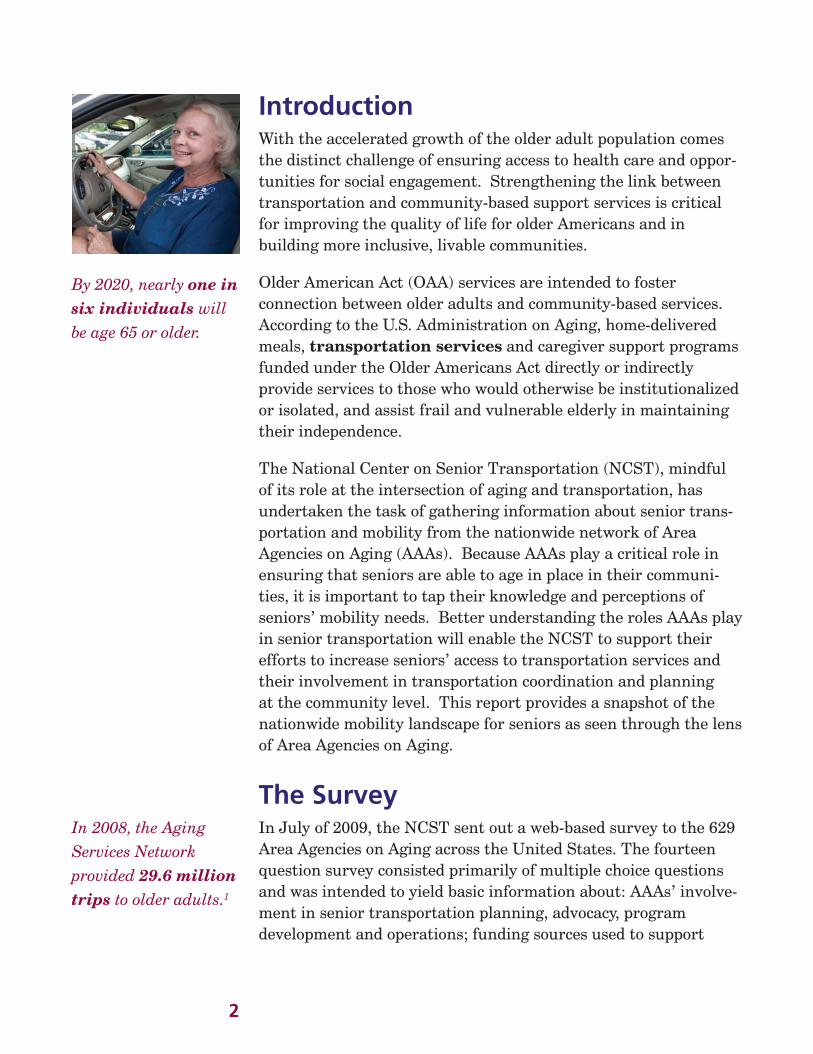
IntroductionWith the accelerated growth of the older adult population comes the distinct challenge of ensuring access to health care and oppor-tunities for social engagement. Strengthening the link between transportation and community-based support services is critical for improving the quality of life for older Americans and in building more inclusive, livable communities.
Older American Act (OAA) services are intended to foster connection between older adults and community-based services. According to the U.S. Administration on Aging, home-delivered meals, transportation services and caregiver support programs funded under the Older Americans Act directly or indirectly provide services to those who would otherwise be institutionalized or isolated, and assist frail and vulnerable elderly in maintaining their independence.
The National Center on Senior Transportation (NCST), mindful of its role at the intersection of aging and transportation, has undertaken the task of gathering information about senior trans-portation and mobility from the nationwide network of Area Agencies on Aging (AAAs). Because AAAs play a critical role in ensuring that seniors are able to age in place in their communi-ties, it is important to tap their knowledge and perceptions of seniors’ mobility needs. Better understanding the roles AAAs play in senior transportation will enable the NCST to support their efforts to increase seniors’ access to transportation services and their involvement in transportation coordination and planning at the community level. This report provides a snapshot of the nationwide mobility landscape for seniors as seen through the lens of Area Agencies on Aging.
The SurveyIn July of 2009, the NCST sent out a web-based survey to the 629 Area Agencies on Aging across the United States. The fourteen question survey consisted primarily of multiple choice questions and was intended to yield basic information about: AAAs’ involve-ment in senior transportation planning, advocacy, program development and operations; funding sources used to support
By 2020, nearly one in six individuals will be age 65 or older.
In 2008, the Aging Services Network provided 29.6 million trips to older adults.1
3
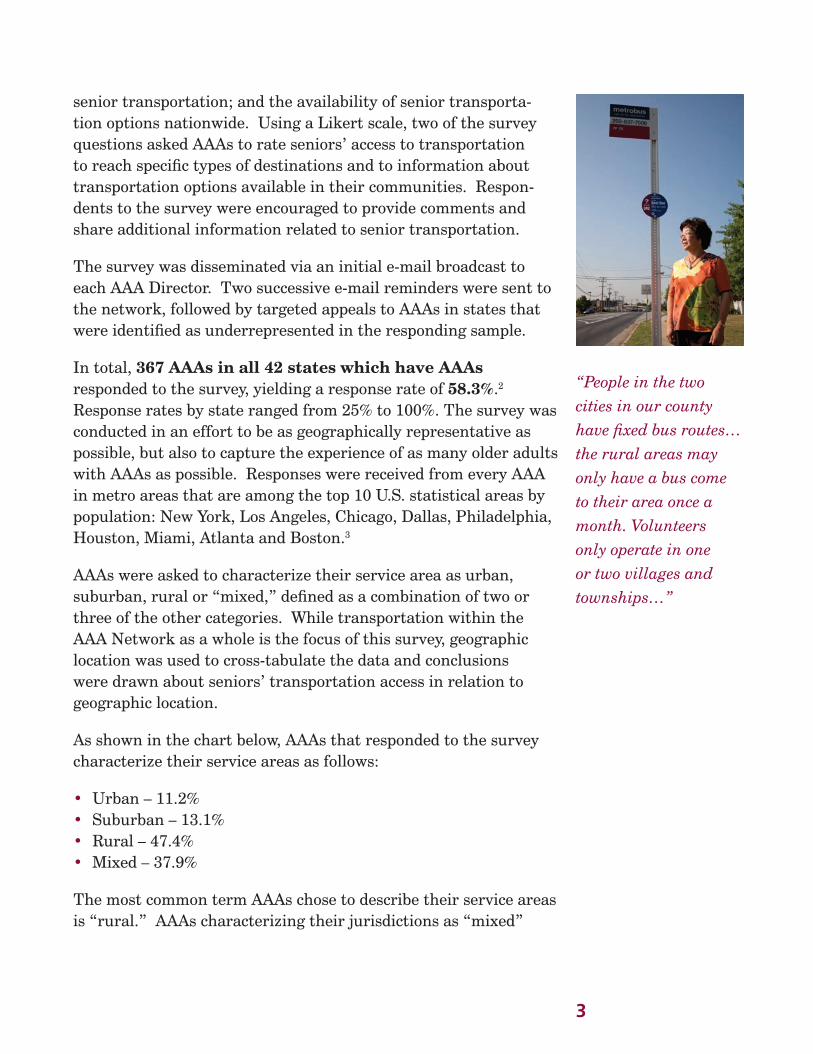
“People in the two cities in our county have fixed bus routes… the rural areas may only have a bus come to their area once a month. Volunteers only operate in one or two villages and townships…”
senior transportation; and the availability of senior transporta-tion options nationwide. Using a Likert scale, two of the survey questions asked AAAs to rate seniors’ access to transportation to reach specific types of destinations and to information about transportation options available in their communities. Respon-dents to the survey were encouraged to provide comments and share additional information related to senior transportation.
The survey was disseminated via an initial e-mail broadcast to each AAA Director. Two successive e-mail reminders were sent to the network, followed by targeted appeals to AAAs in states that were identified as underrepresented in the responding sample.
In total, 367 AAAs in all 42 states which have AAAs responded to the survey, yielding a response rate of 58.3%.2 Response rates by state ranged from 25% to 100%. The survey was conducted in an effort to be as geographically representative as possible, but also to capture the experience of as many older adults with AAAs as possible. Responses were received from every AAA in metro areas that are among the top 10 U.S. statistical areas by population: New York, Los Angeles, Chicago, Dallas, Philadelphia, Houston, Miami, Atlanta and Boston.3
AAAs were asked to characterize their service area as urban, suburban, rural or “mixed,” defined as a combination of two or three of the other categories. While transportation within the AAA Network as a whole is the focus of this survey, geographic location was used to cross-tabulate the data and conclusions were drawn about seniors’ transportation access in relation to geographic location.
As shown in the chart below, AAAs that responded to the survey characterize their service areas as follows:
Urban – 11.2%•Suburban – 13.1%•Rural – 47.4%•Mixed – 37.9%•
The most common term AAAs chose to describe their service areas is “rural.” AAAs characterizing their jurisdictions as “mixed”

4
“Transportation is a major focus of our AAA since every needs assessment that has been completed in the past 30 years indicates that transportation is the service that older persons most frequently reference as the one service that best supports their ability to remain independent and in the community.”
typically face a range of challenges directly related to the dispa-rate geographic and demographic characteristics found within the service area.
Which term best describes the characteristics of your service area?
50.0%
45.0%
40.0%
35.0%
30.0%
25.0%
20.0%
15.0%
10.0%
5.0%
0
Urban Suburban Rural Mixed
AAA Roles in Senior TransportationAs established and funded by the Older Americans Act, Area Agencies on Aging (AAAs) are designated by State Agencies on Aging to address the needs and concerns of older Americans aged 60 and older and their family caregivers. AAAs plan, coordinate and advocate for the develop-ment of a comprehensive service delivery system to meet the short and long-term needs of older persons in their specific geographic planning and service area; prepare multi-year service plans, which identify older persons’ needs, existing services and service gaps; and set objectives and priorities for addressing those needs.4
Primary roles of AAAs in transportationSurvey responses reveal that Area Agencies on Aging play a variety of roles to meet the transportation needs of seniors. The four most frequent responses to the question “What role does your organization play in senior transportation?” were:
Advocate for transportation services for seniors in your 1. community - 86.1%Address transportation in AAA Area Plan - 2. 85.6%

5
Provide information, education and assistance on transporta-3. tion needs - 82.3%Identify gaps/unmet need in transportation services - 4. 81.5%
The roles of advocate, planner, information/referral provider and needs assessor are interdependent and often overlap. These roles are also complementary to the broad respon-sibilities of AAAs as described above.
AAAs as service providersAAAs provide transportation services, though primarily through contracting with service providers (75.7%) rather than directly providing transportation services themselves (only 27.8%). Again, this result reflects the work AAAs do in their communi-ties to support and work closely with already existing networks of service providers and to provide services directly only when other providers are not available to meet community need.
AAAs’ involvement in coordinationThe Aging Services Network has a long history of developing partnerships and working collaboratively with other community organizations on behalf of seniors. From this perspective, AAAs approach transportation coordination as an opportunity to assure that transportation services are readily available for older people. Beyond the roles discussed above, AAAs conduct needs assess-ments that address transportation (71.4%), ensure that seniors and other consumers are at the table when transportation issues or policy is being discussed (62.7%), and assume a leadership role in senior transportation in their communities (52%). These activ-ities lead naturally to AAAs’ engagement in transportation coordi-nation. The survey found that AAAs are significantly involved in development of the coordinated plan for public transit and human services transportation (63.2%) and other efforts to coordinate human services and aging transportation (61%).
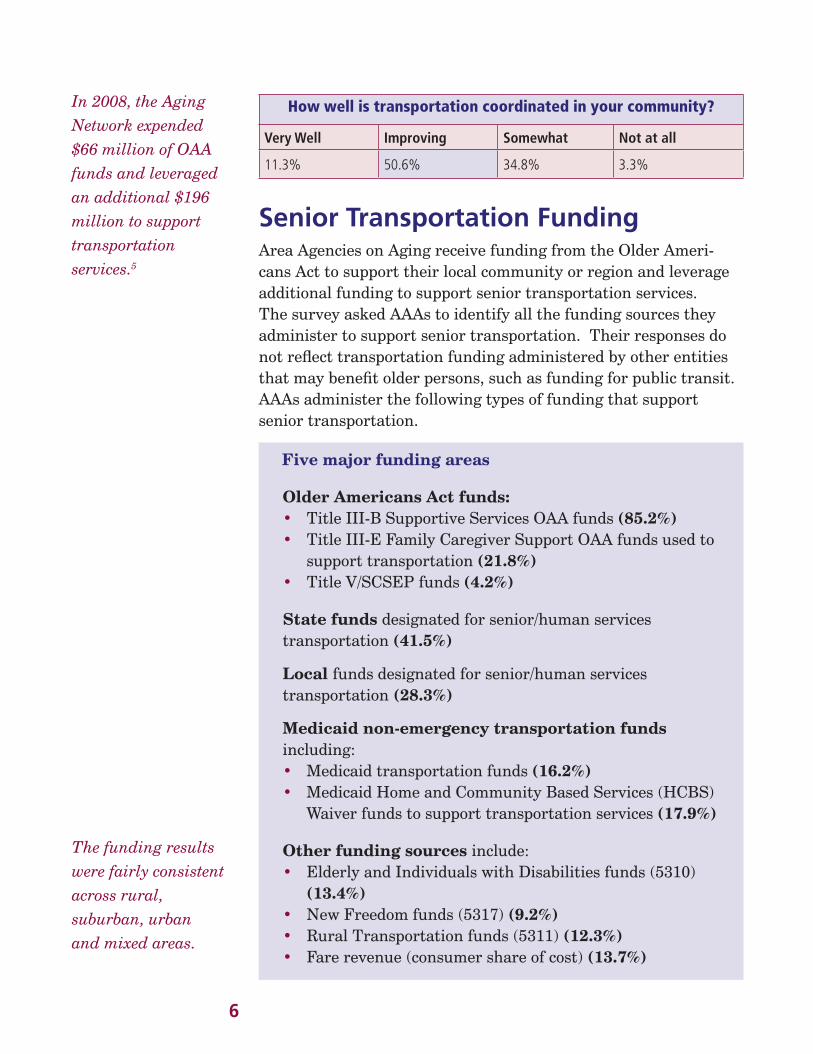
When asked how well transportation is coordinated in their communities, AAAs overall reported mixed results. While we can be encouraged that slightly more than half (50.6%) of AAAs find that coordination is improving, a small percentage (3.3%) still find transportation to be not at all coordinated.
“A group of transportation providers has been meeting… to better communicate between members so that rides can be coordinated, access can be simplified, and needs can be met….”
6
How well is transportation coordinated in your community?
Very Well Improving Somewhat Not at all
11.3% 50.6% 34.8% 3.3%
Senior Transportation Funding Area Agencies on Aging receive funding from the Older Ameri-cans Act to support their local community or region and leverage additional funding to support senior transportation services. The survey asked AAAs to identify all the funding sources they administer to support senior transportation. Their responses do not reflect transportation funding administered by other entities that may benefit older persons, such as funding for public transit. AAAs administer the following types of funding that support senior transportation.
Five major funding areas
Older Americans Act funds:Title III-B Supportive Services OAA funds • (85.2%)Title III-E Family Caregiver Support OAA funds used to •support transportation (21.8%)Title V/SCSEP funds • (4.2%)
State funds designated for senior/human services transportation (41.5%)
Local funds designated for senior/human services transportation (28.3%)
Medicaid non-emergency transportation funds including:
Medicaid transportation funds • (16.2%)Medicaid Home and Community Based Services (HCBS) •Waiver funds to support transportation services (17.9%)
Other funding sources include:Elderly and Individuals with Disabilities funds (5310) •(13.4%)New Freedom funds (5317) • (9.2%)Rural Transportation funds (5311) • (12.3%)Fare revenue (consumer share of cost) • (13.7%)
In 2008, the Aging Network expended $66 million of OAA funds and leveraged an additional $196 million to support transportation services.5
The funding results were fairly consistent across rural, suburban, urban and mixed areas.
7
“While we have representation from many of the types of transportation options listed…, the number of providers and the services provided are limited.”
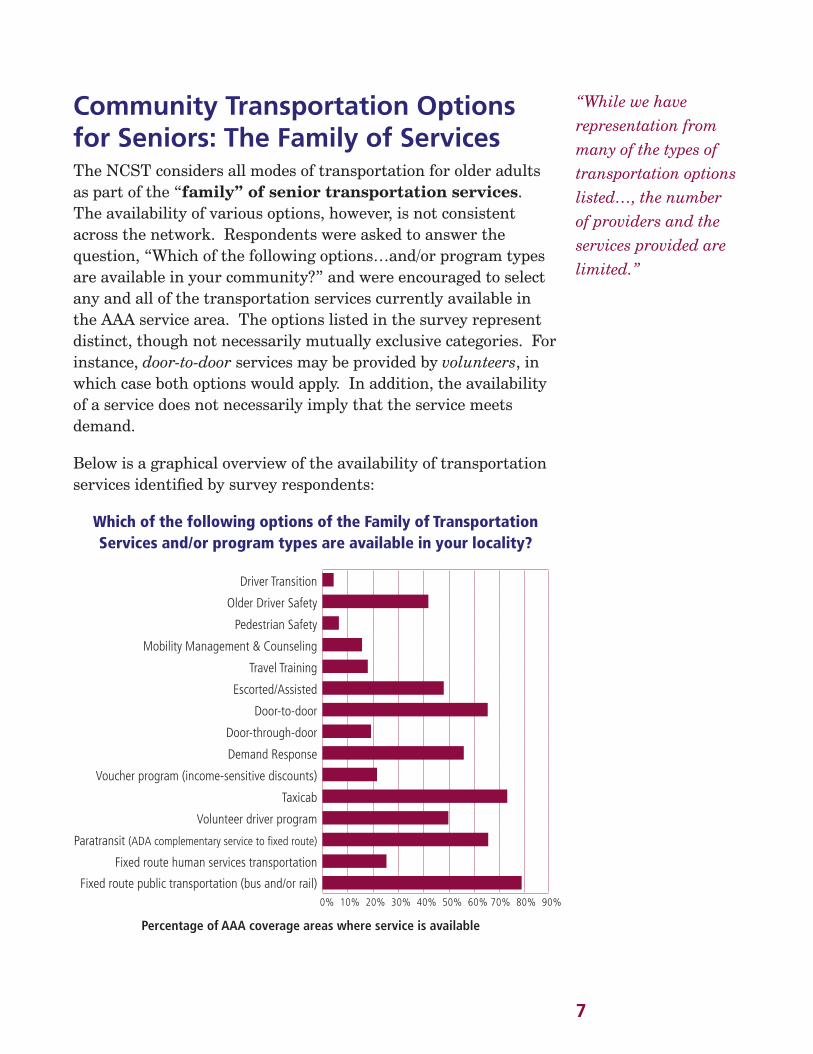
Community Transportation Options for Seniors: The Family of ServicesThe NCST considers all modes of transportation for older adults as part of the “family” of senior transportation services. The availability of various options, however, is not consistent across the network. Respondents were asked to answer the question, “Which of the following options…and/or program types are available in your community?” and were encouraged to select any and all of the transportation services currently available in the AAA service area. The options listed in the survey represent distinct, though not necessarily mutually exclusive categories. For instance, door-to-door services may be provided by volunteers, in which case both options would apply. In addition, the availability of a service does not necessarily imply that the service meets demand.
Below is a graphical overview of the availability of transportation services identified by survey respondents:
Which of the following options of the Family of Transportation Services and/or program types are available in your locality?
Driver Transition
Older Driver Safety
Pedestrian Safety
Mobility Management & Counseling
Travel Training
Escorted/Assisted
Door-to-door
Door-through-door
Demand Response
Voucher program (income-sensitive discounts)
Taxicab
Volunteer driver program
Paratransit (ADA complementary service to fixed route)
Fixed route human services transportation
Fixed route public transportation (bus and/or rail)
Percentage of AAA coverage areas where service is available
0% 10% 20% 30% 40% 50% 60% 70% 80% 90%

8
As a required complement to public transit, paratransit providers use smaller vehicles such as minivans or small buses to provide accessible service for those with disabilities.
Fixed route transportation and paratransit Public transit agencies typically provide bus and rail services along established routes with set schedules and no reservations required. Some human services programs provide limited fixed route service following a regular schedule, such as daily trips to and from the senior center or weekly trips to the grocery store or shopping mall. As a required complement to public transit, paratransit providers use smaller vehicles such as minivans or small buses to provide accessible service for persons with disabili-ties, offering curb-to-curb or door-to-door service. All three options may offer reduced fares to senior citizens or operate on a donation basis.
Seventy-nine percent (79%) of AAAs reported that fixed route public transportation is available in their service areas, but only 26% reported the availability of fixed route human services. Paratransit, which must be offered as an alternative service to people with disabilities of all ages by public transit agencies, was noted as being available by 66.3% of responding AAAs.
Prevalence of fixed route public transportation
100.0%
90.0%
80.0%
70.0%
60.0%
50.0%
40.0%
30.0%
20.0%
10.0%
0
Urban Suburban Rural Mixed
Percentage of AAA coverage areas where service is available
Fixed route public transportation is most readily available in suburban (97.9%), urban (95%) and mixed (90.3%) areas, but not as common (62.4%) in rural areas. As expected, complementary paratransit is distributed similarly: 95.7% in the suburbs, 92.5% in urban areas, 84.2% in mixed, and only 40.5% in rural America.
9
As noted above, fixed route human services transportation is avail-able on a limited basis nationwide. While somewhat more likely to be found in urban areas (35%), the availability of this option in mixed (26.6%), suburban (25.5%) and rural (26%) areas closely matches the national norm.
Demand-ResponseDemand-response generally refers to any transportation service that dispatches vehicles by phone requests from seniors and their caregivers. By definition, demand-response does not follow a fixed route. Depending on program resources and demand, programs typically try to fill requests within 24-48 hours, though excep-tions may be made on a case-by-case basis. With demand-response services, vehicles may carry more than one passenger picked up from different points of entry and dropped off at separate destinations. Paratransit may sometimes operate as a demand-response service. Other transportation services that may operate on a demand-response basis include taxicabs, escorted/assisted transportation, door-to-door and door-through-door. Demand-response was noted as available by more than half (56.2%) of the responding AAAs.
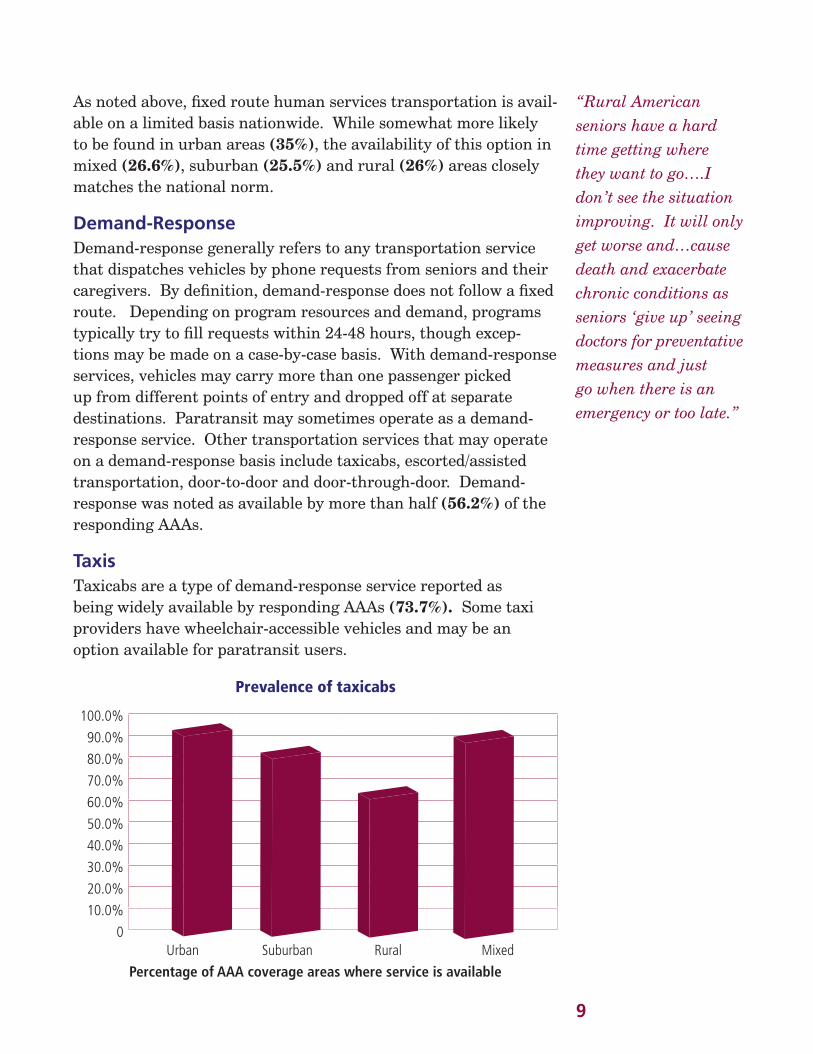
TaxisTaxicabs are a type of demand-response service reported as being widely available by responding AAAs (73.7%). Some taxi providers have wheelchair-accessible vehicles and may be an option available for paratransit users.
Prevalence of taxicabs
100.0%
90.0%
80.0%
70.0%
60.0%
50.0%
40.0%
30.0%
20.0%
10.0%
0Urban Suburban Rural Mixed
Percentage of AAA coverage areas where service is available
“Rural American seniors have a hard time getting where they want to go….I don’t see the situation improving. It will only get worse and…cause death and exacerbate chronic conditions as seniors ‘give up’ seeing doctors for preventative measures and just go when there is an emergency or too late.”

10
Taxicabs are noted as available by most urban (90%), suburban (78.7%) and mixed (88.5%) AAAs. The majority of rural AAAs (58.4%) also report that taxicabs are available.
Door-to-door, door-through-door and escorted/assisted transportationThese transportation options are sometimes made available to older individuals or people with disabilities who need more assis-tance than is typically available through curb-to-curb service. These options are not mutually exclusive.
In door-to-door programs, drivers or escorts provide assistance to help passengers enter and exit the vehicles. Door-through-door programs help passengers from the vehicle through the doors of their residences or destinations, and may include the service of an escort or assistant to stay with the passenger at the destina-tion. Escorted/assisted transportation may be provided to users of paratransit service as needed and can be a complement to any mode of transportation, effectively enabling a ride to become “door-through-door,” even if the transportation provider is not normally equipped to accommodate that level of service.
The survey allowed AAAs to select from among the three options but as noted above, these services are similar and the terms may be used interchangeably. It should be noted that without these options, seniors who need assistance may not be able to utilize transportation of any kind.
Door-to-door service is available in a majority of AAA areas (64.7%), while slightly less than half of AAAs (46.6%) reported that escorted/assisted transportation is provided in their service areas. Door-through-door service is far less common, with only 18.9% of AAAs reporting that the service is available.
11
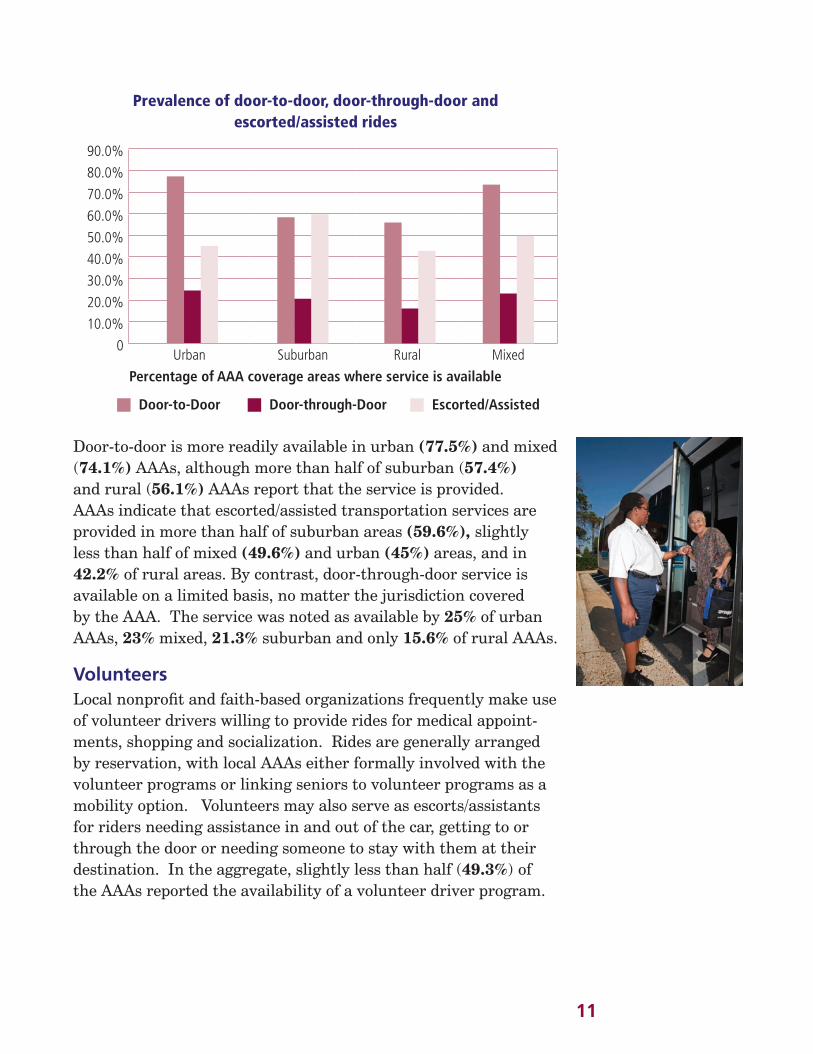
Prevalence of door-to-door, door-through-door and escorted/assisted rides
90.0%
80.0%
70.0%
60.0%
50.0%
40.0%
30.0%
20.0%
10.0%
0Urban Suburban Rural Mixed
Percentage of AAA coverage areas where service is available
Door-to-Door Door-through-Door Escorted/Assisted
Door-to-door is more readily available in urban (77.5%) and mixed (74.1%) AAAs, although more than half of suburban (57.4%) and rural (56.1%) AAAs report that the service is provided. AAAs indicate that escorted/assisted transportation services are provided in more than half of suburban areas (59.6%), slightly less than half of mixed (49.6%) and urban (45%) areas, and in 42.2% of rural areas. By contrast, door-through-door service is available on a limited basis, no matter the jurisdiction covered by the AAA. The service was noted as available by 25% of urban AAAs, 23% mixed, 21.3% suburban and only 15.6% of rural AAAs.
Volunteers Local nonprofit and faith-based organizations frequently make use of volunteer drivers willing to provide rides for medical appoint-ments, shopping and socialization. Rides are generally arranged by reservation, with local AAAs either formally involved with the volunteer programs or linking seniors to volunteer programs as a mobility option. Volunteers may also serve as escorts/assistants for riders needing assistance in and out of the car, getting to or through the door or needing someone to stay with them at their destination. In the aggregate, slightly less than half (49.3%) of the AAAs reported the availability of a volunteer driver program.

12
Prevalence of volunteer driver programs
70.0%
60.0%
50.0%
40.0%
30.0%
20.0%
10.0%
0Urban Suburban Rural Mixed
Percentage of AAA coverage areas where service is available
Volunteer programs are more likely to be available in urban (60%), suburban (63.8%) and mixed (56.1%) areas than in communities identified as rural (42.2%). Considering that volun-teer programs often expand access to transportation services, the more limited use of volunteers in rural areas, where there are likely to be fewer transportation options anyway, underscores the challenge of ensuring rural seniors access to essential services and community activities.
Transportation vouchersVouchers offer fare assistance to enable qualified individuals to purchase a range of transportation services to meet their needs. Depending on program restrictions, vouchers may be used to pay for taxicab rides, public transit, paratransit or other transporta-tion services offered by the public or private sector that charge a fee. These programs support seniors’ independence and empower them to make choices about using transportation to meet their needs. The survey found that voucher programs are available in less than one-fourth of the service areas of responding AAAs (21.9%). Voucher programs are more likely to be found in urban areas where almost one-third of AAAs (30%) reported their avail-ability, less common in suburban (29.8%) and mixed (28.1%) areas, and hardly available at all in rural America (13.9%).

13
Support for riders: mobility management & travel training To ensure that seniors are able to take advantage of transpor-tation options safely and efficiently, a range of services exist to educate and assist the older rider in navigating the transporta-tion environment. Person-centered mobility management offers guidance and information to potential users of transporta-tion about available services and resources to help them choose the best options for their needs. The survey found this service present in a mere 15.3% of AAA service areas. Travel training is typically offered by public transit agencies and provides free, hands-on instruction on how to use public transit safely and independently. The survey found this service present in only 17% of AAA service areas.
According to AAA survey respondents, mobility management is available in a quarter of urban (25%), and suburban (25.4%) areas, less prevalent in mixed areas (17.3%), and rarely found in rural areas (9.1%). Travel training is available in more than a third of urban jurisdictions (35%), less available in suburban (27.7%) and mixed (23%) areas, and again, unlikely to be offered in rural areas where only 6.4% of AAAs reported its existence. This breakdown follows logically, given the relatively limited avail-ability of public transportation in rural areas.
Older driver safety & transition
People over 65 years of age make roughly 90% of their trips by car, more than 65% as drivers, and 22% as passengers in a vehicle. These rates vary based on the population density of the region, but the overriding fact remains that a personal vehicle – rather than a bus, motor coach or train – is the primary mode of transportation for seniors, and more often than not, seniors are driving.6
According to the AAA Foundation for Traffic Safety, people aged 65 and older will account for 25% of U.S. drivers by 2025. By all accounts, the number of senior drivers on the road will continue to increase. Assessment, evaluation, training and accommodations to help older adults stay safely on the road as long as possible are essential. Transitions represent services designed to assist older drivers find appropriate alternatives to the automobile when driving is no longer safe. Mobility management and travel training, discussed above, are two approaches for providing such assistance. Survey respondents noted that older driver safety programs exist in 41.6% of AAA coverage areas; driver transition was identified as an available service by only 3.3% of AAAs.

14
Prevalence of Older Driver Safety Programs
70.0%
60.0%
50.0%
40.0%
30.0%
20.0%
10.0%
0Urban Suburban Rural Mixed
Percentage of AAA coverage areas where service is available
Older driver safety programs are most likely to operate in suburban (59.6%) or mixed (50.4%) areas, and are available in 45% of urban areas and about one-third (31.2%) of rural areas. Older driver transition services are rarely available anywhere, but more likely to be offered in urban areas (7.5%), over suburban (4.3%), mixed (3.6%) or rural areas (1.7%).
Pedestrian safety These programs are of benefit to seniors who face a host of challenges walking in most communities. Nationwide, only 5.2% of AAAs noted the existence of these programs. These services are somewhat more likely to be offered in suburban areas (12.8%), and are provided in only 10% of urban, 6.3% of mixed and a mere 2.9% of rural areas.

15
DestinationsSurvey respondents were asked to gauge the ease for seniors in reaching various destinations in the community. The chart below indicates more than half of AAAs responded that important destinations “can be challenging” to reach for seniors, with the technical exception of medical appointments (48.8%). For desti-nations other than medical, the range of responses that identified transportation as challenging is tightly clustered.
Q: How easy is it for seniors to find rides to the places they need to go in your community?
Easy Pretty EasyCan be Challenging
Very Difficult
Average Score
Total
Doctor/medical appointment 10.1% (37) 36.8% (135) 48.8%
(179) 4.4% (16) 2.47 367
Grocery store 7.4% (27) 29.2% (107) 53.6% (196) 9.8% (36) 2.66 366
Other store/bank 5.8% (21) 24.1% (88) 57.3%
(209) 12.9% (47) 2.77 365
Places of worship 1.6% (6) 10.4% (38) 53.7%
(196)34.2% (125) 3.21 365
To visit family or friends 2.5% (9) 13.7% (50) 55.5%
(202)28.3% (103) 3.10 364
Entertainment/social events 1.1% (4) 11.8% (43) 54.5%
(198)32.5% (118) 3.18 363
Using a rough average score of each AAA’s assessment of how difficult it is for seniors to reach each destination, medical appoint-ments emerge as the most accessible destination, while “places of worship” emerge as the most difficult. This is not surprising, given the priority of medical appointments set by most senior transportation programs, but underscores the need to increase resources to expand the scope of programs to give seniors access to other essential services (i.e., grocery shopping) and to community opportunities that enhance quality of life.
32.5% report that it is “very difficult” for older adults to find rides to social events
16
Information & ReferralThe survey found that seniors look to AAAs as at least one source of information regarding transportation options. When asked, “Where do older people get information on transportation options in your community?” 96.2% of the AAAs responded that the “AAA or Aging Information &Referral/Assistance” was at least one, if not the primary, source of senior transportation informa-tion. This finding suggests the Aging Services Network has name recognition as a trusted source of information on a wide range of issues, and was consistent across geographic areas, irrespective of the local or regional breadth of services.
It is important to note that AAAs identified a wide variety of information and referral resources that offer transportation infor-mation in the community, indicating that seniors and caregivers are likely to have to consult more than one resource to obtain a complete picture of all the options available. Besides AAAs, the survey identified the following as information resources seniors are likely to consult about transportation options:
Senior center • (89.6%)Public transportation provider • (80.4%)Newsletters or other publications • (49.6%)Individual providers • (44.4%) Other aging service provider • (34.6%) Options brochure or booklet • (29.7%)Aging and Disability Resource Center (ADRC) • (27.2%)Centralized, one-stop call center • (17.4%).
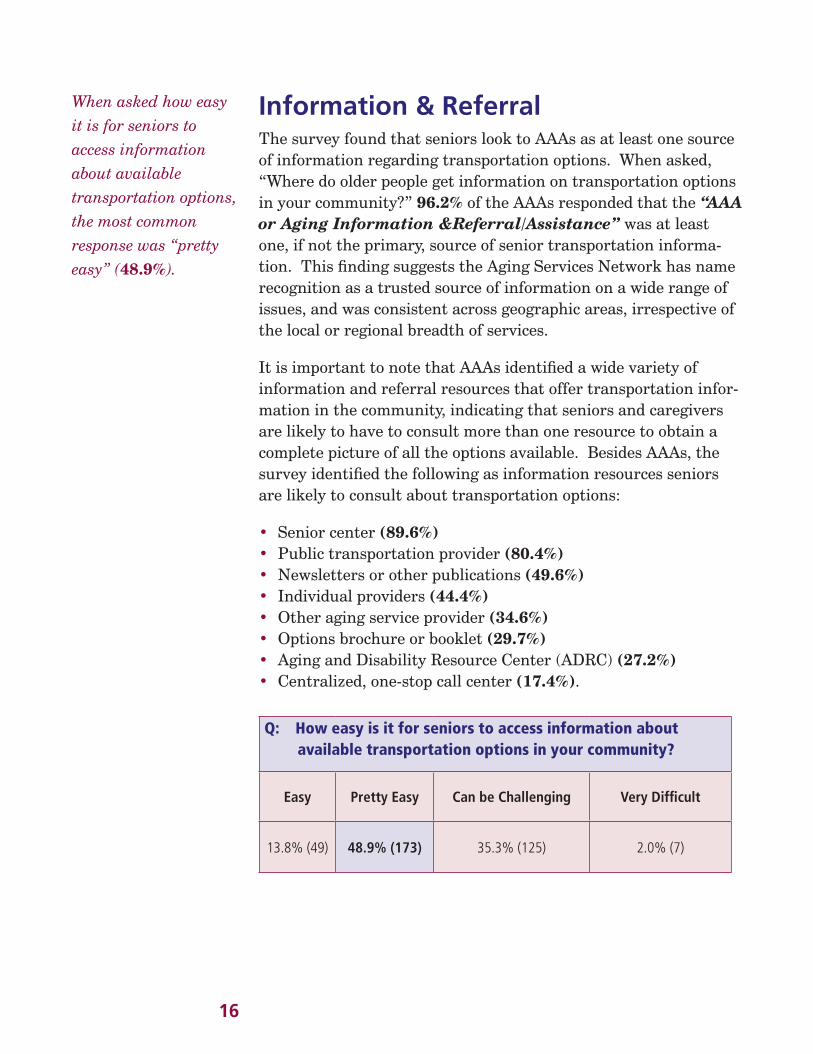
Q: How easy is it for seniors to access information about available transportation options in your community?
Easy Pretty Easy Can be Challenging Very Difficult
13.8% (49) 48.9% (173) 35.3% (125) 2.0% (7)
When asked how easy it is for seniors to access information about available transportation options, the most common response was “pretty easy” (48.9%).
17
ConclusionsArea Agencies on Aging have a deep understanding of the pivotal role transportation plays in seniors’ lives. This survey provides a comprehensive picture of AAAs’ involvement in senior transpor-tation as advocates, planners and service providers. It also adds to our understanding of the availability of transportation services for seniors and seniors’ access to information about transporta-tion options nationwide. Services such as door-to-door and door-through-door are essential for meeting the needs of seniors who may not be able to use transportation without personal assistance. AAAs’ roles as advocates and planners, and their identification of coverage gaps, make them pivotal players in efforts to develop coordinated transportation systems at the community level. Since the AAA is often the first place seniors call for information about transportation options, they need to be at the forefront of efforts to raise seniors’ awareness and educate them about transporta-tion options, including making mobility management and travel training more widely available.
The data collected from AAAs corroborates broader research findings that transportation in rural areas is inadequate to meet the need. AAA respondents to the survey noted that rural seniors lack transportation options in every category when compared to other geographic areas. In addition to needing transportation within their communities, rural seniors often face the challenge of accessing needed services across county borders or at a long distance, such as getting to a regional medical center that could be as much as two hundred miles away. While AAAs noted the lack of transportation services to meet seniors’ needs, no matter where they live, their written comments underscore the urgent need in rural areas to address this problem. As one AAA put it, “in a rural county, this remains the most challenging of all problems.”
In communities and regions of varying geography and socio-economic makeup, AAAs will continue to be faced with growing demand for transportation services from the burgeoning aging population. And, as evidenced by this survey, they will be at the forefront of efforts to ensure that those needs are better met, no matter where seniors live.
“If the older adults are going to stay in their own home, transportation they can access must be in place.”
“Transportation is key in our rural area. Our AAA covers 11,051 square miles…we help only a handful of senior citizens, but those individuals consider themselves fortunate. If you can’t get there, the services don’t matter much.”

18
End Notes1 U.S. Administration on Aging, Fourth National Survey of Older Americans
Act (OAA) Program Participants (2008).
2 In the remaining eight states – Alaska, Delaware, Nevada, New Hampshire, North Dakota, Rhode Island, South Dakota, and Wyoming - the State Agency on Aging administers Older Americans Act services as a single planning and service area.
3 Except Washington, DC, which is not included in the data.
4 National Association of Area Agencies on Aging, “The Aging Services Network,” National Directory of Aging Resources 2009-2010 (2009).
5 U.S. Administration on Aging, Fourth National Survey of Older Americans Act (OAA) Program Participants (2008).
6 Federal Highway Administration and National Highway Transportation
Safety Administration.

19
Notes

20
Notes


National Center on Senior Transportation1425 K Street, N.W., Suite 200
Washington, DC 20005
(202) 347-3066
(202) 347-7345 (TDD)
(202) 737-7914 (Fax)
Toll-free: (866) 528-NCST (6278)
Email: [email protected]
Web site: www.seniortransportation.net
February 2010