Embed Size (px)
Citation preview

Technical Report Documentation Page 1. Report No. FHWA/TX-10/0-5652-1
2. Government Accession No.
3. Recipient's Catalog No.
4. Title and Subtitle TRANSPORTATION, SOCIAL AND ECONOMIC IMPACTS OF LIGHT AND COMMUTER RAIL
5. Report Date November 2008 Published: September 2009 6. Performing Organization Code
7. Author(s) Jeffrey C. Arndt, Curtis Morgan, John H. Overman, Terry L. Clower, Ph.D., Bernard L. Weinstein, Ph.D., and Michael Seman, M.S
8. Performing Organization Report No. Report 0-5652-1
9. Performing Organization Name and Address Texas Transportation Institute The Texas A&M University System College Station, Texas 77843-3135
10. Work Unit No. (TRAIS) 11. Contract or Grant No. Project 0-5652
12. Sponsoring Agency Name and Address Texas Department of Transportation Research and Technology Implementation Office P.O. Box 5080 Austin, Texas 78763-5080
13. Type of Report and Period Covered Technical Report: September 2007-August 2008 14. Sponsoring Agency Code
15. Supplementary Notes Project performed in cooperation with the Texas Department of Transportation and the Federal Highway Administration. Project Title: Transportation, Social and Economic Impacts of Light and Commuter Rail in Metropolitan Areas URL: http://tti.tamu.edu/documents/0-5652-1.pdf 16. Abstract While transportation impacts are often masked by heavy growth in corridor traffic and latent travel demand, modeling enables measuring the real transportation impacts of rail projects. Rail transit is both safe and environmentally friendly. Rail systems expand mobility and reduce household investment in transportation. However, as regions implement rail systems, they must take care to consider the full range of rider impacts so that environmental justice issues do not emerge. The largest body of research relates to the economic impact of rail. These impacts are strongest in station areas, as access to rail increases property value on nearby property. The positive impact of rail on property values does not hold true for property directly adjacent to the rail line however. State Departments of Transportation have played a variety of roles in rail development, ranging from funding initial planning and operating services. TxDOT has authority to participate in rail development but no funding has been appropriated by the legislature. TxDOT could more actively participate in commuter rail projects if the agency was afforded greater flexibility in application of funds and the right to own rolling stock. 17. Key Words Light Rail, Commuter Rail, Intercity Rail, Economic Development
18. Distribution Statement No restrictions. This document is available to the public through NTIS: National Technical Information Service Springfield, Virginia 22161 http://www.ntis.gov
19. Security Classif.(of this report) Unclassified
20. Security Classif.(of this page) Unclassified
21. No. of Pages 140
22. Price
Form DOT F 1700.7 (8-72) Reproduction of completed page authorized


TRANSPORTATION, SOCIAL AND ECONOMIC IMPACTS OF LIGHT AND COMMUTER RAIL
by
Jeffrey C. Arndt Research Scientist
Texas Transportation Institute
Curtis Morgan Assistant Research Scientist
Texas Transportation Institute
John H. Overman Associate Research Scientist
Texas Transportation Institute
Terry L. Clower, Ph.D. Associate Director
Center for Economic Development and Research University of North Texas
Bernard L. Weinstein, Ph.D.
Director Center for Economic Development and Research
University of North Texas
and
Michael Seman, M.S. Research Associate
Center for Economic Development and Research University of North Texas
Report 0-5652-1 Project 0-5652
Project Title: Transportation, Social and Financial Impacts of Light and Commuter Rail in Metropolitan Areas
Performed in cooperation with the
Texas Department of Transportation and the
Federal Highway Administration
November 2008 Published: September 2009
TEXAS TRANSPORTATION INSTITUTE
The Texas A&M University System College Station, Texas 77843-3135


v
DISCLAIMER
This research was performed in cooperation with the Texas Department of Transportation (TxDOT) and the Federal Highway Administration (FHWA). The contents of this report reflect the views of the authors, who are responsible for the facts and the accuracy of the data presented herein. The contents do not necessarily reflect the official view or policies of the FHWA or TxDOT. This report does not constitute a standard, specification, or regulation. The United States Government and the State of Texas do not endorse products or manufacturers. Trade or manufacturers’ names appear herein solely because they are considered essential to the object of this report.

vi
ACKNOWLEDGMENTS
This project was conducted in cooperation with TxDOT and FHWA. The authors acknowledge the assistance of Project Director Stephen Endres, P.E, and Program Coordinators William Hale, P.E., and Maribel Chavez, P.E. Serving as members of the Project Advisory Committee, Wilda Won, Charles Airiohuodion, and Curtis Loftis, P.E., of TxDOT, and Stephen Salin provided valued guidance and input.
vii
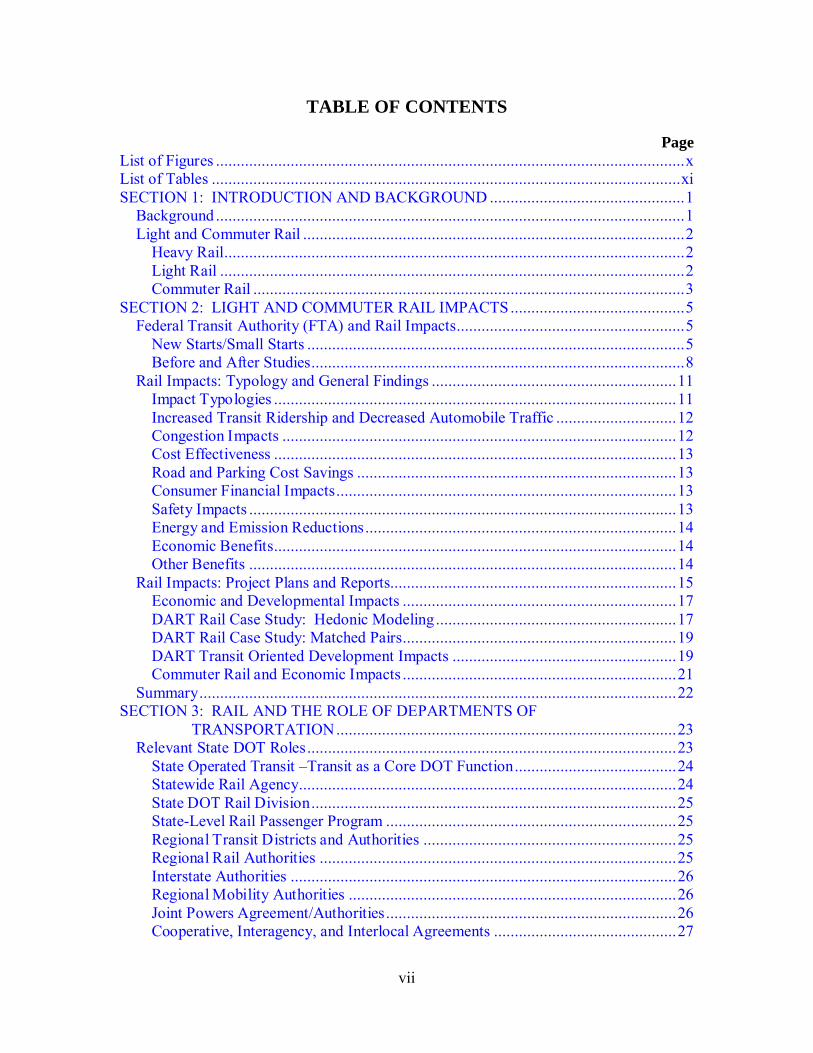
TABLE OF CONTENTS
Page List of Figures ................................................................................................................. x List of Tables ................................................................................................................. xi SECTION 1: INTRODUCTION AND BACKGROUND ............................................... 1
Background ................................................................................................................. 1 Light and Commuter Rail ............................................................................................ 2
Heavy Rail ............................................................................................................... 2 Light Rail ................................................................................................................ 2 Commuter Rail ........................................................................................................ 3
SECTION 2: LIGHT AND COMMUTER RAIL IMPACTS .......................................... 5 Federal Transit Authority (FTA) and Rail Impacts ....................................................... 5
New Starts/Small Starts ........................................................................................... 5 Before and After Studies .......................................................................................... 8
Rail Impacts: Typology and General Findings ........................................................... 11 Impact Typologies ................................................................................................. 11 Increased Transit Ridership and Decreased Automobile Traffic ............................. 12 Congestion Impacts ............................................................................................... 12 Cost Effectiveness ................................................................................................. 13 Road and Parking Cost Savings ............................................................................. 13 Consumer Financial Impacts .................................................................................. 13 Safety Impacts ....................................................................................................... 13 Energy and Emission Reductions ........................................................................... 14 Economic Benefits ................................................................................................. 14 Other Benefits ....................................................................................................... 14
Rail Impacts: Project Plans and Reports..................................................................... 15 Economic and Developmental Impacts .................................................................. 17 DART Rail Case Study: Hedonic Modeling .......................................................... 17 DART Rail Case Study: Matched Pairs .................................................................. 19 DART Transit Oriented Development Impacts ...................................................... 19 Commuter Rail and Economic Impacts .................................................................. 21
Summary ................................................................................................................... 22 SECTION 3: RAIL AND THE ROLE OF DEPARTMENTS OF
TRANSPORTATION .................................................................................. 23 Relevant State DOT Roles ......................................................................................... 23
State Operated Transit –Transit as a Core DOT Function ....................................... 24 Statewide Rail Agency........................................................................................... 24 State DOT Rail Division ........................................................................................ 25 State-Level Rail Passenger Program ...................................................................... 25 Regional Transit Districts and Authorities ............................................................. 25 Regional Rail Authorities ...................................................................................... 25 Interstate Authorities ............................................................................................. 26 Regional Mobility Authorities ............................................................................... 26 Joint Powers Agreement/Authorities ...................................................................... 26 Cooperative, Interagency, and Interlocal Agreements ............................................ 27
viii
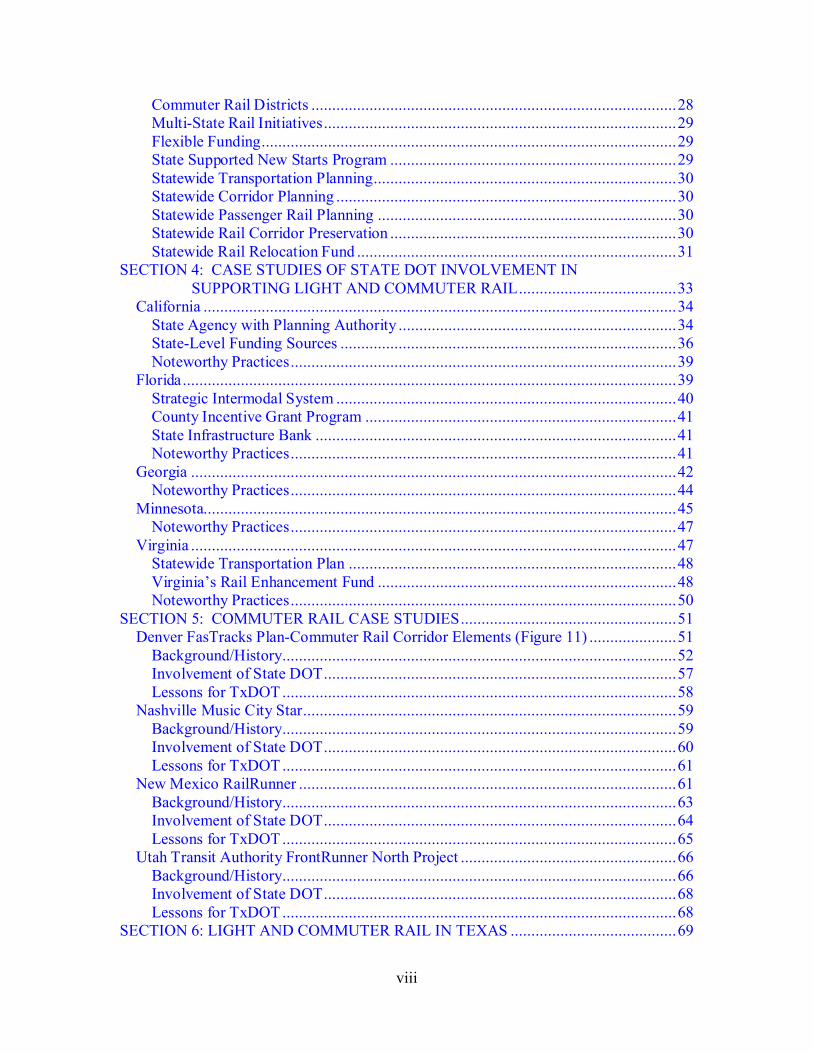
Commuter Rail Districts ........................................................................................ 28 Multi-State Rail Initiatives ..................................................................................... 29 Flexible Funding .................................................................................................... 29 State Supported New Starts Program ..................................................................... 29 Statewide Transportation Planning ......................................................................... 30 Statewide Corridor Planning .................................................................................. 30 Statewide Passenger Rail Planning ........................................................................ 30 Statewide Rail Corridor Preservation ..................................................................... 30 Statewide Rail Relocation Fund ............................................................................. 31
SECTION 4: CASE STUDIES OF STATE DOT INVOLVEMENT IN SUPPORTING LIGHT AND COMMUTER RAIL ...................................... 33
California .................................................................................................................. 34 State Agency with Planning Authority ................................................................... 34 State-Level Funding Sources ................................................................................. 36 Noteworthy Practices ............................................................................................. 39
Florida ....................................................................................................................... 39 Strategic Intermodal System .................................................................................. 40 County Incentive Grant Program ........................................................................... 41 State Infrastructure Bank ....................................................................................... 41 Noteworthy Practices ............................................................................................. 41
Georgia ..................................................................................................................... 42 Noteworthy Practices ............................................................................................. 44
Minnesota.................................................................................................................. 45 Noteworthy Practices ............................................................................................. 47
Virginia ..................................................................................................................... 47 Statewide Transportation Plan ............................................................................... 48 Virginia’s Rail Enhancement Fund ........................................................................ 48 Noteworthy Practices ............................................................................................. 50
SECTION 5: COMMUTER RAIL CASE STUDIES .................................................... 51 Denver FasTracks Plan-Commuter Rail Corridor Elements (Figure 11) ..................... 51
Background/History ............................................................................................... 52 Involvement of State DOT ..................................................................................... 57 Lessons for TxDOT ............................................................................................... 58
Nashville Music City Star .......................................................................................... 59 Background/History ............................................................................................... 59 Involvement of State DOT ..................................................................................... 60 Lessons for TxDOT ............................................................................................... 61
New Mexico RailRunner ........................................................................................... 61 Background/History ............................................................................................... 63 Involvement of State DOT ..................................................................................... 64 Lessons for TxDOT ............................................................................................... 65
Utah Transit Authority FrontRunner North Project .................................................... 66 Background/History ............................................................................................... 66 Involvement of State DOT ..................................................................................... 68 Lessons for TxDOT ............................................................................................... 68
SECTION 6: LIGHT AND COMMUTER RAIL IN TEXAS ........................................ 69

ix
Existing and Proposed Commuter Rail Systems ......................................................... 69 Trinity Railway Express—Dallas and Fort Worth .................................................. 69 Commuter and Light Rail Planning in the NCTCOG Area ..................................... 70 Austin-San Antonio Intermunicipal Commuter Rail District .................................. 73 Capital Metro’s Urban Commuter Rail Line .......................................................... 75 Houston-Rosenberg Commuter Rail Feasibility Study ........................................... 76 Harris County Commuter Rail Analyses ................................................................ 76
Light Rail Services .................................................................................................... 77 Dallas Area Rapid Transit (DART) ........................................................................ 77 Houston/Harris County Metropolitan Transit Authority Light Rail System ............ 78
SECTION 7: TXDOT AND RAIL PLANNING/FUNDING ........................................ 81 TxDOT Rail Freight Studies .................................................................................. 83
Rail Funding .............................................................................................................. 83 Federal Sources ..................................................................................................... 83 New Capital Assistance for Intercity Passenger Rail .............................................. 85 Rail Funding in SAFETEA-LU .............................................................................. 85 State Sources ......................................................................................................... 86
SECTION 8: POTENTIAL TXDOT ROLES IN RAIL DEVELOPMENT ................... 89 Rail Regulations and TxDOT .................................................................................... 92
Line Item Appropriation ........................................................................................ 93 Rolling Stock Ownership ....................................................................................... 93 Funding Rail Relocation and Improvement ............................................................ 93
REFERENCES.............................................................................................................. 95 APPENDIX A: Listing of Rail Impacts ........................................................................ 97 APPENDIX B: Federal and State Policies, Practices, and Authorities Affecting Rail Development ............................................................................................................... 119 APPENDIX C: Outline of Communications Brochure ................................................ 125
x
LIST OF FIGURES
Page Figure 1. Bay Area Rapid Transit (BART)...................................................................... 2 Figure 2. Houston METRORail, Houston, Texas. ........................................................... 3 Figure 3. Trinity Railway Express, Dallas-Fort Worth Metropolitan Region. .................. 4 Figure 4. Traffic Fatality Rates versus Transit Utilization. ............................................ 13 Figure 5. Energy Consumption by Mode. ..................................................................... 14 Figure 6. California Intercity and Commuter Rail Network. .......................................... 35 Figure 7. Georgia Rail Passenger Program Organization............................................... 42 Figure 8. Georgia Rail Passenger Program. ................................................................... 43 Figure 9. Minnesota Northstar Corridor. ....................................................................... 46 Figure 10. Virginia DOT Organization. ........................................................................ 48 Figure 11. Denver RTD Commuter Rail System. .......................................................... 52 Figure 12. East Corridor. .............................................................................................. 53 Figure 13. Gold Line. ................................................................................................... 54 Figure 14. North Metro Corridor. ................................................................................. 55 Figure 15. Northwest Rail Corridor. ............................................................................. 57 Figure 16. Nashville RTA Commuter Rail Map. ........................................................... 59 Figure 17. New Mexico RailRunner Map-Phase I. ........................................................ 62 Figure 18. RoadRunner Map-Phase II. .......................................................................... 63 Figure 19. UTA FrontRunner Map. .............................................................................. 67 Figure 20. Trinity Railway Express Route Map............................................................. 70 Figure 21. Corridors Identified by the 2004 NCTCOG Regional Rail Corridor
Study. .......................................................................................................... 71 Figure 22. Map of NCTCOG Rail North Texas Rail Lines under Consideration. ........... 72 Figure 23. The Austin-San Antonio Intermunicipal Commuter Rail District. ................ 74 Figure 24. Capital Metro Commuter Rail Line. ............................................................. 75 Figure 25. H-GAC Conceptual Regional Rail Plan. ...................................................... 77 Figure 26. DART Rail System Map. ............................................................................. 78 Figure 27. Houston METRORail System Map. ............................................................. 79

xi
LIST OF TABLES
Page Table 1. Characteristics of Light Rail and Commuter Rail (1). ........................................ 4 Table 2. Rail Impacts Reflected in FTA New Starts Evaluation Criteria.......................... 8 Table 3. Benefit Typology. ........................................................................................... 15 Table 4. States with Rail Plan Inventories Reviewed in NCHRP Report 374. ................ 31 Table 5. Texas Rail System Plan Objectives. ................................................................ 82 Table 6. Potential TxDOT Financial Roles. .................................................................. 90 Table 7. Potential TxDOT Planning Assistance Roles. .................................................. 91 Table 8. Potential Operations/Support Roles for TxDOT. ............................................. 92


1
SECTION 1: INTRODUCTION AND BACKGROUND
The purpose of this report is to document the research and findings for the work accomplished on Research Management Committee (RMC) Project 0-5652: Transportation, Social and Economic Impacts of Light and Commuter Rail in Metropolitan Areas. RMC Project 0-5652 contained two key elements. The first element involved identifying, through research, the transportation, social, and economic impacts of light and commuter rail. The purpose of this element was to document measures and methodologies that have been employed in assessing light and commuter rail impacts. The second element involved identifying potential TxDOT roles in planning, developing, funding, and operating these rail systems. For this second task, researchers tied measured impacts identified in the first element of the study to the strategic goals of TxDOT, demonstrating the degree to which rail development might assist TxDOT in reaching those goals. Researchers then identified a range of roles that departments of transportation (DOTs) play nationally in light and commuter rail development. BACKGROUND The Texas population is projected to continue growing at a rate faster than the United States’ average growth rate. Indeed, per U.S. Census data, in every decennial U.S. census since the Civil War, the population growth rate in Texas has exceeded that of the United States. The U.S. Bureau of Census estimated the population of Texas as approximately 22,860,000 in 2005, making it the second most populous state (behind California). By 2040, that population is projected to grow to 51,700,000. TxDOT is challenged with meeting the mobility needs of this growing population. This will require maximizing the mobility benefit for every dollar the state invests in transportation infrastructure. TxDOT has historically been at the forefront of innovative approaches to enhance the productivity of their transportation system. They pioneered the creation of High Occupancy Vehicle lanes in freeway corridors to increase those corridors’ person-carrying capacity. TxDOT also championed one of the nation’s earliest integrated traffic management centers in Houston, enabling quick and holistic response to freeway incidents that throttle roadway capacity. The purpose of this research is to provide information regarding another approach to moving people efficiently—rail transit. Specifically, this study will examine the variety of impacts of light rail and commuter rail projects. Further, the research team will document the role(s) that other states have played in the planning, designing, developing, and operating light rail and heavy rail. The research will examine current TxDOT policies associated with their participation in such projects. Finally, the research effort will link potential impacts to TxDOT agency goals and identify any legislative or administrative changes that would be needed in order to permit TxDOT to participate in rail projects.

2
LIGHT AND COMMUTER RAIL Rail transit projects are typically classified into one of three broad categories—heavy rail, light rail, and commuter rail. While heavy rail is not included in the subject of this research, it is useful to understand the differences between these three categories of rail. Heavy Rail Heavy rail has been developed in a limited number of U.S. cities. Heavy rail is characterized by the so-called third rail that provides power to the vehicles. Because the power is being delivered at the same grade as the rail, heavy rail systems operate in their own separated, exclusive rights of way. Heavy rail systems typically feature significant subway sections. Examples of heavy rail systems in the U.S. include the New York City subway system; and the rail systems in Washington D.C., Atlanta (MARTA), and San Francisco Bay Area (BART) (Figure 1).
Figure 1. Bay Area Rapid Transit (BART).
Light Rail Light Rail (LRT) evolved as a term in the 1970s as transit systems sought to achieve some of the benefits of a rapid transit system, such as heavy rail, but at a lower cost. Light rail typically receives its power from an overhead wire. This makes it possible to operate light rail at street level and without exclusive rights of way (although light rail vehicles can operate in subways as well). The term “light” refers to the relatively lighter passenger loads that these systems can accommodate compared to heavy rail and not to the relative weight of the vehicles themselves.
3
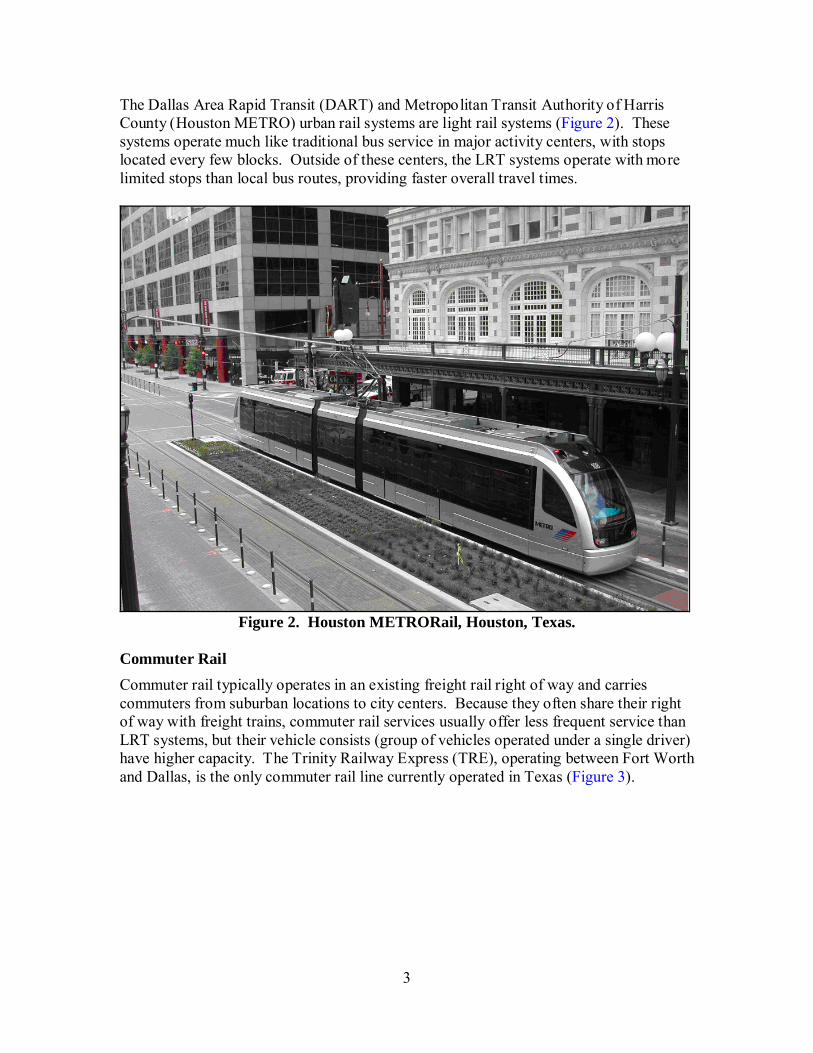
The Dallas Area Rapid Transit (DART) and Metropolitan Transit Authority of Harris County (Houston METRO) urban rail systems are light rail systems (Figure 2). These systems operate much like traditional bus service in major activity centers, with stops located every few blocks. Outside of these centers, the LRT systems operate with more limited stops than local bus routes, providing faster overall travel times.
Figure 2. Houston METRORail, Houston, Texas.
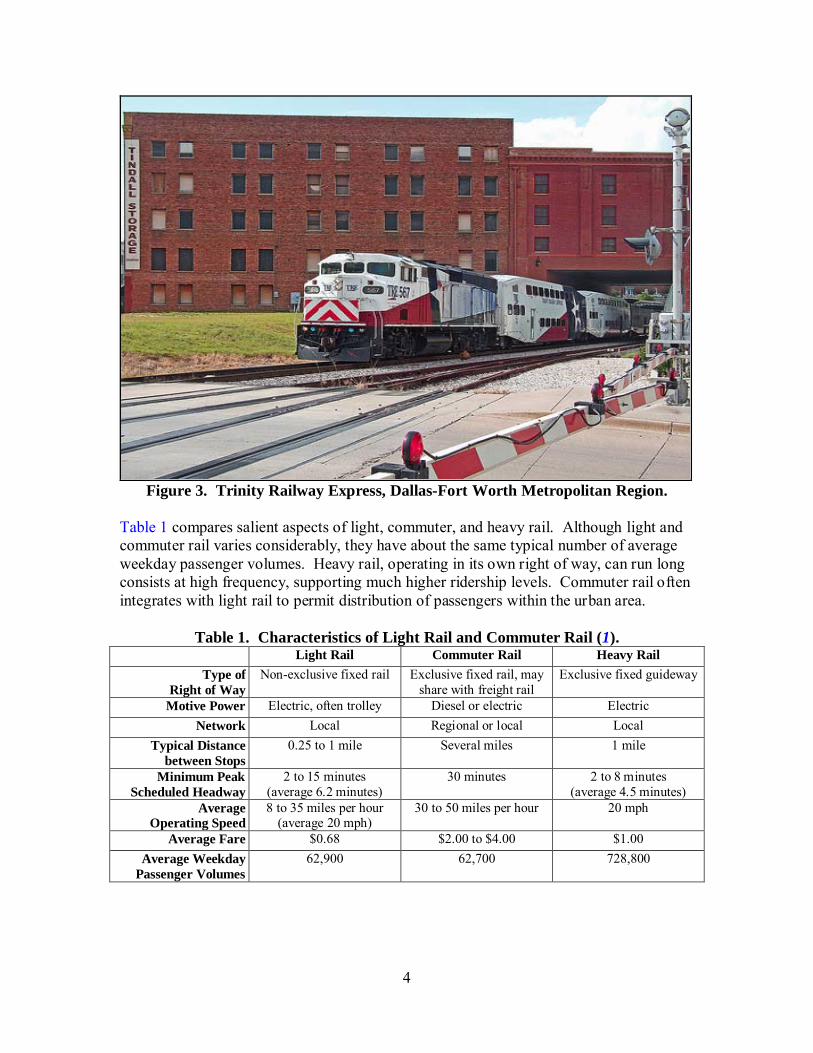
Commuter Rail Commuter rail typically operates in an existing freight rail right of way and carries commuters from suburban locations to city centers. Because they often share their right of way with freight trains, commuter rail services usually offer less frequent service than LRT systems, but their vehicle consists (group of vehicles operated under a single driver) have higher capacity. The Trinity Railway Express (TRE), operating between Fort Worth and Dallas, is the only commuter rail line currently operated in Texas (Figure 3).
4
Figure 3. Trinity Railway Express, Dallas-Fort Worth Metropolitan Region.
Table 1 compares salient aspects of light, commuter, and heavy rail. Although light and commuter rail varies considerably, they have about the same typical number of average weekday passenger volumes. Heavy rail, operating in its own right of way, can run long consists at high frequency, supporting much higher ridership levels. Commuter rail often integrates with light rail to permit distribution of passengers within the urban area.
Table 1. Characteristics of Light Rail and Commuter Rail (1). Light Rail Commuter Rail Heavy Rail
Type of Right of Way
Non-exclusive fixed rail Exclusive fixed rail, may share with freight rail
Exclusive fixed guideway
Motive Power Electric, often trolley Diesel or electric Electric Network Local Regional or local Local
Typical Distance between Stops
0.25 to 1 mile Several miles 1 mile
Minimum Peak Scheduled Headway
2 to 15 minutes (average 6.2 minutes)
30 minutes 2 to 8 minutes (average 4.5 minutes)
Average Operating Speed
8 to 35 miles per hour (average 20 mph)
30 to 50 miles per hour 20 mph
Average Fare $0.68 $2.00 to $4.00 $1.00 Average Weekday
Passenger Volumes 62,900 62,700 728,800

5
SECTION 2: LIGHT AND COMMUTER RAIL IMPACTS
This section of the report contains a summary of research on the transportation, social, and economic impacts of light and commuter rail. Section 2 also includes information on how these analyses were conducted and how agencies that fund rail projects assess the merits of proposals. FEDERAL TRANSIT AUTHORITY (FTA) AND RAIL IMPACTS The Federal Transit Authority (FTA) is a major funding source for U.S. passenger rail projects. In order to receive FTA funding, local agencies must follow procedures established by the FTA for grant funding. Funding is provided under Section 5309 – Major Capital Investments (New Starts and Small Starts). The Safe, Accountable, Flexible, Efficient Transportation Equity Act – A Legacy for Users (SAFETEA-LU) authorization of 2005 modified some of the parameters for justifying rail projects as well as creating a category for projects with federal funding requests of less than $75 million and net project costs of under $250 million, called Small Starts. Small Starts are to have a more streamlined grants process than New Starts. New Starts/Small Starts Acquiring New Starts funding is a highly competitive process with many cities entering the set of prospective grantees over the last decade. Therefore, FTA must rate proposals; the agency has established a set of criteria under which they will score and rank proposals. These criteria reflect the impacts that the federal government believes merit investment in major rail infrastructure and include the following: • mobility improvement; • environmental benefits; • cost effectiveness; • operating efficiencies; • transit-supportive existing land use, policies, and future patterns; and • other factors. In July 2007, FTA issued guidance on the criteria that would be used in evaluating FY09 proposals. The specific measures enumerated are as follows (2):
• Cost Effectiveness. FTA measures cost effectiveness using the new indicator of cost
per hour of user benefit. Costs include annualized capital and operating costs, and user benefit is usually a result of travel time savings. This new indicator replaces the prior measure of incremental cost per new rider and recognizes that rail projects may benefit existing riders as well as new riders. FTA also feels that operational efficiencies are reflected in this indicator and therefore do not measure operational efficiencies separately.

6
FTA ranks proposals’ cost effectiveness according to the following scale (2007 levels; updated annually):
o High $11.99 and under o Medium-high $12.00 - $15.49 o Medium $15.50 - $23.99 o Medium-low $24.00 - $29.99 o Low $30.00 and over
• Transit-Supportive Existing Land Use, Policies, and Future Patterns. FTA
measures the degree to which current land use, policies, and future patterns are suppo rtive of a major transit investment within a corridor. This evaluation is somewhat qualitative, with scores of 1 through 5 assigned in each of the following areas:
o Degree to which existing land use and pedestrian environment support rail
project; o Presence of growth management/land conservation policies supporting
density appropriate to rail; o Plans/policies in rail corridor are supportive, including pedestrian planning
and land use plans; o Zoning is supportive of rail investment; o Tools are in place or being developed to support public-private
partnerships in station area development; o Transit-supportive development is occurring in the corridor; and o Available property and supportive policies exist to permit development in
the station areas.
The factors leading to a specific ranking vary based upon the stage of the rail project development. All scores are averaged to determine the ranking, from High to Low, in this category. Note that transit operators and FTA have been in dialogue regarding the selection of land use as an evaluation criterion. Land use decisions are typically outside the scope of transit agencies.
• Mobility Improvements. FTA uses four distinct factors to measure mobility
improvements that a rail project is expected to generate.
o User Benefits per Passenger-Mile. Travel time savings are divided by a normalizing factor, passenger-miles, representing the intensity of the system use.
o Number of Transit Dependent Individuals Using the Project. o Transit Dependent User Benefit per Passenger-Mile. These two
measures evaluate the degree to which the proposed project will benefit the transit dependent portion of the market. Each is determined and FTA assigns a single combined score for the two measures.

7
o Share of User Benefits Received by Transit Dependents Compared to Share of Transit Dependents in the Region. This factor measures the equity of distribution of user benefits over the transit dependent market.
This final factor is averaged with the single score generated by combining the two previous factors, resulting in a single ranking associated with transit dependency. This ranking, in turn, is averaged with the ranking for user benefit per passenger-mile to arrive at the final score for mobility improvement:
Final Score = 0.5[User Benefit/Pssgr.-Mile] + 0.5[0.5({No. transit dependent users+ Transit dependent benefit/Pssgr.-Mile}/2) + 0.5(Share of benefit by transit dependent compare to share of transit dependent in region).
• Environmental Benefits. This scoring does not reflect necessarily the degree to
which the specific project will improve air quality. Instead, projects in non-attainment areas are rated High and all others are rated Medium.
• Other Factors. FTA will consider other aspects of the project, with particular interest in how the project will support economic development.
With SAFETEA-LU, FTA introduced a separate tier for funding of smaller fixed guideway projects called Small Starts. In order to qualify under Small Starts, the total capital cost of the project must be less than $250 million, and the Section 9 funding request must be less than $75 million. The FTA issues interim guidelines for the evaluation of Small Starts project while going through the final rulemaking process. FTA recommended funding in 2008 for four Bus Rapid Transit projects under Small Starts. FTA also introduced a Very Small Starts program that would be funded through the Small Starts funding allocation. Very Small Starts projects must have a total capital cost of under $50 million with a maximum fixed guideway cost per mile of $3 million (excluding rolling stock). Very Small Starts do not go through the Alternative Analysis process that is required as New Starts and Small Starts. In summary, the FTA New Starts evaluation criteria focus on the transportation, social, and economic impacts as illustrated in Table 2.

8
Table 2. Rail Impacts Reflected in FTA New Starts Evaluation Criteria. Impact Category Impact Measure Transportation Cost Effectiveness Cost per hour of user benefit Transportation Travel Time Savings User benefits per passenger mile Social Meet Needs of Transit
Dependent Number of transit dependent individuals using project
Social Meet Needs of Transit Dependent
Transit dependent benefit per passenger mile
Social Equity Share of user benefits received by transit dependents compared to share of transit dependents in the region
Social Environmental Non-attainment status of region Developmental Supportive Land Use Existing land use and pedestrian environment Developmental Supportive Land Use Supportive development is occurring in corridor Developmental Supportive Policies Presence of growth management/land conservation plan Developmental Supportive Policies Presence of supportive land use plan Developmental Supportive Policies Presence of supportive zoning Developmental Supportive Policies Tools in place to support public-private partnerships in
station area development These criteria can be succinctly summarized as follows: • Rail project should save passengers time—both existing and new passengers; • Rail project should serve transit dependent as well as non-transit dependent markets;
and • Rail project should be located in corridors with supportive existing and proposed land
uses, zoning, and development opportunities. Note that the transportation benefits are tied to the rail system users’ experience. There is no consideration of the transportation impacts on non-users such as decreased delay to motorists in the corridor. Before and After Studies With the enactment of the Safe, Accountable, Flexible, Efficient Transportation Equity Act – A Legacy for Users (SAFETEA-LU), FTA codified the requirement that all recipients of full funding grant agreements prepare Before and After studies on their projects (3). Rail project funding is typically secured through full funding grant agreements. The plan for the study is to be developed during the final design of the project and must be approved by FTA. The study plan must include data collection and data analysis sections. At a minimum, the study must include the expected costs and impacts of the project on the transit network’s service levels, capital costs, operating costs, and ridership. These elements should be measured two years after opening of the new fixed guideway project; the results should be compared to the expected values, and differences should be explored. FTA is required to report the results of Before and After studies each year to Congress prior to the first Monday of August.

9
The Before and After studies have two purposes: • to “…expand insights into the costs and impacts of major transit investments;” and • to “improve the technical methods and procedures used in planning and development
of those investments.” The requirement became effective and part of grant agreements from April 20, 2001. There have been relatively few projects with full funding grant agreements that were signed after April 20, 2001, were completed, placed in operation, and operated two years. In fact, FTA noted that their September 2007 report to Congress was the first time they shared information from a completed Before and After study (4). That study pertained to the Utah Transit Authority’s (UTA) Medical Center extension to their TRAX light rail system. The full funding grant agreement, which was signed in May 2002, contained the requirement for a Before and After study. The state of that study reflects several key challenges. It was the first agreement to contain that provision and the FTA had not yet fully established the program. UTA had not previously archived all the information required to conduct a complete Before and After study to current FTA standards but reportedly spent considerable time and effort to re-assemble as much data as possible. Further, the Medical Center Extension was planned as part of a new east-west line. Therefore the costs, service design, and ridership estimates developed during planning did not reflect the final project and required considerable allocation of planned project data to arrive at estimates for the single extension. As a result, the UTA Before and After study did not provide supportable analytical conclusions. However, it did make clear the need for FTA to provide more specific guidance. FTA subsequently issued guidance on preservation of data for Before and After studies. Dallas Area Rapid Transit completed a detailed Before and After study on their North Central (NC) Corridor. This study reflects an expansion on the FTA concept, looking beyond the specific areas of concern that FTA noted in their requirement. Note that DART entered into a full funding grant agreement in 1999, prior to the time when Before and After studies became a mandated part of such agreements. The DART report provides very detailed descriptions of the differences between the original plans and the constructed project. These changes highly influenced the variance between planned and realized costs, service level, and ridership. Per the report, changes in the number of vehicles and increases in the number of stations, extent of service, and amount of double tracking combined to create the large difference between planned capital costs and actual capital costs. Similarly, the larger extent of the NC line as compared to the original planned extent led to higher annual operating and maintenance costs.
10
Ridership by station in 2004 was comparable to 2010 ridership projections. Some stations are already exceeding 2010 projection levels. Stations that appear to be significantly underperforming projections are currently being impacted by construction in those station areas. Overall bus and rail ridership increased 30 percent within the corridor. However, the report does not make it clear whether that increase is based upon increased linked or unlinked trips. Unlinked trips or boardings will often increase when transit systems feed bus routes to rail lines, requiring two boardings to complete a trip that could be completed with only one boarding pre-rail. Mobility impacts were misestimated with average daily traffic (ADT) along the North Central Expressway traffic volumes exceeding 2010 projected volumes in 2004. In fact, the ADT on North Central Expressway at Park Boulevard in 2004 was nearly 50 percent more than the estimated 2010 volumes at that location. This increased traffic is linked to high growth rates in population and employment. DART added an evaluation of the change in the demographics of DART riders between 1998 and 2005. The expansion of rail into suburban areas resulted in the following changes to the demographics of rail riders in 2005 compared to rail riders in 1998: • The percentage of “choice” riders increased from 60 percent to 85 percent. • The percentage of rail riders with college degrees increased from 22 percent to
33 percent, and those with post-graduate degrees increased from 8 percent to 17 percent.
• The percentage of riders with annual incomes of less than $15,000 decreased from 39 percent to 17 percent, while the percentage of riders with incomes of $50,000 or more increased from 23 percent to 41 percent.
Comparing the demographics of 2004 rail riders to bus riders reveals the following: • Choice riders comprise 82 percent of rail riders and 59 percent of bus riders. • Twenty-one percent of rail riders have a high school education or less compared to
41 percent of bus riders; while 50 percent of rail riders have a college diploma or more compared to 29 percent of bus riders.
• Riders with an average annual income of less than $15,000 comprise 17 percent of rail riders and 39 percent of bus riders.
The DART report suggests the following findings regarding impacts of rail: • Transportation: increase in transit ridership of 30 percent in corridor. • Transportation: rail did not reduce freeway congestion in the primary corridor. • Transportation: lack of parking constrained ridership growth. • Social: rail increased the percentage of choice riders having higher income and
educational levels than those who road rail initially, and higher income and educational levels than those who ride DART buses.

11
• Economic: rail was the “motivation” behind several new real estate developments. • Economic: many factors influencing the success of the rail are outside the hands of
the transit agency, including overall economic conditions and the type of development constructed near stations.
RAIL IMPACTS: TYPOLOGY AND GENERAL FINDINGS As the major funding source for United States rail projects, the impacts identified by FTA as critical to supporting funding requests are important to and shared by transit systems across the nation. However, these systems must also generate local backing for the project. Systems often must achieve voter approval to either generate the local funds to match the federal grant funds or to approve issuance of certain debt instruments. As public bodies, transit systems depend upon the political support of elected officials, business leaders, and the community at large. The research team conducted extensive literature review and contacted transit systems to identify the kinds of impacts that have been used to generate that public support. This section of the report contains the findings listed in general planning reports and documents. The following section of the report contains findings listed in specific project reports. Impact Typologies Economists argue that all benefits are ultimately economic, at least in that all benefits are measurable in economic terms. Certainly the paradigm of benefit/cost analyses requires that all benefits and all costs ultimately be dollarized. While this aspect of the benefit/cost process is sometimes regarded as its Achilles heel, it also provides a sound starting place for evaluation of an investment. In “Measuring Economic Value of Transit,” economist Dr. David Lewis of HLB Decision Economics Inc. (now part of HDR) posited that the economic value of transit investments were derived in three categories of benefits (5): • Congestion Management: Increased use of transit generates economic benefit
through reduced congestion, more reliable travel times, decreased cost of accidents, and decreased emission damages.
• Affordable Mobility: Increased use of transit by low income individuals freed up money in their budget for other uses.
• Land Use: Transit facilities can lead to improved property value and a higher quality of life.
The typology incorporated into the title of this research project in fact directly links to the Lewis typology. Congestion management benefits are transportation benefits; affordable mobility benefits are social benefits, and land use benefits are economic benefits.

12
Dr. Lewis conducted an analysis of a proposed light rail line in Cincinnati, Ohio. Based upon that analysis, he found that the economic value of that rail proposal was split by benefit category as follows: • Congestion Management: 63 percent • Affordable Mobility: 18 percent • Land Use: 19 percent Todd Litman of the Victoria Transport Policy Institute enumerated the benefits of rail investment in “Rail Transit in America: A Comprehensive Evaluation of Benefits” (6). Litman did not create a typology but listed benefits with supporting documentation. The benefits identified in Litman’s report were the following. Increased Transit Ridership and Decreased Automobile Traffic Rail attracts a larger percentage of choice riders than bus; therefore, it is effective in reducing automobile traffic. Supporting documentation includes: • Incremental increases in rail service results in about eight times more shift to transit
for commute purposes than the same incremental increase in bus service. • Transit mode share losses between 1970 and 2000 were 20 percent to 23 percent in
rail cities compared to 60 percent in bus-only cities. • Transit engenders land use changes, particularly transit-oriented development
(TOD). Research indicates that transit use increased in 103 TODs between 1970 and 2000. Further, households in TODs have lower per capita automobile ownership and lower annual vehicle miles traveled in their vehicles than the average household in their region.
Congestion Impacts Cities with significant rail systems have a slower rate of per capita congestion growth than cities with small rail or no rail. Traffic volume and congestion are non-linear. On highways, traffic can maintain high speeds over a broad range of traffic densities. However, when densities reach and exceed design levels, speeds drop suddenly. Therefore, it is possible for relatively small reductions in traffic volumes to generate large improvements in speed. Supporting arguments include the following (6): • Increases in rail mileage reduce congestion costs while increases in bus mileage
increase congestion costs based upon regression analyses conducted by The Brookings Institute.
• When major rail systems fail, the congestion level on highways and arterials increases. By inference, that incremental increase reflects the congestion reduction impact of the transit system.

13
Cost Effectiveness Litman (6) argues that most analyses comparing rail, bus, and automobile costs are biased in favor of auto travel because many costs associated with auto travel are ignored or are not borne by the government, while transit costs are usually very clearly enumerated in agency financial documents. Road and Parking Cost Savings These are a sub-set of the benefits associated with reducing traffic congestion and automobile ownership. There is no objective support for this savings category, although Litman does estimate cost savings in large rail and small rail cities by converting rail passenger-miles into equivalent avoided roadway and parking costs. Consumer Financial Impacts Persons in rail cities spend less annually on transportation than persons in cities with bus-only transit. The Bureau of Labor Statistics reported in 2003 that residents of large rail cities incurred annual per-capita transportation expenses of $2803 (excluding New York City) compared to about $3350 in small rail and bus-only cities. Residents of the large rail cities also enjoyed a 7 percent higher average annual income and have longer commutes, which would typically increase the total cost of transportation. Thus, the investment in rail results in a lower portion of household income going to transportation. Safety Impacts Accidents result in property damage, medical, and legal costs. Litman used FTA accident data and plotted traffic fatality rates against annual per capita transit passenger-miles. The graph (Figure 4) indicates that as annual per capita transit passenger-miles increase, fatality rates decrease. Further, the cities with the highest per capita transit passenger-miles were large rail cities. Large rail cities enjoy a lower crash fatality rate than other cities. This relationship also exists among a dataset including European, Canadian, and Australian transit systems.
Figure 4. Traffic Fatality Rates versus Transit Utilization.

14
Energy and Emission Reductions Rail transit achieves energy use reductions and lowers emissions in two ways. First, rail transit consumes less energy (in British Thermal Units of BTU) per passenger-mile than bus or automobile traffic (Figure 5). Electrically powered trains have extremely low emissions compared to diesel or gasoline vehicles. Second, since rail transit reduces congestion, it leverages even further reduction in fuel use and emissions associated with non-rail travel.
Figure 5. Energy Consumption by Mode.
Economic Benefits Many of the economic benefits listed in the Litman report are redundant, tying back to benefits already documented (i.e., roadway and parking savings). New benefit areas include the following: • Increased property values: Rail generally results in an increase in property values
around station areas. • Community redevelopment: Rail serves as a catalyst to renewal of communities in
proximity to rail since the increased accessibility of those areas makes them more attractive.
Other Benefits Litman includes a list of ancillary benefits that rail can achieve, including the following: • Improving accessibility for non-drivers; • Avoiding the need to be chauffeured; • Providing people an option that they might not currently need but may need in the
future; • Creating a more livable community; and

15
• Improving public health due to the need to walk or cycle to connect to transit. Litman’s list of benefits can fit into the typology suggested by Lewis and enrich it. Table 3 arrays the benefits enumerated by Litman against the study typology.
Table 3. Benefit Typology.
Benefit Typology Increased transit ridership and decreased automobile traffic Transportation Congestion impacts Transportation Cost effectiveness Transportation Road and parking cost savings Transportation Consumer financial impacts Social Safety impacts Transportation Energy and emission reductions Transportation Increased property values Economic Community redevelopment Economic Improving accessibility for non-drivers Social Avoiding the need to be chauffeured Social Providing people an option that they might not currently need but may need in the future
Social
Creating a more livable community Economic Improving public health Economic In summary, general research on rail impact has identified a range of possible transportation, social, and economic impacts. These impacts are summarized as follows: • Transportation: Rail encourages increased transit usage and is more attractive to
choice riders than bus service. Increased transit utilization may lead to reduced traffic congestion, reduced air pollution, reduced fuel use, and improved traffic safety.
• Social: Rail provides an economical alternative, allowing people to reduce the percentage of their household budget required for transportation. Further, those who are unable physically and fiscally to use a car have convenient transportation.
• Economic: Rail projects have led to increased property value.
RAIL IMPACTS: PROJECT PLANS AND REPORTS The planning requirements associated with receiving federal funding for a rail project establish a list of impacts that must be estimated for any rail project that depends upon federal funding. Although the FTA can pay up to 80 percent of capital costs, competition for scarce federal dollars has resulted in local entities providing an “overmatch” in order to increase their project’s competitive position. An overmatch means that the project will incorporate more than the 20 percent local share for their rail project; a de facto standard has been 50 percent local funding with 50 percent federal funding. Attaining and retaining public support is therefore an increasingly important part of rail implementation and funding. Local entities, including transit agencies, regional planning agencies, and departments of transportation have prepared planning documents and post-implementation evaluations that contain project impact analyses. Appendix A contains a
16
matrix of impacts associated with both individual project plans and with general planning documents that have been discussed above. As noted, general transportation impacts have been difficult to isolate in the face of rapid population and employment growth in communities building rail. The FTA, in fact, does not use congestion reduction as a measure to evaluate rail candidate projects, but rather isolates the benefits to transit users. While there have been global analyses such as the Litman study discussed above, individual project reports do not tend to look at regional mobility impacts as an evaluative criterion. Research is focused on how well the rail attracts new riders and increases mode share. Social impacts are given even less attention than transportation impacts in the research. However, ignoring social impacts may prove dangerous. In 1994, the Los Angeles Metropolitan Transportation Authority (LAMTA) was sued for discriminatory application of federal funds. LAMTA opened its first rail line, the Long Beach Blue Line in 1990. In order to increase ridership on the Blue Line, LAMTA began eliminating bus routes along parallel corridors and forcing former local riders onto the rail. A proposal to increase fares and eliminate monthly passes that were heavily utilized by local bus riders was the catalyst to filing of the suit. The Bus Riders Union formed in 1992 to fight a two-tier transit system. The 1994 suit filed by the National Association for the Advancement of Colored People claimed the following: • The LAMTA was spending 70 percent of its operating subsidy dollars on rail, which
was serving only 6 percent of its riders. • Bus riders were comprised of ethnic minority population (81 percent of riders were
Black, Hispanic, or Asian) and poor people (60 percent having incomes below $15,000 annually).
• Over the previous ten years, LAMTA reduced their peak bus requirement from 2200 to 1750 and now subsidize rail users eighteen times more than bus riders (6).
A federal district court found that the LAMTA had indeed been inequitable in its use of federal funds. In a consent decree in 1996, LAMTA was directed to invest a total of $1 billion over 10 years to enhance the bus system (7). These enhancements have included development of Bus Rapid Transit (BRT) lines. The BRT project combines infrastructure, routing, and traffic operations improvements in corridors to create a bus line that operates similarly to a light rail line. This lawsuit was the first time Title VI of the Civil Rights Act of 1964 was used to change a transit operator’s operating and capital planning and implementation processes. As a result of the lawsuit, the Southern California Association of Governments developed a detailed methodology for evaluation of transportation equity in future plans.
17
Economic and Developmental Impacts The largest body of research on project-specific rail impacts is associated with economic and developmental impacts. There are two basic approaches to the majority of these analyses—hedonic modeling and matched pair comparison. While being capable of producing similar results, these two methods use substantially different research approaches. Residential and commercial properties are heterogeneous in nature having many physical characteristics, such as lot size, size of improvements, number of bathrooms, parking/garage features, proximity to transit rail services, and other factors. In addition, there are psychometric attributes such as crime rates, architectural features, and particular neighborhoods that also contribute to the market value of real estate. Hedonic modeling estimates the relative average impact any attribute contributes to property valuations while statistically holding all other variables constant using one of several mathematical forms of a multivariate regression equation. Hedonic modeling is very data intensive, meaning that it requires very large data sets, with each variable being accurately measured. In addition, failure to include even one or two meaningful characteristics in the model can potentially bias the results of the analysis. However, when executed properly hedonic modeling offers a lot of information about the relative contribution of property characteristics on the value of real property. Matched pair comparison also controls for the heterogeneous nature of real property valuations, but uses a research methods approach for isolating the contribution of a particular characteristic, such as proximity to a transit rail station. In this approach, the study sample or census of properties is divided into paired groups with each pair sharing similar market characteristics with the exception of the presence of a nearby transit rail station. It is assumed that the similar market characteristics balance each other out leaving the presence of rail transit to explain average valuation differentials between the control group (matched pair) and the experimental group (properties close to a transit rail station). The method requires careful matching for the control-group properties but does not require gathering data specifically defining the value of each characteristic for every individual property in the study area. In practice, while the matched pair comparison approach does not allow the analyst to explicitly compare the impact of rail transit versus a particular other attribute, such as lot size, it does produce similar overall results to hedonic modeling while being less vulnerable to measurement error and bias from leaving important characteristics out of the model. The University of North Texas conducted assessments of the impact of DART’s rail system on property values. One assessment used the hedonic modeling technique and the other used the matched pair technique. In addition, an analysis of transit-oriented development (TOD) used a more traditional research methodology. A brief description of each follows. DART Rail Case Study: Hedonic Modeling In determining the economic impact light rail has on surrounding real estate, the statistical tool of a hedonic model is very useful as it allows for the separation and
18
analysis of specific attributes associated with real estate properties. With this specificity, a hedonic model can be designed to estimate the impact location relative to light rail (and transit stations) has on property value. In 2007, the hedonic price approach was taken to evaluate the impact the DART light rail system had on real estate values in Dallas County (8). Twenty-three station areas and 18,164 properties within 3,000 feet from their respective transit stations were included in the study area. Properties included in the study area were limited to single-family residences (SFR) and multi-family residences (MFR). Multi-family residences were limited to duplexes or condominiums; no rental properties (apartment buildings) were examined. A handful of stations in Dallas’ Central Business District (CBD) and ones in Collin County were not included. In the case of the CBD, too many other factors outside of transit development were found to have influenced property values, while in Collin County, properties were subject to different accounting procedures in terms of assessments. Once the study area was established, property valuations were assessed via the Dallas County Central Appraisal District and distances from the rail line and transit stations were established for each property through spatial analysis afforded by GIS software. The next step in analysis looked at the study area in terms of Dallas County’s large geographic footprint. On closer examination, the study area could be broken into four corridors, each with differing housing composition and a portion of either the Red or Blue DART Rail lines: North Central Corridor (NC-Red), Northeast Corridor (NE-Blue), Southwest Corridor (SW-Red), and South Central Corridor (SC-Blue). The northern corridors were distinguished by many station areas and comparatively lower numbers of residential dwellings. Land use patterns were dominated by commercial and industrial concerns. In contrast, the southern corridors have fewer stations, but are predominantly residential in nature and occupy a smaller geographic area than the northern corridors. Size, value, and quality of housing also vary between the northern and southern corridors. Homes in the northern corridors are generally larger, valued higher in terms of $/ft2, and have higher CDU (condition, desirability, and utility) appraisal ratings than ones in the southern corridors. Additionally, along with housing variations, the income levels of a corridor’s population were analyzed. It was found that income levels mirrored the distinct housing variations between the northern and southern corridors with southern corridors consisting of a lower income population in comparison. After analyzing the study area and constructing hedonic models to address each variable’s impact on housing value, a complete picture of how the DART light rail system affected housing values was developed. Looking first at proximity to rail line, there was a consistent negative impact on all properties. The gradient range was a loss of $50 to $104 in property value for every 30 feet closer to the rail line. MFR housing withstood the greatest financial impact, while SFR property values fared slightly better. The opposite was found to be the case when considering transit stations. The gradient range was a gain of $31 to $77 in property value for every 30 feet closer to a transit

19
station. The disparity between MFR and SFR housing was not as pronounced in this model. When further analysis was completed, slight variations within the four corridors were discovered. Across the board, property values in the northern corridor (where there is a dominance of MFR housing) increased the closer to a transit station; this was not uniformly true in the lower income, southern corridors where subtle variations were encountered. However, when controlling for three especially economically distressed station areas, it was found that the lower income SC-Blue Corridor actually had the highest appreciation rates in all four corridors. The findings of this study are in line with similar research completed on other LRT systems across the country. It should be noted, though, that the gradients were weaker for DART than in other metropolitan areas. This may be due to the fact that the DFW area, while quickly adapting to rail transit, is still predominantly an auto-centric culture with access to extensive highway infrastructure. DART Rail Case Study: Matched Pairs When considering real estate valuations, a study was completed in 2002 to ascertain whether or not the DART light rail system affected real estate values near its transit station locations (9). To accomplish this, a matched pair comparison analysis was utilized. The first step was to determine the study area analysis. All properties within 0.25-mile radii around 23 stations outside of Dallas’ Central Business District were selected. Those stations (and their corresponding radii) inside the CBD were not considered as the amount of tax increment financing in that area was thought to be potentially damaging to the statistical integrity of the analysis. Once the study area was established, a corresponding control area, with 23 matching locations, was developed. For both the study and control areas, property values were obtained for each property via the Dallas County Appraisal District for the years 1997 and 2001. Median property valuations were assessed and the following was observed. Between 1997 and 2001, the medial value of residential properties in the light-rail study area increased 32.1 percent while properties in the control group only saw a 19.5 percent increase. For office properties, the study area increased 24.7 percent while the control group only rose by 11.5 percent. For industrial properties, only a negligible difference between the study and control groups was apparent. These findings are similar in nature to those from across the country that point to real estate valuations being higher when closer to a transit station. DART Transit Oriented Development Impacts Fiscal impacts resulting from light rail transit deal primarily with the resulting effects of transit-oriented development taking place primarily at transit stops. The DART light rail system has been leveraged successfully for TOD opportunities resulting in significant fiscal impacts on the jurisdictions surrounding many DART transit stations. In 2007, a study was completed to measure these impacts. A several step process was used with the

20
initial step consisting of data gathering. By using secondary sources such as newspapers, business and trade publications, websites, and personal communication with key informants, a matrix was constructed listing all projects that were either announced, under construction, or finished in conjunction with DART Rail TOD locations. Accepting that the possibility existed for a project to be overlooked, the further step was taken of analyzing DART Rail TOD locations through visual means. By utilizing an online mapping tool provided by the Greater Dallas Chamber of Commerce, aerial photographs of DART Rail TOD locations from 1997 to 2005 were examined. Any structures that appeared in the 2005 photos that were not apparent in the 1997 photos were then noted, checked against the existing matrix of projects, and if not accounted for, were then subject to direct field observation in order to further detail the project. Once all structures were accounted for and documented, the next step consisted of deciding which projects “would have happened anyway.” This process examined each project for a direct tie to a DART Rail TOD location. In the case of a standalone, big box retail store such as Best Buy being built in proximity to a “kiss and ride” station, that project would be stricken from the matrix as not being a direct result of TOD. Conversely, a project like the W Hotel in the Victory Park development of downtown Dallas was assessed and found to have a partial link to the adjacent DART Rail TOD project. Discussion with a representative of the hotel found that the nearby transit station did aid in employee recruitment and retention, but had no impact on the guests or residents. In this instance, the value of the project was reduced to a third of what was published. Once the matrix of TOD activity was completed with values assessed for each project (announced, in development, completed), the final step was to assess the taxable value of the properties. By using information provided by county appraisal districts, assessments were made for the amount of tax revenue that would be generated by taxes related to real property as well as business personal. In addition, consideration was given to the amount of sales tax that would be generated by the retail aspects of the projects considered. This methodology yielded the following results. • The total value for all current and projected TOD projects near DART Rail stations is
estimated at $4.9 billion. • After considering projects that “may have happened anyway” and were not directly
attributable to the presence of DART Rail, the figure was adjusted to $4.26 billion. • After further adjusting for tax exemptions and the value of public buildings,
$2.84 billion is the resulting tax base from which to make estimates. Based on this figure, potential yearly property tax revenues include $6.6 million for Dallas and Collin counties and $16.8 million for DART member cities. Area school districts may gain over $46 million each year in new revenues. Community college districts in Dallas and Collin counties would benefit from $2.3 million per year, while Parkland Hospital may benefit from $6.7 million in new revenues yearly. When all retail components of the TOD projects were considered and analyzed using a standard fiscal
21
planning model, $660 million in annual taxable retail sales was projected. These sales will produce more than $48 million in sales tax revenue for local municipalities and the State of Texas. In total, more than $127 million yearly in state and local tax revenue will potentially be raised by DART Rail TOD projects. As demonstrated, there are sizable economic impacts relating to the DART light rail system and the corresponding TOD projects it fosters. Both in terms of real estate valuations and fiscal concerns, DART Rail is a positive catalyst in Dallas and Collin counties. The speed at which these economic impacts have grown is telling of a broader picture. In 2005, a study considering the fiscal impacts of DART Rail TOD projects yielded announced and estimated values 50 percent lower than what the recent 2007 study found. Granted, some of the discrepancy may be due to research techniques, but such a large increase in values in just two years is more likely indicative of the fact that TOD projects in North Texas are being announced and started in an accelerated fashion. “Riding the rails” is more and more a part of the social fabric of North Texas and the built environment is following suit. Through qualitative research performed for a previous study, it was found that local governmental representatives are looking at TOD as a way to stimulate local growth, especially in aging, downtown core regions. It is important to keep this focus while the state continues to look at ways to facilitate efficient public transportation systems. As evidenced by this DART Rail case study, light rail needs to be considered not only as a key to long-term regional growth in Texas, but also as a way to financially benefit both local municipalities and the state via TOD projects. Commuter Rail and Economic Impacts In America, there are far more miles of commuter rail than light rail, yet most studies concerned with rail transit impacts on real estate valuation are concerned with the effects of light rail. Beginning in the early 1980s with a light rail system, the “Trolley,” which now encompasses 47 miles of track, San Diego County developed successful versions of both modes of rail transportation. In 1996, the commuter rail line the “Coaster” began full-service operations with its 43-mile trip from the wealthy northern community of Oceanside to downtown San Diego. During its first year of operation, the Coaster transported 700,000 riders; by 2006, ridership increased to 1.5 million boardings. Even with the success of commuter and light rail in San Diego County, economic impact studies completed concerning the area have only looked at light rail. Not until 2003 was the commuter rail line analyzed for its economic impact on the region, the specific impact being effects of transit rail and stations on adjacent housing valuations (10). As with many studies concerning transit and housing valuations, the hedonic price approach was taken, and several hedonic models were created. This statistical tool allows for the separation and analysis of specific attributes associated with real estate properties. With this specificity, a hedonic model can be designed to estimate the impact location to commuter rail (and stations) has on property value. The study area was limited to transit stations only and quarter to half mile radii around them. The creation of the radii was facilitated by utilizing GIS technology for spatial analysis.

22
Property information was culled from Metroscan, a proprietary database available from First American Real Estate Solutions. The database records information on all real-estate transactions recorded by county assessors on a monthly basis. Both residential and commercial properties were considered with single-family residences, multi-family residences, condominiums, and commercial properties all addressed in a separate manner statistically. The number of parcel records examined in the study area was 26,295. Along with pr ice information, attributes considered included structure size, year built, accessibility to employment opportunities for residential properties, and accessibility to households for commercial properties. Once the study area was fully defined and the hedonic price models developed, results for several different categories were compiled. For multi-family residences, which were predominantly apartment complexes, closer proximity to a Coaster station resulted in a negative effect on price. This negative association between location and price might exist due to commuter rail primarily serving professional workers who often own their own dwellings, leaving rental properties at a competitive disadvantage. Condominiums help support this line of reasoning as higher premiums were associated with increasing proximity to a Coaster rail station. The average value-add was approximately $85,000. Similar results were found in terms of single-family housing. Properties within a half mile of Coaster stations gained in value significantly. On average, the value-add for a single-family residence was $78,000. Results regarding commercial properties were mixed. While proximity to a downtown Coaster station was positively reflected in commercial property premiums (91.1 percent), locations within a half-mile radius of non-downtown Coaster stations reflected a negative correlation with proximity to station. This disparity possibly exists due to the fact that the Coaster is providing transportation for a professional workforce commuting from an upscale community to downtown office buildings for work. SUMMARY Rail systems have resulted in documented transportation, social, and economic impacts. Transportation impacts are often masked by heavy growth in corridor traffic and latent travel demand. Modeling is an important tool that enables measuring the real transportation impacts of rail projects. Rail systems expand mobility and reduce household investment in transportation. However, as regions implement rail systems, they must take care to consider the full range of rider impacts so that environmental justice issues do not emerge. The largest body of research relates to the economic impact of rail. These impacts are strongest in station areas, as access to rail increases property value on nearby property. The positive impact of rail on property values does not hold true for property directly adjacent to the rail line however.
23
SECTION 3: RAIL AND THE ROLE OF DEPARTMENTS OF TRANSPORTATION
The research team sought to identify the various strategies, roles, and organizations that state Departments of Transportation may engage in to support passenger rail. In particular, the team examined the participation of state DOTs in the support and development of light rail and commuter rail. Light and commuter rail projects are typically developed within highly urbanized areas where population and employment densities can support high capacity transit services. Light rail projects initially develop in the urban core. The Metropolitan Planning Organization (MPO) and local transit authority therefore lead the associated planning and development activities. Construction and operation are governed by local municipal zoning and permitting requirements. In these instances, the role of state DOTs in light rail is minimal (with the exception of states with statewide transit such as Delaware). If the light rail interfaces with state facilities, the state DOTs will have a design review/approval role as they would in any infrastructure project. State DOTs also have safety oversight responsibility for light rail projects. As light rail systems mature, services extend out from the core base and reach into suburban areas. The characteristics of the light rail often change to reflect the change in development patterns and densities. For example, the distance between stations is usually longer in the suburban areas of a light rail line than in the core areas. Commuter and intercity rail with suburban service has even greater spacing between stops. Commuter rail stations are also more likely to have park and ride lots at the stations because they act as collection points for areas even farther from the urban central business district. Further, commuter and intercity rail is designed to meet regional needs and typically serve multiple jurisdictions. Therefore, state DOTs are more likely to have an interest in these projects than in light rail projects. RELEVANT STATE DOT ROLES To identify relevant practices, the research team screened all of the states in continental North America with existing or planned light rail or commuter rail. There are 21 LRT systems in 16 states with an additional 10 light rail systems proposed. There are 20 commuter rail systems in 16 states, with an additional 17 commuter rail projects proposed. The states where commuter and/or light rail systems are neither in existence or proposed were excluded from the comparisons. Although many of these states have intercity rail service with Amtrak, the service is often too dissimilar to commuter and light rail efforts related to this research project. A comparison on state DOT involvement in intercity rail was examined in TxDOT Research Project 0-4723 on state-supported intercity passenger

24
rail corridors (23). This report offers valuable profiles of state DOT organization used in rail development. Some states have what is commonly referred to as statewide transit. These are the northeastern states of Delaware, Maryland, and New Jersey. In Massachusetts, the Massachusetts Bay Transportation Authority (MBTA) is under the direction of a board chaired by the state’s transportation secretary and approximates the same statewide transit model in many ways. For states with statewide transit, the state DOT’s role is unique in that the state DOT owns and operates the public transportation system within the state. In this type of governance, transit operation is one of the state DOT’s core functions. In contrast, most state DOTs do not own or operate the local and/or regional public transportation systems. This transit role by a statewide DOT contrasts with the transit role of many other state DOTs (including Texas). Statewide transit can provide greater opportunities for a state DOT to coordinate, plan, and develop rail transit. Other northeastern states such as New York and surrounding New England states did not offer relevant examples for DOT rail involvement based on their very dissimilar demographic characteristics and transportation system size differences to Texas. States where DOT involvement methods in commuter and light rail were more transferable to TxDOT occurred generally in the south, southwest, and western states. The descriptions below represent a range of state DOT involvement in light rail transit, commuter rail, and intercity passenger rail. In most cases, an example state, region, or organization is provided within each general description. State Operated Transit –Transit as a Core DOT Function As mentioned above, statewide transit occurs in Delaware, Maryland, and New Jersey. Although this type of organizational structure is much different than the prevalence of urban and metropolitan transit agencies in Texas, the prominence of transit within a state DOT provides for more integrated transit planning in the overall statewide transportation system planning process.
• The Delaware Transit Corporation is a division of the Delaware Department of
Transportation and operates DART First State public transportation service. • The Maryland Transit Administration is a subdivision of the Maryland Department of
Transportation led by the state’s transportation secretary. • New Jersey Transit is a state corporation where the transportation commissioner
serves as chairman of the board for New Jersey Transit’s board of directors. Statewide Rail Agency Statewide rail agencies are separate agencies from the state DOTs. These types of agencies typically promote, plan, and fund freight and passenger rail across their state. In the case of the Commonwealth of Virginia, the Rail Division of the Virginia Department of Rail and Public Transportation (VDRPT) plans and funds rail projects. The VDRPT is

25
a separate state agency from the Virginia Department of Transportation (VDOT). VDRPT is charged by the state to plan for freight and passenger rail as well as non-rail modes of public transportation. VDRPT completed and published both a state rail plan and a rail needs assessment during 2004. State DOT Rail Division State DOT rail divisions are a part of the state DOT, as opposed to the separate entity described as a statewide rail agency. The Division of Rail within the California Department of Transportation (Caltrans) coordinates the state-supported intercity passenger rail program in the state of California. Through Caltrans, the State of California provides capital grants and support for station and track improvements (including signaling), locomotives and cars, connecting Amtrak bus service, and operating assistance for three corridors: The Pacific Surfliners, the San Joaquins, and the Capitols. California was one of the first states to partner and fund Amtrak intercity service along congested corridors. State-Level Rail Passenger Program The Georgia Rail Passenger Program is an example of a state DOT partnering with separate organizations to promote and support rail initiatives. The Georgia Rail Passenger program is a joint program of the Georgia Department of Transportation (GDOT), the Georgia Rail Passenger Authority (GRPA) and the Georgia Regional Transportation Authority (GRTA). The aim of the program is to revive rail passenger service in Georgia using existing railroad corridors to the maximum extent possible. Regional Transit Districts and Authorities A regional transit district or authority is typically comprised of several cities and/or counties in a single metropolitan area. The district typically has some form of taxing authority to fund projects. These authorities are multimodal and include passenger bus rail and commuter services. The role of the DOT in these types of organizations is frequently a reserved board member seat to ensure regional and/or statewide coordination and consultation goals are met.
The Utah Public Transit District Act of 1969 allows individual communities to address transportation needs by forming local transit districts. The Utah Transit Authority (UTA) was founded in March 1970 when the cities of Sandy, Salt Lake, and Murray voted to form a transit district. UTA’s service area is over 1,400 square miles and covers six counties. UTA is governed by a 16-member Board of Trustees appointed by the member city and county governments that fund UTA with a local option sales tax. One ex-officio seat is reserved for a member of the State Transportation Commission, which is part of the Utah Department of Transportation.
Regional Rail Authorities Regional rail authorities are similar to transit authorities except their focus is usually on intercity and commuter rail service. Recently, Florida passed legislation that transformed the Tri-County Commuter Rail Authority into the South Florida Regional Transportation

26
Authority (SFRTA), expanding its mission from a commuter rail-focused agency to a broader multimodal regional transportation authority. In the case of SFRTA, the Florida DOT has a seat on the governing board and the DOT’s role consists of contributing project funds, financial compliance and oversight with respect to grants and administration, and project coordination. Interstate Authorities Interstate authorities are similar to most other rail or transportation authorities where the metropolitan service area stretches across state boundaries. One of the largest of these is the Port Authority of New York and New Jersey which operates ports, airports, and rail transit. The Port Authority is one of several partners in the New York Transportation Federation that also includes the New York DOT, New York State (NYS) Thruway Authority, NYS Bridge Authority, NYS Department of Motor Vehicles, New York City Department of Transportation, and Metropolitan Transportation Authority. In this case, the DOT is a peer organization to the Port Authority within the Federation. Regional Mobility Authorities The Texas Legislature authorized the creation of Regional Mobility Authorities (RMAs) in 2001 under Senate Bill 342. RMAs are a political subdivision formed by one or more counties to finance, acquire, design, construct, operate, maintain, expand, or extend transportation projects. RMAs can also build, operate, and maintain passenger and freight rail, along with many other modes and transportation projects. For some regions, the RMA provides an opportunity to pursue transportation projects important to their region. RMA board members may not be employees of TxDOT. The Texas Transportation Commission has oversight responsibilities of RMAs, and may: • authorize creation of RMAs; • approve projects connecting to the state highway system or rail facility; • establish design and construction standards for projects connecting to the state
highway system or rail facility; • establish audit and reporting requirements; • establish ethical standards for directors and employees; • authorize RMAs to enter into contracts with Mexico; • approve addition or withdrawal of counties; • approve dissolution of an RMA; and • approve RMA applications for federal highway or rail funds. Joint Powers Agreement/Authorities A joint powers agreement is a contract between a city, a county, and/or a special district in which the city or county agrees to perform services, cooperate with, or lend its powers to the special district or authority. Several rail initiatives used this kind of multi-agency agreement. The strength of a joint powers agreement is that the various transportation development partners can contribute their individual strengths and assign governmental functions to one collaborative organization.

27
For example, the Northstar Corridor Development Authority (NCDA) is a joint powers board made up of counties, regional railroad authorities, cities, and townships along the 82-mile Northstar Corridor that runs along Highways 10 and 94 from downtown Minneapolis to St. Cloud/Rice. Most of the counties, cities, and townships provide funding support, but other members have administrative and technical responsibilities. NCDA has an executive committee consisting of five members responsible for approving invoices within approved contract amounts, addressing personnel issues, and performing other duties set forth in NCDA’s bylaws. The NCDA’s purpose is to “analyze the feasibility and environmental impacts of integrated transportation improvements along the Highway 10 Corridor, including highway improvements, commuter and freight rail, recreational trails, safety, and related land issues.” The Minnesota Department of Transportation (Mn/DOT) and the NCDA studied transportation options for the corridor and recommended commuter rail. This corridor’s projected capital cost is $289 million that includes 50 percent federal, 33 percent state, and 17 percent local contributions. The Anoka County Regional Railroad Authority (ACRRA) is a member of the NCDA and a component of Anoka County (also a member of NCDA). ACRRA is the lead agency in efforts to develop major transportation initiatives in Anoka County, including the Northstar commuter rail line, and has been involved in contracts relating to the Northstar Corridor project. Anoka County is responsible for the accounting and monitoring of the ACRRA. ACRRA is governed by a seven-member board consisting of the Anoka County Commissioners and has the power to levy taxes, issue bonds, and enter into contracts. Mn/DOT monitors all NCDA contracts that utilize federal and state funds for the Northstar Project. Such contracts include consulting, engineering, studies, design, legal contracts relating to the development of the Project, and contracts relating to public involvement. Another example of a joint powers agreement is the Capitol Corridor Joint Powers Authority (CCJPA) in Northern California for the Interstate 80 Corridor from San Jose to Sacramento. The CCJPA manages operations and infrastructure planning for the Capitol Corridor trains on behalf of Caltrans. Local control has increased ridership and service levels compared to previous operations that were managed at the state level. The state remains an active funding, planning, programming, and purchasing partner in the authority but gives control to the local agency. Cooperative, Interagency, and Interlocal Agreements A cooperative, interagency, or interlocal agreement may be made between transportation authorities to pool and/or share transportation resources for the purposes of providing a service or project. State DOTs frequently enter into agreements with local transit authorities for studies or services.
28
The Trinity Rail Express is an example of a cooperative agreement between two transit authorities. It was established by an interlocal agreement between DART and The Fort Worth Transportation Authority (The “T”). Each transit authority owns a 50 percent stake in the joint rail project and contracts operations to the Herzog Transit Services. Commuter Rail Districts A rail district is typically established for the development and operation of rail within a single specific corridor or line. Two examples of rail districts are provided—one old and one new. In 1977, the Indiana General Assembly created the Northern Indiana Commuter Transportation District (NICTD) to rescue the ailing South Shore line as it was known. The South Shore line railroad had been operated by various private owners since the 1900s. The line runs along the south shore of Lake Michigan connecting Northern Indiana and Chicago. The purchase was funded with contributions from Indiana, Illinois, and the federal government. These actions rescued the South Shore from the brink of discontinuance. NICTD is governed by an 11-member Board of Trustees representing the four Indiana counties served by the South Shore Line as well as three representatives appointed by the Governor. The Indiana Public Mass Transportation Fund (PMTF) provides NICTD with an annual set-aside percentage (12.34 percent) of the total PMTF amount available ($35.6 million in 2008 in the PMTF) for operating and capital needs. NICTD is the owner/operator of the South Shore rail passenger service. The PMTF is a dedicated revenue fund created by the 1980 Indiana General Assembly to assist public transportation in the state. The PMTF receives 0.76 percent of the state’s 6 percent general sales and use tax. The Indiana Department of Transportation administers the fund. The Austin-San Antonio Inter-city Commuter Rail District is a relatively new rail district for the purpose of planning regional commuter rail service along the Union Pacific (UP) Corridor between Austin and San Antonio that currently carries UP freight and Amtrak trains. Passenger service on these tracks could eventually connect Georgetown, Round Rock, Austin, Buda/Kyle, San Marcos, New Braunfels, and San Antonio. The Rail District has made applications to the federal government to provide future funding for the design, engineering, and construction of a passenger rail system for the Austin-San Antonio Corridor. TxDOT, the City of Austin, and the City of San Antonio initiated a commuter rail study of the corridor in 1999. Subsequently, the District was formed. The District’s board of directors is composed of elected and private sector officials who represent the following member cities and counties: • Capital Area Metropolitan Planning Organization; • San Antonio-Bexar County Metropolitan Planning Organization; • Capital Metropolitan Transportation Authority; • VIA (San Antonio) Metropolitan Transit;

29
• Capital Area Rural Transportation System; • Alamo Rural Transit; and • Representatives of small cities, business communities, and the public. TxDOT does not have representation on the District’s board.
Multi-State Rail Initiatives The Midwest Regional Rail Initiative (MWRRI) is an example of a multi-state collaboration by several state departments of transportation that has been used to develop the needs for passenger rail in Missouri. The MWRRI is a collaborative effort among nine Midwest states (Illinois, Indiana, Iowa, Michigan, Minnesota, Missouri, Nebraska, Ohio, and Wisconsin), Amtrak, and the Federal Railroad Administration. Another example of a multi-state rail initiative is the Pacific Northwest Corridor (PNWC). Intercity passenger rail programs, development, and operations along the PNWC are supported by the Rail Office of the Division of Rail and Public Transportation at the Washington State Department of Transportation and the Rail Division of the Oregon Department of Transportation. These two states are working jointly to make capital and operational improvements to the freight rail corridor between Eugene, Oregon, and Vancouver, British Columbia, via Seattle, Washington. Flexible Funding State DOTs can exercise flexibility using a number of funds, most significantly Surface Transportation Funds (STP), for either highway or transit projects. The most common uses of “flexed” funds have been for the purchase of vehicles such as buses and rail cars. For example, Virginia state law mandates that a percentage of its flexible funding be used for public transportation. Congestion Mitigation and Air Quality (CMAQ) Program funds are also able to be “flexed”; however, these funds are sub-allocated by formula to MPOs and not directly under state DOT control. CMAQ funds are frequently used for transit projects by local authorities. State Supported New Starts Program FTA will typically fund no more than half the capital cost of new starts projects and typically favors projects where the non-federal share of the costs is significantly greater than half. Demonstration of a strong local financial commitment is a key factor in securing FTA funding. By increasing the local share with state matching funds, a state can improve the ranking of a local or regional project when competing for Federal New Starts Program.
The Florida New Starts Program (NSTP) provides transit agencies with up to a dollar-for- dollar match of the local (non-federal) share of project costs for transit fixed-guideway projects and facilities that qualify under the FTA New Starts Program. Eligible projects include rail transit and bus rapid transit (BRT) systems. The Florida NSTP allows transit projects from that state to have a competitive advantage relative to other projects nationally. (This program also allows a dollar-for-dollar match of local funds towards project costs for projects funded with state and local funds only.)
30
Statewide Transportation Planning State DOTs are required to prepare a statewide transportation plan. The statewide plan and the statewide planning process involve a range of required activities including: a plan document, a planning process, public involvement, and a statewide transportation planning program. The range of statewide plans and planning processes vary greatly among state DOTs because there has been great flexibility provided in past and current federal planning guidance and rules. As a result of this flexibility, opportunities for involvement by state DOTs in commuter and rail transit are available through the statewide planning process and statewide plan development. Statewide Corridor Planning The statewide planning process in some states uses a combination of multiple corridor visions and plans. For example, the Colorado Department of Transportation (CDOT) developed 350 corridor vision plans with the involvement of local entities. Some of the CDOT corridor visions include goals for passenger rail. Statewide Passenger Rail Planning Many statewide plans address specific modes such as passenger rail. In addition to local corridor visions mentioned above, CDOT statewide plan contains a statewide passenger rail planning element. One corridor planning example is The North Front Range Feasibility Study that examined transportation alternatives for the corridor, including passenger rail. The Study was jointly funded by CDOT, The North Front Range Transportation and Air Quality Planning Council, The Upper Front Range Regional Planning Commission, and the Denver Regional Council of Governments. In another example, The Texas Rail System Plan describes the existing rail conditions and the role rail plays in statewide transportation planning. Statewide Rail Corridor Preservation State DOTs have been preserving rail rights of way to protect rail corridors from encroachment and limit incompatible land use. State DOTs have been developing inventories of rail assets and identifying abandoned routes. In New Jersey, these inventories are used to develop plans to reinitiate transit and freight service. Numerous states (Table 4) and cities are involved in preserving rail corridors, purchasing abandoned rail lines or shared rights, and supporting rails-to-trails conversions. As noted in NCHRP 374 (13), North Carolina, Ohio, and Pennsylvania have a long and successful history of rail corridor preservation. Other states with corridor preservation efforts include New York, California, Illinois, Indiana, Minnesota, Washington, and Wisconsin. Other states and cities are involved in preserving rail corridors purchases of abandoned rail lines or shared rights and rails-to-trails conversions (also see NCHRP 374).
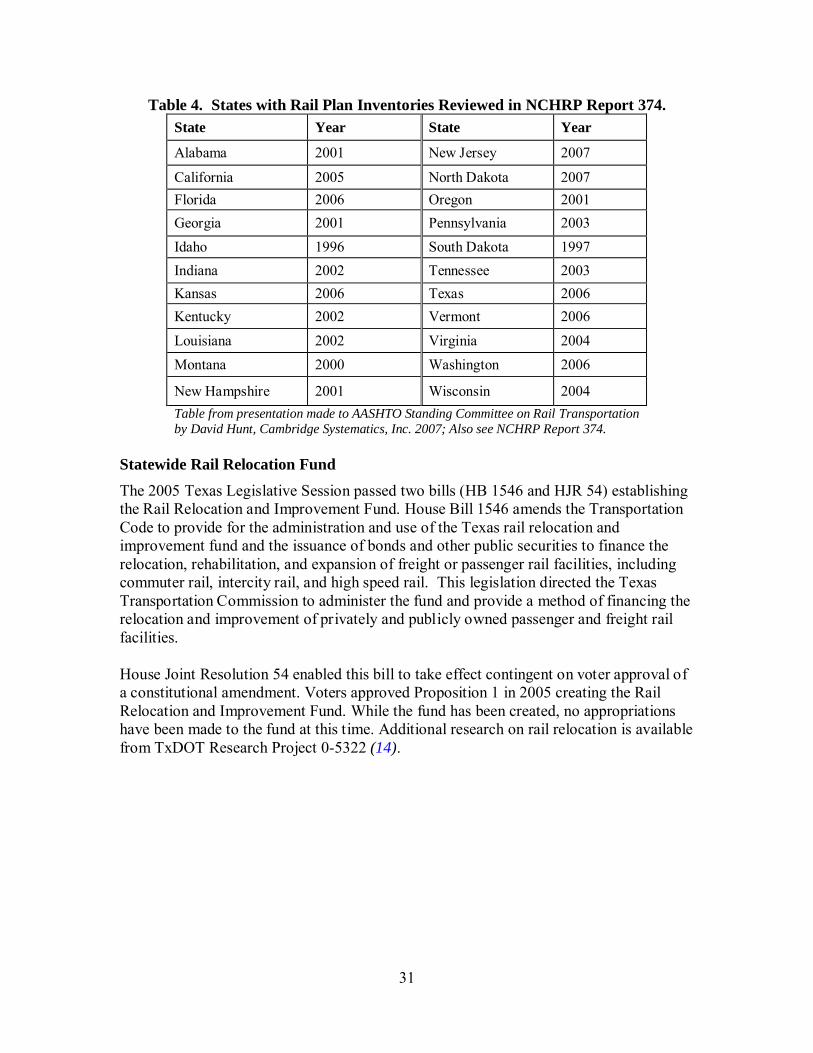
31
Table 4. States with Rail Plan Inventories Reviewed in NCHRP Report 374. State Year State Year Alabama 2001 New Jersey 2007 California 2005 North Dakota 2007 Florida 2006 Oregon 2001 Georgia 2001 Pennsylvania 2003 Idaho 1996 South Dakota 1997 Indiana 2002 Tennessee 2003 Kansas 2006 Texas 2006 Kentucky 2002 Vermont 2006 Louisiana 2002 Virginia 2004 Montana 2000 Washington 2006
New Hampshire 2001 Wisconsin 2004 Table from presentation made to AASHTO Standing Committee on Rail Transportation by David Hunt, Cambridge Systematics, Inc. 2007; Also see NCHRP Report 374.
Statewide Rail Relocation Fund The 2005 Texas Legislative Session passed two bills (HB 1546 and HJR 54) establishing the Rail Relocation and Improvement Fund. House Bill 1546 amends the Transportation Code to provide for the administration and use of the Texas rail relocation and improvement fund and the issuance of bonds and other public securities to finance the relocation, rehabilitation, and expansion of freight or passenger rail facilities, including commuter rail, intercity rail, and high speed rail. This legislation directed the Texas Transportation Commission to administer the fund and provide a method of financing the relocation and improvement of privately and publicly owned passenger and freight rail facilities. House Joint Resolution 54 enabled this bill to take effect contingent on voter approval of a constitutional amendment. Voters approved Proposition 1 in 2005 creating the Rail Relocation and Improvement Fund. While the fund has been created, no appropriations have been made to the fund at this time. Additional research on rail relocation is available from TxDOT Research Project 0-5322 (14).

33
SECTION 4: CASE STUDIES OF STATE DOT INVOLVEMENT IN SUPPORTING LIGHT AND COMMUTER RAIL
Case studies were used to identify the circumstances and characteristics of state DOT involvement that could be transferable to TxDOT in the planning, development, and operation of commuter and light rail. Case studies are also used to identify potential policy needs and guidance. The research team first identified states where the state DOT played a noteworthy role in the development of light and commuter rail projects. In selecting case studies of state DOT involvement in commuter and light rail development, researchers screened all of the states in continental North America where light rail or commuter rail was in existence or planned. The states where commuter and/or light rail systems are neither in existence or proposed were excluded from the case study selection pool. For states with statewide transit, the state DOT’s role is unique in that the state DOT owns and operates the public transportation system within the state. In this type of governance, transit operation is one of the state DOT’s core functions. In contrast, most state DOTs do not own or operate the local and or regional public transportation systems. These states were removed from consideration for case study since their governance structure differed significantly from Texas. Other northeastern states such as New York and surrounding New England states did not offer relevant examples for DOT rail involvement based on their very dissimilar demographic characteristics and transportation system size differences to Texas and other states. States where DOT involvement methods in commuter and light rail were more transferable to TxDOT were located generally in the south, southwest, and western states. Researchers narrowed the list of potential state DOTs for case study to 12. In concert with the TxDOT project management team, five states were selected for case study, as follows: • California; • Florida; • Georgia; • Minnesota; and • Virginia. The descriptions below represent a range of state DOTs involved in light rail transit, commuter rail, and intercity passenger rail.

34
CALIFORNIA Transportation in California is guided by the California Department of Transportation (Caltrans). The GoCalifornia vision: “Improve mobility and accessibility for people, goods, services, and information through a safe, integrated, multimodal, world-class transportation system that achieves the “3-Es”: • Prosperous Economy, • Quality Environment, and • Social Equity. GoCalifornia’s goal is: “Mobility that continues to attract capital investment in California to generate jobs. GoCalifornia’s objectives in its 10-year investment plan for mobility are: • Address 20-year needs and reduce congestion below today’s levels. • Deploy demand-management strategies, use existing capacity more efficiently, and
expand capacity. • Build a world-class transportation system that incorporates the best research and
technology. The Department’s Intercity Passenger Rail Vision supports the GoCalifornia vision; the Department’s mission and goals contain the following elements: • Provide relief to highway and airway congestion. • Provide a rail transportation alternative to other travel modes. • Improve air quality, conserve fuel, and contribute to efficient and environmentally
superior land use. State Agency with Planning Authority Caltrans provides capital grants and support for station and track improvements (including signaling), locomotives and cars, connecting Amtrak bus service, and operating assistance for three corridors: The Pacific Surfliners, the San Joaquins, and the Capitols (Figure 6). The Division of Rail (DOR) within Caltrans manages and coordinates the state-supported intercity rail program. Caltrans is required by California state law to update its 10-year State Rail Plan for both passenger and freight rail every two years. Caltrans supports intercity rail operations in three corridors. This support includes operations funding and capital improvement projects. California’s fiscal year 2006 budget included $1.315 billion in funding for Amtrak, including $780 million for capital projects (which includes $280 million maximum for debt service), $495 million for operations, and $40 million for efficiency incentive grants.

35
Figure 6. California Intercity and Commuter Rail Network.
36
DOR manages two state-supported routes operated by Amtrak and financially supports a third, as follows: • The San Joaquins operates six round trips from Oakland or Sacramento to
Bakersfield. The San Joaquin route connects the Bay Area with the state capital area in Sacramento via Stockton and extends southward through the San Joaquin Valley to Bakersfield with connecting bus service on to Los Angeles.
• The Pacific Surfliners, the second most popular route in the country, has 11 weekday and 12 weekend round trips from San Diego to Los Angeles. The Pacific Surfliner route serves the southern California coast between San Diego and San Luis Obispo, north of the Los Angeles Metro area.
• The Capitol Corridor connects San Jose and Oakland to the Sacramento area and on to Roseville and Auburn in the east.
DOR performs long-range planning, coordinates with Amtrak on operations issues, administers the state rail program marketing contract ($5 million annually), procures and manages the rehabilitation of equipment, and works with local agencies to manage the capital program for projects on the Capital Corridor, San Joaquin and Pacific Surfliner routes, including track and signal projects to result in increased train frequencies, reduced travel times, and improved on-time performance. Amtrak supports the state’s marketing efforts. In addition to sponsoring these rail routes, the state also subsidizes an extensive feeder bus route system. The feeder routes are contracted to private operators. These services “extend” the rail, providing opportunity to make connections between the commuter rail line and other area services and developments. Caltrans pays any net operating losses to Amtrak for the feeder buses and views them as a means of building ridership for future service expansion. The Caltrans Division of Rail provides operations funding to the Capitol Corridor Joint Powers Authority, which oversees the Amtrak Capitol Corridor trains running between San Jose/Oakland and Sacramento/Auburn. In addition, Caltrans assists that service by pursuing state funding, requesting project programming, procuring rolling stock, and managing track and signal projects. The Capitol Corridor Joint Powers Authority (CCJPA) provides local control of operations on the route. Caltrans apportions a percentage of its funding on to CCJPA, which is dependent upon these funds for all of its support outside those generated by the route itself. State-Level Funding Sources Funding to support intercity rail in California comes from a variety of sources. Currently, the State of California and Amtrak share operational costs (although the Amtrak portion has diminished to cover only their overhead today, with the state covering all direct costs) for the three state-supported routes. The state is the main funding source for capital improvements directly related to intercity rail services. Additional capital funding
37
support for rail projects is received from many sources including local governments, which may pay for station improvements and the railroad companies who may also benefit from rail infrastructure projects. California has also used federal grants and loans for rail capital improvements. Over $2.8 billion has either been invested or reserved for capital funding for California intercity rail passenger service since 1976. The state has provided about 62 percent of that funding. Local entities, the federal government, Amtrak, and the private railroads have also made contributions. The California State Rail Plan outlines the funding sources available to Caltrans for intercity passenger rail projects. Each funding source is discussed below. Public Transportation Account (PTA) The Public Transportation Account (PTA) is the only source for intercity operating funds, and it is also a potential source for capital projects. PTA funding primarily comes from sales and excise taxes on fuel. In 2005-06, total PTA revenue from these sources was $571 million, and included: • Sales Tax on Diesel Fuel – The 4.75 percent portion of the 7.25 percent state sales tax
on diesel fuel, which in 2005-06 was $287 million. • Sales Tax on Gasoline – The 5.0 percent portion of the 7.25 percent state sales tax on
gasoline. In 2005-06, the first year of the Tax Increment Financing (TIF) transfer to the PTA, the amount transferred was $136 million.
• Sales Tax on Gasoline (Spillover) – Based on the statutory formula, gasoline spillover is available when revenues from the gasoline sales tax at the 4.75 rate exceed revenues from all taxable sales at the 0.25 percent rate, shifting revenues to the PTA when gas prices increase faster than overall retail sales. In 2005-06, the spillover was $381 million, but the full amount was retained by the General Fund.
• Sales Tax on a Portion of the Excise Tax on Gasoline (Proposition 111) – A portion equal to 4.75 percent on nine cents of the state’s 18 cent per gallon excise tax on gasoline goes to PTA. In 2005-06, this source was $67 million.
• Traffic Congestion Relief Program (TCRP)/Proposition 42 Funding –The TCRP was established by Chapter 91, Statutes of 2000 (AB 2928, Torlakson). The California financial crisis in 2001 delayed payments from the fund through 2007-08. A commitment to pay $83 million per year to TCRP from the Transportation Deferred Investment Fund for nine years was later enacted.
• State Highway Account (SHA) Non-Article XIX Revenues – The TCRP Program (Chapter 91, Statutes of 2000) authorized the annual transfer of all Article XIX unrestricted SHA revenues from the SHA to the PTA. These revenues are derived from the sale of documents, charges for miscellaneous services to the public, rental of state property, etc. and are from state sources only and unrestricted. In 2005-06, this source was $81 million.

38
State Highway Account: Restricted Funds The State Highway Account predominantly goes to support California’s state highway system; however, a portion of the account has been set aside for rail projects that appear in the Statewide Transportation Improvement Program (STIP) documents approved by MPOs and the state. The SHA receives its funds from state gasoline and diesel fuel taxes, state vehicle weight fees, and reimbursements from the Federal Trust Fund for federal-aid projects. The SHA restricted funds cannot be used for mass transit vehicle acquisition or maintenance, or mass transit operating costs. State Bond Funds
The public approved two very substantial state bond proposals in 1990, which have provided program stability. The Passenger Rail and Clean Air Bond Act (Proposition 108) contained over $1 billion in rail transportation bonds of which $225 million was designated for intercity rail capital projects. The second bond act passed in 1990 was the Clean Air and Transportation Improvement Act of 1990 (Proposition 116) that included a one-time source of funding for rail and transit capital projects of $1.99 billion of which $382 million was specifically designated for intercity rail. According to the state’s rail plan, by 2004 most of the funds from both of these bond programs had been allocated. State General Funds
In addition to long-term bonding programs, Caltrans has also been able to benefit from several “one-time” appropriations from the state’s general fund. Local Funds
Local funds have been used to offset expenditures of state funds by using them to purchase or construct support facilities that cannot be as easily funded by existing state or federal level funding programs. For example, local STIP funding controlled by an MPO or other local funding sources at the city level may be used to construct or enhance stations that local government entities own. Additionally, grade crossing signal improvements and track improvements related to commuter rail projects that are funded at the local level can also benefit intercity rail operations. This has been especially true on California’s Pacific Surfliner route where the Metrolink commuter rail in the Los Angeles area and the Coaster commuter rail in the San Diego area have invested for their own operations, but the infrastructure upgrades have also facilitated better state-supported intercity rail operations. Federal Funds Although they are not actually state level funds, a few federal level funding sources are passed along to the states that allocate them to specific public transportation projects. In California, funding from Federal Transit Administration (FTA) Section 5307 and Section 5309 funds have been used to assist in station projects that benefit intercity rail. These funds are most often designated to local entities for specific projects in their project planning documents.
39
Amtrak Funds In California, Amtrak and the state have partnered to bring increased frequencies and improved service along the state-sponsored routes to augment the standard national system routes operated by Amtrak in the state. Amtrak’s main funding assistance comes in the form of capital improvements to maintenance facilities and through the purchase of rolling stock. Railroad Funds Funding from the private freight railroad companies has also been used to make improvements to the routes that are state-supported. Each route travels largely over rail lines either owned by or operated by private rail firms. Often when additional projects are undertaken that either add freight rail capacity or improve rail safety, the state will ask the railroad company to participate financially in supporting the project since those improvements will also benefit the private railroad’s operations. Noteworthy Practices The State of California programs reflect the following noteworthy practices: • long history of funding support and leadership from state DOT; • long history of statewide rail planning; • strong local support and involvement; • state DOT as partner with regions in rail development; and • use of joint powers authority.
FLORIDA All FTA projects require matching funds from the local sponsoring agency. FTA will typically fund no more than half the cost of the project and typically favors projects where the non-federal share of the costs is significantly greater than half. By increasing the non-federal share with state matching funds, a state can increase a project’s competitive advantage when seeking the Federal New Starts Program. Demonstration of a strong local financial commitment is a key factor in securing FTA funding.
Florida enacted a number of important transportation-related policy initiatives in recent years that influence growth and development and in particular, transportation, transit, and transportation funding requirements. As an outgrowth of the Florida Transportation Plan, the Florida Department of Transportation (FDOT) recommended development of a decision-support program to help guide investments in transit services and infrastructure, and to leverage the maximum capture of available federal transit discretionary funding. FDOT’s primary objectives are to:
• advance infrastructure to support growth management and concurrency objectives; • use state transit funding to maximize the amount of FTA discretionary funding
captured for Florida projects; • advance transit projects expeditiously to meet strategic and regional transportation
needs; and

40
• advance transit projects expeditiously to best allocate and use available state transit funds.
In addition to the Florida Transportation Plan, growth management legislation affected transportation development. The 2005 Growth Management Act (SB 360) provided significant policy direction and funding for how Florida will grow for decades to come. Two new and strategic transportation policy initiatives created by SB 360 include the New Starts Transit Program (NSTP) and the Transportation Regional Incentive Program (TRIP). The primary purpose of the NSTP is to provide funding support to build the transportation infrastructure required to move Florida into the future. The TRIP program was created to encourage and fund regionally significant transportation investments.
The NSTP provides transit agencies with up to a dollar-for-dollar match of the local (non-federal) share of project costs for transit fixed-guideway projects and facilities that qualify under the New Starts Program. Eligible projects include rail transit and bus rapid transit (BRT) systems. This program also allows a dollar-for-dollar match of local funds towards project costs for projects funded with state and local funds only. The Florida New Start allows their transit projects competitive advantage relative to other projects nationally.
TRIP created as part of SB 360, the Growth Management Act, provides 50 percent matching grants to improve regionally significant facilities in regional transportation areas. Regional transportation areas are defined by law as:
• two or more contiguous Metropolitan Planning Organizations (MPOs); • one or more MPOs or counties; • multi-county regional transportation authority; • two or more contiguous counties not members of an MPO; and • MPOs comprised of three or more counties.
Florida DOT’s concept is to focus transit investment decisions to yield the greatest return on investment. This involves setting transit project technical requirements and leveraging state and local funds to maximize the capture of federal funds. Decision-making by the FDOT on transit projects includes consideration of:
• compliance with federal and state policies and guidelines; • coordination with regional projects and programs; • consistency with local plans and programs; • local financial and land use and growth management policy commitments; and • potential to leverage federal transit discretionary funding. The State of Florida has several additional regionally oriented programs that support judicious development of transit infrastructure.
Strategic Intermodal System The Strategic Intermodal System (SIS) is the statewide network of strategic intermodal facilities and services of regional significance. This system is comprised of transportation hubs of ports and terminals and the highways, railroads, and waterways
41
connecting these hubs. Projects that are part of the SIS network or that expand and improve the SIS network may be eligible for special funding. The FDOT uses three processes for updating the SIS designation:
1. A Comprehensive SIS Review of all criteria every five years; 2. An annual Systemwide SIS Data and Designation Review of activity levels of all facilities using established criteria; and 3. An ongoing process for responding to partner requests for designation changes.
The SIS is determined through objective criteria and thresholds and is based on quantitative measures of transportation and economic activity. These criteria and thresholds are used to designate both existing and planned facilities. County Incentive Grant Program The County Incentive Grant Program provides up to 50 percent grants to counties for the construction of transportation facilities and services, including transit, to relieve congestion on the State Highway System. State Infrastructure Bank State Infrastructure Bank (SIB) is a program of revolving low interest loans and credit enhancement programs to assist projects eligible under the TRIP and other programs. The SIB funded in FY2006 with $100 million. Noteworthy Practices The State of Florida programs reflects the following noteworthy practices: FDOT assists local and regional transportation authorities in competing for federal
funding with the state’s own “New Starts” funding. FDOT offers a variety of additional strategic state funding opportunities for transit
infrastructure. FDOT developed programs that emphasize enabling of more local and regional
investment in transit development. FDOT developed policies encouraging collaboration among local and regional
entities. Project funding is contingent upon its consistency with state and regional plans. FDOT funds programs encouraging intermodal facility development for connectivity
between bus and light rail.
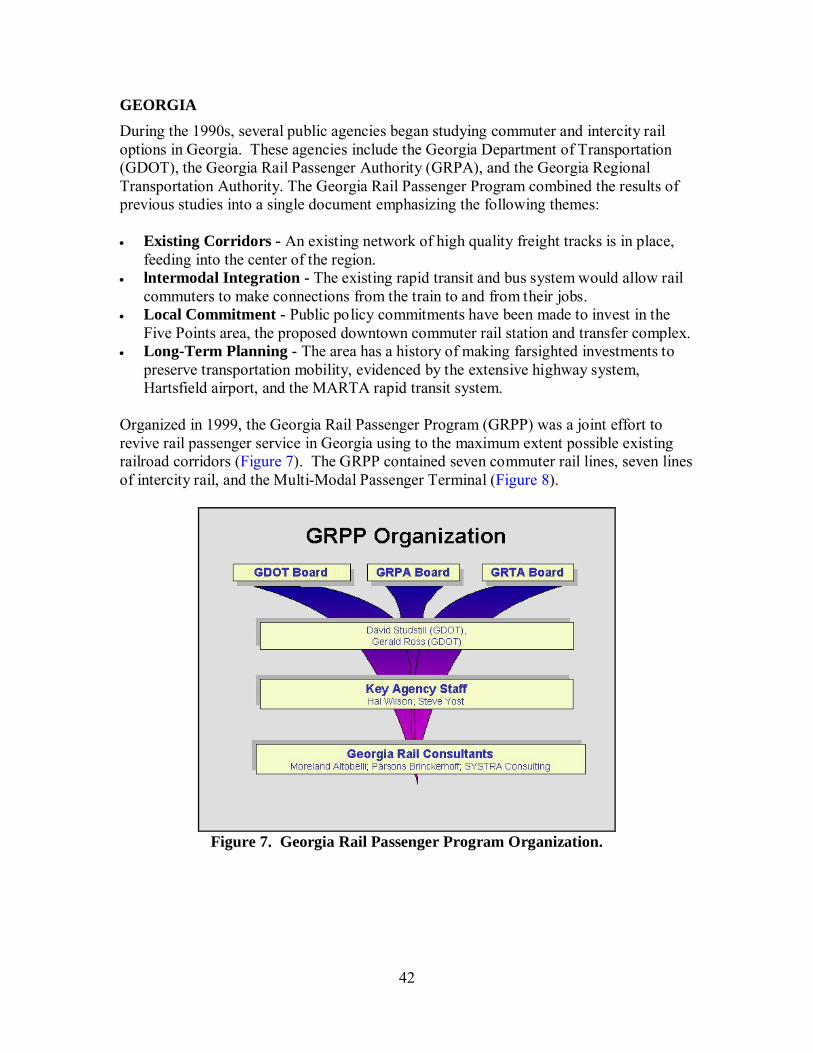
42
GEORGIA During the 1990s, several public agencies began studying commuter and intercity rail options in Georgia. These agencies include the Georgia Department of Transportation (GDOT), the Georgia Rail Passenger Authority (GRPA), and the Georgia Regional Transportation Authority. The Georgia Rail Passenger Program combined the results of previous studies into a single document emphasizing the following themes: • Existing Corridors - An existing network of high quality freight tracks is in place,
feeding into the center of the region. • lntermodal Integration - The existing rapid transit and bus system would allow rail
commuters to make connections from the train to and from their jobs. • Local Commitment - Public policy commitments have been made to invest in the
Five Points area, the proposed downtown commuter rail station and transfer complex. • Long-Term Planning - The area has a history of making farsighted investments to
preserve transportation mobility, evidenced by the extensive highway system, Hartsfield airport, and the MARTA rapid transit system.
Organized in 1999, the Georgia Rail Passenger Program (GRPP) was a joint effort to revive rail passenger service in Georgia using to the maximum extent possible existing railroad corridors (Figure 7). The GRPP contained seven commuter rail lines, seven lines of intercity rail, and the Multi-Modal Passenger Terminal (Figure 8).
Figure 7. Georgia Rail Passenger Program Organization.

43
Figure 8. Georgia Rail Passenger Program.
The Program Management Team (PMT) for GRRP was comprised of two members each of the following entities: GRPA, the Georgia Regional Transportation (GRTA), and the State Transportation Board. The PMT Chairman was appointed by the Governor. Each participating agency named a staff person as representative Rail Program Managers to oversee daily coordination through the RPM Committee (RPMC). This committee oversaw the work of the Rail Program Consultant.

44
GDOT was responsible for: • planning, design, and construction of rail infrastructure improvements; • agreements with USDOT, Federal Railroad Administration, Environmental Protection
Agency, etc.; • financial planning; • infrastructure improvement ownership; and • incorporating GRRP project into the State Transportation Plan (STP), and Statewide
Transportation Improvement Program (STIP). GRPA was responsible for: • station location and design and construction; • design standards for rolling stock and maintenance facilities; • operating agreements with owner railroads; and • train operations and service levels. GRTA was responsible for: • integrating land use and zoning decisions with GRPA and passenger service; • working with local governments and MPOs on TOD and multimodal coordination;
and • assisting local governments with financing, planning, and design. The Georgia Rail Passenger Coordinating Committee (GRPCC) served as advisory committee to the PMT. The GRPCC was comprised of representatives from GDOT, GRPA, GRTA, host railroads, and federal, state, and local public and private organizations with an interest or responsibility in the program. The GRRP stopped meeting during 2004 due to internal strife, and the organization has been unstaffed since 2006. Implementation of the commuter and intercity rail plan has fallen solely to GDOT. GDOT has focused on one commuter rail line running from Atlanta to Lovejoy. The Georgia State Transportation Board endorsed the project in April 2008 and approved the formation of a new Intermodal Program Division at GDOT.
Noteworthy Practices The State of Georgia programs reflect the following noteworthy practices: • emphasis on local commitment and participation in rail development; • attempted regional implementation organization; • long-term vision and planning effort – planning since the early 1990s; • integration and compatibility with other local and regional transportation plans for a
multimodal planning effort; and • emphasis on developing intermodal facilities for connectivity to bus and light rail.
45
MINNESOTA Commuter rail activities began when the 1997 Minnesota Legislature directed the Minnesota Department of Transportation (Mn/DOT) to determine the feasibility of commuter rail service for the Minneapolis-St. Paul metropolitan area. The subsequent study found six corridors proved feasible out of 19 rail corridors studied. Those six corridors were divided into two tiers, with the Tier One corridors representing the highest priority. The three Tier One corridors are: • Northstar Corridor (St. Cloud/Rice Area to Minneapolis), • Red Rock Corridor (Hastings to Minneapolis through St. Paul), and • Dan Patch Corridor (Minneapolis to Northfield). The Northstar Corridor is an 82-mile transportation Corridor that runs along Highways 10 and 94 from downtown Minneapolis to the St. Cloud/Rice area. Mn/DOT and the Northstar Corridor Development Authority (NCDA) studied transportation options for the Corridor. After analyzing all possibilities, they recommended Northstar Commuter Rail as the best transportation alternative for the Corridor. The Northstar Corridor represents the region’s most advanced corridor and consists of an initial 40-mile line with six stations and eventually 82 total miles with 11 rail stations (Figure 9). The estimated cost for the entire corridor is $302 million, 50 percent of which is projected to come from the federal government. The federal money would be available if the local governments raise the remaining 50 percent, or $151 million. This is planned to include $123.2 million in state bonding and $27.8 million from local governments. NCDA’s goal is to have the railway operational by 2009. The capital costs of the project are estimated to be $289 million (funding to be provided would include 50 percent federal, 33 percent state, and 17 percent local). The NCDA is a joint powers board made up of counties, regional railroad authorities, cities, and townships along the corridor. The stated purpose of the NCDA is to “analyze the feasibility and environmental impacts of integrated transportation improvements along the Highway 10 Corridor, including highway improvements, commuter and freight rail, recreational trails, safety and related land issues.” A joint powers agreement is a contract between a city, a county, and/or a special district in which the city or county agrees to perform services, cooperate with, or lend its powers to the special district or authority. The strength of a joint powers agreement is that the various transportation development partners contribute their individual strengths and established governmental functions to one collaborative organization.

46
Figure 9. Minnesota Northstar Corridor.
NCDA has an executive committee consisting of five members responsible for approving invoices within approved contract amounts, addressing personnel issues, and performing other duties set forth in NCDA’s bylaws. The Anoka County Regional Railroad Authority (ACRRA) is a component unit of Anoka County governed by a seven-member board consisting of the Anoka County Commissioners and has the power to levy taxes, issue bonds, and enter into contracts. ACRRA is the lead agency for the Northstar commuter rail line. Anoka County is responsible for the accounting and monitoring of the ACRRA. Mn/DOT monitors all NCDA contracts that utilize federal and state funds for the Northstar Project. Such contracts include consulting, engineering, studies, design, legal contracts relating to the development of the Project and contracts relating to public involvement. Northstar cleared its final financial hurdle in December 2007, when it received a commitment for $156.8 million in federal matching funding for construction and trains
47
via the Full Funding Grant Agreement. This also triggered the release of $97.5 million in state bonding funds dedicated to the project. The state and federal funding, combined with the commitment of the regional rail authorities for Anoka, Hennepin, and Sherburne counties, as well as contributions from the Metropolitan Council and the Minnesota Twins, allowed Northstar construction to get fully underway. Mn/DOT is funding 33 percent of the construction cost and will share the funding of operating deficits (after application of fares and federal 5307 capital funds) with local entities. The NCDA claims the project as the most effective transportation alternative in the corridor and points to the following benefits and advantages: • Northstar will be built on existing rail tracks, meaning the construction costs are
significantly lower than other alternatives. It will cost much less to build than a dedicated busway or highway upgrades.
• Highway expansion would be nearly four times as expensive and adding a dedicated busway would cost nearly six times more than commuter rail per passenger trip.
• Northstar will save commuters 900,000 hours in travel time every year, compared to the next best alternative of bus transit.
• Northstar will take 5,000 cars off the road during morning and evening rush hours and will have the capacity to carry the equivalent of nearly 1.5 lanes of highway traffic at peak travel times.
• Northstar can quickly adapt to increased demand, adding more cars, and running more trains as demand rises.
Noteworthy Practices The State of Minnesota programs reflect the following noteworthy practices: • joint powers agreement leverages existing organizations’ strengths; • ability to pass taxing authority and broad local/regional participation; and • strong connection to statewide and metropolitan transportation plans and plan
performance measurement. VIRGINIA In the case of the Commonwealth of Virginia, the Rail Division of the Virginia Department of Rail and Public Transportation (VDRPT) plans and funds rail projects. The VDRPT is a separate state agency from the Virginia Department of Transportation (VDOT) (Figure 10). VDRPT is charged by the state to plan for freight and passenger rail as well as non-rail modes of public transportation. VDRPT completed and published both a state rail plan and a rail needs assessment during 2004.
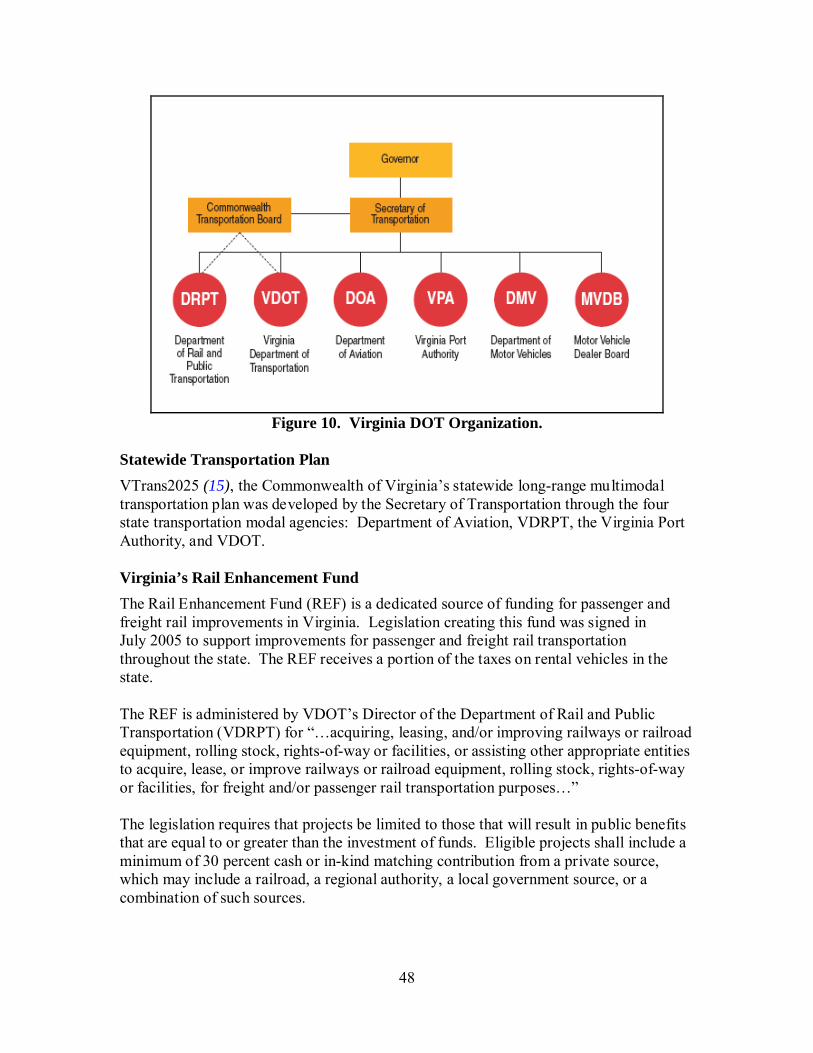
48
Figure 10. Virginia DOT Organization.
Statewide Transportation Plan VTrans2025 (15), the Commonwealth of Virginia’s statewide long-range multimodal transportation plan was developed by the Secretary of Transportation through the four state transportation modal agencies: Department of Aviation, VDRPT, the Virginia Port Authority, and VDOT. Virginia’s Rail Enhancement Fund The Rail Enhancement Fund (REF) is a dedicated source of funding for passenger and freight rail improvements in Virginia. Legislation creating this fund was signed in July 2005 to support improvements for passenger and freight rail transportation throughout the state. The REF receives a portion of the taxes on rental vehicles in the state. The REF is administered by VDOT’s Director of the Department of Rail and Public Transportation (VDRPT) for “…acquiring, leasing, and/or improving railways or railroad equipment, rolling stock, rights-of-way or facilities, or assisting other appropriate entities to acquire, lease, or improve railways or railroad equipment, rolling stock, rights-of-way or facilities, for freight and/or passenger rail transportation purposes…” The legislation requires that projects be limited to those that will result in public benefits that are equal to or greater than the investment of funds. Eligible projects shall include a minimum of 30 percent cash or in-kind matching contribution from a private source, which may include a railroad, a regional authority, a local government source, or a combination of such sources.

49
The Program Policy Goals establish the criteria for project funding. Compliance with these minimum criteria must be demonstrated for a project to be considered. The goals are as follows:
1. Projects will provide an additional or accelerated investment in Virginia rail projects, which are determined to have a substantial public benefit equal to or greater than the public investment.
2. Projects will address the needs identified in the applicable state, regional, and/or local plans, developed in consultation with public and private partners.
3. Projects will encourage competition and economic development by promoting, or not precluding, access by more than one rail operator and whenever possible joint access by freight and passenger operators to optimize the Commonwealth’s investment.
4. The use of Rail Enhancement Funds will evolve from a focus on quick turn-around, high impact projects to a multi-year strategic program of projects that leads to an integrated six-year rail (passenger/freight) improvement program.
5. The Program will limit long-term Commonwealth funding liability through the development of achievable project schedules and budgets. Consideration will be given to funding major projects over a period of several years.
6. Where feasible, projects will optimize public benefits by leveraging funds from sources other than the Rail Enhancement Fund.
7. Projects will protect the Commonwealth’s public interest in private facilities. 8. Projects will contribute to the effectiveness of the entire transportation system. 9. At least 90 percent of program funds will be spent on capital improvements.
Roles and Program Implementation
The Rail Enhancement Fund Program is administered by the Director of the Virginia Department of Rail and Public Transportation in accordance with policy decisions of the Commonwealth Transportation Board. The Director of VDRPT consults with and obtains the advice and recommendations of the Rail Advisory Board in preparation of an annual program of projects for implementation. Role of the Commonwealth Transportation Board The Commonwealth Transportation Board (CTB) is the policy board for the VDRPT and VDOT. Members of the 17-member Board are appointed by the governor. Their role includes the formulation and adoption of program development guidelines, policies, procedures, and allocation of funds for programs of projects. The CTB must determine that Rail Enhancement Fund projects result in public benefits to the Commonwealth or to a region of the Commonwealth that are equal to or greater than the level of investment of Rail Enhancement funds. Role of the Virginia Department of Rail and Public Transportation
The VDRPT is responsible for the analysis of projects and proposals and development of information necessary to assess the proposals. The agency is also responsible for developing the program of projects, implementing the program, and providing periodic
50
progress reports to the Rail Advisory Board RAB and CTB. The Director will consult with the RAB to obtain advice and recommendations. The agency is responsible for executing necessary agreements and ensuring program compliance for projects, including compliance with applicable environmental review and public involvement requirements. Role of the Rail Advisory Board
The Rail Advisory Board consists of nine members appointed by the Governor for terms of four years. One of the nine appointees is an at-large member of the CTB. The role of the RAB is to develop recommendations, in consultation with the Director of VDRPT, to be presented to the CTB regarding all proposed allocations of funds from the Rail Enhancement Fund. The RAB also works cooperatively with the Director of VDRPT and with any affected railroad in identifying, developing, and advocating projects and policies to enhance the quality and utility to the public of rail transportation in the Commonwealth. The Director of VDRPT consults the RAB on an as-needed basis. Relationship to Transportation Plans
Rail Enhancement Fund Program development includes the coordination of projects to address the needs identified in applicable statewide, regional, and/or local transportation plans. In addition, VDRPT is developing statewide rail plans, and upon completion these plans will help guide the selection of future projects. Noteworthy Practices
The State of Virginia programs reflect the following noteworthy practices: • Virginia has a state Department of Rail and Public Transportation in addition to the
Department of Transportation. • Virginia established a dedicated state rail enhancement fund. • The state funding program supports a strong connection to statewide and metropolitan
transportation plans. • The state designated a required flex funding percentage for public transportation.
51
SECTION 5: COMMUTER RAIL CASE STUDIES
Research indicates that state DOTs are more likely to participate in development of commuter rail projects than light rail projects. Light rail in Texas is developed by the local transit authority, and TxDOT’s role is usually limited to review of any interface a light rail project has with a TxDOT facility. Therefore, the research team focused on commuter rail and developed four additional case studies of commuter rail projects. Over the past decade, several non-traditional rail cities in Western and Southern states have implemented new commuter rail systems through a variety of methods and with varying involvement levels from their state department of transportation. Nationally, most commuter rail system development has remained in the realm of local urban or regional transit agencies due to the availability and use of federal funds through the FTA New Starts Program. Access to these funds is highly competitive due to the limited amount of funds appropriated each year to the program and the increasing number of agencies seeking New Starts funding for their projects. The regulatory and bureaucratic requirements for participating in the New Starts program are also demanding, and as a result, several states and/or transit agencies have begun to seek funding alternatives outside the federal system such as public-private partnerships (using only locally generated public funding sources) and/or alternative delivery methods such as Design-Build or Design-Build-Operate-Maintain in order to avoid the delays and restrictions associated with accepting and administering federal funding. The following case studies will outline some of the issues that have been encountered in development of commuter and suburban intercity passenger rail routes in the Denver, Colorado; central New Mexico (Albuquerque to Santa Fe Corridor); Nashville, Tennessee; and Salt Lake City/Ogden, Utah, regions. The different steps taken by the implementing agencies in each of these regions is instructive in how differing project requirements result in alternative approaches and analysis to address specific needs. DENVER FASTRACKS PLAN-COMMUTER RAIL CORRIDOR ELEMENTS (FIGURE 11) Implementing Agency: Denver Regional Transportation District (RTD) Type of Agency: Regional Transit Agency State DOT Role: Support role- provision of right-of-way (ROW), roadway
access

52
Figure 11. Denver RTD Commuter Rail System.
Background/History The Denver FasTracks Plan is a program to develop a comprehensive system of improved light rail transit, commuter rail, and bus rapid transit corridors for the Denver region approved by the voters in 2004. According to the most recent annual progress report of the RTD to the Denver Regional Council of Governments (dated December 2007), the FasTracks Plan original plan consisted of: • nine rail corridors (new or extensions); • one bus rapid transit (BRT) corridor; • the redevelopment of the Denver Union Station (DUS) with associated yard and
station improvements; and • three maintenance facility projects: one each for light rail, commuter rail, and buses.
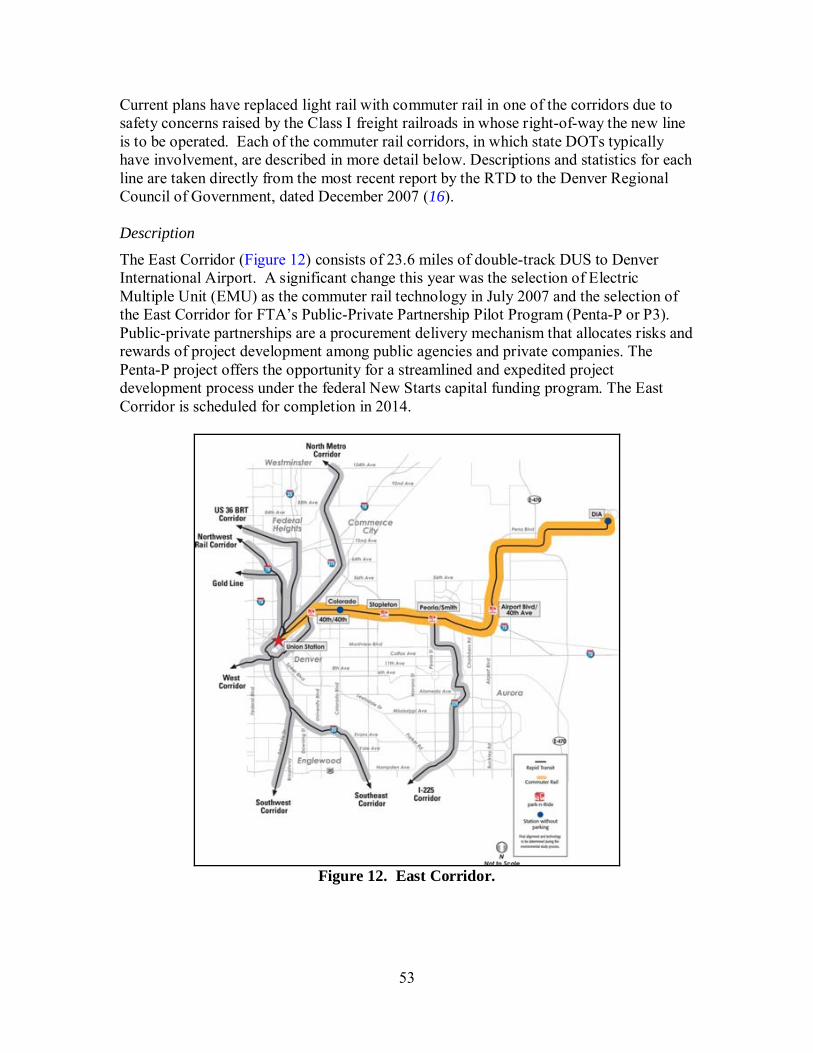
53
Current plans have replaced light rail with commuter rail in one of the corridors due to safety concerns raised by the Class I freight railroads in whose right-of-way the new line is to be operated. Each of the commuter rail corridors, in which state DOTs typically have involvement, are described in more detail below. Descriptions and statistics for each line are taken directly from the most recent report by the RTD to the Denver Regional Council of Government, dated December 2007 (16). Description
The East Corridor (Figure 12) consists of 23.6 miles of double-track DUS to Denver International Airport. A significant change this year was the selection of Electric Multiple Unit (EMU) as the commuter rail technology in July 2007 and the selection of the East Corridor for FTA’s Public-Private Partnership Pilot Program (Penta-P or P3). Public-private partnerships are a procurement delivery mechanism that allocates risks and rewards of project development among public agencies and private companies. The Penta-P project offers the opportunity for a streamlined and expedited project development process under the federal New Starts capital funding program. The East Corridor is scheduled for completion in 2014.
Figure 12. East Corridor.
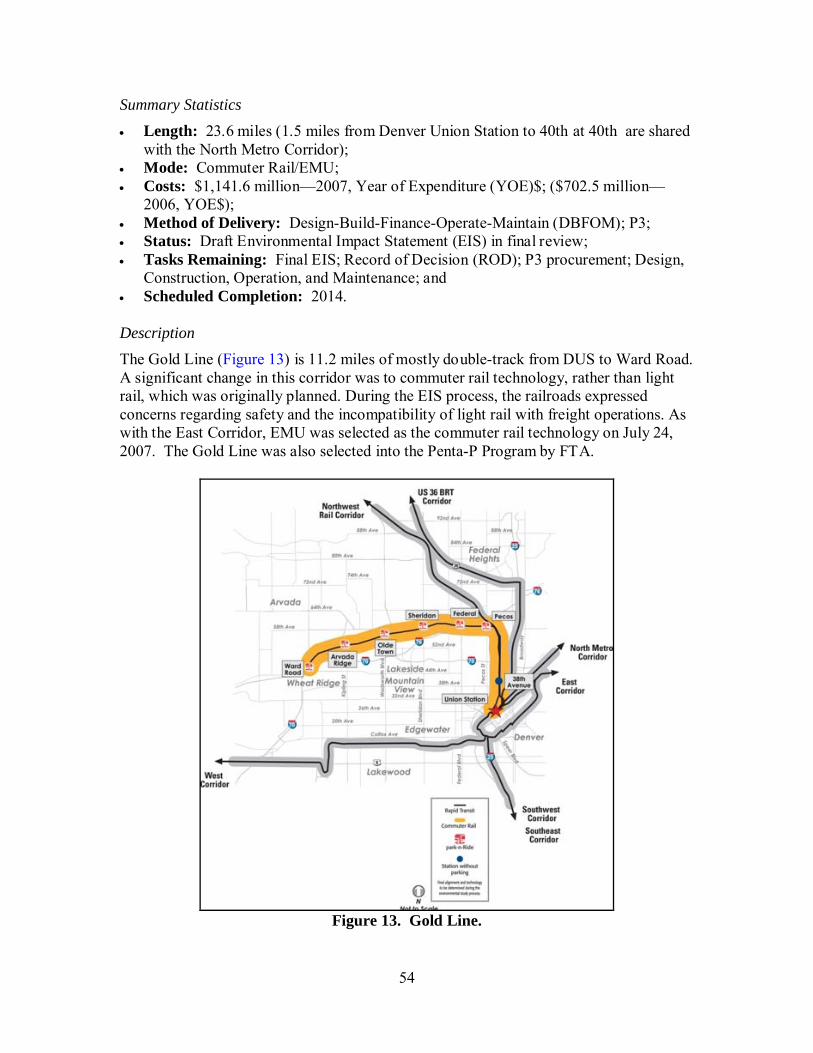
54
Summary Statistics • Length: 23.6 miles (1.5 miles from Denver Union Station to 40th at 40th are shared
with the North Metro Corridor); • Mode: Commuter Rail/EMU; • Costs: $1,141.6 million—2007, Year of Expenditure (YOE)$; ($702.5 million—
2006, YOE$); • Method of Delivery: Design-Build-Finance-Operate-Maintain (DBFOM); P3; • Status: Draft Environmental Impact Statement (EIS) in final review; • Tasks Remaining: Final EIS; Record of Decision (ROD); P3 procurement; Design,
Construction, Operation, and Maintenance; and • Scheduled Completion: 2014. Description The Gold Line (Figure 13) is 11.2 miles of mostly double-track from DUS to Ward Road. A significant change in this corridor was to commuter rail technology, rather than light rail, which was originally planned. During the EIS process, the railroads expressed concerns regarding safety and the incompatibility of light rail with freight operations. As with the East Corridor, EMU was selected as the commuter rail technology on July 24, 2007. The Gold Line was also selected into the Penta-P Program by FTA.
Figure 13. Gold Line.
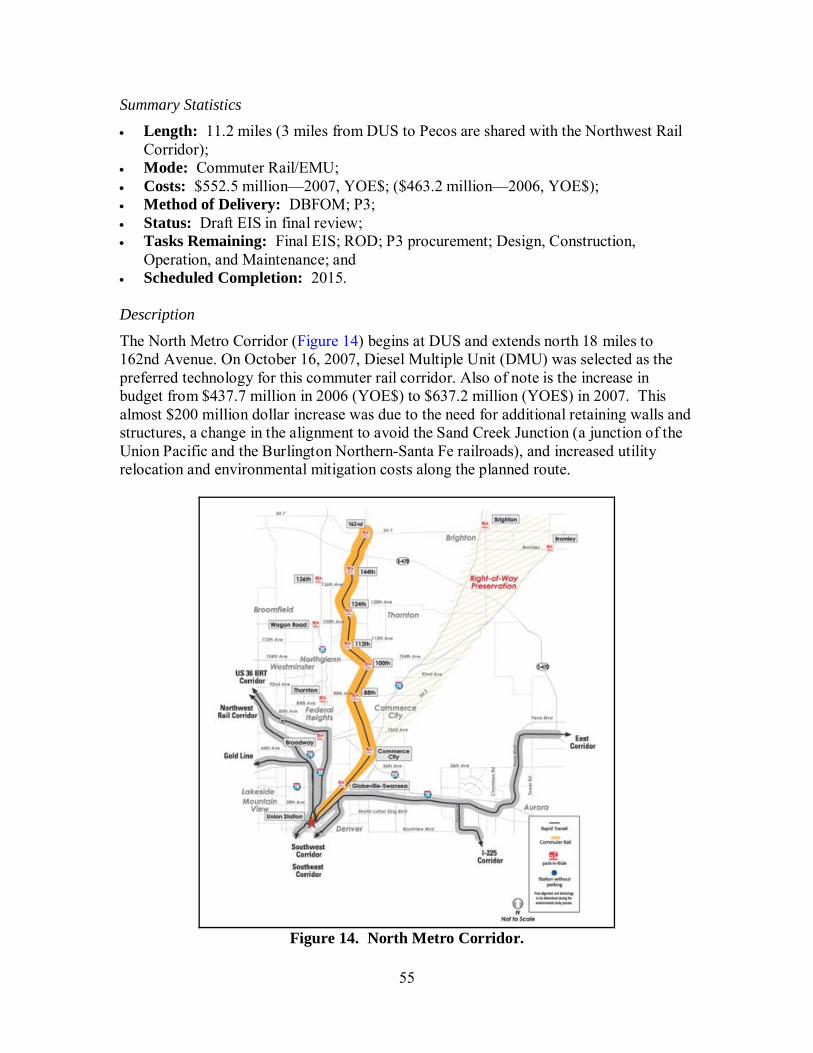
55
Summary Statistics • Length: 11.2 miles (3 miles from DUS to Pecos are shared with the Northwest Rail
Corridor); • Mode: Commuter Rail/EMU; • Costs: $552.5 million—2007, YOE$; ($463.2 million—2006, YOE$); • Method of Delivery: DBFOM; P3; • Status: Draft EIS in final review; • Tasks Remaining: Final EIS; ROD; P3 procurement; Design, Construction,
Operation, and Maintenance; and • Scheduled Completion: 2015. Description
The North Metro Corridor (Figure 14) begins at DUS and extends north 18 miles to 162nd Avenue. On October 16, 2007, Diesel Multiple Unit (DMU) was selected as the preferred technology for this commuter rail corridor. Also of note is the increase in budget from $437.7 million in 2006 (YOE$) to $637.2 million (YOE$) in 2007. This almost $200 million dollar increase was due to the need for additional retaining walls and structures, a change in the alignment to avoid the Sand Creek Junction (a junction of the Union Pacific and the Burlington Northern-Santa Fe railroads), and increased utility relocation and environmental mitigation costs along the planned route.
Figure 14. North Metro Corridor.

56
Summary Statistics • Length: 18 miles (1.5 miles from DUS to 40th at 40th are shared with the North
Metro Corridor); • Mode: Commuter Rail/DMU; • Costs: $637.2 million—2007, YOE$; ($437.7 million—2006, YOE$); • Method of Delivery: Design-Bid-Build; • Status: The Draft EIS, which was initiated in August 2006, has progressed through
scoping, station planning, preferred technology screening, selection, and adoption by the RTD Board of a preferred vehicle technology. The alternatives analysis is now underway and release of the Draft EIS for public comment was available for public review in June 2009;
• Tasks Remaining: Completion of Draft EIS; Final EIS; obtaining a ROD; Final Design; Construction; Operation and Maintenance; and
• Scheduled Completion: 2015. Description
The Northwest Rail Corridor (Figure 15) consists of 41 miles of commuter rail (DMU) that originates at DUS and extends northwest to downtown Longmont. Significant changes that have occurred in 2007 on this corridor include extending the corridor to downtown Longmont (additional 2.9 miles) and the selection of DMU as the preferred alternative for commuter rail technology. The corridor was extended from the original end-of-line station at Twin Peaks Mall. This location was problematic due to upgrades that would be required to the surrounding roadway network to satisfy traffic concerns. The extension to 1st and Terry Streets was found to be cost-neutral when compared against the roadway upgrades that would have been required in the vicinity of Twin Peaks Mall. Increased costs of $118.4 million over the original FasTracks budget resulted from: • the decision to extend the line from the original Twin Peaks terminus to downtown
Longmont; • the change from a trench to a flyover at Utah Junction; • the need to consider additional requirements for pedestrian bridges at stations; • the need for additional wetlands impact mitigation; and • other changes.

57
Figure 15. Northwest Rail Corridor.
Summary Statistics
• Length: 41 miles (3 miles from DUS to Pecos are shared with the Northwest Rail Corridor);
• Mode: Commuter Rail/DMU; • Costs: $684.4 million—2007, YOE$; ($566.0 million—2006, YOE$); • Method of Delivery: Design-Bid-Build; • Status: Environmental Evaluation and Preliminary Engineering underway (to be
completed end of 2009); • Tasks Remaining: Final Design and Construction; Operation and Maintenance; and • Scheduled Completion: 2014. Involvement of State DOT The involvement of the Colorado Department of Transportation (CDOT) in the commuter rail components of the FasTracks plan is very limited at this stage due to the strong involvement of the regional transit district staff and the funding methodologies being considered for the commuter rail lines. Because the RTD has a history of receiving funds directly from the FTA on past projects and is participating in the new FTA Penta-P program, it is likely that the federal funds will continue to flow directly from the federal government to the RTD, requiring minimal oversight by the state DOT. CDOT is

58
involved with planning the locations where commuter rail corridors will cross state and federal system highways. Although CDOT is not directly involved in the commuter rail aspects of the FasTracks plan, there is a role for CDOT in several other aspects of the FasTracks plan. For example, CDOT is involved in several of the corridor plans that require ROW along existing and/or planned highway infrastructure such as the proposed light rail transit service along I-225 east of the Denver area and in the proposed bus rapid transit (BRT) route along U.S. 36. CDOT’s role could include purchase or donation of ROW along with funding of some other infrastructure capital improvements such as station access to stations located in the median of the existing roadway. Both BRT and LRT are more likely to be compatible with existing highway rights of way as compared to placement of these modes in existing freight rail rights of way. The current FRA and FTA safety rules prohibit the use of either LRT or BRT in existing rail corridors or shared ROW when operating at the same time periods. Cost escalations for rail construction materials and difficulty in negotiating ROW usage and/or purchase from UP caused several problems during the period covered by this research project. Costs of rail materials and construction estimates were much higher than those anticipated when the project was first approved by the voters in 2004. Just as railroad opposition to locating LRT or BRT in its ROW resulted in the RTD changing the Gold Line to commuter rail, rising costs forced RTD to re-evaluate all of the proposed modes for each of its lines. Some lines may be converted from locomotive-hauled commuter rail to electric commuter rail based upon these new calculations. Additionally, phasing and construction of the project may be delayed or scaled-back to deal with the funding shortfalls (12). Lessons for TxDOT While commuter rail may be considered the most likely mode in which the state DOT would have a large role, in some large metropolitan areas with advanced, multimodal transit planning, such as the Denver FasTracks Plan, the state DOT’s role may be more a support role than an active, developmental one. Large urban areas with established transit agencies or regional transit districts may be more likely to receive direct federal funding or use their own funding for rail project construction and turn to the state DOT for other types of assistance. Examples of this would be assistance in acquiring ROW or providing roadway access to new stations, especially when those stations are in close proximity to existing state or federal highway routes.

59
NASHVILLE MUSIC CITY STAR Implementing Agency: Nashville Regional Transportation Authority (RTA) Type of Agency: Regional Transportation Authority/Metropolitan Transit
Agency State DOT Role: Support role- provision of matching funds for capital grant
and some initial operating support, working in partnership with RTA and other local agencies
Background/History The current Music City Star commuter service (Figure 16) is the first of five planned commuter rail lines for the Nashville, Tennessee, urban area. The five corridors that are planned to link to downtown Nashville according to the 2003 Tennessee Rail Plan are:
• Northeast: Briley Parkway-Hendersonville-Gallatin; • East: Hermitage-Mt. Juliet-Lebanon; • Southeast: Hickory Hollow-LaVergne-Smyrna-Murfreesboro; • South: Brentwood-Cool Springs-Franklin; and • West: Belle Meade-Bellevue-Kingston Springs (18).
Figure 16. Nashville RTA Commuter Rail Map.
A sixth corridor to the north of Nashville into Robertson County is now also listed in RTA’s plans (14). The 32-mile East Corridor was along an existing, publicly owned rail ROW, greatly reducing the construction costs and time to implement commuter rail in this corridor. These favorable circumstances were primary reasons that the East Corridor was selected to be the first project developed.
60
The train operates over the tracks of the Nashville and Eastern Railroad, which had to be upgraded from Track Class 2 (25 mph operations) for freight trains to Track Class 4 (up to 79 mph) operations for passenger rail operations including the addition of Centralized Traffic Control railroad signaling. The budget for the project was limited from the beginning, resulting in a series of cost-saving decisions regarding the commuter rail technology to be used and the system features upon start-up. Operations began in September 2006 (20). Summary Statistics • Length: 31.2 miles; • Mode: Commuter Rail/Locomotive-hauled coaches; • Cost: $40 million; and • Status: Operational since September 2006. Involvement of State DOT The Tennessee Department of Transportation (TDOT) served a financial support role in this project. The project received a federal grant of $40 million dollars that had to be matched at an 80 percent federal/20 percent local basis. The 80 percent federal share of the project cost ($30.1 million) consisted of 61 percent FTA New Starts fixed guideway discretionary grant funding and 19 percent Federal Highway Administration Surface Transportation Program grant funding. The remaining 20 percent match of $7.5 million was to be provided by TDOT ($3.7 million or 10 percent) and by the local jurisdictions ($3.7 million or 10 percent). Local jurisdictions consist of Davidson (through the Metropolitan Government of Nashville-Davidson County) and Wilson Counties, Mt. Juliet, Lebanon, and the Nashville and Eastern Railroad Authority (21). In addition to providing half of the 20 percent matching funds, TDOT also was to provide cash flow assistance through initial operating funding at the rate of $0.94 per passenger mile that were taken into account in the RTA’s operations and maintenance funding plan (22). TDOT also provided analytical support as a member of the RTA board. An example of such support was TDOT’s funding of studies to analyze the financial risks that both TDOT and RTA were taking in implementing the initial commuter rail corridor in the Nashville area. In spite of extensive financial and operational studies, the Music City Star commuter rail project came to a financial crisis in the summer of 2008 following lower than projected ridership and higher than expected operating costs. These aspects have been primarily attributed to the lack of a downtown terminal near workplaces in the CBD and to unanticipated rises in fuel costs, among other factors, respectively. A state comptroller report was highly critical of the financial practices of the Nashville RTA and noted a shortfall of approximately $1.7 million.

61
TDOT’s interest in protecting its prior investments in the commuter rail line and its motivation to see it succeed resulted in TDOT granting an additional $1 million to the project. Ultimately the management and operation of the Music City Star were transferred to the leadership team of the Nashville-area Metropolitan Transit Agency (MTA)—the operator of Nashville’s urban bus transit system—for a three-year period while more stable funding is identified for the RTA. This arrangement was adopted on October 23, 2008, to be effective December 1, 2008 (18). While the MTA leadership team will take over day-to-day operations, the RTA board will stay in place. Potential sources for providing the remaining funds to address the shortfall have been an increase in the gas tax, an increase in vehicle registration or driver license fees or an alcohol tax. The funding question will be addressed in the next state legislative session (19). Lessons for TxDOT One of the most vital roles that a state DOT can play in helping a transit agency begin commuter rail service is the provision of capital and/or operating funds. In this case, TDOT provided 10 percent or one-half of the 20 percent match to the federal grants for this project. Because the overall capital costs were fixed from the beginning, TDOT could know with certainty what its costs would be in this case. If similar opportunities presented themselves in Texas, TxDOT could use its available funding to allow a regional transit agency to implement its project without having to invest the entire capital cost for the system. Limited initial operating support could also give a commuter rail project the boost that it needs to become successful, allowing those funds to be reduced and diverted to another worthy project elsewhere in the state. Program coordination as a partner with local agencies and funding of analytical studies is also another important role that could be played by the state DOT. Lessons from the financial crisis and its management suggest the importance of accurate ridership and revenue estimates before state funds are committed. The importance of having a stable funding source is also reiterated. NEW MEXICO RAILRUNNER Implementing Agency: Mid-Region Council of Governments (MRCOG) and
New Mexico Department of Transportation Type of Agency: Regional COG/State Department of Transportation
Regional Transit Agency State DOT Role: Direct state funding for capital and operational support; Provide acquisition and project management oversight; and Coordinate purchase of existing rail ROW for Phase I
(Figure 17) and use of I-25 median for Phase II (Figure 18).

62
Figure 17. New Mexico RailRunner Map-Phase I.
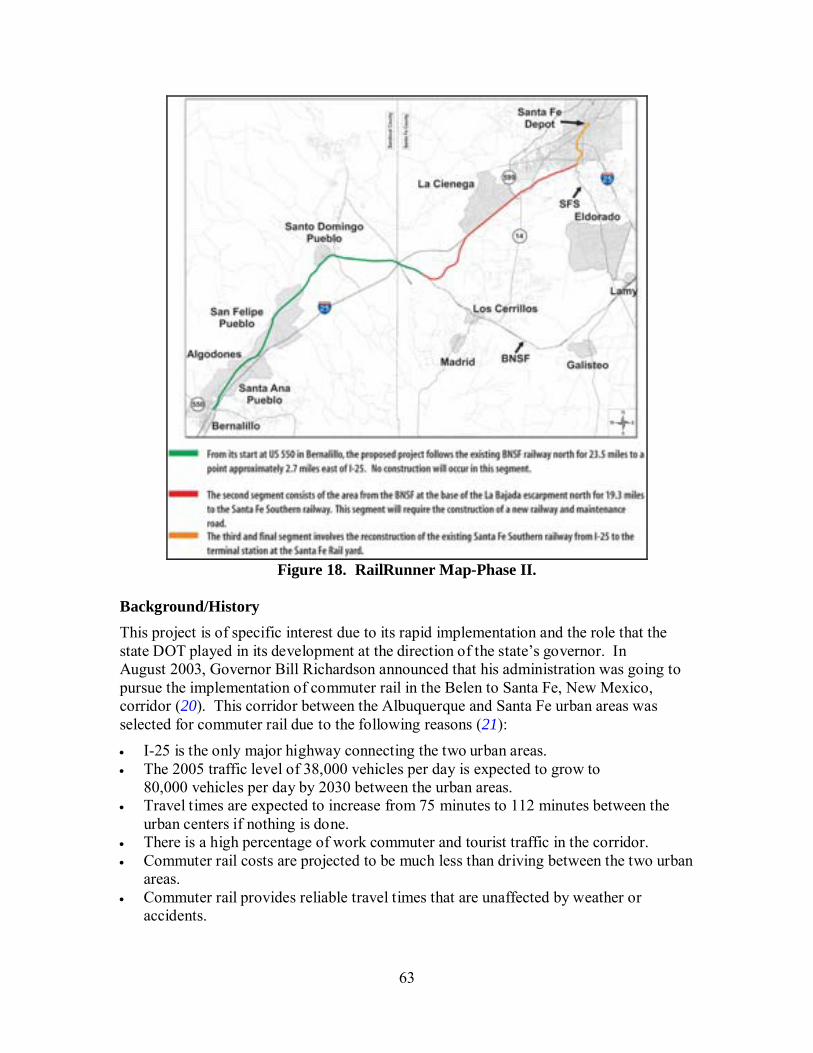
63
Figure 18. RailRunner Map-Phase II.
Background/History This project is of specific interest due to its rapid implementation and the role that the state DOT played in its development at the direction of the state’s governor. In August 2003, Governor Bill Richardson announced that his administration was going to pursue the implementation of commuter rail in the Belen to Santa Fe, New Mexico, corridor (20). This corridor between the Albuquerque and Santa Fe urban areas was selected for commuter rail due to the following reasons (21): • I-25 is the only major highway connecting the two urban areas. • The 2005 traffic level of 38,000 vehicles per day is expected to grow to
80,000 vehicles per day by 2030 between the urban areas. • Travel times are expected to increase from 75 minutes to 112 minutes between the
urban centers if nothing is done. • There is a high percentage of work commuter and tourist traffic in the corridor. • Commuter rail costs are projected to be much less than driving between the two urban
areas. • Commuter rail provides reliable travel times that are unaffected by weather or
accidents.

64
The Governor’s Office provided the New Mexico Department of Transportation (NMDOT) and Mid-Region COG (MRCOG) with grants of $1 million to start implementation of the project prior to a special session of the New Mexico Legislature in September 2003 that passed House Bill 15 funding this project and several others. In total, the transportation improvements bill, now know as Governor Richardson’s Investment Partnership (GRIP), is a $1.6 billion package in total (20). MRCOG and NMDOT subsequently developed a two-phase implementation plan with Phase I extending from Belen (south of Albuquerque) to Bernalillo and Phase II from Bernalillo to Santa Fe. The project began limited operations on Phase I in July 2006 and over the entire Phase I Corridor by mid-2007. Phase II was completed and operational in December 2008 (25). This rapid implementation was made possible due to the joint efforts of MRCOG and NMDOT who partnered in many aspects of acquisition (rail line, ROW, rolling stock, etc.), safety (crossing improvements, signal upgrades, etc.), and public awareness campaigns (public meetings, signage, etc.) The involvement of the state DOT will be described further below. The rapidity of completing the project was also a result of the state and project managers choosing not to seek federal funding assistance for the initial capital expenses. Summary Statistics
• Length: Phase I: 51 miles Phase II: 48 miles Additional rail to CO state line purchased by state: 170 miles;
• Mode: Commuter Rail/Locomotive-hauled passenger coaches; • Costs: Phase I: $75 million Phase II: $250 million (est.); • Status: Phase I began operations in July 2006, Phase II under construction; • Tasks Remaining: Completion of Phase II to Santa Fe; and • Scheduled Completion: Phase II scheduled to begin operations by December 2008. Involvement of State DOT The involvement of the New Mexico Department of Transportation (NMDOT) in this project is substantial. While the MRCOG is the designated lead agency, the NMDOT, acting on behalf of the state, has been instrumental in seeing the initial phases of this project come to fruition. NMDOT’s primary role has been to assist by issuing joint Requests for Proposals with MRCOG for acquisition of necessary services and capital purchases such as an operations contractor, rolling stock purchasing consultant (locomotives and passenger coaches), and contractors to construct needed track improvements. NMDOT was also key in applying funds from the state transportation investment bill, the GRIP, to project elements. NMDOT was at the forefront of negotiations between the MRCOG and the Burlington Northern Santa Fe Railway (BNSF) that resulted in the decision for the state to purchase the underutilized line over which the service is to operate from the BNSF rather than the state purchasing capacity to operate over the freight line. As a result, the state now controls the operations and sets priorities over the line with BNSF freight train operations as a tenant of the state. NMDOT is also choosing

65
to direct a portion of the CMAQ funding that it receives from FHWA and distribute to MRCOG on an annual basis to support operational costs of the RailRunner. After a series of negotiations over a two-year period, the State of New Mexico was able to arrange for the purchase of the entire BNSF line from Belen to the Colorado state line for a total of $75 million. Two of the three closings necessary for this transaction have been completed–$50 million for the segment (including adjoining ROW and spur tracks) from Belen to Bernalillo and $20 million for the segment from Bernalillo to Lamy. The remaining $5 million closing is scheduled for December 2008 to purchase the section from Lamy to the Colorado state line. Specific maintenance and dispatch procedures are in place for each section and have been included in the agreement between the state and BNSF (20). This cost equates to an average cost of approximately $250,000 per mile for the track on this project as compared to a cost of well over $1 million per mile for new track construction in rural areas and in the tens of millions of dollars per mile for track in urban areas. State ownership also resulted in a reduced cost of track improvements from approximately $30 million to approximately $10 million, due to the state having less stringent requirements. In addition to funding and acquisition assistance, NMDOT also participated in public awareness events, grade crossing safety improvements, local first responder emergency training events, and provided additional signage around the stations. NMDOT, acting on behalf of the state, was very successful in seeing Phase I through to completion in record time. Now NMDOT and MRCOG then turned their sights to Phase II, which is estimated to cost approximately $250 million. This phase follows the existing tracks to a point 23.5 miles north of Bernalillo where new tracks transitioning into the median of I-25 were built in order to more directly serve the Santa Fe urban area. The final segment involved reconstruction of the existing Santa Fe Southern railway to the terminal station at the Santa Fe railyard (25). NMDOT has played a vital role in allowing for the design of this phase of the project to use existing highway ROW by coordinating its use with the FHWA and developing access plans in and around stations located within the I-25 ROW. Throughout the alternatives analysis, NMDOT has worked cooperatively with MRCOG to investigate and select the route included in these final plans. This project phase was completed in December 2008. The state is purchasing the remaining portion of the BNSF line from Lamy to the Colorado state line, largely to preserve the line for future use. No commuter rail projects are currently being planned along the line north of Santa Fe. Lessons for TxDOT The State of Texas and TxDOT, in particular, can learn much from the aggressive steps taken to successfully implement of commuter rail service by NMDOT and its partners between the Albuquerque and Santa Fe urban areas. TxDOT must also be aware, however, because special conditions existed in the New Mexico situation that may not apply in Texas. For example, the existing freight rail line that connected the two cities was a line that was underutilized by the BNSF Railway following its merger in 1995. BNSF’s emphasis had turned to east-west movement along its transcontinental route

66
through New Mexico with many fewer trains operating north-south along the line that was desired for commuter rail service. As a result of negotiations with the railroad, the best possible solution for both parties became state purchase and ownership of the line with the BNSF freight rail operations remaining as a tenant on the line. While the idea of state ownership with tenant freight rail service is certainly one that must be explored, the amount of freight traffic along the lines connecting major urban areas in Texas would indicate that it would be much more difficult to get a Class I railroad to sell its track and ROW between urban areas. An exception to this may be on the fringes of large urban areas where operations may be consolidated; however, most of the intercity routes in Texas would be too costly for the state to purchase outright. The fact that the state and the railroad negotiated openly and in good faith to reach the most effective solution should be a part of future railroad negotiations by TxDOT. This case study also points out that the state DOT can work cooperatively with local MPOs, in this case a Council of Governments, to carry out the objectives of a statewide, legislatively mandated program of transportation improvements. NMDOT’s application of funding (as originally directed by an executive order and later enabled by appropriated funds) resulted in implementation of this project in record time. Use of existing DOT connections and processes to streamline acquisition of rolling stock, perform necessary studies, and carry out public involvement activities should also be exemplary to TxDOT. UTAH TRANSIT AUTHORITY FRONTRUNNER NORTH PROJECT Implementing Agency: Utah Transit Authority (UTA) Type of Agency: Regional Transportation Authority State DOT Role: Support role- assisted regional authority in advance ROW
purchases and preservation, provision of transportation corridor ROW revolving fund
Background/History The UTA FrontRunner (Figure 19) project began construction in 2006 following the approval of a U.S. DOT Fully Funded Grant Agreement to the UTA for $486 million (80 percent federal share of the total estimated cost of $581 million) (27). The line goes north-south between Pleasant View/Ogden and Salt Lake City. The line runs mainly along the UP freight rail right-of-way. UTA negotiated the purchase of some UP trackage and adjacent ROW in the corridor north and south of Salt Lake City in 2002 following UP’s merger with Southern Pacific. Additional ROW along the track was also purchased by the public sector and held until construction funding could be secured. UTA constructed 38 miles of new track in the adjacent ROW. UP and the FrontRunner share track between Ogden and Pleasant View. Operations between Ogden and Salt Lake City began in May 2008 with the last six miles between Ogden and Pleasant View being operated by bus until October when rail service was begun (28).

67
Figure 19. UTA FrontRunner Map.
Summary Statistics • Length: 44 miles in northern segment (additional southern route planned as second
phase); • Mode: Commuter Rail/Locomotive-hauled coaches; • Cost: $581 million; and • Status: 38 mile start-up segment operational since May 2008; final six miles on
northern end became operational October 2008.

68
Involvement of State DOT The involvement of the Utah Department of Transportation (UDOT) in the UTA FrontRunner project was largely limited to acting in a support role for the regional transit agency. The UTA had previously been successful in dealing with the UP to purchase excess post-merger rail lines in construction of its light rail service within Salt Lake City. In this case, the UTA wanted to work out an agreement with the UP to build itself an additional track in the ROW alongside the existing rail line. UDOT’s role was largely its assistance in helping UTA to acquire and hold the ROW while planning and federal funding commitments could be secured. UDOT also supported the efforts to pass and enacted provisions of Utah legislation to create a Corridor Preservation Advisory Council and a Transportation Corridor Revolving Loan Fund (29). Lessons for TxDOT In large cities where the regional transportation authority or local transportation agency has a history of purchasing existing rail lines or working directly with the railroads, it may be best for the state DOT to allow the local agency to continue in this role. The DOT can assist by administering funding programs authorized by the legislature or assisting with advance ROW acquisition. Preserving these corridors for some time period may be necessary in order to allow time for a project to advance and/or receive funding from a federal program such as the New Starts program or another funding source.
69
SECTION 6: LIGHT AND COMMUTER RAIL IN TEXAS
Metropolitan Planning Organizations (MPOs) are required by state and federal law to plan for transportation facilities and services within their urban areas. This includes light and commuter rail projects developed by local transit authorities. The MPO planning process requires the development and adoption of a long-range metropolitan transportation plan for each urban area, prioritization of transportation projects in the plan, and that specific funding sources and dollar amounts be identified from known, available revenues. These prioritized projects are contained in the Transportation Improvement Program adopted by each MPO and forwarded to the state for inclusion in its State Transportation Improvement Program (STIP). TxDOT districts work closely with the state’s MPOs and transit authorities to coordinate projects within each metropolitan area. The primary functions of both TxDOT district personnel and local and regional government agencies involved with rail planning are to monitor local rail transportation needs and, when necessary, initiate rail development projects by either working directly with the railroad or contacting the TxDOT district or division rail planning staff for assistance and/or guidance. EXISTING AND PROPOSED COMMUTER RAIL SYSTEMS Passenger rail service in Texas is currently provided at the regional/intercity level by the National Railroad Passenger Corporation (Amtrak) and at the commuter level by Dallas Area Rapid Transit (DART) and Fort Worth Transportation Authority (the “T”). There are also two light rail systems owned and operated by transit agencies in the Dallas-Fort Worth and Houston urban areas. The existing and proposed light and commuter rails are briefly described below. Trinity Railway Express—Dallas and Fort Worth The Trinity Railway Express (TRE) commuter rail service is a service provided by DART and the “T.” The map in Figure 20 shows the TRE system. Phase one of the TRE (10 miles) was opened in December 1996, providing service between Dallas and Irving. The system now covers approximately 35 miles serving nine permanent stations and one special event station at the American Airlines Center sports arena. The TRE represents one of the most significant joint services between the two largest metroplex cities. The lines were sold by Union Pacific and could provide links to Denton, Sherman, and Rockwall. DART has no current plans to extend service to these locations, but maintaining the option to expand their network will become increasingly important as the metroplex continues to grow. DART already owns lines to Duncanville, Fort Worth, and Wylie. The lines run parallel to major roadways in the region (I-35, U.S. 75, and I-30) and commuter rail may someday be an option for expanding capacity along these corridors.

70
Figure 20. Trinity Railway Express Route Map.
Commuter and Light Rail Planning in the NCTCOG Area The North Central Texas Council of Governments (NCTCOG) has been extremely active in the past several years in planning for the expansion of its existing light and commuter rail systems to provide additional transportation options to address the rapid population growth expected in the area between now and 2030. In late 2004, the NCTCOG Regional Rail Corridor Study was completed (30). This study identified 10 potential rail corridors that could be developed. A map of these corridors is shown in Figure 21. Most of these corridors follow existing rail rights of way in the DFW area or abandoned freight rail rights of way that may have been acquired by the public sector.

71
Figure 21. Corridors Identified by the 2004 NCTCOG
Regional Rail Corridor Study. Since Dallas, Fort Worth, and Denton had already created transit agencies that were using some or all of the one cent tax per dollar allotted to transit from the general sales tax, it quickly became apparent that funding the development of such an expansive passenger rail network would require a new funding source or additional capacity to expand the sales tax beyond the statutory 8.5 percent limit in those areas. Other regional cities were also at the sales tax limit; however, their sales tax funding was already committed to economic development or other designated uses. Attempts by local leaders within the DFW area to raise the sales tax limit for the region for the specific purpose of transit improvements in both the 2005 and 2007 legislative sessions failed. As a result, a new approach was being attempted in the 2009 Texas Legislature when this report was submitted. Originally, the NCTCOG put forth the Rail North Texas plan as a means to seek several additional avenues to fund rail service expansion in the NCTCOG area. A map of the Rail North Texas corridors under consideration for passenger rail is shown in Figure 22. It shows that several additional corridors in addition to those identified in the previous Regional Rail Corridor Study are currently being assessed for future rail service. The map also shows that while some of the corridors have identified funding, there are still approximately 251 miles of corridor that do not have a funding source and are in danger of being dropped.

72
The Rail North Texas proposal includes a menu of funding options (i.e., new citizen impact fees, auto registration fees, taxes, etc.) that would have to be approved by each local municipality by a vote before adoption. At the time of this report, the proposal is still under consideration by the legislature and has been changed in name to the “Texas Local Option Transportation Act” since several other large urban regions in the state have expressed support for the initiative. Much like toll road funding, creative approaches such as the Rail North Texas plan will need to be put in place in order for passenger rail system development to continue.
Figure 22. Map of NCTCOG Rail North Texas Rail Lines under Consideration.

73
Austin-San Antonio Intermunicipal Commuter Rail District In 1997, the 75th Texas Legislature passed a law allowing the creation of an “intermunicipal commuter rail district” to study and, if desired, create and operate a commuter rail system in the corridor between Austin and San Antonio. The legislation allowed a Commuter Rail District to be formed if the cities of Austin and San Antonio as well as Travis and Bexar Counties adopted resolutions calling for district formation. Other cities and counties along the route were also permitted to join the district. In 1999, an initial feasibility study concluded that commuter rail in the corridor was both technically and financially feasible based upon the premise that construction of a second mainline track would be constructed for the commuter rail service in the existing Union Pacific freight rail right of way. The estimated cost for this route and configuration was $475 million in 1998 dollars (31). The Austin-San Antonio Intermunicipal Commuter Rail District (ASA-ICRD) was formed in November 2002 with a 14-member board representing regional transportation planning entities. The federal government provided $5.625 million in funding for preliminary engineering and planning studies along the corridor and to update the 1999 feasibility study in order to reflect current regional desires on how best to develop such a system (Figure 23).

74
Figure 23. The Austin-San Antonio Intermunicipal Commuter Rail District.
Both the Capital Area Metropolitan Planning Organization (CAMPO) and the San Antonio-Bexar County Metropolitan Transportation Planning Organization have included consideration of a commuter rail system between Austin and San Antonio as a component of their 2025 long-range transportation plans and have approved the locally preferred alternative presented by the ASA-ICRD. Consultants for the ASA-ICRD updated the feasibility study in 2004 and are preparing the necessary planning and preliminary engineering documentation in order to submit a New Starts application to the Federal Transit Administration.

75
Capital Metro’s Urban Commuter Rail Line In November 2004, Capital Metro received voter approval to develop a commuter rail line in the Austin metropolitan area (Figure 24). The Urban Commuter rail line is part of Capital Metro’s “All Systems Go” transit projects, a long-range vision for the region that combines rail and bus solutions to address the area’s transportation challenges. The urban commuter rail service will initially operate on Capital Metro’s existing 32-mile Northwest Line. Capital Metro sought public input to the All Systems Go plan prior to the voter referendum, and is coordinating planning, facilities, and services with TxDOT, the Austin San Antonio Intermunicipal Commuter Rail District, and the Central Texas Regional Mobility Authority.
Figure 24. Capital Metro Commuter Rail Line.
76
Houston-Rosenberg Commuter Rail Feasibility Study The Houston-Galveston Area Council (H-GAC), in cooperation with the TxDOT Houston District and Transportation Planning and Programming Division initiated a commuter rail feasibility study along the U.S. 90A Corridor, which travels from Houston into Fort Bend County through the cities of Stafford, Missouri City, Sugar Land, Richmond, and Rosenberg. The eastern end of the study corridor could link-up with the southern end of Harris County Metropolitan Transit Authority’s METRORail light rail project near the Astrodome and Reliant Stadium. This corridor has seen dramatic increases in congestion over the past decade, with average vehicle speeds in the afternoon averaging around 15 mph. The study was completed in April 2004 and discusses the feasibility of five alternatives to implement commuter rail services on UP’s “Sunset Route” between Houston and Rosenberg, which generally parallels U.S. 90A. Harris County Commuter Rail Analyses The TxDOT Houston District commissioned a major investment study (MIS) for the U.S. 290 Corridor which was completed in January 2003. This was the first MIS in Texas to include a rail component in its preferred alternative. The Harris County Public Infrastructure Department then commissioned a preliminary study to explore the potential for developing commuter rail systems along both the U.S. 290 and S.H. 249 Corridors in northwestern Harris County. That study was completed in December 2003, and its primary focus was to examine the physical, operational, and relative cost characteristics of commuter rail operations in those corridors as well as the U.S. 90A Corridor. The study determined that the existing rail network in these corridors could be revamped to consolidate freight operations in a more efficient manner and allow the development of commuter rail services to improve Houston’s mobility. H-GAC conducted a follow-up study on commuter rail. Published in 2008, “Regional Rail Connectivity Study” looked at all commuter rail opportunities in the region (32). The study recommended advancing five commuter rail corridors into advanced planning (Figure 25). The conceptual plan would cost $3 billion to develop the five identified lines.

77
Source: “Regional Rail Connectivity Study,” H-GAC, 2008
Figure 25. H-GAC Conceptual Regional Rail Plan. LIGHT RAIL SERVICES Currently local light rail services in the state are limited to the cities of Dallas and Houston with passenger rail services in these cities operated by the local transit agencies. Dallas Area Rapid Transit (DART) The DART light rail system has two lines: the Red Line and the Blue Line. DART’s Red Line operates along the North Central Expressway from Plano to Westmoreland in western Oak Cliff. The Blue Line runs south from downtown Garland to Ledbetter in southern Oak Cliff. Both lines serve all downtown Dallas stations. The DART system also connects to the TRE commuter rail line. The system consists of 44 miles of rail serving 34 stations (Figure 26). The fleet is comprised of 95 light rail vehicles, and ridership totals approximately 13.5 million passenger trips per year. The average weekday ridership was 55,000 passengers in 2004. The current long-term funding program will provide light rail lines to Fair Park and Market Center by 2010; Love Field, Pleasant Grove, Carrollton and Farmers Branch by 2011; and Las Colinas and Dallas/Fort Worth International Airport by 2014.
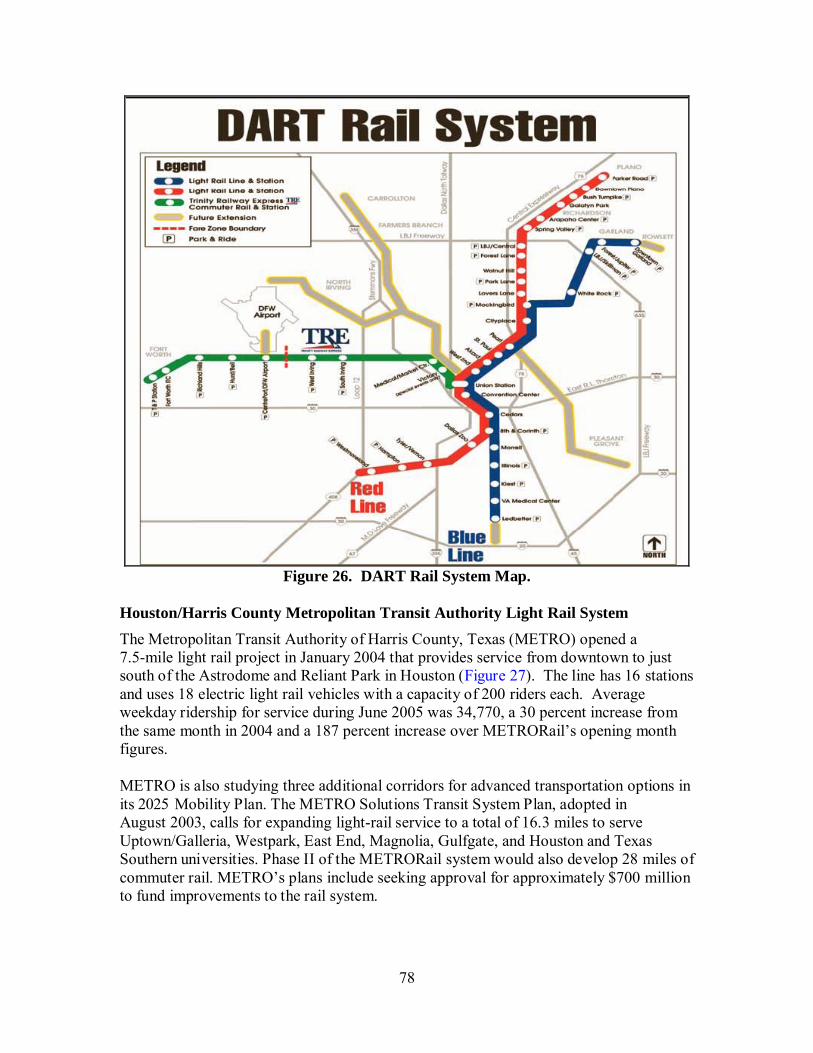
78
Figure 26. DART Rail System Map.
Houston/Harris County Metropolitan Transit Authority Light Rail System The Metropolitan Transit Authority of Harris County, Texas (METRO) opened a 7.5-mile light rail project in January 2004 that provides service from downtown to just south of the Astrodome and Reliant Park in Houston (Figure 27). The line has 16 stations and uses 18 electric light rail vehicles with a capacity of 200 riders each. Average weekday ridership for service during June 2005 was 34,770, a 30 percent increase from the same month in 2004 and a 187 percent increase over METRORail’s opening month figures. METRO is also studying three additional corridors for advanced transportation options in its 2025 Mobility Plan. The METRO Solutions Transit System Plan, adopted in August 2003, calls for expanding light-rail service to a total of 16.3 miles to serve Uptown/Galleria, Westpark, East End, Magnolia, Gulfgate, and Houston and Texas Southern universities. Phase II of the METRORail system would also develop 28 miles of commuter rail. METRO’s plans include seeking approval for approximately $700 million to fund improvements to the rail system.

79
Figure 27. Houston METRORail System Map.


81
SECTION 7: TXDOT AND RAIL PLANNING/FUNDING
According to TxDOT’s Texas Rail System Plan, the most significant current issues facing Texas rail and transportation providers are: • safety, • freight efficiencies, • congestion relief, and • corridor availability. TxDOT’s immediate rail program is focused on improving rail freight efficiencies, optimizing the public benefits of rail transportation projects, and preserving transportation corridors for future services and connectivity to future facilities. The current program relies on: • new legislative tools; • potential significant corridor development; and • potential public benefits of public-private partnerships with freight railroads to
relocate through freight traffic in key areas of the state. The 78th and 79th Texas Legislatures passed legislation that enhances TxDOT’s ability to improve transportation safety and infrastructure in Texas. The major rail issues addressed by this legislation are: • TxDOT assumes all powers and duties related to railroads from the Texas Railroad
Commission; • TxDOT will be allowed to acquire, finance, construct, maintain, and operate freight
or passenger rail; • TxDOT will administer most federal funding used on construction or maintenance of
rail infrastructure; • TxDOT may enter into Comprehensive Development Agreements for rail projects;
and • TxDOT may enter into agreements with public or private entities using pass-through
fares for reimbursement of facility expenses. This legislation increases TxDOT’s involvement in rail projects and the further development of the state’s multimodal transportation system via proposed new systems and railroad relocation projects. The Railroad Relocation and Improvement Fund should enable TxDOT to plan, design, and implement passenger and freight rail relocation and improvement projects that support the objectives and supporting actions of the Texas Rail Plan. Table 5 is a list of plan objectives.

82
Table 5. Texas Rail System Plan Objectives.
The state rail plan documents consist of a standalone Texas Rail System Plan Summary and the Texas Rail System Plan (TRSP). The TRSP Summary was developed at the direction of the Texas Transportation Commission (Commission). The detailed TRSP is a comprehensive document that addresses the railroad system of Texas and is structured according to federal guidelines. Both documents are available online at the TxDOT website or by contacting the Multimodal Section of the Transportation Planning and Programming Division of TxDOT.

83
TxDOT Rail Freight Studies TxDOT has been working with several engineering consulting firms over the past three years to conduct detailed regional studies of freight rail system engineering and capacity needs in major urban areas and regions of the state. These studies are focused on improving freight flows and identifying areas where rail lines could potentially be consolidated or relocated to reduce traffic impacts and, at the same time, improve freight rail flows. As a secondary consideration, projects identified in the freight rail studies could also potentially free up capacity in existing rail corridors allowing for the introduction of commuter or light rail transit service or for other transportation uses. Reports on the Houston-Galveston area and the San Antonio Region as well as a study examining the possibility of relocating freight rail through trains in Central Texas between San Antonio and Taylor have been completed and are posted on TxDOT’s website. Studies are currently underway in East Texas, West Texas, the Corpus Christi area, and the Dallas/Fort Worth area. A future planned study area is the Rio Grande Valley region in south Texas. TxDOT’s involvement in these studies and their support for regional studies sponsored by NCTCOG and other regional planning agencies is crucial to the future planning of light and commuter rail systems in the urban areas of the state. This is especially true in the Dallas/Fort Worth area where the Tower 55 area rail study is currently underway to examine freight rail congestion at this major national rail intersection located in downtown Fort Worth. TxDOT’s ongoing study team and the NCTCOG study team are working together to identify solutions that will not only solve the freight rail problems but also provide for future capacity to address light rail, commuter rail, and even intercity passenger rail needs. TxDOT is also considering even longer term solutions, along with city and regional planners that may divert some of this rail freight traffic outside the urban areas to an alternative, bypass route. RAIL FUNDING This section focuses on the sources of rail transportation funding potentially available to TxDOT. Federal Sources Almost all federal funding for transportation projects comes from the U.S. Department of Transportation. Within this department, several different agencies exist that have the potential to fund rail projects out of distinct funding categories. Rail projects are most likely to be funded through FRA, FTA, and FHWA.

84
Possible federal sources for funding rail projects include programs under previous transportation authorizations and the latest reauthorization enacted under SAFETEA-LU. The federal programs that can fund rail projects include: • National Highway System (NHS) Funds – These funds can be used to improve almost
any highway network link on the designated NHS to accommodate intermodal movements. Selected rail projects that are part of highway construction plans may be eligible for NHS funding.
• Surface Transportation Program (STP) – This program allows the use of federal funds to make highway improvements in order to accommodate a rail line, including increasing bridge clearances, upgrading crossing signals, and improving highway-rail crossing surfaces.
• Congestion Mitigation and Air Quality (CMAQ) Improvement – These funds are available for projects that reduce congestion and/or improve air quality. These funds are available only in those metropolitan planning areas that have been designated as federal air quality “non-attainment” areas. MPOs around the U.S. have used these funds to upgrade rail yards, construct intermodal transfer facilities, rehabilitate branch-lines, add sidings and spur tracks, and improve bridge clearances to allow double-stack container service.
• Transportation Infrastructure Finance and Innovation Act – This act allows the federal government to make loans and loan guarantees available for major transportation investments of national significance, including intermodal facilities. Examples of how this funding source has been used include construction of an intermodal transfer center, construction of an international airport, and expansion and refurbishment of a train station for intermodal use.
• National Corridor Planning and Development – This program provides funds for planning, project development, and construction of high priority corridors throughout the United States, but all funds are supplied through congressional appropriations.
• Coordinated Border Infrastructure Program – This is a formula program that provides funding for transportation and safety infrastructure improvements, operational improvements, and inspection improvements in border states to facilitate international trade and transportation.
• Transportation and Community and System Preservation Pilot Program – These funds are available to achieve locally determined goals such as improving transportation efficiency; reducing the negative impacts of transportation upon the environment; providing access to jobs, services and trade centers; reducing the need for costly future infrastructure; and revitalizing underdeveloped and brownfield sites.
• Transportation Enhancement Program – These funds are designated for projects that are designed to strengthen the cultural, aesthetic, and environmental aspects of the nation’s intermodal system.
The funds available from these programs vary by year according to the level of funding provided by Congress and the amount of those funds that are flexible and not strictly obligated to highway projects. FHWA and FTA project the amount of funds likely to be available in order to administer these programs in an efficient and timely basis.

85
New Capital Assistance for Intercity Passenger Rail The FRA is administering a new grant program: Capital Assistance to States – Intercity Passenger Rail Service Program. The grant program provides the first ever federal-state funding partnership to improve and expand intercity passenger rail service and began accepting applications on March 18, 2008. The $30 million capital grant program requires a 50-50 funding match like most other transportation investments. Projects that demonstrate an on-time performance standard of 80 percent or greater, reduce travel time, increase service frequency, or enhance service quality for intercity rail passengers will receive favorable consideration for funding. Eligible projects include but are not limited to: upgrading existing track to permit higher maximum operating speeds, adding or lengthening passing tracks to increase rail line capacity, improving track switches and signaling systems to advance reliability and safety, and purchasing new passenger rail cars to enhance the travel experience. Individual or multiple States working together can submit applications. The full Notice of Funding Availability can be found at: http://www.fra.dot.gov/statecapitalgrants. Rail Funding in SAFETEA-LU The current federal transportation authorization legislation, SAFETEA-LU included an important new funding tool and some modifications that may affect Texas rail projects: • Sec. 9001 – High Speed Rail Corridor Development. This section reauthorized the
Swift Rail Development Act but made some technical amendments to the legislative language. The Act now pertains to corridor development only, removing the possibility of funding planning activities. The Act provides $100 million per year from FY 06 – FY 13. Seventy percent will be applied to corridor development and 30 percent will be applied to new technology development.
• Sec. 9002 – Capital Grants for Rail Line Relocation Projects. This new section establishes a grant program to provide financial assistance for local rail line relocation and improvement projects. For a state to be eligible for these funds an improvement construction project must either:
o mitigate the adverse effects of rail traffic on: safety; motor vehicle flow; community quality of life, including noise mitigation or economic
development; and freight and passenger rail operations; or
o involve the lateral or vertical relocation of any portion of the rail line.
• The fund provides $350 million per year for FY 06 – FY 09. Eligible entities will be required to pay at least 10 percent of the project costs, which can come in the form of real property, in-kind services, or previous money spent on the project before the application was filed. States may seek financial contributions from private entities that would benefit from the projects.

86
• Sec. 9003 – Rail Rehabilitation and Improvement Financing (RRIF). This program provides loans and loan guarantees for projects such as rail relocations, acquisition, development, improvement, or rehabilitation of intermodal and rail equipment or facilities, or projects that will enhance service and capacity in the national transportation system. Changes were made to the program, which had been criticized for having too many obstacles to participation. Projects are prioritized based on the following criteria:
o included in state transportation plan(s), o enhance safety, o enhance the environment, o enhance or preserve service to small communities or rural areas, o enhance service and capacity in the national transportation system, o promote economic development, and o promote U.S. competitiveness.
• The RRIF program offers opportunities for implementing a wide variety of railroad projects and meeting some of the critical capital investment needs of the rail industry. Under the RRIF program, FRA may provide direct loans and loan guarantees. The funding may be used to:
o acquire, improve, or rehabilitate intermodal or rail equipment or facilities, including track, bridges, yards, buildings, and shops;
o refinance outstanding debt incurred for the purposes listed above; and o develop or establish new intermodal or railroad facilities.
Eligible borrowers include railroads, state and local governments, government sponsored authorities and corporations, and joint ventures that include at least one railroad. A total of $35 billion is authorized under this program with a cap on funds available to Class I railroads of $7 billion. Changes were also made to possible restrictions based on available collateral and a requirement that the borrower must have been previously turned down by a private lending institution. State Sources TxDOT is limited in its ability to expend funds on rail projects without specific legislative appropriations. However, the 78th and 79th Texas Legislatures passed legislation that would enhance TxDOT’s ability to improve transportation safety and infrastructure in Texas. Current rail funding sources permitted under HB 3588 (78th Legislature) and HB 2702 (79th Legislature) include: • non-dedicated funds from the State Highway Fund; • bonds secured by the Texas Mobility Fund for passenger rail projects; • donations; • loans from the State Infrastructure Bank (SIB); • pass-through fares; and • grants or loans from the federal government, public or private entities that finance
design, acquisition, construction, maintenance, or operation of a rail facility or system. Funds utilized for a specific rail facility or project will be allocated by the Commission based upon project specific eligibility or by legislative appropriations.

87
The current focus of rail issues at the district and local level is identifying rail needs and securing funding for necessary studies. TxDOT district offices in air quality non-attainment areas can work with their local MPO to attempt to utilize CMAQ funds for local rail studies. Toll credits may also be used for the local match. At the state level, TxDOT is working to develop criteria and processes to allow the use of the Texas Mobility Fund for rail studies. Rail projects must prove a benefit to the highway system or public transit in order to utilize the Mobility Fund. Studies are necessary at all levels in order to apply for federal funds for actual rail projects and improvements.


89
SECTION 8: POTENTIAL TXDOT ROLES IN RAIL DEVELOPMENT
Based on the findings of the case studies described in the previous section, the research team determined that the state DOT is usually directly involved in longer distance, intercity commuter rail projects. In large, urbanized areas where the entire or most of the proposed route is contained within a single jurisdiction (MPO or regional/local transit agency), the local agency usually takes a more important role than the DOT in development of the project. Most MPOs/transit agencies in areas of this type have experience administering FTA funding for bus systems and having them take a lead role in commuter rail programs within their area helps make sure that the new rail route acts as a system with existing transit services. While the state DOT may have a limited role in shorter distance commuter rail and urban LRT development, we also found that there is a definite DOT role in interregional/ intercity passenger rail where the “commuter rail” service may connect two or more urban centers—acting as a regional transportation interface. We identified three broad areas in which the state DOT could play a primary role: financial support, planning assistance, and operational support. Tables 6, 7, and 8 outline some of the roles the DOT can play in each of these areas. Appendix B outlines a potential brochure communicating the impacts of light and commuter rail.

90
Table 6. Potential TxDOT Financial Roles. Potential Role Description Action Needed
Fund project studies State could fund feasibility, environmental impact, preliminary and final engineering studies for the project.
No additional authority needed; need to identify funding source(s).
Grant /loan capital State could provide direct funding through a general funding program for passenger rail or from specific appropriations from state or federal level.
No additional authority needed; need to identify funding source(s).
Grant/loan operations/ maintenance
State could provide financial assistance to support passenger rail operational and maintenance costs not covered by farebox revenue.
No additional authority needed; need to identify funding source(s).
Purchase of rolling stock State could purchase rolling stock (locomotives and passenger coaches) for use by the system. This is advantageous because rolling stock is an asset that has market value that could be sold to recoup a portion of the state investment if necessary.
Repeal of prohibition in state law (Transportation Code Sec. 227.026)
Fund infrastructure construction
State could fund capacity improvements: longer siding tracks, new track/sidings, improved bridges, new structures, signals, grade crossing safety equipment, etc.
No additional authority needed; need to identify funding source(s).
Acquire ROW /use existing highway ROW for rail
State could acquire ROW or allow use of state highway ROW for rail use and/or ask FHWA to allow ROW use for rail in federally funded highway corridors.
No additional authority needed; need to identify funding source(s).
Preserve rail line/corridor State could purchase or otherwise preserve abandoned freight rail or highway corridors for passenger rail use.
No additional authority needed; need to identify funding source(s).
Relocate or reuse freight rail corridor
State could work with railroad companies to relocate through freight services to alternative corridors leaving existing rail corridors for re-use as passenger routes.
No additional authority needed; need to identify funding source(s).
Own right-of-way for tax advantages/tax abatement
State (or RRTD) could own rail ROW and infrastructure relieving the private company of the property tax burden.
Legislation possibly required to compensate local governmental entities for removal of property from local tax rolls.

91
Table 7. Potential TxDOT Planning Assistance Roles. Potential Role Description Action Needed
Provide contracting expertise State DOT could assist local/regional authorities with contracting experience and/or contacts at the private railroad companies.
No additional authority needed.
Provide direct DOT contracting
State DOT could contract with the railroad company directly on behalf of the state in a multi-party agreement including the local/regional authority.
None known.
Coordinate statewide rail/ intermodal planning
State DOT could act in an advisory role to ensure that a local/regional project is coordinated well with other on-going state rail planning efforts such as the state rail planning document or other proposed inter-regional plans in other modes.
No additional authority needed.
Coordinate planning across institutional boundaries/regions
State DOT could assist local regional agencies in harmonization of planning efforts across jurisdictional and institutional boundaries and/or form a special commission made up of stakeholders to oversee the project.
No additional authority needed.
Assist with quiet zone/other rail safety planning initiatives at state level
State DOT could provide expertise in highway-rail grade crossing safety improvements needed to accommodate higher speed passenger rail routes or to implement a quiet zone where train horns would be eliminated based upon installation of other safety measures.
No additional authority needed.
Liaison with state/federal level agencies
State could act as liaison/single point-of-contact for the project with U.S. DOT agencies (FHWA, FRA, and FTA). State DOT could also coordinate with other state and federal agencies in the areas of land management, air quality, historic preservation, etc.
No additional authority needed.

92
Table 8. Potential Operations/Support Roles for TxDOT. Potential Role Description Action Needed
Fund/build/operate rail system as highway construction mitigation project
Some states have constructed passenger rail systems or added passenger rail in freight rail corridors initially as highway construction mitigation projects, later converting them to a separate project under a local/regional transit agency once the construction project was complete.
Consider rail components in major highway project development.
Act as single-point negotiations agent
State DOT would negotiate contractual issues and standardize agreements so that the railroad companies would not have to work out a separate agreement with each municipality along a proposed passenger rail corridor.
Establish/develop standard agreements.
Oversee contract negotiations/re-negotiations
Similar to the previous entry, the State DOT would act as an intermediary between local agencies/municipalities and the railroad companies.
Establish/develop standard agreements.
Encourage/support commuter rail or LRT development
State DOT could work to have beneficial legislation for funding and operations of intercity, CR, and LRT development within the state.
Support rail legislation through GPA Division.
Address liability concerns of both passenger and freight rail operators
State DOT could support legislative action to limit liability of freight railroads for allowing passenger service over their lines and on their corridors and for the passenger rail operators themselves. This could encourage additional services throughout the state by reducing insurance costs of each project.
Seek legislative changes to limit railroad liability for passenger rail projects on private railroad corridors.
Operate intercity/commuter rail system that would interface with local rail and bus transit systems
State DOT could directly pay for or operate a rail system.
Support changes to Transportation Code Section 227.023.
RAIL REGULATIONS AND TXDOT Appendix B displays a listing of code, policy, and regulations pertaining to TxDOT and rail development and operation. Most of the regulations govern the roles and responsibilities of TxDOT and railroad companies with respect to managing grade crossings, adjacent roadway repair, and safety.

93
There are many current policies that support TxDOT participation in passenger rail development in Texas. For example, HB 3588 and HB 2702 by the 78th and 79th Texas Legislatures enabled the expenditure of funds by TxDOT for rail projects. These and other legislative initiatives allow for increased TxDOT involvement in rail projects. Possible changes to some current policies would enhance TxDOT’s ability to advance passenger rail projects. The possible changes are noted below. Line Item Appropriation HB 3588 and HB 2702 also established rail funding guidelines for TxDOT. These guidelines limit TxDOT’s flexibility to expend funds. Specifically, HB 2702 provides that the department may not spend money from the general revenue fund for rail projects except pursuant to a line item appropriation (Section 1.05, 91.071). Although many projects like commuter or intercity rail are legislatively driven and funded, changing this limitation would provide the department with more funding flexibility. Rolling Stock Ownership HB 3588 prohibits TxDOT from owning rolling stock (Sec. 91.005 and 227.206). Other state DOTs have the ability to own rolling stock. For example, California purchases rolling stock for intercity rail lines operated by Amtrak. California owns a fleet of 88 cars and 17 locomotives and has spent over $300 million on equipment since the early 1990s with the majority of funding from bonds. One important benefit to department ownership of rolling stock is that it allows state money to go into an asset that can be sold or transferred for more than one project. Funding Rail Relocation and Improvement HB 1546 and HJR 54 established the rail relocation and improvement fund. Although the fund has been created, it has not been capitalized and therefore precludes TxDOT’s ability to fund relocation and improvement projects.


95
REFERENCES
1) Passenger Rail Primer. Thurston Passenger Rail Workgroup, Transit Cooperative Research Program (TCRP), November 2005.
2) FY 2009 New Starts and Small Starts Evaluation and Rating Process. Federal Transit Authority, Washington, D.C., July 20, 2007.
3) Federal Transit Authority website. Full-Funding Grant Agreements Guidance, Chapter II, Section 11, Washington. http://www.fta.dot.gov/funding/grants/grants_financing_4119. html.
4) Before and After Studies of New Starts Projects – Report to Congress (pp. 5-8). Federal Transit Authority, Washington, D.C., September 2007.
5) Lewis, David. “Measuring the Economic Value of Transit.” HDR|HDL Decision Economics. Washington, D.C.
6) Litman, T. Rail Transit in America: A Comprehensive Evaluation of Benefits. Victoria Transport Policy Institute, Victoria, B.C., Canada, October 9, 2008.
7) Bus Riders Union website. Consent Decree Compliance Campaign-History, Los Angeles. http://www.busridersunion.org/engli/Campaigns/consentdecree/consentdecreehistory.htm.
8) Bus Riders Union website. Consent Decree Compliance Campaign-Overview and Demands, Los Angeles. http://www.busridersunion.org/engli/Campaigns/consentdecree/consentdecreeoverview.htm.
9) Leonard, C. Measuring the Value of Transit Access for Dallas County: A Hedonic Approach. University of North Texas, 2007.
10) Weinstein, B., and T. Clower. “An Assessment of DART LRT on Taxable Property Valuations and Transit Oriented Development.” Center for Economic Development and Research, University of North Texas, Denton, TX, 2002.
11) Cervero, R. “Effects of Light and Commuter Rail on Land Prices: Experiences in San Diego County.” Journal of Transportation Research Forum, Vol. 43(1), 2004, pp. 121-138.
12) Morgan, C.A., J.E. Warner, C.E. Roco, S.S. Roop. Funding Strategies and Project Costs for State-Supported Intercity Passenger Rail: Selected Case Studies and Cost Data. Technical Report. 0-4723-1. Texas Transportation Institute, College Station, TX. June 2005.
13) Preserving Freight and Rail Passenger Corridors and Service. TranSystems Corporation. National Highway Cooperative Research Program (NHCRP) Synthesis 374. 2007.
14) Morgan, C.A., J.E. Warner, C.E. Roco, G.C. Anderson, L.E. Olson, S.S. Roop. Rail Relocation Projects in the U.S.: Case Studies and Lessons for Texas Rail Planning. Research Report. 0-5322-1. Texas Transportation Institute, College Station, TX. March 2007.
15) VTrans 2025. Virginia Department of Transportation. Richmond, Virginia. November 2004.
16) 2007 Annual Report to DRCOG on FasTracks: December 2007, Denver Regional Transportation District, Denver, CO, 2007.
17) Denver Regional Transportation District website. FasTracks Annual Program Evaluation Summary 2008, Denver, CO, 2008.
96
http://www.rtd-fastracks.com/media/uploads/main/2008_FasTracks_Summary.pdf. Accessed: October 29, 2008.
18) Tennessee Department of Transportation website. Tennessee Rail Systems Plan, Knoxville, October 2003. http://www.tdot.state.tn.us/publictrans/RailPlan/documents.htm. Accessed: May 2, 2008.
19) Music City Star website. Regional Transportation Authority, Nashville. http://www.musiccitystar.org/news.html.
20) Farquhar, W. T. Commuter Rail for $1.3 Million a Mile: How the Nashville Regional Transportation Authority Accomplished the Task. In 2007 Proceedings Rail Conference. CD-ROM. American Public Transportation Association, Washington, D.C., 2007.
21) Tennessee Department of Transportation website (PBS&J Engineers). A Risk Assessment of the East Corridor Commuter Rail Project. May 2004. http://www.tdot.state.tn.us/mediaroom/docs. Accessed: May 1, 2008.
22) Music City Star website. Regional Transportation Authority, Nashville. http://www.musiccitystar.org/news.html.
23) The Tennessean website. MTA to take over Music City Star operations newspaper article, Friday, October 24, 2008. http://www.tennessean.com/apps/pbcs.dll/article?AID=200881023102. Accessed: October 30, 2008.
24) The Tennessean website. Deal would put bus system in charge of commuter train newspaper article, Thursday, October 23, 2008. http://www.tennessean.com/apps/pbcs.dll/article?AID=2008810230351. Accessed: October 30, 2008.
25) Mid-Region Council of Governments/New Mexico Rail Runner Express website. Belen to Santa Fe Commuter Rail Project: Overview and Status of Project Elements, Revised January 5, 2008. http://www.nmrailrunner.com/project_phases.asp. Accessed: April 28, 2008.
26) New Mexico GRIP website. Why was Commuter Rail Considered and Why is it Important, Santa Fe, 2006. http://nmgrip.com/upload/images/pdf/whyrailproposed.pdf. Accessed: April 28, 2008.
27) American Public Transportation Association website. Passenger Transport, Mineta Finalizes FFGA for Salt Lake’s “FrontRunner,” Washington, June 26, 2006. www.apta.com. Accessed: October 30, 2008.
28) Utah Transit Authority website. UTA FrontRunner Fact Sheet. www.rideuta.com. Accessed: October 30, 2008.
29) State of Utah, Utah Administrative Code website. Rule R926-6. Transportation Corridor Preservation Revolving Loan Fund. http://www.rules.utah.gov/publicat/code/r926/r926-006.htm. Accessed: May 1, 2008.
30) Regional Rail Corridor Study. North Central Texas Council of Governments. Arlington, Texas. July 29, 2005.
31) Feasibility Report: Austin-San Antonio Commuter Rail Study. Texas Department of Transportation. Austin, Texas. March 1999.
32) Regional Commuter Rail Connectivity Study. Kimley-Horn and Associates for Houston-Galveston Area Council. Houston, Texas. September 5, 2008.
91
APPENDIX A: LISTING OF RAIL IMPACTS
97


LRT
– Li
ght R
ail;
CO
M –
Com
mut
er R
ail;
HV
R –
Hea
vy R
ail;
AG
T –
Aut
omat
ed G
uide
way
93
Syst
em
Lin
e St
atio
n M
ode
Mea
sure
M
easu
rem
ent
Tec
hniq
ue
Ben
chm
ark
Val
ue
Impa
ct T
ype
Sour
ce
CA
LR
T C
OM
R
ider
ship
impa
ct
of o
ffic
es n
ear
trans
it
887
self-
repo
rted
surv
eys
on c
omm
ute
trips
20
06
Up
to 2
0% ri
ders
hip
with
clo
ser o
ffic
e bu
ildin
gs, e
mpl
oyer
con
tribu
tions
, and
go
od c
onne
ctio
ns
Dev
elop
men
tal
Cer
vero
(200
6)
CA
: Sa
cram
ento
R
T
LRT
Impa
ct o
f LR
T on
pr
oper
ty v
alue
s St
atis
tical
Infe
renc
e A
naly
sis w
hich
use
s va
rious
dat
a po
ints
to
dete
rmin
e th
e im
pact
s of
a se
ries o
f ind
epen
dent
va
riabl
es (h
ousi
ng
char
acte
ristic
s) o
n a
sing
le d
epen
dent
var
iabl
e (p
rice
per s
q ft)
. O
ver
1,30
0 pr
oper
ty sa
les
reco
rds i
n ar
eas s
urve
y
2005
Th
e pr
esen
ce o
f a n
earb
y lig
ht ra
il st
atio
n or
line
doe
s not
hav
e a
sign
ifica
nt
mea
sura
ble
impa
ct o
n th
e va
lue
of n
earb
y pr
oper
ties.
Econ
omic
Ja
iyeo
ba a
nd
Qui
nn (2
005)
CA
: San
D
iego
G
reen
Li
ne
LR
T C
hang
e in
mod
e of
tri
p O
n-B
oard
surv
ey/
inte
rnet
surv
ey
26
% o
f for
mer
ly in
freq
uent
tran
sit r
ider
s no
w ri
de fr
eque
ntly
(1-4
tim
es a
wee
k);
and
40%
ride
eve
ry d
ay
Tran
spor
tatio
n B
ates
, Jab
onsk
i (2
007)
CA
: San
ta
Cla
ra
All
rail
LR
T C
OM
Im
pact
of T
OD
on
com
mer
cial
val
ues
Hed
onic
pric
e ap
proa
ch
2000
La
nd v
alue
s up
23%
in c
omm
erci
al
busi
ness
dis
trict
, up
120%
nea
r Cal
trans
st
atio
ns
Econ
omic
C
erve
ro a
nd
Dun
can
(200
2a)
CA
: San
ta
Cla
ra
Cen
tral
Expw
y
LRT
Air
qual
ity
emis
sion
s (C
O,
PM10
, and
ozo
ne
prec
urso
rs [R
OG
, N
Ox]
)
O3
and
PM10
em
issi
ons
calc
ulat
ed b
y m
ultip
lyin
g EM
FAC
200
1 m
odel
em
issi
on fa
ctor
s by
VM
T im
pact
s of L
RT
alte
rnat
ive;
CO
by
rece
ptor
s nea
r in
ters
ectio
ns
2005
St
anda
rd th
resh
old:
net
incr
ease
in
pollu
tant
em
issi
ons o
f 80
poun
ds p
er d
ay
or 1
5 to
ns p
er y
ear o
f RO
G, N
OX, o
r PM
10 --
or -
- loc
aliz
ed C
O c
once
ntra
tions
in
exc
ess o
f 9 p
pm a
vera
ged
over
8 h
ours
/ 20
ppm
ave
rage
d ov
er 1
hou
r
Envi
ronm
enta
l Sa
nta
Cla
ra
Val
ley
Tran
spor
tatio
n A
utho
rity
(200
5)
99

LRT
– Li
ght R
ail;
CO
M –
Com
mut
er R
ail;
HV
R –
Hea
vy R
ail;
AG
T –
Aut
omat
ed G
uide
way
94
Syst
em
Lin
e St
atio
n M
ode
Mea
sure
M
easu
rem
ent
Tec
hniq
ue
Ben
chm
ark
Val
ue
Impa
ct T
ype
Sour
ce
CA
: San
ta
Cla
ra
Cen
tral
Expw
y
LRT
Elec
trom
agne
tic
field
exp
osur
e El
ectri
c fie
ld st
reng
th is
m
easu
red
in u
nits
of
volts
per
met
er (V
/m);
field
stre
ngth
incr
ease
s as
vol
tage
rise
s. M
agne
tic fi
eld
stre
ngth
ha
s sev
eral
uni
ts o
f m
easu
re. T
he m
ost
com
mon
ly u
sed
are
mill
igau
ss (m
G) a
nd
mic
roTe
sla
(mT)
; 10
mG
eq
ual 1
mT.
DC
pr
oduc
es st
rong
er E
MFs
th
an a
ltern
atin
g cu
rren
t (A
C).
Con
sequ
ently
, EM
F st
reng
th is
m
easu
red
in te
rms o
f m
G.
2005
LR
T al
tern
ativ
es m
ay re
sult
in su
bsta
ntia
l ad
vers
e ef
fect
s rel
ated
to E
MFs
if th
ey
wou
ld re
sult
in D
C m
agne
tic fi
elds
that
ex
ceed
the
guid
elin
es o
f Am
eric
an
Con
fere
nce
of G
over
nmen
tal I
ndus
trial
H
ygie
nist
s: ro
utin
e oc
cupa
tiona
l exp
osur
es
shou
ld n
ot e
xcee
d 60
0,00
0 m
G fo
r the
w
hole
bod
y; 6
,000
,000
mG
for l
imbs
on
a tim
e-w
eigh
ted
aver
age
basi
s; o
r for
pe
rson
s with
car
diac
pac
emak
ers a
nd
sim
ilar m
edic
al e
lect
roni
c de
vice
s, w
eare
rs
shou
ld n
ot b
e ex
pose
d to
DC
mag
netic
fie
ld le
vels
exc
eedi
ng 5
,000
mG
Envi
ronm
enta
l Sa
nta
Cla
ra
Val
ley
Tran
spor
tatio
n A
utho
rity
(200
5)
CA
: San
ta
Cla
ra
All
rail
LR
T C
OM
Im
pact
of T
OD
on
resi
dent
ial v
alue
s H
edon
ic p
rice
appr
oach
19
99
In te
rms o
f com
mut
er ra
il tra
nsit
stat
ions
, w
ithin
a 1
/4 m
ile ra
dius
, ALL
resi
dent
ial
parc
el v
alue
s inc
reas
ed, h
owev
er la
nd
valu
e pr
emiu
ms (
20%
+) w
ere
sign
ifica
ntly
lo
wer
than
whe
n co
mpa
red
to li
ght r
ail
stat
ions
. For
ligh
t rai
l tra
nsit
stat
ions
, va
lues
ON
LY in
crea
sed
for 5
+ un
it ap
artm
ent b
uild
ings
in th
e sa
me
radi
us.
Land
val
ue p
rem
ium
eff
ects
for l
arge
ap
artm
ent p
rope
rties
wer
e 45
% w
ithin
the
1/4
mile
radi
us o
f a li
ght r
ail t
rans
it st
atio
n. W
ithin
a 4
mile
radi
us, e
ffec
ts fo
r al
l pro
perti
es w
ere
28%
.
Econ
omic
C
erve
ro a
nd
Dun
can
(200
2b)
CA
: San
ta
Cla
ra
All
rail
LR
T Im
pact
of L
RT
on
resi
dent
ial v
alue
s H
edon
ic p
rice
appr
oach
Prop
ertie
s tha
t lie
with
in 1
/2 m
ile o
f a li
ght
rail
stat
ion
com
man
d a
high
er le
ase
rate
th
an o
ther
pro
perti
es in
the
coun
ty. W
hen
cont
rolli
ng fo
r hig
hway
acc
ess,
the
rail
prox
imity
was
mai
ntai
ned,
and
it w
as
show
n th
at h
ighw
ay c
over
age
is so
den
se
that
ther
e ar
e no
par
ticul
ar lo
catio
nal
adva
ntag
es a
ssoc
iate
d w
ith h
ighw
ay
cove
rage
.
Econ
omic
W
einb
erge
r (2
001)
100

LRT
– Li
ght R
ail;
CO
M –
Com
mut
er R
ail;
HV
R –
Hea
vy R
ail;
AG
T –
Aut
omat
ed G
uide
way
95
Syst
em
Lin
e St
atio
n M
ode
Mea
sure
M
easu
rem
ent
Tec
hniq
ue
Ben
chm
ark
Val
ue
Impa
ct T
ype
Sour
ce
CA
: San
D
iego
Tr
olle
y,
Coa
ster
A
ll LR
T C
OM
R
esid
entia
l and
co
mm
erci
al
prop
erty
val
ue
Hed
onic
pric
e ap
proa
ch
1999
/ 20
00
For m
ulti-
fam
ily h
ousi
ng, w
ithin
a 1
/2-
mile
radi
us o
f an
East
Lin
e Tr
olle
y tra
nsit
stat
ion
(LR
T), a
n ap
artm
ent p
roje
ct w
as
wor
th o
n av
erag
e $1
00,0
00 m
ore
than
th
ose
in th
e co
ntro
l are
a. O
ther
Tro
lley
line
trans
it st
atio
ns h
ad p
ositi
ve e
ffec
ts b
ut
none
that
wer
e st
atist
ical
ly si
gnifi
cant
. C
omm
uter
rail
trans
it st
atio
ns sa
w a
ne
gativ
e ef
fect
in v
alua
tion.
Com
mut
er ra
il tra
nsit
stat
ions
had
a p
ositi
ve e
ffec
t on
cond
omin
ium
s with
the
aver
age
valu
e-ad
d be
ing
$85,
000.
LR
T tra
nsit
stat
ions
wer
e le
ss o
f an
influ
ence
with
uni
ts n
ear T
rolle
y tra
nsit
stat
ions
onl
y ga
inin
g be
twee
n le
ss
than
4%
- 6.
4% p
rem
ium
. Sin
gle-
fam
ily
hous
ing
valu
es su
ffer
ed n
ear T
rolle
y lin
e tra
nsit
stat
ions
, whi
le th
ey in
crea
sed
near
co
mm
uter
rail
stat
ions
on
aver
age
over
$7
8,00
0. E
ffec
ts o
n co
mm
erci
al p
rope
rties
w
ere
varie
d sp
atia
lly w
ith o
nes n
ear
dow
ntow
n co
mm
uter
rail
trans
it st
atio
ns
rece
ivin
g th
e hi
ghes
t pre
miu
ms.
LRT
trans
it st
atio
ns o
n th
e M
issi
on V
alle
y Li
ne
also
real
ized
larg
e pr
emiu
ms.
Oth
er tr
ansi
t st
atio
ns e
ither
had
onl
y sl
ight
pos
itive
be
nefit
s or s
igni
fican
t dis
bene
fits a
s was
th
e ca
se fo
r non
-dow
ntow
n co
mm
uter
rail
stat
ions
.
Econ
omic
C
erve
ro, 2
003
CA
: Bay
A
rea
BA
RT
All
CO
M
Land
use
cha
nges
ov
er tw
enty
yea
r pe
riod.
Reg
ress
ion,
mat
ched
pai
r co
mpa
rison
19
73
Bet
wee
n 19
73 a
nd 1
993,
BA
RT
has
play
ed a
fairl
y m
odes
t, th
ough
not
in
cons
eque
ntia
l, ro
le in
shap
ing
met
ropo
litan
gro
wth
in th
e Sa
n Fr
anci
sco
Bay
Are
a. It
s im
pact
s hav
e be
en h
ighl
y lo
caliz
ed a
nd u
neve
n.
Econ
omic
D
evel
opm
enta
l C
erve
ro a
nd
Land
is (1
997)
CA
: Bay
A
rea
BA
RT
Plea
sant
H
ill
CO
M
Res
iden
tial
prop
erty
val
ue
With
in 1
mile
are
a, a
vera
ge h
ome
pric
es
decl
ine
by a
bout
$1,
578
for e
very
100
ft
furth
er fr
om st
atio
n.
Econ
omic
Le
wis
-W
orkm
an a
nd
Bro
d (1
997)
101
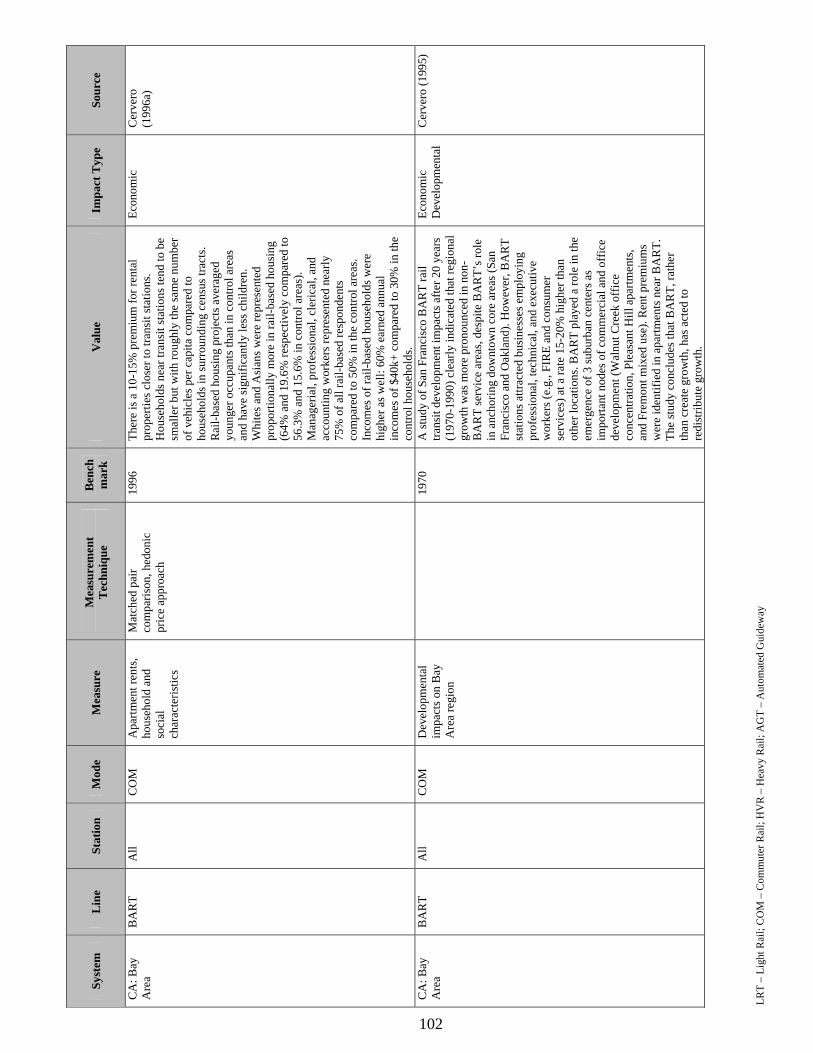
LRT
– Li
ght R
ail;
CO
M –
Com
mut
er R
ail;
HV
R –
Hea
vy R
ail;
AG
T –
Aut
omat
ed G
uide
way
96
Syst
em
Lin
e St
atio
n M
ode
Mea
sure
M
easu
rem
ent
Tec
hniq
ue
Ben
chm
ark
Val
ue
Impa
ct T
ype
Sour
ce
CA
: Bay
A
rea
BA
RT
All
CO
M
Apa
rtmen
t ren
ts,
hous
ehol
d an
d so
cial
ch
arac
teris
tics
Mat
ched
pai
r co
mpa
rison
, hed
onic
pr
ice
appr
oach
1996
Th
ere
is a
10-
15%
pre
miu
m fo
r ren
tal
prop
ertie
s clo
ser t
o tra
nsit
stat
ions
. H
ouse
hold
s nea
r tra
nsit
stat
ions
tend
to b
e sm
alle
r but
with
roug
hly
the
sam
e nu
mbe
r of
veh
icle
s per
cap
ita c
ompa
red
to
hous
ehol
ds in
surr
ound
ing
cens
us tr
acts
. R
ail-b
ased
hou
sing
pro
ject
s ave
rage
d yo
unge
r occ
upan
ts th
an in
con
trol a
reas
an
d ha
ve si
gnifi
cant
ly le
ss c
hild
ren.
W
hite
s and
Asi
ans w
ere
repr
esen
ted
prop
ortio
nally
mor
e in
rail-
base
d ho
usin
g (6
4% a
nd 1
9.6%
resp
ectiv
ely
com
pare
d to
56
.3%
and
15.
6% in
con
trol a
reas
). M
anag
eria
l, pr
ofes
sion
al, c
leric
al, a
nd
acco
untin
g w
orke
rs re
pres
ente
d ne
arly
75
% o
f all
rail-
base
d re
spon
dent
s co
mpa
red
to 5
0% in
the
cont
rol a
reas
. In
com
es o
f rai
l-bas
ed h
ouse
hold
s wer
e hi
gher
as w
ell:
60%
ear
ned
annu
al
inco
mes
of $
40k+
com
pare
d to
30%
in th
e co
ntro
l hou
seho
lds.
Econ
omic
C
erve
ro
(199
6a)
CA
: Bay
A
rea
BA
RT
All
CO
M
Dev
elop
men
tal
impa
cts o
n B
ay
Are
a re
gion
19
70
A st
udy
of S
an F
ranc
isco
BA
RT
rail
trans
it de
velo
pmen
t im
pact
s afte
r 20
year
s (1
970-
1990
) cle
arly
indi
cate
d th
at re
gion
al
grow
th w
as m
ore
pron
ounc
ed in
non
-B
AR
T se
rvic
e ar
eas,
desp
ite B
AR
T’s r
ole
in a
ncho
ring
dow
ntow
n co
re a
reas
(San
Fr
anci
sco
and
Oak
land
). H
owev
er, B
AR
T st
atio
ns a
ttrac
ted
busi
ness
es e
mpl
oyin
g pr
ofes
sion
al, t
echn
ical
, and
exe
cutiv
e w
orke
rs (e
.g.,
FIR
E an
d co
nsum
er
serv
ices
) at a
rate
15-
20%
hig
her t
han
othe
r loc
atio
ns. B
AR
T pl
ayed
a ro
le in
the
emer
genc
e of
3 su
burb
an c
ente
rs a
s im
porta
nt n
odes
of c
omm
erci
al a
nd o
ffic
e de
velo
pmen
t (W
alnu
t Cre
ek o
ffic
e co
ncen
tratio
n, P
leas
ant H
ill a
partm
ents
, an
d Fr
emon
t mix
ed u
se).
Ren
t pre
miu
ms
wer
e id
entif
ied
in a
partm
ents
nea
r BA
RT.
Th
e st
udy
conc
lude
s tha
t BA
RT,
rath
er
than
cre
ate
grow
th, h
as a
cted
to
redi
strib
ute
grow
th.
Econ
omic
D
evel
opm
enta
l C
erve
ro (1
995)
102
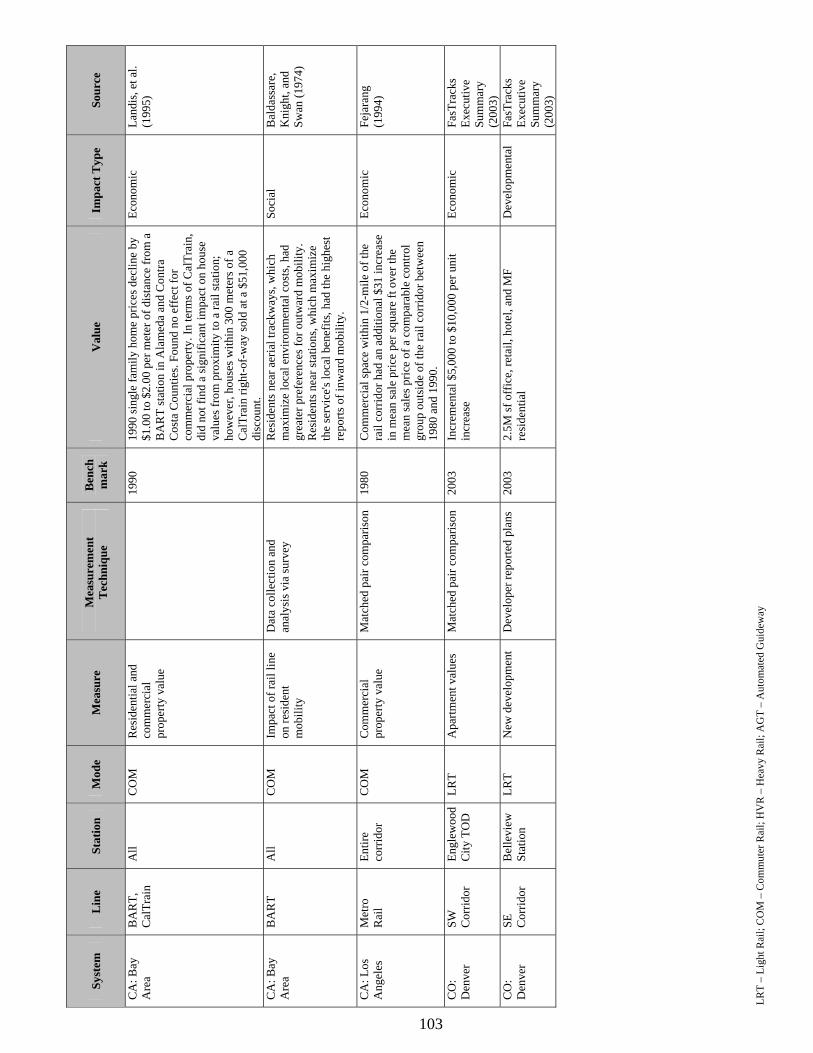
LRT
– Li
ght R
ail;
CO
M –
Com
mut
er R
ail;
HV
R –
Hea
vy R
ail;
AG
T –
Aut
omat
ed G
uide
way
97
Syst
em
Lin
e St
atio
n M
ode
Mea
sure
M
easu
rem
ent
Tec
hniq
ue
Ben
chm
ark
Val
ue
Impa
ct T
ype
Sour
ce
CA
: Bay
A
rea
BA
RT,
C
alTr
ain
All
CO
M
Res
iden
tial a
nd
com
mer
cial
pr
oper
ty v
alue
19
90
1990
sing
le fa
mily
hom
e pr
ices
dec
line
by
$1.0
0 to
$2.
00 p
er m
eter
of d
ista
nce
from
a
BA
RT
stat
ion
in A
lam
eda
and
Con
tra
Cos
ta C
ount
ies.
Foun
d no
eff
ect f
or
com
mer
cial
pro
perty
. In
term
s of C
alTr
ain,
di
d no
t fin
d a
sign
ifica
nt im
pact
on
hous
e va
lues
from
pro
xim
ity to
a ra
il st
atio
n;
how
ever
, hou
ses w
ithin
300
met
ers o
f a
Cal
Trai
n rig
ht-o
f-w
ay so
ld a
t a $
51,0
00
disc
ount
.
Econ
omic
La
ndis
, et a
l. (1
995)
CA
: Bay
A
rea
BA
RT
All
CO
M
Impa
ct o
f rai
l lin
e on
resi
dent
m
obili
ty
Dat
a co
llect
ion
and
anal
ysis
via
surv
ey
R
esid
ents
nea
r aer
ial t
rack
way
s, w
hich
m
axim
ize
loca
l env
ironm
enta
l cos
ts, h
ad
grea
ter p
refe
renc
es fo
r out
war
d m
obili
ty.
Res
iden
ts n
ear s
tatio
ns, w
hich
max
imiz
e th
e se
rvic
e's lo
cal b
enef
its, h
ad th
e hi
ghes
t re
ports
of i
nwar
d m
obili
ty.
Soci
al
Bal
dass
are,
K
nigh
t, an
d Sw
an (1
974)
CA
: Los
A
ngel
es
Met
ro
Rai
l En
tire
corr
idor
C
OM
C
omm
erci
al
prop
erty
val
ue
Mat
ched
pai
r com
paris
on
1980
C
omm
erci
al sp
ace
with
in 1
/2-m
ile o
f the
ra
il co
rrid
or h
ad a
n ad
ditio
nal $
31 in
crea
se
in m
ean
sale
pric
e pe
r squ
are
ft ov
er th
e m
ean
sale
s pric
e of
a c
ompa
rabl
e co
ntro
l gr
oup
outs
ide
of th
e ra
il co
rrid
or b
etw
een
1980
and
199
0.
Econ
omic
Fe
jara
ng
(199
4)
CO
: D
enve
r SW
C
orrid
or
Engl
ewoo
d C
ity T
OD
LR
T A
partm
ent v
alue
s M
atch
ed p
air c
ompa
rison
20
03
Incr
emen
tal $
5,00
0 to
$10
,000
per
uni
t in
crea
se
Econ
omic
Fa
sTra
cks
Exec
utiv
e Su
mm
ary
(200
3)
CO
: D
enve
r SE
C
orrid
or
Bel
levi
ew
Stat
ion
LRT
New
dev
elop
men
t D
evel
oper
repo
rted
plan
s 20
03
2.5M
sf o
ffic
e, re
tail,
hot
el, a
nd M
F re
side
ntia
l D
evel
opm
enta
l Fa
sTra
cks
Exec
utiv
e Su
mm
ary
(200
3)
103
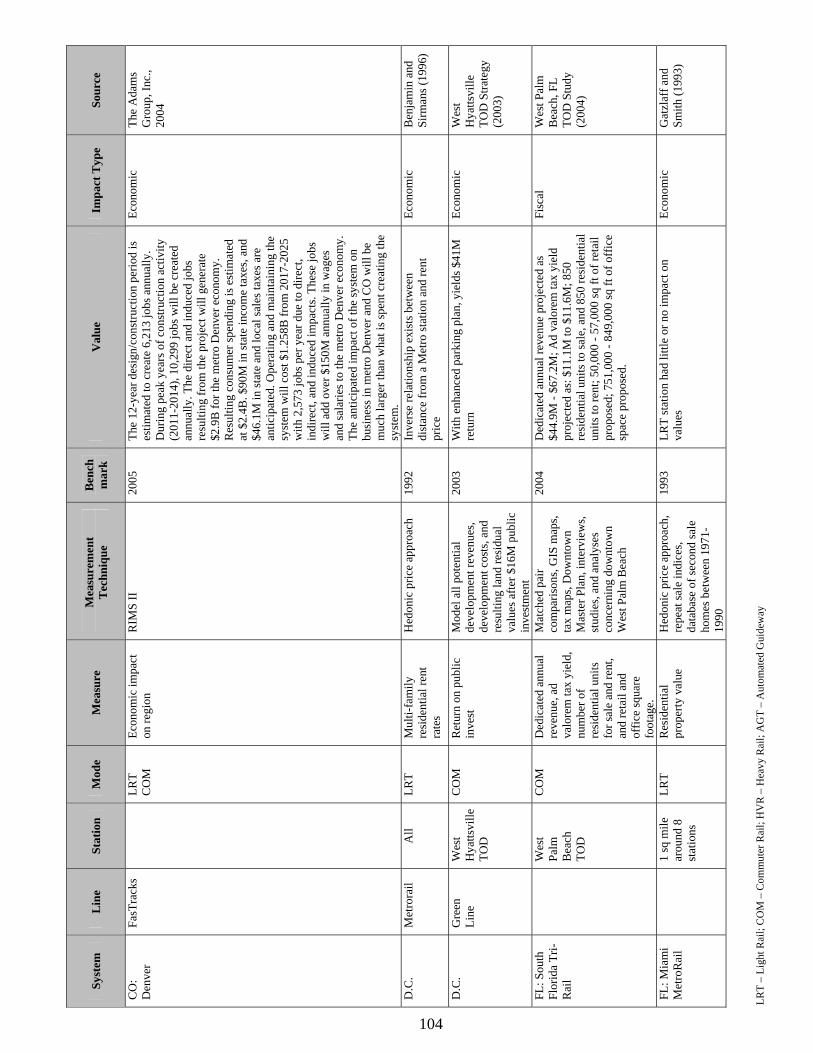
LRT
– Li
ght R
ail;
CO
M –
Com
mut
er R
ail;
HV
R –
Hea
vy R
ail;
AG
T –
Aut
omat
ed G
uide
way
98
Syst
em
Lin
e St
atio
n M
ode
Mea
sure
M
easu
rem
ent
Tec
hniq
ue
Ben
chm
ark
Val
ue
Impa
ct T
ype
Sour
ce
CO
: D
enve
r Fa
sTra
cks
LR
T C
OM
Ec
onom
ic im
pact
on
regi
on
RIM
S II
20
05
The
12-y
ear d
esig
n/co
nstru
ctio
n pe
riod
is
estim
ated
to c
reat
e 6,
213
jobs
ann
ually
. D
urin
g pe
ak y
ears
of c
onst
ruct
ion
activ
ity
(201
1-20
14),
10,2
99 jo
bs w
ill b
e cr
eate
d an
nual
ly. T
he d
irect
and
indu
ced
jobs
re
sulti
ng fr
om th
e pr
ojec
t will
gen
erat
e $2
.9B
for t
he m
etro
Den
ver e
cono
my.
R
esul
ting
cons
umer
spen
ding
is e
stim
ated
at
$2.
4B. $
90M
in st
ate
inco
me
taxe
s, an
d $4
6.1M
in st
ate
and
loca
l sal
es ta
xes a
re
antic
ipat
ed. O
pera
ting
and
mai
ntai
ning
the
syst
em w
ill c
ost $
1.25
8B fr
om 2
017-
2025
w
ith 2
,573
jobs
per
yea
r due
to d
irect
, in
dire
ct, a
nd in
duce
d im
pact
s. Th
ese
jobs
w
ill a
dd o
ver $
150M
ann
ually
in w
ages
an
d sa
larie
s to
the
met
ro D
enve
r eco
nom
y.
The
antic
ipat
ed im
pact
of t
he sy
stem
on
busi
ness
in m
etro
Den
ver a
nd C
O w
ill b
e m
uch
larg
er th
an w
hat i
s spe
nt c
reat
ing
the
syst
em.
Econ
omic
Th
e A
dam
s G
roup
, Inc
., 20
04
D.C
. M
etro
rail
All
LRT
Mul
ti-fa
mily
re
side
ntia
l ren
t ra
tes
Hed
onic
pric
e ap
proa
ch
1992
In
vers
e re
latio
nshi
p ex
ists
bet
wee
n di
stan
ce fr
om a
Met
ro st
atio
n an
d re
nt
pric
e
Econ
omic
B
enja
min
and
Si
rman
s (19
96)
D.C
. G
reen
Li
ne
Wes
t H
yatts
ville
TO
D
CO
M
Ret
urn
on p
ublic
in
vest
M
odel
all
pote
ntia
l de
velo
pmen
t rev
enue
s, de
velo
pmen
t cos
ts, a
nd
resu
lting
land
resi
dual
va
lues
afte
r $16
M p
ublic
in
vest
men
t
2003
W
ith e
nhan
ced
park
ing
plan
, yie
lds $
41M
re
turn
Ec
onom
ic
Wes
t H
yatts
ville
TO
D S
trate
gy
(200
3)
FL: S
outh
Fl
orid
a Tr
i-R
ail
W
est
Palm
B
each
TO
D
CO
M
Ded
icat
ed a
nnua
l re
venu
e, a
d va
lore
m ta
x yi
eld,
nu
mbe
r of
resi
dent
ial u
nits
fo
r sal
e an
d re
nt,
and
reta
il an
d of
fice
squa
re
foot
age.
Mat
ched
pai
r co
mpa
rison
s, G
IS m
aps,
tax
map
s, D
ownt
own
Mas
ter P
lan,
inte
rvie
ws,
stud
ies,
and
anal
yses
co
ncer
ning
dow
ntow
n W
est P
alm
Bea
ch
2004
D
edic
ated
ann
ual r
even
ue p
roje
cted
as
$44.
9M -
$67.
2M; A
d va
lore
m ta
x yi
eld
proj
ecte
d as
: $11
.1M
to $
11.6
M; 8
50
resi
dent
ial u
nits
to sa
le, a
nd 8
50 re
side
ntia
l un
its to
rent
; 50,
000
- 57,
000
sq ft
of r
etai
l pr
opos
ed; 7
51,0
00 -
849,
000
sq ft
of o
ffic
e sp
ace
prop
osed
.
Fisc
al
Wes
t Pal
m
Bea
ch, F
L TO
D S
tudy
(2
004)
FL: M
iam
i M
etro
Rai
l
1 sq
mile
ar
ound
8
stat
ions
LRT
Res
iden
tial
prop
erty
val
ue
Hed
onic
pric
e ap
proa
ch,
repe
at sa
le in
dice
s, da
taba
se o
f sec
ond
sale
ho
mes
bet
wee
n 19
71-
1990
1993
LR
T st
atio
n ha
d lit
tle o
r no
impa
ct o
n va
lues
Ec
onom
ic
Gat
zlaf
f and
Sm
ith (1
993)
104

LRT
– Li
ght R
ail;
CO
M –
Com
mut
er R
ail;
HV
R –
Hea
vy R
ail;
AG
T –
Aut
omat
ed G
uide
way
99
Syst
em
Lin
e St
atio
n M
ode
Mea
sure
M
easu
rem
ent
Tec
hniq
ue
Ben
chm
ark
Val
ue
Impa
ct T
ype
Sour
ce
GA
: A
tlant
a M
AR
TA
3 el
evat
ed
stat
ions
C
OM
R
esid
entia
l pr
oper
ty v
alue
H
edon
ic p
rice
appr
oach
??
? O
nly
wea
k su
ppor
t for
hyp
othe
sis t
hat
prox
imity
to st
atio
ns in
que
stio
n in
crea
ses
prop
erty
val
ues
Econ
omic
N
elso
n an
d M
cCle
skey
(1
992)
G
A:
Atla
nta
MA
RTA
8
stat
ion
sam
ple
CO
M
Res
iden
tial
prop
erty
val
ue,
crim
e, a
nd re
tail
empl
oym
ent
Hed
onic
pric
e ap
proa
ch,
vario
us st
atis
tical
mod
els
2001
In
term
s of h
ousi
ng, h
omes
clo
sest
to th
e st
atio
n se
ll fo
r 19%
less
then
one
s 3 m
iles
and
beyo
nd. H
omes
bet
wee
n 1
and
3 m
iles
from
the
stat
ion
have
a v
alue
sign
ifica
ntly
hi
gher
than
thos
e fu
rther
aw
ay. T
his
sign
ifica
nce
is o
f mor
e im
porta
nce
in h
igh
inco
me
than
low
inco
me
neig
hbor
hood
s. N
egat
ive
crim
e ef
fect
s are
cen
traliz
ed in
do
wnt
own
stat
ions
with
par
king
lots
. Rai
l st
atio
ns h
ave
a po
sitiv
e im
pact
on
reta
il ac
tivity
farth
er fr
om th
e C
BD
.
Econ
omic
D
evel
opm
enta
l So
cial
Bow
es a
nd
Ihla
nfel
dt
(200
1)
GA
: A
tlant
a M
AR
TA
C
OM
C
omm
erci
al
prop
erty
val
ue
Pric
e pe
r squ
are
met
er fa
lls b
y $7
5 fo
r ea
ch m
eter
aw
ay fr
om tr
ansi
t sta
tions
. Pr
ice
rises
by
$443
for l
ocat
ion
with
in
spec
ial p
ublic
inte
rest
dis
trict
s.
Econ
omic
N
elso
n (1
998)
IL: C
hica
go
CTA
/ME
TRA
HV
R
CO
M
Sing
le fa
mily
dw
ellin
g un
it. c
ost
Hed
onic
mod
elin
g an
d in
terv
iew
s
Sing
le fa
mily
hom
e va
lues
incr
ease
1%
for
ever
y 10
0 ft
clos
er to
stat
ion
Econ
omic
G
ruen
, Jea
ns
(200
8)
IL: C
hica
go
CTA
/ME
TRA
HV
R
CO
M
Apa
rtmen
t ren
ts
Hed
onic
mod
elin
g an
d in
terv
iew
s
Ren
ts a
nd h
ighe
r and
occ
upan
cy le
vels
hi
gher
at a
partm
ents
nea
r sta
tions
Ec
onom
ic
Gru
en, J
eans
(2
008)
MA
: B
osto
n to
A
rbor
way
LRT
Tran
sit t
rave
l tim
e B
efor
e/af
ter t
rans
it tra
vel
time
betw
een
fixed
po
ints
A
fter t
rave
l tim
e is
sam
e or
less
Tr
ansp
orta
tion
Lew
is (2
006)
MA
: B
osto
n to
A
rbor
way
LRT
Ave
rage
aut
o de
lay
Mod
eled
del
ay fo
r st
oppe
d bu
ses u
sing
in
cide
nt/la
ne b
lock
age
mod
el
N
o si
gnifi
cant
cha
nge
in a
vera
ge d
elay
Tr
ansp
orta
tion
Lew
is (2
006)
MN
: M
inne
apol
is
Hia
wat
ha
Line
4
- not
sp
ecifi
ed
LRT
Qua
lity
of li
fe
Ran
dom
surv
ey o
f loc
al
resi
dent
s
"Low
" qu
ality
of l
ife re
spon
se d
oubl
ed
from
6%
to 1
2%
Soci
al
Cen
ter f
or
Tran
spor
tatio
n St
udie
s (20
06)
MO
: St.
Loui
s M
etro
Link
A
ll st
atio
ns
LRT
Res
iden
tial
prop
erty
val
ue
Hed
onic
pric
e ap
proa
ch
1998
Fo
r hom
es so
ld b
etw
een
1998
-200
1 th
at
are
with
in 1
mile
of a
Met
roLi
nk st
atio
n,
valu
es ri
se fo
r eve
ry 1
0 ft
clos
er to
a
stat
ion
up u
ntil
1,46
0 ft
away
from
a
stat
ion.
Fro
m 1
,480
ft to
2,3
00 ft
from
the
stat
ion,
hom
e va
lues
als
o ro
se a
s the
di
stan
ce a
way
from
the
stat
ion
incr
ease
d,
how
ever
, not
at a
rate
as g
reat
as t
he
incr
ease
in v
alue
s fro
m 1
,460
ft to
0 ft
.
Econ
omic
Li
ght-R
ail
Tran
sit i
n A
mer
ica
/ Fe
dera
l R
eser
ve B
ank
of S
t. Lo
uis /
G
arre
tt (2
004)
105

LRT
– Li
ght R
ail;
CO
M –
Com
mut
er R
ail;
HV
R –
Hea
vy R
ail;
AG
T –
Aut
omat
ed G
uide
way
100
Syst
em
Lin
e St
atio
n M
ode
Mea
sure
M
easu
rem
ent
Tec
hniq
ue
Ben
chm
ark
Val
ue
Impa
ct T
ype
Sour
ce
MO
: St.
Loui
s M
etro
Link
A
ll LR
T M
axim
um
dist
ance
from
LR
T st
atio
n to
ex
perie
nce
prop
erty
val
ue
esca
latio
n
Con
trolle
d pr
oper
ty
valu
es b
y un
iver
se o
f va
riabl
es; i
sola
te e
ffec
ts
of d
ista
nce
from
LR
T st
atio
n an
d LR
T lin
e
2001
2,
800
ft fr
om L
RT
stat
ion
Econ
omic
G
arre
tt (2
004)
MO
: St.
Loui
s M
etro
Link
A
ll LR
T Pr
ice
prem
ium
for
loca
tion
with
in
max
imum
dis
tanc
e fr
om L
RT
stat
ion
Con
trolle
d pr
oper
ty
valu
es b
y un
iver
se o
f va
riabl
es; i
sola
te e
ffec
ts
of d
ista
nce
from
LR
T st
atio
n an
d LR
T lin
e
2001
$1
2.14
for e
very
10
ft fr
om L
RT
stat
ion,
fr
om 2
,300
to 2
,800
ft
Econ
omic
G
arre
tt (2
004)
MO
: St.
Loui
s M
etro
Link
A
ll LR
T Pr
ice
prem
ium
for
loca
tion
with
in
max
imum
dis
tanc
e fr
om L
RT
stat
ion
Con
trolle
d pr
oper
ty
valu
es b
y un
iver
se o
f va
riabl
es; i
sola
te e
ffec
ts
of d
ista
nce
from
LR
T st
atio
n an
d LR
T lin
e
2001
$1
39.9
2 fo
r eve
ry 1
0 ft
clos
er to
LR
T st
atio
n be
ginn
ing
at 1
,460
ft
Econ
omic
G
arre
tt (2
004)
MO
: St.
Loui
s M
etro
Link
A
ll LR
T Pr
ice
prem
ium
for
loca
tion
with
in
max
imum
dis
tanc
e fr
om L
RT
stat
ion
Con
trolle
d pr
oper
ty
valu
es b
y un
iver
se o
f va
riabl
es; i
sola
te e
ffec
ts
of d
ista
nce
from
LR
T st
atio
n an
d LR
T lin
e
2001
$6
9.50
for e
very
10
ft fr
om L
RT
stat
ion
from
1,4
90 to
2,3
00 ft
Ec
onom
ic
Gar
rett
(200
4)
MO
: St.
Loui
s M
etro
Link
: M
etro
So
uth
Exte
nsio
n
LR
T En
viro
nmen
tal/
econ
omic
impa
ct
on re
gion
Qua
litat
ive
data
ga
ther
ing
at p
ublic
m
eetin
gs, a
naly
sis o
f pr
evio
usly
pub
lishe
d lit
erat
ure,
mar
ket
asse
ssm
ents
2000
St
udy
foun
d th
at th
e pu
blic
felt
neig
hbor
hood
dis
plac
emen
t, ec
onom
ic
deve
lopm
ent o
ppor
tuni
ties,
and
serv
ice
to
exis
ting
and
futu
re e
mpl
oym
ent c
ente
rs
need
ed to
be
cons
ider
ed d
urin
g pl
anni
ng
proc
ess.
The
stud
y al
so a
sses
sed
that
ap
prox
imat
ely
2,70
0 ho
useh
olds
, 440
co
mm
erci
al jo
bs, a
nd 4
,100
off
ice
jobs
co
uld
be d
raw
n to
tran
sit s
tatio
ns if
the
Met
ro S
outh
LR
T lin
e w
as c
ompl
eted
. W
hen
look
ing
at re
side
ntia
l pro
perty
va
lues
, a 5
% p
roje
cted
incr
ease
is a
ssig
ned
to a
reas
with
in a
1/2
mile
wal
king
dis
tanc
e of
a M
etro
Link
stat
ion,
for t
hose
pro
perti
es
that
are
nea
r to
the
line
or w
ithin
1/4
mile
of
a n
ew p
ark-
and-
ride
lot t
here
will
be
no
incr
ease
in v
alue
. Com
mer
cial
pro
perty
va
lues
hav
e a
proj
ecte
d in
crea
se o
f 8%
w
ithin
1/2
mile
of s
tatio
ns.
Econ
omic
So
cial
U
.S.
Dep
artm
ent o
f Tr
ansp
orta
tion,
Fe
dera
l Tra
nsit
Ass
ocia
tion,
an
d Ea
st-W
est
Gat
eway
C
ounc
il of
G
over
nmen
ts,
2005
New
Jers
ey
Hud
sen-
Bur
gen
Line
LR
T C
hang
e in
land
use
A
rea
surv
ey
Es
timat
ed $
6B in
new
resi
dent
ial
deve
lopm
ent
Soci
al
Rob
ins,
Wel
ls
(200
7)
106

LRT
– Li
ght R
ail;
CO
M –
Com
mut
er R
ail;
HV
R –
Hea
vy R
ail;
AG
T –
Aut
omat
ed G
uide
way
101
Syst
em
Lin
e St
atio
n M
ode
Mea
sure
M
easu
rem
ent
Tec
hniq
ue
Ben
chm
ark
Val
ue
Impa
ct T
ype
Sour
ce
New
Jers
ey
Hud
sen-
Bur
gen
Line
LR
T In
crea
se in
rid
ersh
ip
Rid
ersh
ip e
valu
atio
n
From
June
200
6 to
June
200
7, ri
ders
hip
up
30.5
%
Tran
spor
tatio
n R
obin
s, W
ells
(2
007)
New
Jers
ey
Hud
sen-
Bur
gen
Line
LR
T R
educ
tion
in
com
mut
ing
time
Trav
el ti
me
to M
anha
ttan
decr
ease
d w
ith
LRT
proj
ect
Tran
spor
tatio
n R
obin
s, W
ells
(2
007)
New
Jers
ey
Hud
sen-
Bur
gen
Line
LR
T Ex
pand
ed a
cces
s to
shop
ping
/ re
crea
tion
So
cial
R
obin
s, W
ells
(2
007)
New
Jers
ey
Hud
sen-
Bur
gen
Line
LR
T Pe
ak tr
ips
Rt 1
39 S
urve
y V
ehic
le
trips
Perc
ent o
f aut
o tri
ps d
ecre
ased
68%
from
20
00 to
200
4 Tr
ansp
orta
tion
Rob
ins,
Wel
ls
(200
7)
NY
: B
uffa
lo
NFT
A
All
dow
ntow
n lo
catio
ns
LRT
Res
iden
tial
prop
erty
val
ue
Hed
onic
pric
e ap
proa
ch
2002
Ty
pica
l hom
e lo
cate
d w
ithin
1/4
mile
of a
ra
il st
atio
n ca
n ea
rn 2
-5%
of t
he c
ity's
med
ian
hom
e va
lue.
How
ever
, afte
r co
nsid
erin
g al
l con
trol f
acto
rs, l
ocat
ion
to
rail
stat
ion
is a
t bes
t wea
k in
Buf
falo
.
Econ
omic
H
ess a
nd
Alm
eida
(2
007)
OR
: Po
rtlan
d W
ests
ide
MA
X
LR
T Ta
x V
alue
s R
egre
ssio
n
31%
hig
her v
alue
with
in 1
/2 m
ile o
f an
noun
ced
stat
ion
and
10%
hig
her w
ithin
m
ile
Econ
omic
K
naap
, Din
g,
Hop
kins
(2
001)
OR
: Po
rtlan
d Ea
stsi
de
MA
X
East
B
urns
ide
LRT
Res
iden
tial
prop
erty
val
ue
Hed
onic
pric
e ap
proa
ch
1993
10
.6%
gre
ater
with
in 5
00 m
eter
s of t
he
trans
it Ec
onom
ic
Al-M
osai
nd
(199
3)
OR
: Po
rtlan
d
Ore
nco,
Ll
oyd,
B
eave
rton,
G
resh
am
LRT
TOD
impa
ct o
n rid
ersh
ip
Cen
sus (
1990
&20
00),
trans
it ag
ency
dat
a, a
nd
urba
n fo
rm a
naly
sis,
long
itudi
nal
2005
R
ider
ship
tran
sit u
p 2.
5%; a
uto
dow
n 2.
5%
Dev
elop
men
tal
Schl
ossb
erg
(200
5)
OR
: Po
rtlan
d Ea
stsi
de
MA
X
Stud
y ar
ea:
para
llels
to
I-84
an
d B
urns
ide
Stre
et
LRT
Perc
ent c
hang
e in
R
esid
entia
l D
ensi
ty -
urba
n ar
eas
Ex-p
ost-f
acto
mul
tiple
-gr
oup
pret
est-p
ostte
st
desi
gn; 1
0 ye
ar
com
paris
on o
f rai
l | b
us
cont
rol g
roup
1999
3.
0% n
et D
ECR
EASE
(in
dens
ity) -
- in
othe
r wor
ds, N
EW d
evel
opm
ent i
nvol
ved
larg
er u
nits
and
/or l
esse
r uni
ts p
er sq
uare
ac
re
Econ
omic
D
ueke
r and
B
ianc
o (1
999)
OR
: Po
rtlan
d Ea
stsi
de
MA
X
Stud
y ar
ea:
para
llels
to
I-84
an
d B
urns
ide
Stre
et
LRT
Perc
ent c
hang
e in
R
esid
entia
l D
ensi
ty -
subu
rban
ar
eas
Ex-p
ost-f
acto
mul
tiple
-gr
oup
pret
est-p
ostte
st
desi
gn; 1
0 ye
ar
com
paris
on o
f rai
l | b
us
cont
rol g
roup
1999
5.
0% n
et IN
CR
EASE
(in
dens
ity)
Econ
omic
D
ueke
r and
B
ianc
o (1
999)
107

LRT
– Li
ght R
ail;
CO
M –
Com
mut
er R
ail;
HV
R –
Hea
vy R
ail;
AG
T –
Aut
omat
ed G
uide
way
102
Syst
em
Lin
e St
atio
n M
ode
Mea
sure
M
easu
rem
ent
Tec
hniq
ue
Ben
chm
ark
Val
ue
Impa
ct T
ype
Sour
ce
OR
: Po
rtlan
d Ea
stsi
de
MA
X
Stud
y ar
ea:
para
llels
to
I-84
an
d B
urns
ide
Stre
et
LRT
Perc
ent c
hang
e in
re
side
ntia
l hou
sing
va
lue
for d
ista
nce
from
LR
T st
atio
n
Ex-p
ost-f
acto
mul
tiple
-gr
oup
pret
est-p
ostte
st
desi
gn; 1
0 ye
ar
com
paris
on o
f rai
l | b
us
cont
rol g
roup
1999
1.
9% m
ean
DEC
REA
SE (i
n va
lue)
for
ever
y 20
0 ft
from
an
LRT
stat
ion
Econ
omic
D
ueke
r and
B
ianc
o (1
999)
OR
: Po
rtlan
d Ea
stsi
de
MA
X
Stud
y ar
ea:
para
llels
to
I-84
an
d B
urns
ide
Stre
et
LRT
Perc
ent c
hang
e in
R
ail T
rans
it m
ode
shar
e vs
. Bus
Tr
ansi
t - u
rban
ar
eas
Ex-p
ost-f
acto
mul
tiple
-gr
oup
pret
est-p
ostte
st
desi
gn; 1
0 ye
ar
com
paris
on o
f rai
l | b
us
cont
rol g
roup
1999
0.
76%
mod
e sh
ift ra
il fo
r eve
ry 1
.0%
m
ode
shift
bus
Tr
ansp
orta
tion
Due
ker a
nd
Bia
nco
(199
9)
OR
: Po
rtlan
d Ea
stsi
de
MA
X
Stud
y ar
ea:
para
llels
to
I-84
an
d B
urns
ide
Stre
et
LRT
Perc
ent c
hang
e in
R
ail T
rans
it m
ode
shar
e vs
. Bus
Tr
ansi
t - su
burb
an
area
s
Ex-p
ost-f
acto
mul
tiple
-gr
oup
pret
est-p
ostte
st
desi
gn; 1
0 ye
ar
com
paris
on o
f rai
l | b
us
cont
rol g
roup
1999
1.
26%
mod
e sh
ift ra
il fo
r eve
ry 1
.0%
m
ode
shift
bus
Tr
ansp
orta
tion
Due
ker a
nd
Bia
nco
(199
9)
OR
: Po
rtlan
d Ea
stsi
de
MA
X
Stud
y ar
ea:
para
llels
to
I-84
an
d B
urns
ide
Stre
et
LRT
Perc
ent c
hang
e in
rid
ersh
ip o
n LR
T Ex
-pos
t-fac
to m
ultip
le-
grou
p pr
etes
t-pos
ttest
de
sign
; 10
year
co
mpa
rison
of r
ail |
bus
co
ntro
l gro
up
1999
4.
5% a
nnua
l inc
reas
e in
ride
rshi
p Tr
ansp
orta
tion
Due
ker a
nd
Bia
nco
(199
9)
OR
: Po
rtlan
d Ea
stsi
de
MA
X
Stud
y ar
ea:
para
llels
to
I-84
an
d B
urns
ide
Stre
et
LRT
Perc
ent c
hang
e in
fr
eew
ay A
AD
T w
ith p
rese
nce
of
LRT
Ex-p
ost-f
acto
mul
tiple
-gr
oup
pret
est-p
ostte
st
desi
gn; 1
0 ye
ar
com
paris
on o
f rai
l | b
us
cont
rol g
roup
1999
0.
2% fr
eew
ay A
AD
T le
ss w
ith L
RT
Tran
spor
tatio
n D
ueke
r and
B
ianc
o (1
999)
OR
: Po
rtlan
d Ea
stsi
de
MA
X
LR
T R
esid
entia
l pr
oper
ty v
alue
M
atch
ed p
air c
ompa
rison
LRT
has m
odes
t pos
itive
influ
ence
on
sing
le-f
amily
pro
perty
val
ues.
As d
ista
nce
from
the
rail
line
decr
ease
s, pr
oper
ty
valu
es in
crea
se. W
ithin
200
ft o
f a tr
ansi
t st
atio
n, h
owev
er, v
alue
s are
hig
hest
. Tr
ansi
t use
was
foun
d to
incr
ease
in L
RT
corr
idor
hou
seho
lds (
as o
ppos
ed to
the
non-
LRT
area
con
trol g
roup
) and
gro
wth
of
2+
car h
ouse
hold
s was
foun
d to
be
sign
ifica
ntly
slow
er in
the
LRT
corr
idor
.
Econ
omic
So
cial
D
ueke
r and
B
ianc
o, 1
999
108

LRT
– Li
ght R
ail;
CO
M –
Com
mut
er R
ail;
HV
R –
Hea
vy R
ail;
AG
T –
Aut
omat
ed G
uide
way
103
Syst
em
Lin
e St
atio
n M
ode
Mea
sure
M
easu
rem
ent
Tec
hniq
ue
Ben
chm
ark
Val
ue
Impa
ct T
ype
Sour
ce
OR
: Po
rtlan
d M
AX
(E
asts
ide)
LRT
Res
iden
tial
prop
erty
val
ue
Hed
onic
pric
e ap
proa
ch,
GIS
ana
lysi
s
Esse
ntia
lly, a
n up
date
of t
he w
ork
Al-
Mos
aind
et a
l. (1
993)
per
form
ed
exam
inin
g th
e co
mpe
ting
effe
cts L
RT
has
on re
side
ntia
l pro
perty
val
ues;
how
ever
, th
e ar
ea o
f exa
min
atio
n w
as e
xten
ded
to
1000
met
ers (
1/2
mile
). A
gain
, thi
s stu
dy
took
into
con
side
ratio
n th
e po
sitiv
e ef
fect
of
acc
essi
bilit
y to
a L
RT
trans
it st
atio
n as
w
ell a
s the
nui
sanc
e ef
fect
of p
roxi
mity
to
a LR
T ra
il lin
e. W
hen
anal
yzin
g ho
me
valu
es, t
he p
ositi
ve e
ffec
t was
show
n to
ou
twei
gh th
e ne
gativ
e ef
fect
with
eve
ry
met
er a
way
from
a tr
ansi
t sta
tion
(sta
rting
at
100
met
ers d
ista
nce
as a
bas
elin
e)
decr
easi
ng a
vera
ge h
ome
pric
es b
y $3
2.20
.
Econ
omic
C
hen,
Ruf
lo,
and
Due
ker,
1998
OR
: Po
rtlan
d M
AX
(E
asts
ide)
7
stat
ion
sam
ple
LRT
Res
iden
tial
prop
erty
val
ue
Hed
onic
pric
e ap
proa
ch
Th
e st
udy
took
into
con
side
ratio
n th
e po
sitiv
e ef
fect
of a
cces
sibi
lity
to a
LR
T tra
nsit
stat
ion
as w
ell a
s the
nui
sanc
e ef
fect
of
pro
xim
ity to
a L
RT
rail
line.
Hom
es
with
in a
1/4
mile
are
a of
seve
n tra
nsit
stat
ions
wer
e co
nsid
ered
. The
pos
itive
ef
fect
s of h
omes
bei
ng c
lose
to L
RT
stat
ions
out
wei
ghed
the
nega
tive
effe
cts o
f ho
mes
bei
ng c
lose
to a
LR
T lin
e; th
us, f
or
ever
y 10
0 ft
near
er to
a L
RT
stat
ion,
hom
e va
lues
rose
$66
3.
Econ
omic
A
l-Mos
aind
, D
ueke
r, an
d St
rath
man
, 19
93
PA:
Phila
delp
hia
Phila
- Li
nwoo
d
CO
M
Res
iden
tial
prop
erty
val
ue
Hed
onic
pric
e ap
proa
ch
Th
e Li
nwoo
d Li
ne d
id h
ave
a si
gnifi
cant
im
pact
on
resi
dent
ial p
rope
rty v
alue
s, as
in
dica
ted
by th
e tra
vel-s
avin
gs m
odel
; th
ere
was
ver
y lit
tle a
ntic
ipat
ion
by th
e re
al e
stat
e m
arke
t of t
he st
art o
f the
Lin
e;
the
impa
ct is
mor
e ap
pare
nt in
low
er-
inco
me
neig
hbor
hood
s; th
e in
crea
se in
pr
oper
ty v
alue
s in
the
impa
ct c
orrid
or
appe
ars t
o be
com
pens
ated
by
a re
lativ
e de
crea
se in
val
ues i
n an
adj
acen
t con
trol
corr
idor
.
Econ
omic
M
udge
(197
4)
109
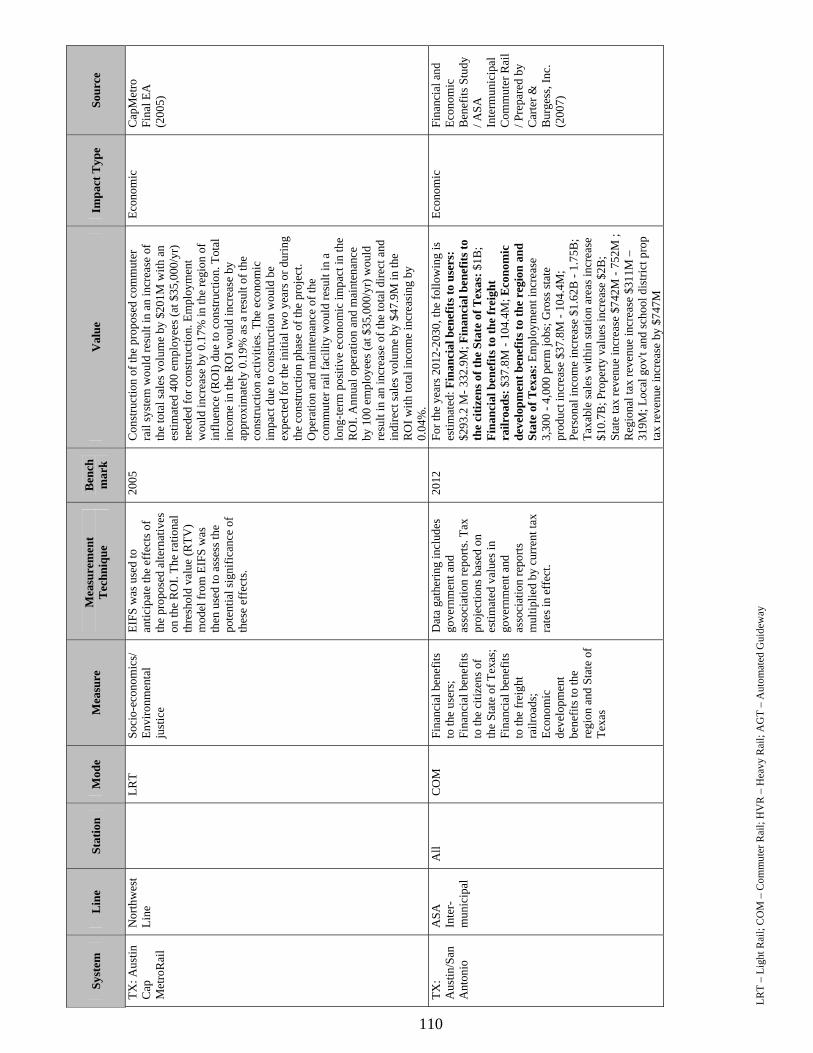
LRT
– Li
ght R
ail;
CO
M –
Com
mut
er R
ail;
HV
R –
Hea
vy R
ail;
AG
T –
Aut
omat
ed G
uide
way
104
Syst
em
Lin
e St
atio
n M
ode
Mea
sure
M
easu
rem
ent
Tec
hniq
ue
Ben
chm
ark
Val
ue
Impa
ct T
ype
Sour
ce
TX: A
ustin
C
ap
Met
roR
ail
Nor
thw
est
Line
LRT
Soci
o-ec
onom
ics/
En
viro
nmen
tal
just
ice
EIFS
was
use
d to
an
ticip
ate
the
effe
cts o
f th
e pr
opos
ed a
ltern
ativ
es
on th
e R
OI.
The
ratio
nal
thre
shol
d va
lue
(RTV
) m
odel
from
EIF
S w
as
then
use
d to
ass
ess t
he
pote
ntia
l sig
nific
ance
of
thes
e ef
fect
s.
2005
C
onst
ruct
ion
of th
e pr
opos
ed c
omm
uter
ra
il sy
stem
wou
ld re
sult
in a
n in
crea
se o
f th
e to
tal s
ales
vol
ume
by $
201M
with
an
estim
ated
400
em
ploy
ees (
at $
35,0
00/y
r)
need
ed fo
r con
stru
ctio
n. E
mpl
oym
ent
wou
ld in
crea
se b
y 0.
17%
in th
e re
gion
of
influ
ence
(RO
I) d
ue to
con
stru
ctio
n. T
otal
in
com
e in
the
RO
I wou
ld in
crea
se b
y ap
prox
imat
ely
0.19
% a
s a re
sult
of th
e co
nstru
ctio
n ac
tiviti
es. T
he e
cono
mic
im
pact
due
to c
onst
ruct
ion
wou
ld b
e ex
pect
ed fo
r the
initi
al tw
o ye
ars o
r dur
ing
the
cons
truct
ion
phas
e of
the
proj
ect.
Ope
ratio
n an
d m
aint
enan
ce o
f the
co
mm
uter
rail
faci
lity
wou
ld re
sult
in a
lo
ng-te
rm p
ositi
ve e
cono
mic
impa
ct in
the
RO
I. A
nnua
l ope
ratio
n an
d m
aint
enan
ce
by 1
00 e
mpl
oyee
s (at
$35
,000
/yr)
wou
ld
resu
lt in
an
incr
ease
of t
he to
tal d
irect
and
in
dire
ct sa
les v
olum
e by
$47
.9M
in th
e R
OI w
ith to
tal i
ncom
e in
crea
sing
by
0.04
%.
Econ
omic
C
apM
etro
Fi
nal E
A
(200
5)
TX:
Aus
tin/S
an
Ant
onio
ASA
In
ter-
mun
icip
al
All
CO
M
Fina
ncia
l ben
efits
to
the
user
s;
Fina
ncia
l ben
efits
to
the
citiz
ens o
f th
e St
ate
of T
exas
; Fi
nanc
ial b
enef
its
to th
e fr
eigh
t ra
ilroa
ds;
Econ
omic
de
velo
pmen
t be
nefit
s to
the
regi
on a
nd S
tate
of
Texa
s
Dat
a ga
ther
ing
incl
udes
go
vern
men
t and
as
soci
atio
n re
ports
. Tax
pr
ojec
tions
bas
ed o
n es
timat
ed v
alue
s in
gove
rnm
ent a
nd
asso
ciat
ion
repo
rts
mul
tiplie
d by
cur
rent
tax
rate
s in
effe
ct.
2012
Fo
r the
yea
rs 2
012-
2030
, the
follo
win
g is
es
timat
ed: F
inan
cial
ben
efits
to u
sers
: $2
93.2
M- 3
32.9
M; F
inan
cial
ben
efits
to
the
citiz
ens o
f the
Sta
te o
f Tex
as: $
1B;
Fina
ncia
l ben
efits
to th
e fr
eigh
t ra
ilroa
ds: $
37.8
M -
104.
4M; E
cono
mic
de
velo
pmen
t ben
efits
to th
e re
gion
and
St
ate
of T
exas
: Em
ploy
men
t inc
reas
e 3,
300
- 4,0
00 p
erm
jobs
; Gro
ss st
ate
prod
uct i
ncre
ase
$37.
8M -
104.
4M;
Pers
onal
inco
me
incr
ease
$1.
62B
- 1.
75B
; Ta
xabl
e sa
les w
ithin
stat
ion
area
s inc
reas
e $1
0.7B
; Pro
perty
val
ues i
ncre
ase
$2B
; St
ate
tax
reve
nue
incr
ease
$74
2M -
752M
; R
egio
nal t
ax re
venu
e in
crea
se $
311M
–
319M
; Loc
al g
ov't
and
scho
ol d
istri
ct p
rop
tax
reve
nue
incr
ease
by
$747
M
Econ
omic
Fi
nanc
ial a
nd
Econ
omic
B
enef
its S
tudy
/ A
SA
Inte
rmun
icip
al
Com
mut
er R
ail
/ Pre
pare
d by
C
arte
r &
Bur
gess
, Inc
. (2
007)
110
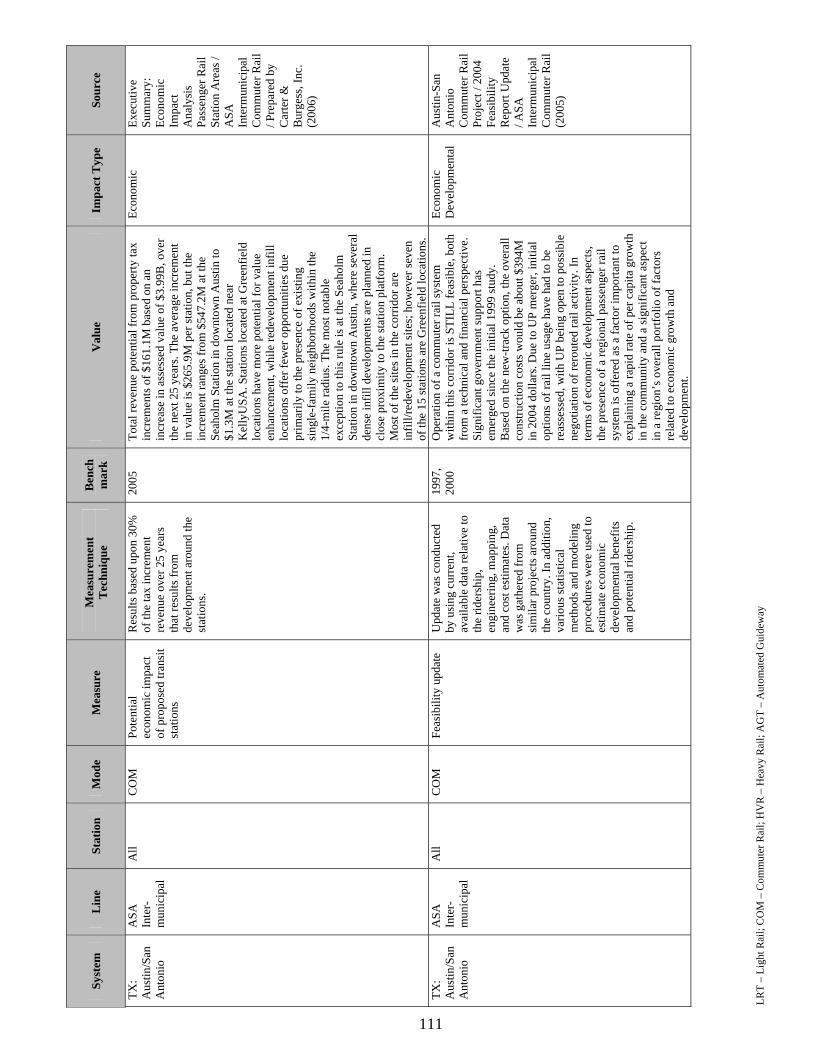
LRT
– Li
ght R
ail;
CO
M –
Com
mut
er R
ail;
HV
R –
Hea
vy R
ail;
AG
T –
Aut
omat
ed G
uide
way
105
Syst
em
Lin
e St
atio
n M
ode
Mea
sure
M
easu
rem
ent
Tec
hniq
ue
Ben
chm
ark
Val
ue
Impa
ct T
ype
Sour
ce
TX:
Aus
tin/S
an
Ant
onio
ASA
In
ter-
mun
icip
al
All
CO
M
Pote
ntia
l ec
onom
ic im
pact
of
pro
pose
d tra
nsit
stat
ions
Res
ults
bas
ed u
pon
30%
of
the
tax
incr
emen
t re
venu
e ov
er 2
5 ye
ars
that
resu
lts fr
om
deve
lopm
ent a
roun
d th
e st
atio
ns.
2005
To
tal r
even
ue p
oten
tial f
rom
pro
perty
tax
incr
emen
ts o
f $16
1.1M
bas
ed o
n an
in
crea
se in
ass
esse
d va
lue
of $
3.99
B, o
ver
the
next
25
year
s. Th
e av
erag
e in
crem
ent
in v
alue
is $
265.
9M p
er st
atio
n, b
ut th
e in
crem
ent r
ange
s fro
m $
547.
2M a
t the
Se
ahol
m S
tatio
n in
dow
ntow
n A
ustin
to
$1.3
M a
t the
stat
ion
loca
ted
near
K
elly
USA
. Sta
tions
loca
ted
at G
reen
field
lo
catio
ns h
ave
mor
e po
tent
ial f
or v
alue
en
hanc
emen
t, w
hile
rede
velo
pmen
t inf
ill
loca
tions
off
er fe
wer
opp
ortu
nitie
s due
pr
imar
ily to
the
pres
ence
of e
xist
ing
sing
le-f
amily
nei
ghbo
rhoo
ds w
ithin
the
1/4-
mile
radi
us. T
he m
ost n
otab
le
exce
ptio
n to
this
rule
is a
t the
Sea
holm
St
atio
n in
dow
ntow
n A
ustin
, whe
re se
vera
l de
nse
infil
l dev
elop
men
ts a
re p
lann
ed in
cl
ose
prox
imity
to th
e st
atio
n pl
atfo
rm.
Mos
t of t
he si
tes i
n th
e co
rrid
or a
re
infil
l/red
evel
opm
ent s
ites;
how
ever
seve
n of
the
15 st
atio
ns a
re G
reen
field
loca
tions
.
Econ
omic
Ex
ecut
ive
Sum
mar
y:
Econ
omic
Im
pact
A
naly
sis
Pass
enge
r Rai
l St
atio
n A
reas
/ A
SA
Inte
rmun
icip
al
Com
mut
er R
ail
/ Pre
pare
d by
C
arte
r &
Bur
gess
, Inc
. (2
006)
TX:
Aus
tin/S
an
Ant
onio
ASA
In
ter-
mun
icip
al
All
CO
M
Feas
ibili
ty u
pdat
e U
pdat
e w
as c
ondu
cted
by
usi
ng c
urre
nt,
avai
labl
e da
ta re
lativ
e to
th
e rid
ersh
ip,
engi
neer
ing,
map
ping
, an
d co
st e
stim
ates
. Dat
a w
as g
athe
red
from
si
mila
r pro
ject
s aro
und
the
coun
try. I
n ad
ditio
n,
vario
us st
atis
tical
m
etho
ds a
nd m
odel
ing
proc
edur
es w
ere
used
to
estim
ate
econ
omic
de
velo
pmen
tal b
enef
its
and
pote
ntia
l rid
ersh
ip.
1997
, 20
00
Ope
ratio
n of
a c
omm
uter
rail
syst
em
with
in th
is c
orrid
or is
STI
LL fe
asib
le, b
oth
from
a te
chni
cal a
nd fi
nanc
ial p
ersp
ectiv
e.
Sign
ifica
nt g
over
nmen
t sup
port
has
emer
ged
sinc
e th
e in
itial
199
9 st
udy.
B
ased
on
the
new
-trac
k op
tion,
the
over
all
cons
truct
ion
cost
s wou
ld b
e ab
out $
394M
in
200
4 do
llars
. Due
to U
P m
erge
r, in
itial
op
tions
of r
ail l
ine
usag
e ha
ve h
ad to
be
reas
sess
ed, w
ith U
P be
ing
open
to p
ossi
ble
nego
tiatio
n of
rero
uted
rail
activ
ity. I
n te
rms o
f eco
nom
ic d
evel
opm
ent a
spec
ts,
the
pres
ence
of a
regi
onal
pas
seng
er ra
il sy
stem
is o
ffer
ed a
s a fa
ctor
impo
rtant
to
expl
aini
ng a
rapi
d ra
te o
f per
cap
ita g
row
th
in th
e co
mm
unity
and
a si
gnifi
cant
asp
ect
in a
regi
on’s
ove
rall
portf
olio
of f
acto
rs
rela
ted
to e
cono
mic
gro
wth
and
de
velo
pmen
t.
Econ
omic
D
evel
opm
enta
l A
ustin
-San
A
nton
io
Com
mut
er R
ail
Proj
ect /
200
4 Fe
asib
ility
R
epor
t Upd
ate
/ ASA
In
term
unic
ipal
C
omm
uter
Rai
l (2
005)
111

LRT
– Li
ght R
ail;
CO
M –
Com
mut
er R
ail;
HV
R –
Hea
vy R
ail;
AG
T –
Aut
omat
ed G
uide
way
106
Syst
em
Lin
e St
atio
n M
ode
Mea
sure
M
easu
rem
ent
Tec
hniq
ue
Ben
chm
ark
Val
ue
Impa
ct T
ype
Sour
ce
TX:
Aus
tin/S
an
Ant
onio
ASA
In
ter-
mun
icip
al
All
CO
M
Feas
ibili
ty
Stud
y w
as c
ondu
cted
by
usin
g cu
rren
t, av
aila
ble
data
rela
tive
to th
e rid
ersh
ip, e
ngin
eerin
g,
map
ping
, and
cos
t es
timat
es. D
ata
wer
e ga
ther
ed fr
om si
mila
r pr
ojec
ts a
roun
d th
e co
untry
and
from
the
prof
essi
onal
exp
erie
nce
of th
e C
arte
r & B
urge
ss
Team
. In
addi
tion,
su
bsta
ntia
l ass
ista
nce
was
rece
ived
from
va
rious
age
ncie
s re
pres
ente
d on
the
Stee
ring
Com
mitt
ee.
2000
O
pera
tion
of a
com
mut
er ra
il sy
stem
w
ithin
this
cor
ridor
is fe
asib
le, b
oth
from
a
tech
nica
l and
fina
ncia
l per
spec
tive.
Bas
ed
on th
e ne
w-tr
ack
optio
n, th
e ov
eral
l co
nstru
ctio
n co
sts w
ould
be
abou
t $47
5M
in 1
998
dolla
rs. I
t cou
ld b
e fin
ance
d w
ith
50%
fede
ral T
EA-2
1 (T
rans
porta
tion
Equi
ty A
ct fo
r the
21s
t Cen
tury
) fun
ds (o
r fu
nds f
rom
a su
bseq
uent
tran
spor
tatio
n ac
t) su
pple
men
ted
with
a re
gion
al sa
les t
ax
of a
bout
0.1
1 ce
nts (
just
ove
r one
tent
h of
a
cent
) for
con
stru
ctio
n an
d 0.
015
cent
s (le
ss th
an tw
o hu
ndre
dths
of a
cen
t) fo
r op
erat
ions
afte
r the
con
stru
ctio
n bo
nds a
re
paid
off
. Sho
uld
the
posi
tion
of th
e U
nion
Pa
cific
Rai
lroad
(UP)
cha
nge
and
perm
it sh
arin
g of
trac
ks b
etw
een
UP
frei
ght
serv
ice
and
com
mut
er ra
il pa
ssen
ger
serv
ice,
a lo
wer
cos
t alte
rnat
ive
may
be
poss
ible
.
Dev
elop
men
tal
Texa
s D
epar
tmen
t of
Tran
spor
tatio
n / A
ustin
San
A
nton
io
Com
mut
er R
ail
Stud
y /
Prep
ared
by
Car
ter &
B
urge
ss, I
nc.
(199
9)
TX: D
alla
s D
AR
T A
ll LR
T V
alue
of T
OD
de
velo
pmen
ts
com
plet
ed,
unde
rway
, or
plan
ned;
Tax
able
pr
oper
ty v
alue
s (b
oth
real
and
po
tent
ial);
Po
tent
ial s
ales
tax
reve
nues
Dat
a ga
ther
ing
incl
udes
se
cond
ary
sour
ces s
uch
as n
ewsp
aper
s, bu
sine
ss
and
trade
pub
licat
ions
, w
eb si
tes,
pers
onal
co
mm
unic
atio
ns w
ith
key
info
rman
ts, a
nd fi
eld
obse
rvat
ions
. Tax
pr
ojec
tions
bas
ed o
n es
timat
ed v
alue
s m
ultip
lied
by c
urre
nt ta
x ra
tes i
n ef
fect
.
1999
To
tal v
alue
for a
ll cu
rren
t and
pro
ject
ed
deve
lopm
ents
nea
r DA
RT
rail
stat
ions
is
$4.9
B. V
alue
of t
axab
le re
al a
nd b
usin
ess
pers
onal
pro
perty
ass
ocia
ted
with
thes
e pr
ojec
ts e
xcee
ds $
2.84
B. T
he re
tail
com
pone
nt o
f TO
D p
roje
cts w
ill g
ener
ate
over
$66
0M in
ann
ual t
axab
le re
tail
sale
s.
Econ
omic
W
eins
tein
, C
low
er, a
nd
Sem
an (2
007b
)
TX: D
alla
s D
AR
T A
ll LR
T A
nnua
l tax
re
venu
e du
e to
TO
D
App
lyin
g pr
evio
usly
pu
blis
hed
valu
es fo
r co
mpl
eted
, und
erw
ay, o
r pl
anne
d TO
D p
roje
cts,
the
amou
nt o
f ann
ual t
ax
reve
nue
for c
ities
, sch
ool
dist
ricts
, and
cou
ntie
s w
as a
sses
sed
by
mul
tiply
ing
valu
es b
y th
e av
erag
e ta
x ra
tes f
or
mun
icip
aliti
es, c
ount
ies,
and
scho
ol d
istri
cts.
2006
$3
.3B
of n
ew v
alua
tions
ass
ocia
ted
with
TO
D is
pro
duci
ng (o
r will
pro
duce
) $78
M
in a
nnua
l rec
eipt
s for
are
a ci
ties,
coun
ties,
and
scho
ol d
istri
cts.
Loca
l ISD
s are
re
ceiv
ing
mor
e th
an h
alf o
f the
se n
ew
reve
nues
.
Econ
omic
W
eins
tein
and
C
low
er
(200
7a)
112

LRT
– Li
ght R
ail;
CO
M –
Com
mut
er R
ail;
HV
R –
Hea
vy R
ail;
AG
T –
Aut
omat
ed G
uide
way
107
Syst
em
Lin
e St
atio
n M
ode
Mea
sure
M
easu
rem
ent
Tec
hniq
ue
Ben
chm
ark
Val
ue
Impa
ct T
ype
Sour
ce
TX: D
alla
s D
AR
T A
ll LR
T R
esid
entia
l and
co
mm
erci
al
prop
erty
val
ue
Mat
ched
pai
r com
paris
on
1997
B
etw
een
1997
-200
1, m
edia
n va
lues
of
resi
dent
ial p
rope
rties
incr
ease
d 32
.1
perc
ent n
ear t
he D
AR
T ra
il st
atio
ns
com
pare
d to
19.
5 pe
rcen
t in
the
cont
rol
grou
p ar
eas.
For o
ffic
e bu
ildin
gs, t
he
incr
ease
was
24.
7 pe
rcen
t for
the
DA
RT
prop
ertie
s ver
sus 1
1.5
perc
ent f
or th
e no
n D
AR
T pr
oper
ties.
How
ever
, pro
xim
ity to
D
AR
T ra
il do
es n
ot a
ppea
r to
have
a
sign
ifica
nt d
iffer
entia
l im
pact
on
reta
il an
d in
dust
rial p
rope
rty v
alua
tions
.
Econ
omic
W
eins
tein
and
C
low
er (2
002)
TX: D
alla
s D
AR
T A
ll LR
T C
omm
erci
al
prop
erty
val
ue
Mat
ched
pai
r com
paris
on
1994
Th
e av
erag
e pe
rcen
t cha
nge
in la
nd v
alue
s fr
om 1
994-
1998
for r
etai
l and
off
ice
prop
ertie
s nea
r DA
RT
stop
s was
36.
8%
and
13.9
%, r
espe
ctiv
ely;
for "
cont
rol"
pa
rcel
s, th
e av
erag
e ch
ange
s wer
e 7.
1%
and
3.7%
, res
pect
ivel
y. F
or re
tail
uses
, it i
s su
gges
ted
that
a v
alue
-add
ed 3
0%
prem
ium
is a
ppar
ent.
Econ
omic
W
eins
tein
, C
low
er, a
nd
Gro
ss (1
999)
TX: D
alla
s D
AR
T St
atio
ns
outs
ide
of
Dal
las'
CB
D a
nd
Col
lin
Cou
nty
LRT
Res
iden
tial
prop
erty
val
ue
Hed
onic
pric
e ap
proa
ch
2000
, 20
05
Stud
y ar
ea w
as se
t-up
as 3
,000
ft ra
dii
arou
nd 2
3 D
AR
T R
ail t
rans
it st
atio
ns.
Stat
ions
in th
e D
alla
s CB
D w
ere
excl
uded
du
e to
ext
erna
l dev
elop
men
t fac
tors
in
fluen
cing
val
uatio
ns w
hile
stat
ions
in
Col
lin C
ount
y w
ere
not i
nclu
ded
due
to
diff
eren
t acc
ount
ing
proc
edur
es. D
ue to
lo
catio
nal v
aria
tions
, the
resu
lting
stat
ions
w
ere
grou
ped
and
divi
ded
into
four
are
as.
In te
rms o
f pro
xim
ity to
rail
line,
the
grad
ient
rang
e w
as a
loss
of $
50 to
$10
4 in
pr
oper
ty v
alue
for e
very
30
ft cl
oser
to th
e ra
il lin
e. M
ulti-
fam
ily h
ousi
ng w
ithst
ood
the
grea
test
fina
ncia
l im
pact
, sin
gle-
fam
ily
hous
ing
fare
d sl
ight
ly b
ette
r. Tr
ansi
t st
atio
n pr
oxim
ity re
sulte
d in
the
oppo
site
. Th
e gr
adie
nt ra
nge
was
a g
ain
of $
31 to
$7
7 in
pro
perty
val
ue fo
r eve
ry 3
0 ft
clos
er
to a
tran
sit s
tatio
n.
Econ
omic
Le
onar
d, 2
007
TX: D
alla
s N
orth
C
entra
l C
orrid
or
LR
T In
crea
se ri
ders
hip
Rid
ersh
ip e
valu
atio
n 20
04
2004
ride
rshi
p is
gre
ater
than
pro
ject
ed
2010
ride
rshi
p (f
or m
ost s
tatio
ns)
Tran
spor
tatio
n D
AR
T (2
007)
TX: D
alla
s N
orth
C
entra
l C
orrid
or
LR
T Se
rvic
e le
vels
in
crea
se
Hea
dway
s 20
04
Proj
ecte
d he
adw
ays o
f 20
min
utes
, 10
min
ute
head
way
s at o
peni
ng re
duce
d do
wn
to 4
-6 m
inut
e he
adw
ays
Tran
spor
tatio
n D
AR
T (2
007)
113

LRT
– Li
ght R
ail;
CO
M –
Com
mut
er R
ail;
HV
R –
Hea
vy R
ail;
AG
T –
Aut
omat
ed G
uide
way
108
Syst
em
Lin
e St
atio
n M
ode
Mea
sure
M
easu
rem
ent
Tec
hniq
ue
Ben
chm
ark
Val
ue
Impa
ct T
ype
Sour
ce
TX: D
alla
s N
orth
C
entra
l C
orrid
or
L
RT
Rid
ersh
ip
dem
ogra
phic
s R
ider
ship
surv
ey
2004
Th
e nu
mbe
r of c
olle
ge d
egre
es a
nd a
bove
pa
ssen
gers
has
incr
ease
d on
rail.
So
cial
D
AR
T (2
007)
TX: D
alla
s N
orth
C
entra
l C
orrid
or
LR
T R
ider
ship
de
mog
raph
ics
Rid
ersh
ip su
rvey
20
04
The
ethn
iciti
es h
ave
chan
ged
to in
clud
e a
larg
er p
erce
ntag
e of
Cau
casi
an p
asse
nger
s an
d a
smal
ler p
erce
ntag
e of
Afr
ican
A
mer
ican
s on
rail.
Soci
al
DA
RT
(200
7)
TX: D
alla
s N
orth
C
entra
l C
orrid
or
LR
T R
ider
ship
de
mog
raph
ics
Rid
ersh
ip su
rvey
20
04
Rai
l rid
ers'
inco
me
leve
l has
gro
wn
at a
fa
ster
rate
than
non
-rai
l rid
ers'
inco
me.
So
cial
D
AR
T (2
007)
TX: D
alla
s N
orth
C
entra
l C
orrid
or
LR
T R
ider
ship
de
mog
raph
ics
Rid
ersh
ip su
rvey
20
04
Perc
enta
ge o
f Cho
ice
rider
s has
incr
ease
d on
LR
T by
22%
. So
cial
D
AR
T (2
007)
TX:
Hou
ston
U
nive
rsity
C
orrid
or
LR
T Sh
ort t
erm
impa
ct
of n
ew
cons
truct
ion
fund
ing
on o
utpu
t
RIM
S II
out
put
mul
tiplie
rs m
ultip
lied
by
new
cap
ital e
xpen
ditu
re
for e
ach
build
alte
rnat
ive
2007
Sh
ort t
erm
impa
ct o
f new
con
stru
ctio
n fu
ndin
g w
ould
pro
vide
app
roxi
mat
ely
$449
M -
$868
M in
out
put (
2007
dol
lars
) de
pend
ing
on D
EIS
build
alte
rnat
ive.
Po
ssib
le e
arni
ngs w
ere
calc
ulat
ed a
s $1
64M
to $
317M
(200
7 do
llars
) de
pend
ing
on D
EIS
build
alte
rnat
ive.
Po
tent
ial j
ob c
reat
ion
is e
stim
ated
to b
e 4,
400
- 8,6
00 p
erso
n-ye
ar jo
bs fo
r the
H
oust
on M
SA.
Econ
omic
H
oust
on U
niv
Cor
ridor
DEI
S (2
007)
TX:
Hou
ston
M
etro
rail
LR
T Pe
rcen
t dec
reas
e in
ride
rshi
p du
ring
Hou
ston
Tex
ans
seas
ons
Rep
orte
d pe
rcen
tage
of
gam
e pa
trons
cla
imin
g to
ha
ve a
rriv
ed b
y M
ETR
OR
ail;
auto
mat
ic
pass
enge
r cou
nter
and
ad
just
men
t fac
tor b
y m
anua
l poi
nt c
heck
s
2004
- 20
06
1.52
% a
nnua
l dec
line
abso
lute
mod
e sh
are
from
200
4 (7
.2%
), 20
05 (4
.7%
), to
200
6 (3
.7%
)
Tran
spor
tatio
n M
ETR
O
(200
7)
TX:
Hou
ston
R
ed L
ine
Rel
iant
Pa
rk
LRT
Rid
ersh
ip
Eval
uatio
n of
ride
rshi
p vs
. atte
ndan
ce a
t Hou
ston
Te
xans
foot
ball
gam
es
2006
Pe
rcen
t of r
ail r
ider
s to
foot
ball
gam
es (o
f at
tend
ance
) dro
pped
from
7.2
% in
200
4 pr
esea
son
to 3
.7%
in 2
006
seas
on
Tran
spor
tatio
n H
oust
on
MET
RO
(2
007)
TX: S
an
Ant
onio
V
ia M
etro
LRT
Reg
iona
l im
pact
of
mod
al c
hang
e (a
uto
to m
ass
trans
it)
RSR
C P
C I-
O M
odel
us
ed to
est
imat
e ch
ange
in
regi
onal
inco
me,
as
sum
ing
1% d
ecre
ase
in
VM
T
1999
A
pro
pose
d re
gion
al in
com
e in
crea
se o
f $2
.9M
Ec
onom
ic
Mill
er (1
999)
114

LRT
– Li
ght R
ail;
CO
M –
Com
mut
er R
ail;
HV
R –
Hea
vy R
ail;
AG
T –
Aut
omat
ed G
uide
way
109
Syst
em
Lin
e St
atio
n M
ode
Mea
sure
M
easu
rem
ent
Tec
hniq
ue
Ben
chm
ark
Val
ue
Impa
ct T
ype
Sour
ce
Was
hing
ton
D.C
. Sy
stem
HV
R
"Sav
ings
" fo
r m
otor
ist v
s. ra
il op
erat
ing
subs
idy
(Ann
ualiz
ed
wee
kday
serv
ice)
Logi
t-bas
ed c
hoic
e m
odel
Mot
oris
ts sa
ve $
454M
vs.
op. s
ubsi
dy o
f $1
10M
Tr
ansp
orta
tion
Nel
son,
B
aglin
o et
al
.(200
7)
Was
hing
ton
D.C
. Sy
stem
HV
R
Proj
ect p
eak
hour
hi
ghw
ay sp
eed
Logi
t-bas
ed c
hoic
e m
odel
Ave
rage
spee
d on
I-39
5 N
orth
with
rail
is
33 m
ph v
s. 39
mph
with
out r
ail
Tran
spor
tatio
n N
elso
n,
Bag
lino
et
al.(2
007)
Was
hing
ton
D.C
. Sy
stem
HV
R
Val
ue o
f trip
be
nefit
by
inco
me
grou
p
Logi
t-bas
ed c
hoic
e m
odel
Per c
apita
ben
efits
for l
owes
t inc
ome
grou
p is
$41
vs.
$663
for h
ighe
st in
com
e gr
oup
Soci
al
Nel
son,
B
aglin
o et
al
.(200
7)
WI:
Ken
osha
-R
acin
e-M
ilwau
kee
KR
M
C
OM
Ec
onom
ic im
pact
on
regi
on
RIM
S II
out
put
mul
tiplie
rs, a
vaila
ble
data
(and
pro
ject
ions
) re
lativ
e to
the
hous
ing,
po
pula
tion,
and
tran
sit
char
acte
ristic
s of t
he
area
s obs
erve
d.
2005
Im
pact
dur
ing
cons
truct
ion
estim
ated
at
4,70
0 jo
bs c
reat
ed w
ith a
$56
0M im
pact
on
the
area
eco
nom
y. D
urin
g pr
ojec
t op
erat
ions
and
mai
nten
ance
126
jobs
will
be
cre
ated
with
a $
24M
ann
ual i
mpa
ct o
n ec
onom
y. P
rope
rty v
alue
s, if
estim
ated
at
an in
term
edia
te 1
0% p
rem
ium
for a
one
- m
ile c
orrid
or a
long
the
KR
M ra
il lin
e w
ould
repr
esen
t a $
2.1B
incr
ease
in th
e th
ree
KR
M c
ount
ies.
Pote
ntia
l TO
Ds
with
in o
ne-h
alf m
ile o
f the
nin
e K
RM
st
atio
ns a
re p
roje
cted
to in
clud
e 23
,000
re
side
ntia
l uni
ts, 7
.6M
sq ft
of r
etai
l spa
ce,
4.7M
sq ft
of o
ffic
e sp
ace,
71,
000
jobs
, an
d a
$7.9
B in
crea
se in
pro
perty
val
ue. I
f th
e ra
il lin
e is
not
bui
lt, 2
0-50
% o
f the
TO
D p
oten
tial w
ould
not
take
pla
ce. T
he
rail
line
is a
lso
look
ed u
pon
as a
pot
entia
l bo
ost t
o th
e ar
eas a
lread
y su
cces
sful
to
uris
m m
arke
t. If
the
line
prov
ides
onl
y a
1% in
crea
se in
tour
ism
, the
thre
e K
RM
co
untie
s may
gen
erat
e $2
0M in
ex
pend
iture
s $12
M in
wag
es, $
3M in
stat
e an
d lo
cal g
over
nmen
t rev
enue
, and
500
jo
bs.
Econ
omic
In
stitu
te fo
r Su
rvey
&
Polic
y R
esea
rch
and
Uni
vers
ity o
f W
isco
nsin
-M
ilwau
kee,
20
07
115

LRT
– Li
ght R
ail;
CO
M –
Com
mut
er R
ail;
HV
R –
Hea
vy R
ail;
AG
T –
Aut
omat
ed G
uide
way
110
Syst
em
Lin
e St
atio
n M
ode
Mea
sure
M
easu
rem
ent
Tec
hniq
ue
Ben
chm
ark
Val
ue
Impa
ct T
ype
Sour
ce
MIS
C:
Nat
ionw
ide
Ef
fect
ive
stra
tegi
es fo
r en
cour
agin
g m
ixed
-inco
me
hous
ing
near
tra
nsit
in B
osto
n,
MA
; Por
tland
, O
R; D
enve
r, C
O;
Twin
Citi
es, M
N;
and
Cha
rlotte
, NC
Stud
y w
as c
ondu
cted
by
usin
g cu
rren
t, av
aila
ble
data
(and
pro
ject
ions
) re
lativ
e to
the
hous
ing,
po
pula
tion,
and
tran
sit
char
acte
ristic
s of t
he
area
s obs
erve
d.
2000
C
ase
stud
y re
sults
: Res
iden
ts o
f tra
nsit
zone
s: 3
tim
es a
s lik
ely
to ta
ke tr
ansi
t to
wor
k th
an re
side
nts o
f the
regi
on a
s a
who
le; 3
+ tim
es li
kely
to b
ike
or w
alk
to
wor
k th
an a
re re
side
nts o
f the
regi
on a
s a
who
le. A
s tra
nsit
syst
em si
ze in
crea
ses,
trans
it rid
ersh
ip in
crea
ses.
Nat
iona
lly, 4
2%
in tr
ansi
t zon
es u
se c
ars f
or w
ork
com
mut
e vs
. 82%
els
ewhe
re. P
edes
trian
and
bik
e m
ode
shar
es in
tran
sit z
ones
3-7
tim
es
high
er th
an re
gion
al a
vera
ges.
Hou
seho
lds
near
tran
sit a
re sm
alle
r, w
ith lo
wer
in
com
es th
an th
e re
gion
as a
who
le. A
s tra
nsit
syst
ems g
row
in si
ze, t
houg
h,
hous
ehol
d co
mpo
sitio
n an
d in
com
e m
ore
clos
ely
rese
mbl
e re
gion
al a
vera
ges.
With
in
1/2
mile
of t
rans
it 54
% a
re m
ore
likel
y to
re
nt th
an o
wn
hom
es. D
eman
d fo
r hou
sing
ne
ar tr
ansi
t will
mor
e th
an d
oubl
e by
203
0.
It is
impo
rtant
to h
ave
stro
ng g
over
nmen
t le
ader
ship
for d
evel
opm
ent o
f TO
D.
Publ
ic-p
rivat
e pa
rtner
ship
s can
yie
ld
impr
essi
ve re
sults
and
ther
e ar
e m
any
diff
erin
g w
ays t
o le
vera
ge b
oth
publ
ic a
nd
priv
ate
fund
ing
in o
rder
to se
cure
af
ford
able
hou
sing
in T
OD
pro
ject
s.
R
ealiz
ing
the
Pote
ntia
l: Ex
pand
ing
Hou
sing
O
ppor
tuni
ties
Nea
r Tra
nsit
/ R
econ
nect
ing
Am
eric
a (2
007)
MIS
C:
Nat
ionw
ide
LRT
Pote
ntia
l nat
iona
l de
man
d fo
r ho
usin
g in
tran
sit
zone
s thr
ough
20
25
GIS
ana
lysi
s was
then
ap
plie
d to
met
ropo
litan
an
d tra
nsit
zone
ty
polo
gies
. The
resu
lts
wer
e co
mbi
ned
with
ho
useh
old
proj
ectio
ns
and
then
pre
fere
nce
assu
mpt
ions
.
2000
In
the
next
20
year
s, 14
.6M
hou
seho
lds
will
be
look
ing
to re
nt o
r buy
hou
sing
w
ithin
a h
alf m
ile o
f fix
ed-g
uide
way
tra
nsit
stop
s.
Dev
elop
men
tal
Hid
den
in
Plai
n Si
ght /
R
econ
nect
ing
Am
eric
a (2
004)
116
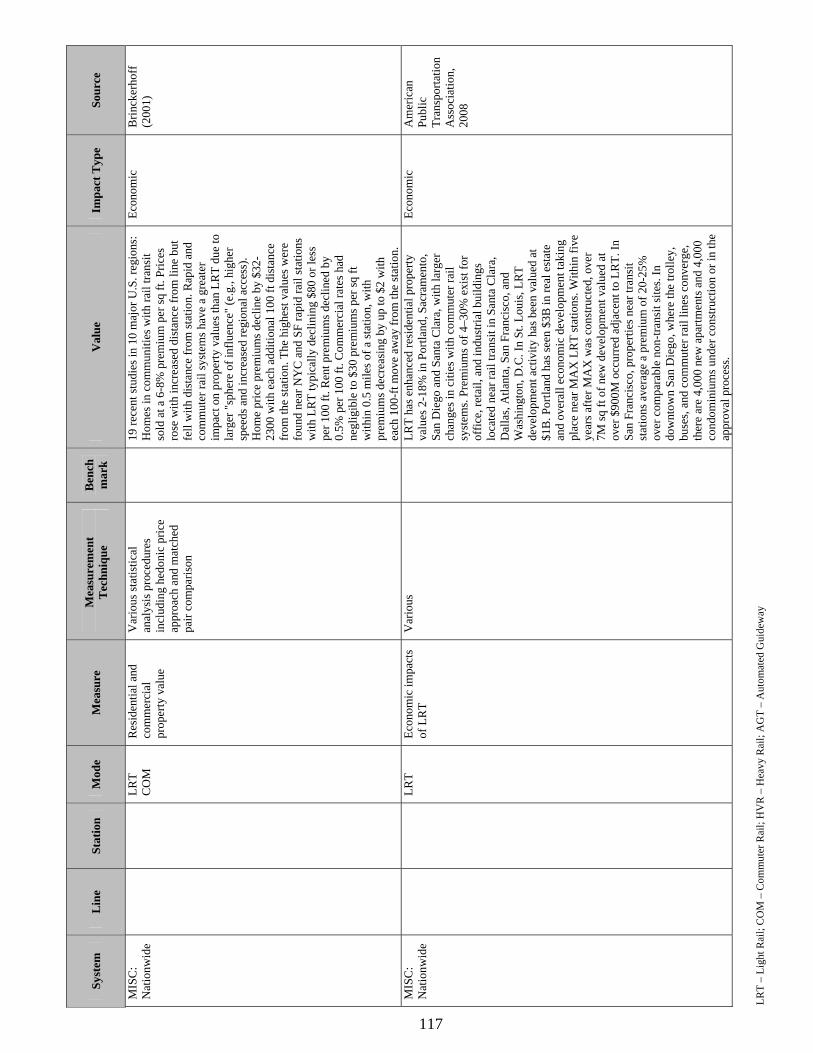
LRT
– Li
ght R
ail;
CO
M –
Com
mut
er R
ail;
HV
R –
Hea
vy R
ail;
AG
T –
Aut
omat
ed G
uide
way
111
Syst
em
Lin
e St
atio
n M
ode
Mea
sure
M
easu
rem
ent
Tec
hniq
ue
Ben
chm
ark
Val
ue
Impa
ct T
ype
Sour
ce
MIS
C:
Nat
ionw
ide
LRT
CO
M
Res
iden
tial a
nd
com
mer
cial
pr
oper
ty v
alue
Var
ious
stat
istic
al
anal
ysis
pro
cedu
res
incl
udin
g he
doni
c pr
ice
appr
oach
and
mat
ched
pa
ir co
mpa
rison
19
rece
nt st
udie
s in
10 m
ajor
U.S
. reg
ions
: H
omes
in c
omm
uniti
es w
ith ra
il tra
nsit
sold
at a
6-8
% p
rem
ium
per
sq ft
. Pric
es
rose
with
incr
ease
d di
stan
ce fr
om li
ne b
ut
fell
with
dis
tanc
e fr
om st
atio
n. R
apid
and
co
mm
uter
rail
syst
ems h
ave
a gr
eate
r im
pact
on
prop
erty
val
ues t
han
LRT
due
to
larg
er "
sphe
re o
f inf
luen
ce" (
e.g.
, hig
her
spee
ds a
nd in
crea
sed
regi
onal
acc
ess)
. H
ome
pric
e pr
emiu
ms d
eclin
e by
$32
-23
00 w
ith e
ach
addi
tiona
l 100
ft d
ista
nce
from
the
stat
ion.
The
hig
hest
val
ues w
ere
foun
d ne
ar N
YC
and
SF
rapi
d ra
il st
atio
ns
with
LR
T ty
pica
lly d
eclin
ing
$80
or le
ss
per 1
00 ft
. Ren
t pre
miu
ms d
eclin
ed b
y 0.
5% p
er 1
00 ft
. Com
mer
cial
rate
s had
ne
glig
ible
to $
30 p
rem
ium
s per
sq ft
w
ithin
0.5
mile
s of a
stat
ion,
with
pr
emiu
ms d
ecre
asin
g by
up
to $
2 w
ith
each
100
-ft m
ove
away
from
the
stat
ion.
Econ
omic
B
rinck
erho
ff
(200
1)
MIS
C:
Nat
ionw
ide
LRT
Econ
omic
impa
cts
of L
RT
Var
ious
LRT
has e
nhan
ced
resi
dent
ial p
rope
rty
valu
es 2
-18%
in P
ortla
nd, S
acra
men
to,
San
Die
go a
nd S
anta
Cla
ra, w
ith la
rger
ch
ange
s in
citie
s with
com
mut
er ra
il sy
stem
s. Pr
emiu
ms o
f 4–3
0% e
xist
for
offic
e, re
tail,
and
indu
stria
l bui
ldin
gs
loca
ted
near
rail
trans
it in
San
ta C
lara
, D
alla
s, A
tlant
a, S
an F
ranc
isco
, and
W
ashi
ngto
n, D
.C. I
n St
. Lou
is, L
RT
deve
lopm
ent a
ctiv
ity h
as b
een
valu
ed a
t $1
B. P
ortla
nd h
as se
en $
3B in
real
est
ate
and
over
all e
cono
mic
dev
elop
men
t tak
ing
plac
e ne
ar M
AX
LR
T st
atio
ns. W
ithin
five
ye
ars a
fter M
AX
was
con
stru
cted
, ove
r 7M
sq ft
of n
ew d
evel
opm
ent v
alue
d at
ov
er $
900M
occ
urre
d ad
jace
nt to
LR
T. In
Sa
n Fr
anci
sco,
pro
perti
es n
ear t
rans
it st
atio
ns a
vera
ge a
pre
miu
m o
f 20-
25%
ov
er c
ompa
rabl
e no
n-tra
nsit
site
s. In
do
wnt
own
San
Die
go, w
here
the
trolle
y,
buse
s, an
d co
mm
uter
rail
lines
con
verg
e,
ther
e ar
e 4,
000
new
apa
rtmen
ts a
nd 4
,000
co
ndom
iniu
ms u
nder
con
stru
ctio
n or
in th
e ap
prov
al p
roce
ss.
Econ
omic
A
mer
ican
Pu
blic
Tr
ansp
orta
tion
Ass
ocia
tion,
20
08
117

LRT
– Li
ght R
ail;
CO
M –
Com
mut
er R
ail;
HV
R –
Hea
vy R
ail;
AG
T –
Aut
omat
ed G
uide
way
112
Syst
em
Lin
e St
atio
n M
ode
Mea
sure
M
easu
rem
ent
Tec
hniq
ue
Ben
chm
ark
Val
ue
Impa
ct T
ype
Sour
ce
MIS
C:
Nat
ionw
ide
LRT
C
OM
H
ow la
nd-u
se
envi
ronm
ents
, and
m
ixed
use
s in
parti
cula
r, af
fect
co
mm
utin
g be
havi
or
Mat
ched
pai
r com
paris
on
1985
Th
e re
lativ
e pr
oxim
ity o
f mix
ed-u
se
deve
lopm
ent m
atte
rs g
reat
ly. I
f ret
ail
shop
s are
with
in 3
00 ft
, or s
ever
al c
ity
bloc
ks, f
rom
a d
wel
ling
unit,
wor
kers
are
m
ore
likel
y to
com
mut
e by
tran
sit,
foot
, or
bicy
cle.
Bey
ond
this
dis
tanc
e, h
owev
er,
mix
ed-u
se a
ctiv
ities
app
ear t
o in
duce
aut
o-co
mm
utin
g. N
eigh
borh
ood
dens
ity a
nd
mix
ed la
nd-u
ses t
ende
d to
redu
ce v
ehic
le
owne
rshi
p ra
tes a
nd w
ere
asso
ciat
ed w
ith
shor
ter c
omm
utes
, con
trolli
ng fo
r oth
er
fact
ors s
uch
as h
ouse
hold
inco
me.
In
com
bina
tion,
the
effe
cts o
f red
ucin
g au
to-
com
mut
ing,
com
mut
e di
stan
ces,
and
vehi
cle
owne
rshi
p ra
tes s
ugge
st th
at
mod
erat
e-to
-hig
h de
nsity
, mix
ed-u
se
neig
hbor
hood
s ave
rage
less
veh
icle
-mile
s-tra
vele
d (V
MT)
per
cap
ita th
an lo
wer
de
nsity
, exc
lusi
vely
resi
dent
ial o
nes.
Soci
al
Cer
vero
(1
996b
)
Van
couv
er
B.C
. Sk
yTra
in
A
GT
Cha
nge
in m
ode
of
trip
Cus
tom
er su
rvey
20
04
Perc
ent o
f rai
l rid
ers s
how
form
erly
dro
ve
alon
e: 4
2%
Tran
spor
tatio
n Li
tman
(200
6)
Van
couv
er
B.C
. W
est
Coa
st
Expr
ess
C
OM
C
hang
e in
mod
e of
tri
p C
usto
mer
surv
ey
2004
Pe
rcen
t of r
ail r
ider
s who
form
erly
dro
ve
alon
e: 4
9%
Tran
spor
tatio
n Li
tman
(200
6)
Engl
and:
Sh
effie
ld
Supe
rtram
LRT
Res
iden
tial
prop
erty
val
ue
Hed
onic
pric
e ap
proa
ch
1988
In
198
8 (a
nnou
ncem
ent),
pro
perti
es c
lose
r to
the
stat
ion
wer
e m
argi
nally
mor
e ex
pens
ive,
by
1993
(bui
ldin
g) th
at tr
end
reve
rsed
; in
1996
(com
plet
ion)
, the
re w
as
no si
gnifi
cant
diff
eren
ce in
pro
perty
va
lues
.
Econ
omic
H
enne
berr
y (1
998)
118
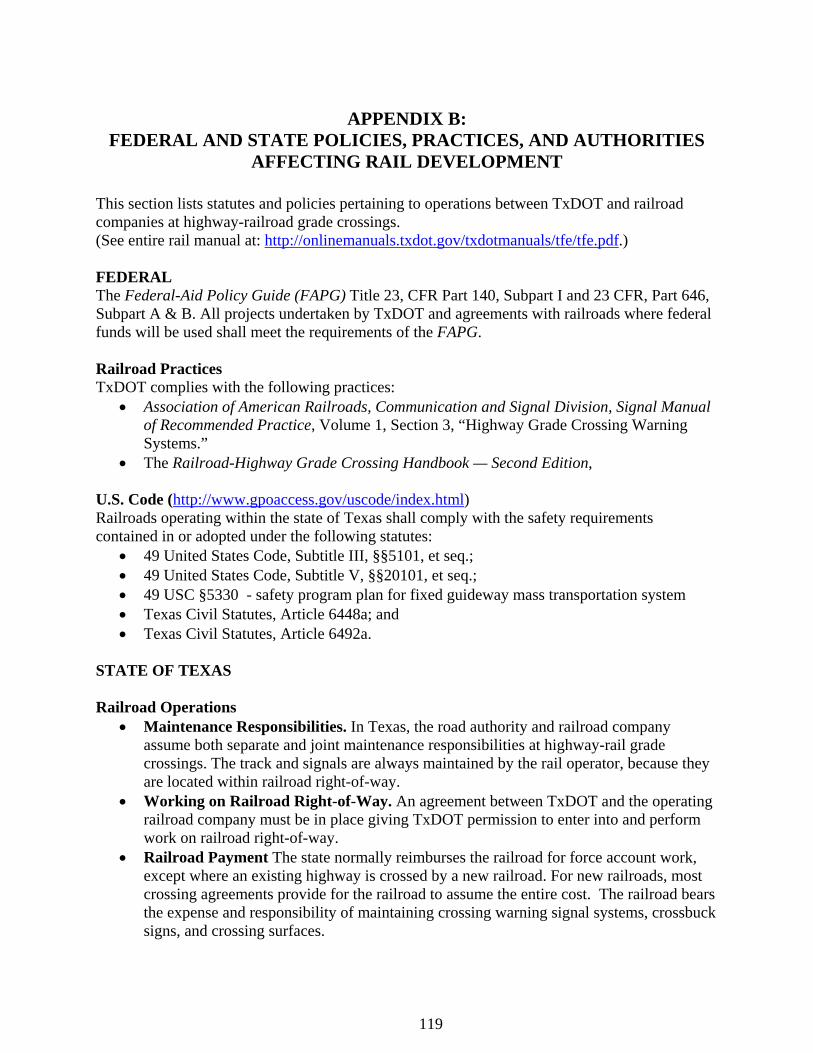
113
APPENDIX B: FEDERAL AND STATE POLICIES, PRACTICES, AND AUTHORITIES
AFFECTING RAIL DEVELOPMENT This section lists statutes and policies pertaining to operations between TxDOT and railroad companies at highway-railroad grade crossings. (See entire rail manual at: http://onlinemanuals.txdot.gov/txdotmanuals/tfe/tfe.pdf.) FEDERAL The Federal-Aid Policy Guide (FAPG) Title 23, CFR Part 140, Subpart I and 23 CFR, Part 646, Subpart A & B. All projects undertaken by TxDOT and agreements with railroads where federal funds will be used shall meet the requirements of the FAPG. Railroad Practices TxDOT complies with the following practices:
• Association of American Railroads, Communication and Signal Division, Signal Manual of Recommended Practice, Volume 1, Section 3, “Highway Grade Crossing Warning Systems.”
• The Railroad-Highway Grade Crossing Handbook — Second Edition, U.S. Code (http://www.gpoaccess.gov/uscode/index.html) Railroads operating within the state of Texas shall comply with the safety requirements contained in or adopted under the following statutes:
• 49 United States Code, Subtitle III, §§5101, et seq.; • 49 United States Code, Subtitle V, §§20101, et seq.; • 49 USC §5330 - safety program plan for fixed guideway mass transportation system • Texas Civil Statutes, Article 6448a; and • Texas Civil Statutes, Article 6492a.
STATE OF TEXAS Railroad Operations
• Maintenance Responsibilities. In Texas, the road authority and railroad company assume both separate and joint maintenance responsibilities at highway-rail grade crossings. The track and signals are always maintained by the rail operator, because they are located within railroad right-of-way.
• Working on Railroad Right-of-Way. An agreement between TxDOT and the operating railroad company must be in place giving TxDOT permission to enter into and perform work on railroad right-of-way.
• Railroad Payment The state normally reimburses the railroad for force account work, except where an existing highway is crossed by a new railroad. For new railroads, most crossing agreements provide for the railroad to assume the entire cost. The railroad bears the expense and responsibility of maintaining crossing warning signal systems, crossbuck signs, and crossing surfaces.
119
114
Texas Policies The following policy instruments pertain to railroad grade crossings:
• Texas Transportation Commission Minute Order No. 74227, dated March 27, 1978. Re-authorized the annual state funded grade crossing protection program.
• Texas Transportation Commission Minute Order No. 106784, dated March 28, 1996. Authorized use of federal railroad signal program funds to make roadway and operational improvements.
• Texas Transportation Commission Minute Order No. 107279, dated September 25, 1997. Established goals for TxDOT’s railroad safety program and all projects involving the upgrade of highway-rail intersections.
• The Texas Manual on Uniform Traffic Control Devices (TMUTCD). Applicable portions include (but are not limited to) Part VIII, “Grade Crossings.”
Texas Attorney General Opinions The following Texas Attorney General opinions pertain to railroad grade crossings:
• Texas Attorney General Opinion No. M-525. Re: Authority of TxDOT to make expenditures request to qualify for projects under 23 U.S.C. Section 405, dated February 13, 1976.
• Texas Attorney General Opinion No. M-108. Re: Validity of appropriation to TxDOT to construct and maintain railroad protective devices, dated July 24, 1967.
Texas Governing Statutes (excerpts from TxDOT Rail manual) Also see Texas Statutes: http://tlo2.tlc.state.tx.us/statutes/index.htm
• Art. 6320, V.T.C.S. Streams of Water. RR pays for crossing roadways • Art. 6327, V.T.C.S. Crossings of Public Roads. TxDOT pays to cross RR • Transportation Code, Section 471.002: “Signs at Cross-roads.” RR erect a signs • Transportation Code, Section 471.004: “Warning Sign Visibility at Railroad Grade
Crossings.” Requires TxDOT to reflectorized signs • Transportation Code, Section 471.005: “Dismantling of Railroad Grade Crossing
Warning Signals Located on an Active Rail Line.” Requires short line RR operators to obtain a permit from the responsible road authority.
• Transportation Code, Section 545.252. Gives TxDOT and local governments specific statutory authority to place traffic control devices at grade crossings on the roads they maintain, but no duty or minimum standards are imposed.
• Transportation Code, Section 471.003: “Telephone Service to Report Malfunctions of Mechanical Safety Devices at Crossings.” Requires TxDOT to furnish and install railroad signal malfunction signs providing the telephone number.
120
115
Texas Statutes The following Texas statutes relate to rail development and operations. For detail, go to : http://tlo2.tlc.state.tx.us/statutes/index.htm. TITLE 5. RAILROADS
CHAPTER 91. RAIL FACILITIES CHAPTER 171. FREIGHT RAIL DISTRICTS
SECTION 171.002. APPLICABILITY OF RURAL RAIL TRANSPORTATION DISTRICTS LAW SECTION 171.051. APPLICABILITY TO CERTAIN COUNTIES SECTION 171.052. CREATION BY COUNTIES AND MUNICIPALITIES SECTION 171.053. INTERMUNICIPAL COMMUTER RAIL DISTRICT POWERS
CHAPTER 471. RAILROAD AND ROADWAY CROSSINGS CHAPTER 317. ELIMINATION OF GRADE-LEVEL STREET CROSSINGS BY RAILROAD LINES IN MUNICIPALITIES WITH POPULATION OF MORE THAN 100,000
ARTICLE 4008b. STREET RAILWAYS TITLE 6. ROADWAYS
CHAPTER 452. REGIONAL TRANSPORTATION AUTHORITIES SECTION 452.064. LIGHT RAIL SYSTEM: REGULATORY EXEMPTION SECTION 452.065. ELECTRIC POWER FOR RAIL SYSTEM: CERTAIN AUTHORITIES
CHAPTER 455. GENERAL POWERS AND DUTIES OF DEPARTMENT OF TRANSPORTATION REGARDING MASS TRANSPORTATION
SECTION 455.005. RAIL FIXED GUIDEWAY MASS TRANSPORTATION SYSTEM SAFETY OVERSIGHT
TITLE 112. RAILROADS CHAPTER 1. CHARTER AND AMENDMENTS CHAPTER 6. RIGHT OF WAY CHAPTER 7. OTHER RIGHTS OF RAILROAD CORPORATIONS CHAPTER 8. RESTRICTIONS, DUTIES AND LIABILITIES CHAPTER 9. COLLECTION OF DEBTS AND RIGHTS OF EMPLOYEES CHAPTER 10. LIABILITY FOR INJURIES TO EMPLOYEES CHAPTER 11. RAILROAD COMMISSION OF TEXAS CHAPTER 13. MISCELLANEOUS RAILROADS CHAPTER 15. VIADUCTS CHAPTER 451. METROPOLITAN RAPID TRANSIT AUTHORITIES CHAPTER 452. REGIONAL TRANSPORTATION AUTHORITIES CHAPTER 453. MUNICIPAL TRANSIT DEPARTMENTS CHAPTER 454. MUNICIPAL MASS TRANSPORTATION SYSTEMS CHAPTER 456. STATE FINANCING OF PUBLIC TRANSPORTATION CHAPTER 457. COUNTY MASS TRANSIT AUTHORITY CHAPTER 458. RURAL AND URBAN TRANSIT DISTRICTS CHAPTER 460. COORDINATED COUNTY TRANSPORTATION AUTHORITIES CHAPTER 471. RAILROAD AND ROADWAY CROSSINGS
121

116
Texas Administrative Code (For agency Rules: http://www.sos.state.tx.us/tac/index.shtml) Title 43 TAC, Transportation Part 1
Chapter 7, Rail Facilities Subchapter A General Provisions Subchapter B Contracts Subchapter C Abandoned Rail Subchapter D Rail Safety
Chapter 31, Public Transportation Subchapter F – Rail Guideway System State Safety Oversight Program RAIL SAFETY Federal Rail Safety Both the Federal Railroad Administration (FRA) and the Research and Special Programs Administration (RSPA) of the U.S. Department of Transportation (DOT) have established federal regulations pertaining to rail safety. These rules set standards that must be observed by all railroads dealing with the interchange of railroad cars and equipment and all passenger-carrying railroads (excluding light-rail facilities). The state’s rules on rail safety are under the jurisdiction TxDOT. The passage of the 1970 Federal Railroad Safety Act includes:
• broad regulatory authority to address all areas of railroad safety; • strong emphasis on national uniformity of safety standards; • effective sanctions, including the ability to address emergency situations; and • state participation in enforcement of National standards.
Texas Railroad Safety The Texas Railroad Safety program began in 1983. The rail safety program is primarily concerned with the enforcement of state and federal rail safety standards for track, locomotives, freight cars, signal and train controls, operating practices of employees, and the transportation of hazardous materials. Rail Line Abandonment The adoption of the Stagger’s Rail Act in the early 1980s allows railroads to more easily either sell marginal routes to short line operators or petition for abandonment. The NETEX RRTD purchased the Cotton Belt rail line between Wylie and Greenville, northwest of Dallas corridor with funds appropriated by the 77th Texas Legislature through TxDOT to prevent the loss of the right of way. See: 43 TAC Chapter 7, Subchapter C – Abandoned Rail, and Transportation Code, Chapter 91, which authorizes the department to acquire abandoned rail facilities.
122
117
Rural Rail Transportation Districts The Texas Legislature passed legislation allowing the formation of Rural Rail Transportation Districts (RRTDs). RRTDs were given the power of eminent domain as well as the authority to issue bonds to assist in their efforts to preserve rail infrastructure and promote economic development in the state. RRTDs are formed by action of one or more county commissioner’s courts under rules outlined in Vernon’s Texas Civil Statutes Title 112, Chapter 13, Article 6650c.
123

124
119
APPENDIX C: OUTLINE OF COMMUNICATIONS BROCHURE
The following assumes a six-sided communications piece. PAGE 1 Catch interest with title “Working on the Rail & Road.” Photo of TRE. Smaller subtitle: What can rail do to move Texans? PAGE 2 Header: Transportation Benefits of Rail. Text: Discuss general concept of rail benefits: increase person-carrying capacity of corridor. Quote transportation benefits: • Rail attracts people out of cars: 85% of DART rail riders are “by choice” – North
Central LRT Extension Before and After Study,” DART, 2006; • Rail mitigates roadway congestion: Cities with significant rail systems have a slower
rate of per capita congestion growth than cities with small rail or no rail - “Rail Transit in America: A Comprehensive Evaluation of Benefits,” Victoria Transport Policy Institute, 2006; and
• Rail is safe: Table of accident rate per capita, by mode. PAGE 3 Header: Social Benefits of Rail. Text: Discuss general concept: increased access to transit frees up family budgets. Quote social benefits: • Even with gas prices coming down, Dallas commuters can save an estimated $8233
annually by riding transit – American Public Transportation Association, Transit News, November 6, 2008; and
• Transit provides basic mobility to people who are unable to drive – because they lack a car, have health concerns, are too young, or cannot afford a vehicle.
Picture of person in wheelchair boarding bus.
125
120
PAGE 4 Header: Economic Benefits of Rail. Text: Discuss general concept: Rail supports development, economic opportunity, and creating livable communities. Quote economic benefits: • Rail can increase nearby property values – Between 1997 and 2001, the median value
of residential properties in the light rail study area increased 32.1%; the property valued in the control group rose 19.5% - “An Assessment of DART LRT on Taxable Property Valuations and Transit Oriented Development,” Center of Economic Development and Research, University of North Texas, 2002.
• Commuter rail impacts commercial property value - Proximity to a downtown Coaster station was positively reflected in commercial property premiums (91.1%) - “Effects of Light and Commuter Rail on Land Prices: Experiences in San Diego County,” Journal of Transportation Research Forum, 2004.
• Rail promoted transit-oriented development (TOD) - More than $127 million yearly in state and local tax revenue will potentially be raised by DART Rail TOD projects. – Center of Economic Development and Research, 2002
PAGE 5 Header: How Other DOTs Help. Series of short sentences and photos for different systems: Caltrans (California) manages and finances operation of two intercity rail lines and helps finance the operation of a third line. Florida DOT provides local match funds for rail projects statewide that are consistent with local and regional transportation investment objectives. Georgia DOT is developing a commuter rail line in the Atlanta metropolitan region. Minnesota DOT is a catalyst in planning and funding commuter rail in the Minneapolis-St. Paul region.
126

121
PAGE 6 For more information see: TRANSPORTATION, SOCIAL AND FINANCIAL IMPACTS OF LIGHT AND COMMUTER RAIL Jeffrey C. Arndt, Curtis Morgan, John H. Overman, Terry L. Clower, Ph.D., Michael Seman, M.S. and Bernard L. Weinstein, Ph.D. URL: http://tti.tamu.edu/documents/0-5652-1.pdf
127

128