Embed Size (px)
Citation preview

U.S. Department of Transportation Bureau of Transportation Statistics
Oklahoma�����
TTrraannssppoorrttaattiioonnPPrrooffiillee


Acknowledgments
U.S. Department ofTransportationNorman Y. MinetaSecretary
Michael P. JacksonDeputy Secretary
Bureau ofTransportation StatisticsRick KowalewskiDeputy Director
Susan J. LaphamAssociate Director forStatistical Programs
William J. ChangAssociate Director forInformation Technology
John V. WellsChief Economist
Wendell FletcherAssistant Director forTransportation Analysis
Project ManagerRon Duych
Major ContributorsMartha CourtneyDerald DudleyDarcy HermanPamela LaFontaineMatt SheppardLorisa Smith
Other ContributorsAlpha GlassSteve LewisChip Moore
Bureau of Transportation Statistics
Our mission: To lead in developing transportation data andinformation of high quality and to advance their effective use inboth public and private transportation decisionmaking.
Our vision for the future: Data and information of high qualitysupporting every significant transportation policy decision, thusadvancing the quality of life and the economic well-being of allAmericans.
To obtain this and other BTS publications:Internet: www.bts.govPhone: 202/366-DATA [press 1]Fax: 202/366-3640
Mail: Product OrdersBureau of Transportation StatisticsU.S. Department of Transportation400 7th Street, SW, Room 7412Washington, DC 20590
Your comments for improving State Transportation Profilereports are welcome.Contact the BTS Information Service:E-mail: [email protected]: 800/853-1351
Data Collection andProduction—BattelleWilliam MallettMary FieldAlexa GettingLeonard HughesDavid KallMelody LiuLaurie Scovell


Oklahoma Fast Facts 2000
Transportation System ExtentAll public roads: 112,634 miles
Interstate: 930 miles
Road bridges: 22,726
Class I railroad trackage: 2,645 miles
Inland waterways: 150 miles
Public use airports: 143 (8 certificated forair carrier operations)1
Vehicles and ConveyancesAutomobiles registered: 1.6 million
Light trucks registered: 1.2 million
Heavy trucks registered: 13,000
Buses registered: 17,000
Motorcycles registered: 58,000
Numbered boats: 231,000
GeographicLand area: 68,667 sq. miles (rank: 19)
Percent of land area owned by federalgovernment: 3.04 (rank: 34)
Persons per square mile: 50.3 (rank: 35)
Highest point: Black Mesa (4,973 ft.)
Lowest point: Little River (289 ft.)
12002219903199741999
Political SubdivisionsCounties: 77
Municipal governments: 5923
Congressional districts: 5
DemographicPopulation: 3,450,654 (rank: 27)
Percent urban population: 682 (rank: 28)
SocioeconomicGross state product: $86 billion4 (rank: 29)
Civilian labor force: 1.6 million4 (rank: 29)Median household income: $32,445
(rank: 45)
Commuting (percent of workers)Car, truck, or van—drove alone: 81.8
Car, truck, or van—carpooled: 11.0
Public transportation (including taxi): 0.5
Walked: 2.1
Other means: 1.7
Worked at home: 2.9
State Transportation DepartmentOklahoma Department of Transportation
(ODOT)
200 North East 21st Street
Oklahoma City, OK 73105
(405) 522-6000
http://www.okladot.state.ok.us/

vi
The Bureau of Transportation Statistics (BTS) presents a profile of
transportation in Oklahoma—part of a series covering the 50 statesand the District of Columbia. This collection of transportationinformation from BTS, other federal government agencies, and othernational sources provides a picture of the state’s infrastructure, freightmovement and passenger travel, safety, vehicles, economy andfinance, and energy and environment.
All tables do not necessarily appear in every state profile report due togeographic and other characteristics. For example, border-crossing dataare given only for states bordering Canada and Mexico. Data source andaccuracy profiles are provided at the end of the report.
vii
Table of ContentsA InfrastructureTABLES PAGE
Oklahoma Public Road Length, Miles by Functional System: 1995-2000................ A-1Oklahoma Public Road Length, Miles by Ownership: 2000...................................... A-1Oklahoma Toll Roads: 2001....................................................................................... A-2Oklahoma Road Condition by Functional System – Rural: 1995-2000..................... A-3Oklahoma Road Condition by Functional System – Urban: 1995-2000.................... A-4Highway Bridge Condition: 2001 .............................................................................. A-5Characteristics of Directly Operated Motor Bus Transit in Oklahoma: 2000............ A-7Civil and Joint-Use Airports, Heliports, STOLports, and Seaplane Bases
in Oklahoma: 2002........................................................................................ A-8Oklahoma Commercial Service Airport Enplanements: 2000 ................................... A-9Freight Railroads in Oklahoma and the United States: 2000 ................................... A-10Freight Railroads Operating in Oklahoma by Class: 2000....................................... A-11Oklahoma Water Ports Ranked in Top 150 U.S. Ports by Tonnage: 2000 .............. A-12Inland Waterway Mileage: 2000 .............................................................................. A-12
FIGURESRural Road Conditions in Oklahoma: 2000 ............................................................... A-3Urban Road Conditions in Oklahoma: 2000 .............................................................. A-4Highway Bridge Condition in Oklahoma and the United States: 1996-2001 ............ A-6
B SafetyTABLES
Highway Traffic Fatalities and Fatality Rates: 2000...................................................B-1Passenger Car Occupants Killed and Restraint Use: 2000..........................................B-2Key Provisions of Safety Belt Use Laws: 2000 ..........................................................B-3Shoulder Belt Use: 2000..............................................................................................B-4Pedestrian Fatalities Involving Motor Vehicles: 2000 ................................................B-5Motor Vehicle Fatalities Involving High Blood Alcohol Concentration:
1995 and 2000................................................................................................B-6Impaired Driving Laws: 2000 .....................................................................................B-7Maximum Posted Speed Limits by System: 2001.......................................................B-8Total Rail Accidents/Incidents: 2000 ..........................................................................B-9Highway-Rail Grade Crossing Incidents: 2000.........................................................B-10Highway-Rail Grade Crossings by Type: 2000 ........................................................B-11Warning Devices at Public Highway-Rail Grade Crossings: 2000...........................B-11Types of People Injured in Oklahoma Train Accidents/Incidents: 2000 ..................B-12Oklahoma Transit Safety Data: 2000 ........................................................................B-13U.S. Transit Safety Data: 2000..................................................................................B-13Recreational Boating Accidents: 2000 ......................................................................B-14

PAGE
viii
Alcohol Involvement in Recreational Boating Accidents: 1999 and 2000 ...............B-15Hazardous Materials Incidents: 2000 ........................................................................B-16Oklahoma Hazardous Materials Incidents by Mode: 2000 .......................................B-17Natural Gas Distribution Pipeline Incidents: 1995-2000 ..........................................B-18Natural Gas Transmission Pipeline Incidents: 1995-2000 ........................................B-18Hazardous Liquid Pipeline Incidents: 1995-2000 .....................................................B-19
FIGURESShoulder Belt Use: 1998-2000 ....................................................................................B-4Oklahoma Train Accidents: 1995-2000 ......................................................................B-9Oklahoma Highway-Rail Grade Crossing Fatalities and Injuries: 1995-2000..........B-10Railroad Trespasser Deaths and Injuries in Oklahoma: 1995-2000..........................B-12Oklahoma Recreational Boating Accidents: 1995-2000 ...........................................B-14Oklahoma Recreational Boating Accidents Involving Alcohol: 1996-2000.............B-15Oklahoma Hazardous Materials Incidents: 1995-2000 .............................................B-16Oklahoma Hazardous Materials Incidents by Mode: 1995-2000..............................B-17
C Freight TransportationTABLES
Domestic Shipments to Oklahoma by State: 1997......................................................C-1Domestic Shipments from Oklahoma by State: 1997 .................................................C-2Shipments Originating in Oklahoma by Mode of Transportation: 1997.....................C-3Domestic Shipments from Oklahoma by Truck: 1997................................................C-4Domestic Shipments to Oklahoma by Truck: 1997 ....................................................C-4Truck Shipments from Oklahoma by Commodity: 1997............................................C-7Rail Shipments Terminating in Oklahoma: 1999 and 2000 ........................................C-8Rail Shipments Originating in Oklahoma: 1999 and 2000 .........................................C-8Foreign and Domestic Waterborne Shipments Originating in Oklahoma
by Destination: 2000 ....................................................................................C-11Foreign and Domestic Waterborne Shipments to Oklahoma by Origin: 2000 .........C-11Foreign and Domestic Waterborne Shipments Originating in Oklahoma
by Commodity: 2000 ...................................................................................C-12Domestic Waterborne Shipments Originating in Oklahoma by Commodity:
2000..............................................................................................................C-12Foreign and Domestic Waterborne Shipments to Oklahoma
by Commodity: 2000.....................................................................................C-13Domestic Waterborne Shipments to Oklahoma by Commodity: 2000.....................C-13Scheduled and Nonscheduled Air Freight and Mail Enplaned: 2000 .......................C-14Surface Merchandise Trade with Canada and Mexico: 2000....................................C-15
FIGURESOklahoma Surface Merchandise Trade with Canada and Mexico: 1997-2000.........C-15Truck and Rail Imports from Mexico to Oklahoma by Weight: 1997-2000.............C-16Truck and Rail Imports from Canada to Oklahoma by Weight: 1997-2000.............C-16

PAGE
ix
MAPSOklahoma Network Truck Flows: 1998......................................................................C-5Oklahoma Total Rail Flows: 1998 ..............................................................................C-9
D Passenger TravelTABLES
Commuting to Work: 2000 ........................................................................................ D-1Licensed Drivers: 2000 .............................................................................................. D-1Urban Transit Agencies in Oklahoma: 2000.............................................................. D-2
FIGURESLicensed Drivers in Oklahoma by Age and Sex: 2000 .............................................. D-1Overseas Visitors to Oklahoma: 1995-2000 .............................................................. D-3
E Registered Vehicles and Vehicle-Miles TraveledTABLES
Oklahoma and U.S. Motor-Vehicle Registrations: 2000 ............................................E-1Oklahoma and U.S. Trailer and Semi-Trailer Registrations: 2000 .............................E-1Oklahoma Truck Characteristics and Use: 1997.........................................................E-2Highway Vehicle-Miles Traveled (VMT): 2000.........................................................E-3Highway, Demographic, and Geographic Characteristics of Urbanized Areas
in Oklahoma: 2000.........................................................................................E-4Oklahoma and U.S. Recreational Boat Registrations by Propulsion Type:
1999 and 2000................................................................................................E-5General Aviation and Air Taxi Aircraft and Hours Flown: 2000 ...............................E-6Active Aviation Pilots and Flight Instructors: 2000....................................................E-7
FIGURESHighway Vehicle-Miles Traveled, United States and Oklahoma: 1995-2000 ...........E-3Oklahoma Recreational Boat Registrations: 1996-2000 .............................................E-5
F Economy and FinanceTABLES
Transportation and Warehousing Establishments and Employmentin Oklahoma: 1999.........................................................................................F-1
Transportation and Warehousing Establishments and Employmentin the United States: 1999 ..............................................................................F-1
Transportation Revenues Collected by State and Local Governmentsin Oklahoma: 1995-1999 ...............................................................................F-2
Transportation Expenditures by State and Local Government in Oklahoma:1995-1999 ......................................................................................................F-2
State Motor-Fuel Tax Rates: 2000 ..............................................................................F-3

PAGE
x
G Energy and EnvironmentTABLES
Transportation Energy Consumption: 1999 ............................................................... G-1Energy Consumption by End-Use Sector: 1999......................................................... G-2Transportation Energy Consumption per Capita: 1999.............................................. G-5Oklahoma and U.S. Motor-Fuel Use: 2000................................................................ G-6Highway Noise Barriers: 1999 ................................................................................... G-7
FIGURESEnergy Consumption by End-Use Sector: 1999......................................................... G-3Oklahoma Transportation Energy Consumption: 1995-1999 .................................... G-4
H Information on Data Sources....................................................... H-1
I Glossary ......................................................................................................... I-1
Map: Oklahoma Major Transportation Facilities

A Infrastructure


Infrastructure
Total rural and urban 112,517 112,664 112,593 112,524 112,511 112,634
Rural 99,561 99,630 99,515 99,366 99,225 99,273Interstate 721 721 721 721 721 721Other principal arterial 2,367 2,367 2,367 2,366 2,366 2,372Minor arterial 2,747 2,750 2,749 2,750 2,750 2,749Major arterial 21,306 21,353 21,346 21,349 21,352 21,355Minor collector 3,065 3,055 3,057 3,054 3,038 3,038Local 69,355 69,384 69,275 69,126 68,998 69,038
Urban 12,956 13,034 13,078 13,158 13,286 13,361 Interstate 209 209 209 209 209 209 Other freeways and expressways 134 134 134 134 134 138 Other principal arterial 808 803 802 802 802 808 Minor arterial 1,910 1,919 1,920 1,921 1,928 1,924 Collector 978 982 983 984 982 988 Local 8,917 8,987 9,030 968 9,231 9,294
Total 3,322 27,940 81,372 112,634State highway agency 2,759 9,511 Z 12,270County Z 15,220 65,759 80,979Town, township, municipal 4 3,202 14,940 18,146Other jurisdiction1 559 Z 630 1,189Federal agency2 Z 7 43 50
Table 1-1: Oklahoma Public Road Length, Miles by Functional System
National Highway System
Other federal-aid
highwayNonfederal-aid highway
1999 20001995
Total
1996 1997 1998
KEY: Z = zero or less than 1 unit of measure.
SOURCE: U.S. Department of Transportation, Federal Highway Administration, Highway Statistics, Washington, DC: annual editions, table HM-14, available at http://www.fhwa.dot. gov/ohim/hs00/hm14.htm as of Feb. 1, 2002.
Table 1-2: Oklahoma Public Road Length, Miles by Ownership: 2000
SOURCE: U.S. Department of Transportation, Federal Highway Administration, Highway Statistics, Washington, DC: annual editions, table HM-20, available at http://www.fhwa.dot.gov/ohim/hs00/hm20.htm as of Feb. 1, 2002.
1 Includes state park, state toll, other state agency, other local agency, and roadways not identified by ownership.2 Roadways in federal parks, forests, and reservations that are not part of the state and local highway systems.
BTS State Transportation Profile A-1 Oklahoma

Infrastructure
Facility
Financing or operating authority Location
Toll collection direction
Electronic collection
systemInterstate
Turner Turnpike OKTA From Oklahoma City to Tulsa 86.0 Both ways Pike PassWill Rogers Turnpike OKTA From Tulsa to Missouri state line 88.5 Both ways Pike PassH.E. Bailey Turnpike OKTA From US Route 62 south of Oklahoma City to
US Route 27761.4 Both ways Pike Pass
H.E. Bailey Turnpike OKTA From US Route 277 south of Lawton to US Route 70
25.0 Both ways Pike Pass
Noninterstate Indian Nation Turnpike OKTA From Henryetta to Hugo 105.2 Both ways Pike PassMuskogee Turnpike OKTA From Tulsa to Interstate 40 near Webber Falls 53.1 Both ways Pike PassCimarron Turnpike OKTA From US Route 64 east of Enid to Tulsa 67.7 Both ways Pike PassKilpatrick Turnpike OKTA From Turner Turnpike and Interstate 35 to Lake
Hefner Parkway16.8 Both ways Pike Pass
Creek Turnpike OKTA From US Route 75 to US Route 64 (Tulsa) 12.4 Both ways Pike PassChickasaw Turnpike OKTA From State Highway 7 west of Sulphur to State
Highway 1, south of Ada27.1 Both ways Pike Pass
Cherokee Turnpike OKTA From US Route 412 at Locust Grove to US Route 412 west of West Siloam Springs
32.8 Both ways Pike Pass
KEY: OKTA = Oklahoma Turnpike Authority.
SOURCE: U.S. Department of Transportation, Federal Highway Administration, Toll Facilities in the United States: Bridges-Roads-Tunnels-Ferries, Washington, DC: June 2001, available at http://www.fhwa.dot.gov/ohim/tollpage.htm as of Feb. 18, 2002.
Table 1-3: Oklahoma Toll Roads: 2001
Length in miles
Oklahoma A-2 BTS State Transportation Profile

Infrastructure
(Miles)1995 1996 1997 1998 1999 2000
Interstate (total reported) 721 721 721 722 722 722 Very good 0 0 81 81 81 84 Good 226 226 351 351 339 339 Fair 237 237 146 147 162 148 Mediocre 222 222 119 119 116 127 Poor 36 36 24 24 24 24 Not reported 0 0 0 0 0 0
Other principal arterial (total reported) 2,367 2,367 2,366 2,366 2,365 2,372 Very good 13 13 37 52 39 42 Good 650 650 1,038 1,038 996 988 Fair 1,409 1,409 1,156 1,141 1,192 1,208 Mediocre 212 212 117 117 119 115 Poor 83 83 18 18 19 19 Not reported 0 0 0 0 0 0
Minor arterial (total reported) 2,747 2,750 2,749 2,749 2,749 2,748 Very good 0 0 6 185 3 3 Good 572 574 611 684 582 648 Fair 2,006 2,004 2,036 1,791 2,033 1,970 Mediocre 163 165 73 70 109 106 Poor 6 7 23 19 22 21 Not reported 0 0 0 0 0 0
Major collector (total reported) N N N N N 15,879 Very good N N N N N 0 Good N N N N N 1,949 Fair N N N N N 8,316 Mediocre N N N N N 2,082 Poor N N N N N 3,532 Not reported N N N N N N
KEY: N = data do not exist.
SOURCE FOR DATA ON THIS PAGE: U.S. Department of Transportation, Federal Highway Administration, Highway Statistics, Washington, DC: annual editions, tables HM-63 and HM-64, available at http://www.fhwa.dot.gov/ as of Feb. 1, 2002.
Table 1-4: Oklahoma Road Condition by Functional System -- Rural
NOTE FOR DATA ON THIS PAGE: Road condition is based on measured pavement roughness using the International Roughness Index (IRI). IRI is a measure of surface condition. A comprehensive measure of pavement condition would require data on other pavement distresses such as rutting, cracking, and faulting.
NOTE: In 2000, the Federal Highway Administration began reporting road condition for rural major collectors using the International Roughness Index, if available. In prior years, data were only available using the Present Serviceability Rating.
Figure 1-1: Rural Road Conditions in Oklahoma: 2000
12
2 0
4742
24
12
20
51
72
52
18
5 4
13
3
22
<1 <1<10
10
20
30
40
50
60
70
80
90
100
Interstate Other principal arterial Minor arterial Major collector
Very good Good Fair Mediocre Poor
Percent
BTS State Transportation Profile A-3 Oklahoma

Infrastructure
(Miles)1995 1996 1997 1998 1999 2000
Interstate (total reported) 209 209 207 208 209 209 Very good 1 1 3 3 3 3 Good 26 26 59 61 55 55 Fair 57 57 44 43 49 49 Mediocre 58 58 62 62 60 60 Poor 67 67 39 39 42 42 Not reported 0 0 0 0 0 0
Other freeways and expressways (total reported) 134 134 135 134 135 138 Very good 0 0 0 0 0 0 Good 25 25 44 44 44 48 Fair 80 80 71 70 71 70 Mediocre 22 23 17 17 17 17 Poor 6 6 3 3 3 3 Not reported 0 0 0 0 0 0
Other principal arterial (total reported) 807 802 800 801 797 798 Very good 0 0 1 3 0 0 Good 55 55 69 69 63 64 Fair 401 396 364 359 357 362 Mediocre 239 239 205 205 202 203 Poor 112 112 161 165 175 169 Not reported 1 1 1 1 5 11
Urban minor arterial (total reported) N N N N N 1,712 Very good N N N N N 0 Good N N N N N 43 Fair N N N N N 648 Mediocre N N N N N 499 Poor N N N N N 522 Not reported N N N N N 0
Urban collector (total reported) N N N N N 855 Very good N N N N N 0 Good N N N N N 6 Fair N N N N N 116 Mediocre N N N N N 158 Poor N N N N N 575 Not reported N N N N N N
KEY: N = data do not exist.
SOURCE FOR DATA ON THIS PAGE: U.S. Department of Transportation, Federal Highway Administration, Highway Statistics, Washington, DC: annual editions, tables HM-63 and HM-64, available at http://www.fhwa.dot.gov/ as of Feb. 1, 2002.
Table 1-5: Oklahoma Road Condition by Functional System -- Urban
NOTE FOR DATA ON THIS PAGE: Road condition is based on measured pavement roughness using the International Roughness Index (IRI). IRI is a measure of surface condition. A comprehensive measure of pavement condition would require data on other pavement distresses such as rutting, cracking, and faulting.
NOTE: In 2000, the Federal Highway Administration began reporting road condition for urban minor arterials and urban collectors using the International Roughness Index, if available. In prior years, data were only available using the Present Serviceability Rating.
Figure 1-2: Urban Road Conditions in Oklahoma: 2000
1 0 0 0 0
26
35
83
23
5145
38
14
29
12
2529
1820
2
21
30
67
<10
10
20
30
40
50
60
70
80
Interstate Other freeways andexpressways
Other principalarterial
Urban minor arterial Urban collector
Very good Good Fair Mediocre PoorPercent
Oklahoma A-4 BTS State Transportation Profile

Infrastructure
StateAlabama 15,641 2,677 2,245 4,922 31.5Alaska 1,433 169 243 412 28.8Arizona 6,918 194 541 735 10.6Arkansas 12,434 1,479 1,996 3,475 27.9California 23,770 2,636 4,204 6,840 28.8Colorado 8,082 596 847 1,443 17.9Connecticut 4,171 362 943 1,305 31.3Delaware 829 47 82 129 15.6District of Columbia 243 25 136 161 66.3Florida 11,303 300 1,814 2,114 18.7Georgia 14,394 1,578 1,924 3,502 24.3Hawaii 1,071 193 344 537 50.1Idaho 4,069 320 436 756 18.6Illinois 25,529 2,725 2,099 4,824 18.9Indiana 18,067 2,257 2,161 4,418 24.5Iowa 25,030 5,036 2,060 7,096 28.3Kansas 25,638 3,465 2,959 6,424 25.1Kentucky 13,442 1,189 2,864 4,053 30.2Louisiana 13,426 2,425 2,166 4,591 34.2Maine 2,367 354 512 866 36.6Maryland 4,957 436 1,010 1,446 29.2Massachusetts 4,986 696 1,792 2,488 49.9Michigan 10,631 2,012 1,354 3,366 31.7Minnesota 12,830 1,221 563 1,784 13.9Mississippi 16,825 3,694 1,308 5,002 29.7Missouri 23,604 6,083 2,747 8,830 37.4Montana 5,009 570 560 1,130 22.6Nebraska 15,493 2,676 1,661 4,337 28.0Nevada 1,510 67 154 221 14.6New Hampshire 2,354 387 415 802 34.1New Jersey 6,366 930 1,420 2,350 36.9New Mexico 3,790 348 355 703 18.5New York 17,378 2,406 4,182 6,588 37.9North Carolina 16,991 2,513 2,794 5,307 31.2North Dakota 4,517 871 266 1,137 25.2Ohio 27,952 3,304 3,862 7,166 25.6Oklahoma 22,708 7,605 1,518 9,123 40.2Oregon 7,309 362 1,291 1,653 22.6Pennsylvania 22,092 5,418 4,022 9,440 42.7Rhode Island 749 187 192 379 50.6South Carolina 9,064 1,187 869 2,056 22.7South Dakota 6,001 1,398 346 1,744 29.1Tennessee 19,362 1,761 2,940 4,701 24.3Texas 48,085 3,182 7,373 10,555 22.0Utah 2,743 389 245 634 23.1Vermont 2,714 452 503 955 35.2Virginia 12,789 1,222 2,243 3,465 27.1Washington 7,939 551 1,591 2,142 27.0West Virginia 6,767 1,172 1,495 2,667 39.4Wisconsin 13,516 1,862 795 2,657 19.7Wyoming 3,076 389 253 642 20.9United States 590,066 83,630 81,469 165,099 28.0
Table 1-6: Highway Bridge Condition: 2001
Structurally deficient
Functionally obsolete Total of bothAll bridges(number) (number) (percent)
SOURCE: U.S. Department of Transportation, Federal Highway Administration, National Bridge Inventory: Deficient Bridges by State and Highway System, Washington, DC: 2001, available at http://www.fhwa.dot.gov/bridge/britab.htm as of Jan. 31, 2002.
(number) (number)
BTS State Transportation Profile A-5 Oklahoma

Infrastructure
Figure 1-3: Highway Bridge Condition
SOURCE: U.S. Department of Transportation, Federal Highway Administration, National Bridge Inventory: Deficient Bridges by State and Highway System, Washington, DC: 2001, available at http://www.fhwa.dot. gov/bridge/britab.htm as of Jan. 31, 2002.
Oklahoma
33 35 35 33 34 33
77 7
7 6 7
0
5
10
15
20
25
30
35
40
45
50
1996 1997 1998 1999 2000 2001
Structurally deficient Functionally obsoletePercent
United States
17 17 16 15 15 14
14 13 14 14 14 14
0
5
10
15
20
25
30
35
40
1996 1997 1998 1999 2000 2001
Structurally deficient Functionally obsoletePercent
Oklahoma A-6 BTS State Transportation Profile
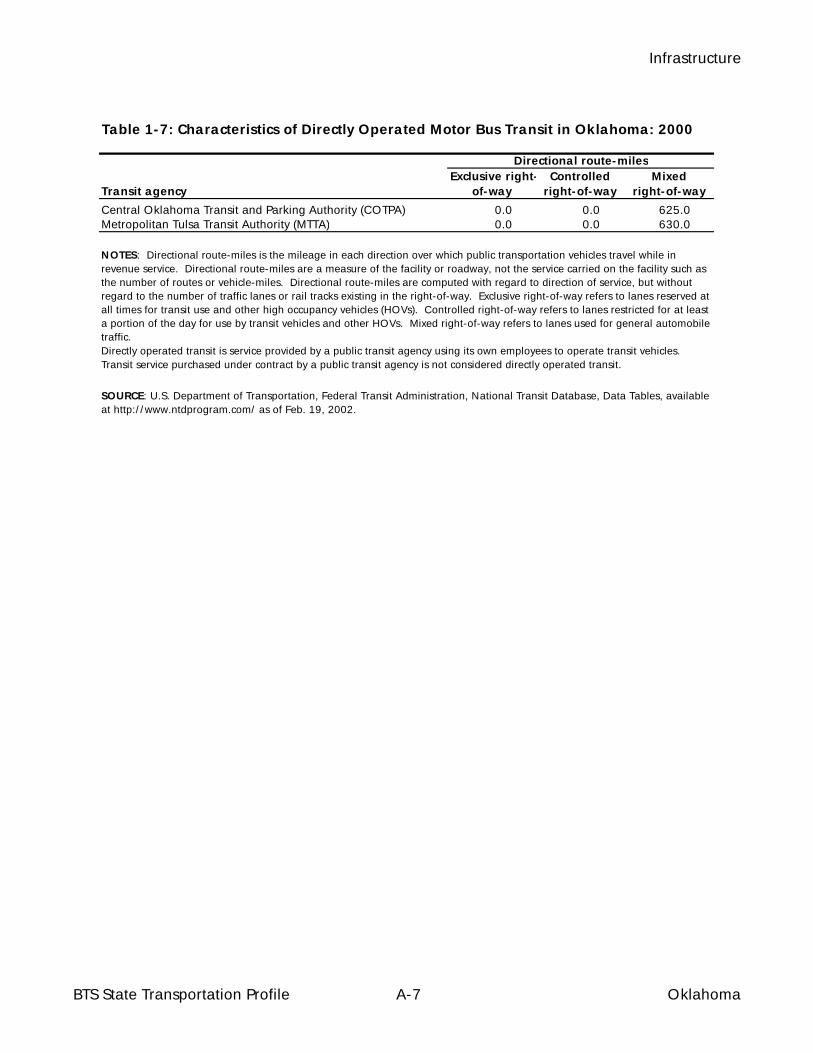
Infrastructure
Transit agency
Central Oklahoma Transit and Parking Authority (COTPA) 0.0 0.0 625.0Metropolitan Tulsa Transit Authority (MTTA) 0.0 0.0 630.0
Table 1-7: Characteristics of Directly Operated Motor Bus Transit in Oklahoma: 2000
SOURCE: U.S. Department of Transportation, Federal Transit Administration, National Transit Database, Data Tables, available at http://www.ntdprogram.com/ as of Feb. 19, 2002.
Directional route-milesExclusive right-
of-wayControlled
right-of-wayMixed
right-of-way
NOTES: Directional route-miles is the mileage in each direction over which public transportation vehicles travel while in revenue service. Directional route-miles are a measure of the facility or roadway, not the service carried on the facility such as the number of routes or vehicle-miles. Directional route-miles are computed with regard to direction of service, but without regard to the number of traffic lanes or rail tracks existing in the right-of-way. Exclusive right-of-way refers to lanes reserved at all times for transit use and other high occupancy vehicles (HOVs). Controlled right-of-way refers to lanes restricted for at least a portion of the day for use by transit vehicles and other HOVs. Mixed right-of-way refers to lanes used for general automobile traffic. Directly operated transit is service provided by a public transit agency using its own employees to operate transit vehicles. Transit service purchased under contract by a public transit agency is not considered directly operated transit.
BTS State Transportation Profile A-7 Oklahoma

Infrastructure
Ownership and usage
Publicly owned 124 36 0 0 160 Open to public 124 3 0 0 127 Closed to public 0 33 0 0 33
Privately owned 215 56 1 1 273 Open to public 19 2 0 1 22 Closed to public 196 54 1 0 251
Total 339 92 1 1 433
1 Data are current as of Jan. 31, 2002.
KEY: STOLport = Short take-off and landing airport.
SOURCE: U.S. Department of Transportation, Federal Aviation Administration, Office of Airports, Airport Safety Data Branch.
Table 1-8: Civil and Joint-Use Airports, Heliports, STOLports, and Seaplane Bases in Oklahoma: 20021
TotalAirportsSeaplane
basesHeliports STOLports
NOTE: Publicly owned facilities are open for public use with no prior authorization or permission. Publicly owned facilities closed to the public include medical, law enforcement, and other such facilities.
Oklahoma A-8 BTS State Transportation Profile

Infrastructure
(For airports with scheduled service and 2,500 or more passengers enplaned)
AirportWill Rogers World 1,737,898 901 40 330 1,739,169Tulsa International 1,673,276 64,198 26 172 1,737,672Lawton Fort Sill Regional 60,446 0 2 0 60,448Enid Woodring Municipal 0 3,785 445 0 4,230Ponca City Municipal 0 3,949 0 0 3,949
Table 1-9: Oklahoma Commercial Service Airport Enplanements: 2000
SOURCE: U.S. Department of Transportation, Federal Aviation Administration, Office of the Associate Administrator for Airports, CY 2000 Enplanement Activity at U.S. Commercial Service Airports , available at http://www.faa.gov/ arp/Planning/v3.htm as of Mar. 26, 2002.
Large certificated air
carriers
Commuter and small certificated
air carriers
Air taxi commuter operators
Foreign air carriers
Total enplanements
NOTE: Rank order by total enplaned passengers on air carriers of all types, including foreign air carriers.
BTS State Transportation Profile A-9 Oklahoma

Infrastructure
Type of railroadTotal 562 20 172,101 3,336 3,903 2.3
Class I 8 3 120,597 2,200 2,645 2.2Regional 35 1 20,978 78 78 0.4Local 304 11 21,512 759 868 4.0Switching and terminal 213 5 7,425 299 312 4.2Canadian1 2 0 1,589 0 0 0.0
NOTES:
Excluding trackage
rights
Including trackage
rights
2. A Regional Railroad is a non-Class I, line-haul railroad operating 350 or more miles of road or with revenues of at least $40 million or both.3. A Local Railroad is a railroad which is neither a Class I nor a Regional Railroad, and is engaged primarily in line-haul service.4. A Switching and Terminal Railroad is a non-Class I Railroad engaged primarily in switching and/or terminal services for other railroads.
SOURCE: Association of American Railroads, Railroads and States - 2000, Washington, DC: 2002, available at http://www.aar.org/AboutTheIndustry/StateInformation.asp as of Mar. 19, 2002.
1 Refers to non-Class I, Canadian-owned lines.2 Miles operated is in terms of railroad so that a mile of single track is counted the same as a mile of double track. Sidings, turnouts, yard switching mileage, and mileage not operated are excluded. Miles operated under trackage rights provided by another (owning) railroad are included.
1. As defined by the Surface Transportation Board in 2000, a Class I Railroad is a railroad with operating revenues of at least $261.9 million.
Table 1-10: Freight Railroads in Oklahoma and the United States: 2000
Number Miles operated2
United States Oklahoma
UnitedStates
Percent of U.S. total
of railroads Oklahoma
Oklahoma A-10 BTS State Transportation Profile

Infrastructure
Class I railroads 2,645Burlington Northern and Santa Fe Railway Co. 1,314Kansas City Southern Railway Co. 157Union Pacific Railroad Co. 1,174
Regional railroads 78
South Kansas and Oklahoma Railroad 78
Local railroads 868Arkansas and Missouri Railroad 0Arkansas and Oklahoma Railroad, Inc. 113AT and L Railroad 48De Queen and Eastern Railroad 54Grainbelt Corporation 228Hollis and Eastern Railroad 14Kiamichi Railroad Co. 216Sand Springs Railway Co. 32Southeast Kansas Railroad Co. 3Stillwater Central Railroad 137Tulsa-Sapulpa Union Railway Co. 23
Switching and terminal railroads 312Cimarron Valley Railroad 35Farmrail Corporation 184Northwestern Oklahoma Railroad 2Southwestern Railroad Co., Texas Division 9Wichita, Tillman and Jackson Railway Co. 82
Table 1-11: Freight Railroads Operating in Oklahoma by Class: 2000
SOURCE: Association of American Railroads, Railroads and States - 2000 , Washington, DC: 2002, available at http://www.aar.org/AboutTheIndustry /StateInformation.asp as of Mar. 19, 2002.
RailroadMiles operated in
Oklahoma1
1 Miles operated is in terms of railroad so that a mile of single track is counted the same as a mile of double track. Sidings, turnouts, yard switching mileage, and mileage not operated are excluded. Miles operated under trackage rights provided by another (owning) railroad are included.
NOTE: For definition of railroad types see previous table.
BTS State Transportation Profile A-11 Oklahoma

Infrastructure
PortTulsa, Port of Catoosa 123 1.9 Z 1.3
KEY: Z = zero or less than 1 unit of measurement.
Table 1-13: Inland Waterway Mileage: 2000(Includes 39 states and the District of Columbia)
StateAlabama 1,270 873Alaska 5,497 1,033Arkansas 1,860 318California 286 8Connecticut 117 360Delaware 99 394District of Columbia 7 1,152Florida 1,540 444Georgia 721 150Idaho 111 681Illinois 1,095 259Indiana 353 39Iowa 492 482Kansas 120 75Kentucky 1,591 946Louisiana 2,823 Texas 834Maine 73 674Maryland 532 1,057Massachusetts 90 682Minnesota 258 231
Virginia
Oregon
SOURCE: U.S. Army Corps of Engineers, Waterborne Commerce of the United States, Calendar Year 2000, Part 5 National Summaries, Alexandria, VA: 2001, available at http://www.wrsc.usace.army.mil/ndc/wcusnatl00.pdf as of Apr. 15, 2002.
Table 1-12: Oklahoma Water Ports Ranked in Top 150 U.S. Ports by Tonnage: 2000
Millions of short tonsU.S. rank Total Foreign Domestic
MississippiMissouri
North CarolinaOhio
NebraskaNew HampshireNew JerseyNew York
Oklahoma
PennsylvaniaRhode IslandSouth Carolina
SOURCE: U.S. Army Corps of Engineers, Navigation Data Center, National Waterway Network, January 2002.
NOTES: Waterway mileages were determined by including the length of channels 1) with a controlling draft of nine feet or greater, 2) with commercial cargo traffic reported for 1998 and 1999, but 3) were not offshore (i.e., channels in coastal areas included only the miles from the entrance channel inward). Channels within major bays are included (e.g., Chesapeake Bay, San Francisco Bay, Puget Sound, Long Island Sound, major sounds and straits in southeastern Alaska). Channels in the Great Lakes are not included, but waterways connecting lakes and the St. Lawrence Seaway inside the United States are included.
Wisconsin
State MilesMiles
South DakotaTennessee
WashingtonWest Virginia
Oklahoma A-12 BTS State Transportation Profile

B Safety


Safety
StateAlabama 995 3,521 4,015 56,534 28.3 24.8 1.8 Alaska 103 465 611 4,613 22.2 16.9 2.2 Arizona 1,036 3,434 3,960 49,768 30.2 26.2 2.1 Arkansas 652 1,948 1,865 29,167 33.5 35.0 2.2 California 3,753 21,244 28,146 306,649 17.7 13.3 1.2 Colorado 681 3,107 3,724 41,771 21.9 18.3 1.6 Connecticut 342 2,653 2,907 30,756 12.9 11.8 1.1 Delaware 123 557 641 8,240 22.1 19.2 1.5 District of Columbia 49 348 244 3,498 14.1 20.1 1.4 Florida 2,999 12,853 12,036 152,136 23.3 24.9 2.0 Georgia 1,541 5,550 7,243 105,010 27.8 21.3 1.5 Hawaii 131 769 758 8,543 17.0 17.3 1.5 Idaho 276 884 1,220 13,534 31.2 22.6 2.0 Illinois 1,418 7,961 9,168 102,866 17.8 15.5 1.4 Indiana 875 3,976 5,689 70,862 22.0 15.4 1.2 Iowa 445 1,953 3,233 29,433 22.8 13.8 1.5 Kansas 461 1,908 2,346 28,130 24.2 19.7 1.6 Kentucky 820 2,694 2,870 46,803 30.4 28.6 1.8 Louisiana 937 2,759 3,605 40,849 34.0 26.0 2.3 Maine 169 920 1,053 14,190 18.4 16.1 1.2 Maryland 588 3,382 3,897 50,174 17.4 15.1 1.2 Massachusetts 433 4,490 5,372 52,796 9.6 8.1 0.8 Michigan 1,382 6,925 8,619 97,792 20.0 16.0 1.4 Minnesota 625 2,941 4,773 52,601 21.3 13.1 1.2 Mississippi 949 2,008 2,321 35,536 47.3 40.9 2.7 Missouri 1,157 3,856 4,641 67,083 30.0 24.9 1.7 Montana 237 679 1,053 9,882 34.9 22.5 2.4 Nebraska 276 1,195 1,640 18,081 23.1 16.8 1.5 Nevada 323 1,371 1,245 17,639 23.6 25.9 1.8 New Hampshire 126 930 1,100 12,021 13.6 11.5 1.0 New Jersey 731 5,655 6,502 67,446 12.9 11.2 1.1 New Mexico 430 1,239 1,557 22,760 34.7 27.6 1.9 New York 1,458 10,871 10,342 129,057 13.4 14.1 1.1 North Carolina 1,472 5,690 6,305 89,504 25.9 23.3 1.6 North Dakota 86 459 711 7,217 18.7 12.1 1.2 Ohio 1,351 8,206 10,722 105,898 16.5 12.6 1.3 Oklahoma 652 2,295 3,072 43,355 28.4 21.2 1.5Oregon 451 2,495 3,091 35,010 18.1 14.6 1.3 Pennsylvania 1,520 8,229 9,476 102,337 18.5 16.0 1.5 Rhode Island 80 654 779 8,359 12.2 10.3 1.0 South Carolina 1,065 2,843 3,146 45,538 37.5 33.9 2.3 South Dakota 173 544 822 8,432 31.8 21.0 2.1 Tennessee 1,306 4,251 4,891 65,732 30.7 26.7 2.0 Texas 3,769 13,462 14,257 220,064 28.0 26.4 1.7 Utah 373 1,463 1,656 22,597 25.5 22.5 1.7 Vermont 79 506 537 6,811 15.6 14.7 1.2 Virginia 930 4,837 6,107 74,801 19.2 15.2 1.2 Washington 632 4,155 5,235 53,330 15.2 12.1 1.2 West Virginia 410 1,347 1,468 19,242 30.4 27.9 2.1 Wisconsin 799 3,770 4,545 57,266 21.2 17.6 1.4 Wyoming 152 371 605 8,090 41.0 25.1 1.9 United States 41,821 190,625 217,028 2,749,803 21.9 19.3 1.5
SOURCES: U.S. Department of Transportation, National Highway Traffic Safety Administration, Traffic Safety Facts 2000 , Washington, DC: 2001, available at http://www-nrd.nhtsa.dot.gov/pdf/nrd-30/NCSA/TSFAnn/TSF2000.pdf as of Jan. 4, 2002; U.S. Department of Transportation, Federal Highway Administration, Highway Statistics 2000 , Washington, DC: 2001, available at http://www.fhwa.dot.gov/ohim/ohimstat.htm as of Dec. 6, 2001.
Table 2-1: Highway Traffic Fatalities and Fatality Rates: 2000
Fatality rate per
Traffic fatalities
Licensed drivers
(thousands)
Registered vehicles
(thousands)
Vehicle-miles traveled (millions)
100 million vehicle-
miles traveled
100,000 licensed drivers
100,000 registered vehicles
BTS State Transportation Profile B-1 Oklahoma
Safety
StateAlabama 204 38.2 308 57.7 22 4.1 534 100.0Alaska 11 39.3 17 60.7 0 0.0 28 100.0Arizona 131 36.0 183 50.3 50 13.7 364 100.0Arkansas 95 32.3 160 54.4 39 13.3 294 100.0California 917 53.5 499 29.1 298 17.4 1,714 100.0Colorado 129 47.1 142 51.8 3 1.1 274 100.0Connecticut 69 38.1 90 49.7 22 12.2 181 100.0Delaware 20 29.0 47 68.1 2 2.9 69 100.0District of Columbia 4 22.2 7 38.9 7 38.9 18 100.0Florida 523 37.7 836 60.3 27 1.9 1,386 100.0Georgia 337 42.9 351 44.7 98 12.5 786 100.0Hawaii 23 37.7 29 47.5 9 14.8 61 100.0Idaho 42 35.9 69 59.0 6 5.1 117 100.0Illinois 234 34.3 311 45.6 137 20.1 682 100.0Indiana 203 43.0 222 47.0 47 10.0 472 100.0Iowa 107 41.6 98 38.1 52 20.2 257 100.0Kansas 77 33.2 127 54.7 28 12.1 232 100.0Kentucky 156 36.3 269 62.6 5 1.2 430 100.0Louisiana 127 30.1 232 55.0 63 14.9 422 100.0Maine 37 36.6 58 57.4 6 5.9 101 100.0Maryland 167 55.3 117 38.7 18 6.0 302 100.0Massachusetts 63 25.9 128 52.7 52 21.4 243 100.0Michigan 364 51.3 260 36.6 86 12.1 710 100.0Minnesota 129 37.5 174 50.6 41 11.9 344 100.0Mississippi 144 28.3 354 69.5 11 2.2 509 100.0Missouri 198 33.4 326 55.0 69 11.6 593 100.0Montana 38 37.3 56 54.9 8 7.8 102 100.0Nebraska 35 27.1 76 58.9 18 14.0 129 100.0Nevada 52 38.2 81 59.6 3 2.2 136 100.0New Hampshire 13 21.0 43 69.4 6 9.7 62 100.0New Jersey 161 42.4 197 51.8 22 5.8 380 100.0New Mexico 72 41.9 90 52.3 10 5.8 172 100.0New York 360 50.8 290 40.9 59 8.3 709 100.0North Carolina 369 45.0 354 43.2 97 11.8 820 100.0North Dakota 8 19.0 33 78.6 1 2.4 42 100.0Ohio 319 41.5 396 51.6 53 6.9 768 100.0Oklahoma 128 40.4 187 59.0 2 0.6 317 100.0Oregon 147 67.1 60 27.4 12 5.5 219 100.0Pennsylvania 265 31.7 443 53.1 127 15.2 835 100.0Rhode Island 8 18.6 33 76.7 2 4.7 43 100.0South Carolina 158 38.3 246 59.7 8 1.9 412 100.0South Dakota 11 15.3 58 80.6 3 4.2 72 100.0Tennessee 207 28.6 479 66.1 39 5.4 725 100.0Texas 914 54.7 723 43.2 35 2.1 1,672 100.0Utah 66 39.3 97 57.7 5 3.0 168 100.0Vermont 23 57.5 15 37.5 2 5.0 40 100.0Virginia 199 40.4 264 53.7 29 5.9 492 100.0Washington 153 44.5 185 53.8 6 1.7 344 100.0West Virginia 71 31.1 151 66.2 6 2.6 228 100.0Wisconsin 161 37.3 231 53.5 40 9.3 432 100.0Wyoming 23 46.0 27 54.0 0 0.0 50 100.0United States 8,472 41.3 10,229 49.9 1,791 8.7 20,492 100.0
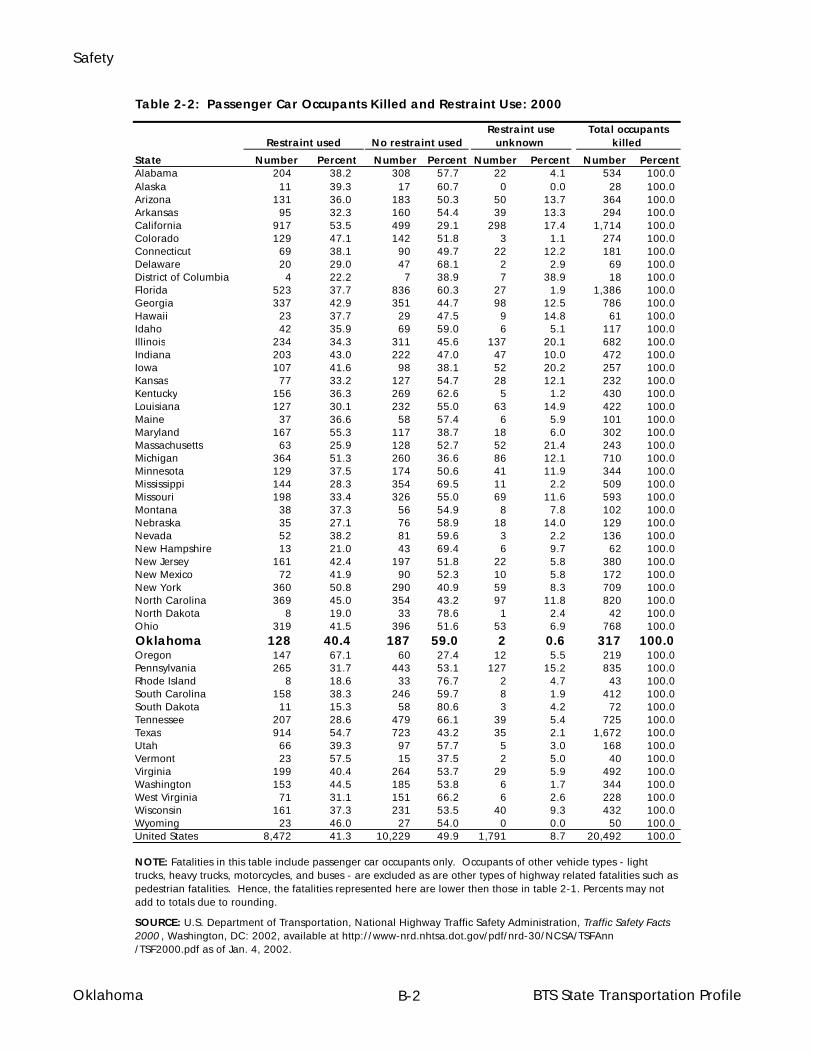
Table 2-2: Passenger Car Occupants Killed and Restraint Use: 2000
Percent Number Percent
Restraint use unknown
Total occupants killedRestraint used No restraint used
SOURCE: U.S. Department of Transportation, National Highway Traffic Safety Administration, Traffic Safety Facts 2000 , Washington, DC: 2002, available at http://www-nrd.nhtsa.dot.gov/pdf/nrd-30/NCSA/TSFAnn /TSF2000.pdf as of Jan. 4, 2002.
Number Percent Number Percent Number
NOTE: Fatalities in this table include passenger car occupants only. Occupants of other vehicle types - light trucks, heavy trucks, motorcycles, and buses - are excluded as are other types of highway related fatalities such as pedestrian fatalities. Hence, the fatalities represented here are lower then those in table 2-1. Percents may not add to totals due to rounding.
Oklahoma B-2 BTS State Transportation Profile

Safety
State Vehicles exempted3
Alabama 7/18/92 Primary $25 Front Designed for more than 10 passengersAlaska 9/12/90 Secondary $15 All School busArizona 1/1/91 Secondary $10 Front Designed for more than 10 passengers; model
year before 1972Arkansas 7/15/91 Secondary $25 4 Front School bus, church bus, public busCalifornia 1/1/86 Primary $20 5 All None
Colorado 7/1/87 Secondary $15 Front Passenger bus, school busConnecticut 1/1/86 Primary $15 Front Truck or bus over 15,000 lbs.Delaware 1/1/92 Secondary $20 Front NoneDistrict of Columbia 12/12/85 Primary $50 6 All Seating more than 8 peopleFlorida 7/1/86 Secondary $30 Front School bus, public bus, truck over 5,000 lbs.Georgia 9/1/88 Primary $15 Front Designed for more than 10 passengers, pickupHawaii 2/16/85 Primary $45 Front Bus or school bus over 10,000 lbs.Idaho 7/1/86 Secondary $5 Front Over 8,000 lbs.Illinois 7/1/85 Secondary $25 Front NoneIndiana 7/1/87 Primary $25 Front Truck, tractor, RVIowa 7/1/86 Primary $10 Front NoneKansas 7/1/86 Secondary $10 Front Designed for more than 10 people, truck over
12,000 lbs.Kentucky 7/13/94 Secondary $25 All Designed for more than 10 peopleLouisiana 7/1/86 Primary $25 7 Front Manufactured before 1/1/81Maine 12/27/95 Secondary $50 All NoneMaryland 7/1/86 Primary $25 Front Historic vehicleMassachusetts 2/1/94 Secondary $25 All Truck over 18,000 lbs., bus, taxiMichigan 7/1/85 Primary $25 Front BusMinnesota 8/1/86 Secondary $25 Front Farm pickup truckMississippi 3/20/90 Secondary $25 Front Farm vehicle, busMissouri 9/28/85 Secondary $10 Front Designed for more than 10 people, truck over
12,000 lbs.Montana 10/1/87 Secondary $20 All NoneNebraska 1/1/93 Secondary $25 Front Manufactured before 1973Nevada 7/1/87 Secondary $25 All Taxi, bus, school busNew Hampshire None NA NA NA NANew Jersey 3/1/85 Secondary $20 Front NoneNew Mexico 1/1/86 Primary $25 Front Vehicle over 10,000 lbs.New York 12/1/84 Primary $50 Front Bus, school bus, taxiNorth Carolina 10/1/85 Primary $25 Front Designed for more than 10 peopleNorth Dakota 7/14/94 Secondary $20 Front Designed for more than 10 peopleOhio 5/6/86 Secondary $25 Front NoneOklahoma 2/1/87 Primary $20 Front Farm vehicle, truck, truck tractor, RVOregon 12/7/90 Primary $75 All NonePennsylvania 11/23/87 Secondary $10 Front Truck over 7,000 lbs.Rhode Island 6/18/91 Secondary $50 All NoneSouth Carolina 7/1/89 Secondary $10 All School bus, public busSouth Dakota 1/1/95 Secondary $20 Front Bus, school busTennessee 4/21/86 Secondary $50 Front Vehicle over 8,500 lbs.Texas 9/1/85 Primary $50 Front Designed for more than 10 people, truck over
15,000 lbs.Utah 4/28/86 Secondary $45 Front Vehicle over 10,000 lbs., school/public bus, taxiVermont 1/1/94 Secondary $10 All Bus, taxiVirginia 1/1/88 Secondary $25 Front Designed for more than 10 people, taxiWashington 6/11/86 Secondary $35 All Designed for more than 10 peopleWest Virginia 9/1/93 Secondary $25 Front Designed for more than 10 peopleWisconsin 12/1/87 Secondary $10 All Taxi, farm truckWyoming 6/8/89 Secondary $25 Front Designed for more than 10 people, bus
Table 2-3. Key Provisions of Safety Belt Use Laws: 2000
1 Effective date of first belt law in the state; 2 Primary enforcement enables police officers to stop vehicles and write citations whenever they observe a violation of the seat belt law. Secondary enforcement allows police officers to write a citation for seat belt infractions only after stopping a vehicle for some other traffic infraction; 3 Most states exempt vehicles not manufactured with seat belts; 4 Plus 3 points on license; 5 Fine for first offense; 6 Plus 2 points on license; 7 Penalty could include 30 days in jail.
SOURCE: U.S. Department of Transportation, National Highway Traffic Safety Administration, Traffic Safety Facts 2000, Washington, DC: 2001, available at http://www-nrd.nhtsa.dot.gov/pdf/nrd-30/NCSA/TSFAnn/TSF2000.pdf as of Jan. 4, 2002.
Effective1 Enforcement2 SeatsFine
KEY: NA = not applicable; RV = recreational vehicle.
BTS State Transportation Profile B-3 Oklahoma

Safety
Table 2-4: Shoulder Belt Use: 2000
State Percent State PercentAlabama 70.6 Montana 75.6Alaska 61.0 Nebraska 70.5Arizona 75.2 Nevada 78.5Arkansas 52.4 New Hampshire NCalifornia 88.9 New Jersey 74.2Colorado 65.1 New Mexico 86.6Connecticut 76.3 New York 77.3Delaware 66.1 North Carolina 80.5District of Columbia 82.6 North Dakota 47.7Florida 64.8 Ohio 65.3Georgia 73.6 Oklahoma 67.5Hawaii 80.4 Oregon 83.6Idaho 58.6 Pennsylvania 70.7Illinois 70.2 Rhode Island 64.4Indiana 62.1 South Carolina 73.9Iowa 78.0 South Dakota 53.4Kansas 61.6 Tennessee 59.0Kentucky 60.0 Texas 76.6Louisiana 68.2 Utah 75.7Maine N Vermont 61.6Maryland 85.0 Virginia 69.6Massachusetts 50.0 Washington 81.6Michigan 83.5 West Virginia 49.5Minnesota 73.4 Wisconsin 65.4Mississippi 50.4 Wyoming 66.8Missouri 67.7
KEY: N = data do not exist.
SOURCE FOR DATA ON THIS PAGE: U.S. Department of Transportation, National Highway Traffic Safety Administration, 1998-2000 State Shoulder Belt Use Survey Results , Research Note, Washington, DC: May 2001, available at http://www-nrd.nhtsa.dot.gov/departments/nrd-30/ncsa/availinf.html as of Mar. 20, 2002.
Figure 2-1: Shoulder Belt Use
56.060.7
67.568.7 67.071.0
0.0
10.0
20.0
30.0
40.0
50.0
60.0
70.0
80.0
1998 1999 2000
Oklahoma
United StatesPercent
Oklahoma B-4 BTS State Transportation Profile

Safety
State
Pedestrian fatality rate per
100,000 population
Alabama 995 61 6.1 4,451 1.4Alaska 103 8 7.8 653 1.2Arizona 1,036 130 12.5 4,798 2.7Arkansas 652 38 5.8 2,631 1.4California 3,753 670 17.9 32,521 2.1Colorado 681 80 11.7 4,168 1.9Connecticut 342 49 14.3 3,284 1.5Delaware 123 22 17.9 768 2.9District of Columbia 49 18 36.7 523 3.4Florida 2,999 492 16.4 15,233 3.2Georgia 1,541 137 8.9 7,875 1.7Hawaii 131 29 22.1 1,257 2.3Idaho 276 6 2.2 1,347 0.4Illinois 1,418 187 13.2 12,051 1.6Indiana 875 51 5.8 6,045 0.8Iowa 445 25 5.6 2,900 0.9Kansas 461 19 4.1 2,668 0.7Kentucky 820 53 6.5 3,995 1.3Louisiana 937 100 10.7 4,425 2.3Maine 169 15 8.9 1,259 1.2Maryland 588 91 15.5 5,275 1.7Massachusetts 433 82 18.9 6,199 1.3Michigan 1,382 170 12.3 9,679 1.8Minnesota 625 38 6.1 4,830 0.8Mississippi 949 64 6.7 2,816 2.3Missouri 1,157 88 7.6 5,540 1.6Montana 237 11 4.6 950 1.2Nebraska 276 20 7.2 1,705 1.2Nevada 323 43 13.3 1,871 2.3New Hampshire 126 7 5.6 1,224 0.6New Jersey 731 145 19.8 8,178 1.8New Mexico 430 47 10.9 1,860 2.5New York 1,458 335 23.0 18,146 1.8North Carolina 1,472 144 9.8 7,777 1.9North Dakota 86 5 5.8 662 0.8Ohio 1,351 96 7.1 11,319 0.8Oklahoma 652 43 6.6 3,373 1.3Oregon 451 50 11.1 3,397 1.5Pennsylvania 1,520 170 11.2 12,202 1.4Rhode Island 80 6 7.5 998 0.6South Carolina 1,065 84 7.9 3,858 2.2South Dakota 173 13 7.5 777 1.7Tennessee 1,306 99 7.6 5,657 1.7Texas 3,769 412 10.9 20,119 2.0Utah 373 33 8.8 2,207 1.5Vermont 79 7 8.9 617 1.1Virginia 930 92 9.9 6,997 1.3Washington 632 66 10.4 5,858 1.1West Virginia 410 25 6.1 1,841 1.4Wisconsin 799 51 6.4 5,326 1.0Wyoming 152 12 7.9 525 2.3United States 41,821 4,739 11.3 274,634 1.7
Table 2-5: Pedestrian Fatalities Involving Motor Vehicles: 2000
SOURCE: U.S. Department of Transportation, National Highway Traffic Safety Administration, National Center for Statistics and Analysis, Traffic Safety Facts 2000: Pedestrians, Washington, DC: 2001, available at http://www.nhtsa.dot.gov/people/ncsa/factshet.html as of Dec. 5, 2001.
State population (thousands)
Pedestrian fatalities as percent of
totalPedestrians
killedTotal traffic
fatalities
BTS State Transportation Profile B-5 Oklahoma

Safety
StateAlabama 1,113 381 34 995 326 33Alaska 87 37 42 103 44 43Arizona 1,031 347 34 1,036 354 34Arkansas 631 148 23 652 139 21California 4,192 1,308 31 3,753 1,061 28Colorado 645 226 35 681 198 29Connecticut 317 130 41 342 119 35Delaware 121 38 31 123 49 40District of Columbia 58 25 44 49 14 29Florida 2,805 873 31 2,999 930 31Georgia 1,488 400 27 1,541 438 28Hawaii 130 41 32 131 37 28Idaho 262 69 27 276 81 29Illinois 1,586 551 35 1,418 489 34Indiana 960 263 27 875 214 24Iowa 527 159 30 445 100 22Kansas 442 152 34 461 118 26Kentucky 849 227 27 820 203 25Louisiana 883 353 40 937 352 38Maine 187 44 24 169 38 22Maryland 671 176 26 588 161 27Massachusetts 444 148 33 433 153 35Michigan 1,530 483 32 1,382 397 29Minnesota 597 215 36 625 207 33Mississippi 868 306 35 949 289 30Missouri 1,109 450 41 1,157 387 33Montana 215 79 37 237 92 39Nebraska 254 64 25 276 70 25Nevada 313 127 41 323 112 35New Hampshire 118 30 25 126 40 31New Jersey 773 243 32 731 231 32New Mexico 485 202 42 430 159 37New York 1,674 405 24 1,458 293 20North Carolina 1,448 399 28 1,472 419 28North Dakota 74 32 44 86 36 42Ohio 1,366 344 25 1,351 411 30Oklahoma 669 205 31 652 169 26Oregon 572 176 31 451 132 29Pennsylvania 1,480 485 33 1,520 511 34Rhode Island 69 22 32 80 31 38South Carolina 881 229 26 1,065 329 31South Dakota 158 63 40 173 66 38Tennessee 1,259 420 33 1,306 399 31Texas 3,181 1,407 44 3,769 1,450 38Utah 326 69 21 373 68 18Vermont 106 33 31 79 27 34Virginia 900 272 30 930 257 28Washington 653 248 38 632 217 34West Virginia 376 132 35 410 149 36Wisconsin 745 263 35 799 288 36Wyoming 170 63 37 152 40 26United States 41,798 13,564 32 41,821 12,892 31
1995 2000
SOURCE: U.S. Department of Transportation, National Highway Traffic Safety Administration, National Center for Statistics and Analysis, Traffic Safety Facts 2000: State Alcohol Estimates, Washington, DC: 2001, available at http://www.nhtsa.dot.gov/people/ncsa/factshet.html as of Dec. 5, 2001.
Table 2-6: Motor Vehicle Fatalities Involving High Blood Alcohol Concentration (BAC ≥ 0.10 grams per deciliter)
Total fatalities
Fatalities involving
high blood alcohol Percent
Total fatalities
Fatalities involving high blood alcohol Percent
Oklahoma B-6 BTS State Transportation Profile

Safety
StateAlabama Y-0.08 0.08 Y-0.02 (<21) S-90 days R-1 yr R-3 yrsAlaska Y-0.10 0.10 Y-0.00 (<21) R-30 days R-1 yr R-10 yrsArizona Y-0.10 0.10 Y-0.00 (<21) S-90 days R-1 yr R-3 yrsArkansas Y-0.10 0.10 Y-0.02 (<21) Nms Nms NmsCalifornia Y-0.08 0.08 Y-0.01 (<21) Nms Nms R-18 mosColorado Y-0.10 0.10 Y-0.02 (<21) Nms R-1 yr R-1 yrConnecticut Y-0.10 0.10 Y-0.02 (<21) Nms Nms NmsDelaware Y-0.10 0.10 Y-0.02 (<21) Nms R-6 mos R-6 mosDistrict of Columbia Y-0.05 0.08 Y-0.00 (<21) R-6 mos R-1 yr R-2 yrsFlorida Y-0.08 0.08 Y-0.02 (<21) Nms R-12 mos R-24 mosGeorgia Y-0.10 0.10 Y-0.02 (<21) Nms S-120 days R-5 yrsHawaii Y-0.08 0.08 Y-0.02 (<21) S-30 days S-1 yr R-1 yrIdaho Y-0.08 0.08 Y-0.02 (<21) S-30 days S-1 yr S-1 yrIllinois Y-0.08 0.08 Y-0.02 (<21) Nms Nms NmsIndiana Y-0.10 0.10 Y-0.02 (<21) S-30 days S-1 yr S-1 yrIowa Y-0.10 0.10 Y-0.02 (<21) R-30 days R-1 yr R-1 yrKansas Y-0.08 0.08 Y-0.02 (<21) S-30 days S-1 yr S-1 yrKentucky A 0.08 Y-0.02 (<21) S-30 days R-12 mos R-24 mosLouisiana Y-0.10 0.10 Y-0.02 (<21) Nms Nms NmsMaine Y-0.08 0.08 Y-0.00 (<21) S-60 days S-18 mos S-4 yrsMaryland Y-0.10 0.10 Y-0.02 (<21) Nms Nms NmsMassachusetts Y-0.08 N Y-0.02 (<21) S-45 days R-6 mos R-2 yrsMichigan N 0.10 Y-0.02 (<21) Nms R-1 yr S-5 yrsMinnesota Y-0.10 0.10 Y-0.00 (<21) R-15 days R-90 days R-90 daysMississippi Y-0.10 0.10 Y-0.02 (<21) S-30 days S-1 yr S-3 yrsMissouri Y-0.10 0.10 Y-0.02 (<21) S-30 days R-2 yrs R-3 yrsMontana N 0.10 Y-0.02 (<21) Nms R-3 mos R-3 mosNebraska Y-0.10 0.10 Y-0.02 (<21) R-60 days R-1 yr R-1 yrNevada Y-0.10 0.10 Y-0.02 (<21) R-45 days R-1 yr R-1.5 yrsNew Hampshire Y-0.08 0.08 Y-0.02 (<21) R-90 days R-3 yrs R-3 yrsNew Jersey N 0.10 Y-0.01 (<21) R-6 mos R-2 yrs R-10 yrsNew Mexico Y-0.08 0.08 Y-0.02 (<21) Nms R-30 days R-30 daysNew York A 0.10 Y-0.02 (<21) Nms R-I yr R-1 yrNorth Carolina Y-0.08 0.08 Y-0.00 (<21) Nms R-2 yrs R-3 yrsNorth Dakota Y-0.10 0.10 Y-0.02 (<21) S-30 days S-365 days S-2 yrsOhio Y-0.10 0.10 Y-0.02 (<21) S-15 days S-30 days S-180 daysOklahoma Y-0.10 0.10 Y-0.00 (<21) Nms R-1 yr R-1 yrOregon Y-0.08 0.08 Y-0.00 (<21) Nms S-90 days S-1 yrPennsylvania N 0.10 Y-0.02 (<21) S-1 mo S-12 mos S-12 mosRhode Island N 0.08 Y-0.02 (<21) S-3 mos S-1 yr S-2 yrsSouth Carolina Y-0.15 0.10 Y-0.02 (<21) Nms S-1 yr S-4 yrsSouth Dakota N 0.10 Y-0.02 (<21) Nms R-1 yr R-1 yrTennessee N 0.10 Y-0.02 (<21) Nms R-2 yrs R-3 yrsTexas Y-0.08 0.08 Y-0.00 (<21) Nms Nms NmsUtah Y-0.08 0.08 Y-0.00 (<21) S-90 days R-1 yrs R-1 yrsVermont Y-0.08 0.08 Y-0.02 (<21) S-90 days S-18 mos R-2 yrsVirginia Y-0.08 0.08 Y-0.02 (<21) Nms R-1 yr R-3 yrsWashington Y-0.08 0.08 Y-0.02 (<21) S-30 days R-1 yr R-2 yrsWest Virginia Y-0.10 0.10 Y-0.02 (<21) R-30 days R-1 yr R-1 yrWisconsin Y-0.10 0.10 Y-0.02 (<21) Nms R-60 days R-90 daysWyoming Y-0.10 0.10 Y-0.02 (<21) Nms S-1 yr R-3 yrs
Table 2-7: Impaired Driving Laws: 2000
License sanction(Mandatory minimum for a DWI
NOTES: An "administrative per se law" allows a state's driver licensing agency to either suspend or revoke a driver's license based on a specific alcohol (or drug) concentration or on some other criterion related to alcohol or drug use and driving. Such action is independent of any licensing action related to a DWI criminal offense. The term "illegal per se" refers to state laws that make it a criminal offense to operate a motor vehicle at or above a specified alcohol (or drug) concentration in the blood, breath, or urine. In those columns showing mandatory sanctions, "nms" does not mean that a state does not have a sanction. It only means that the state does not have a mandatory sanction for that offense or violation.
KEY: BAC = blood alcohol concentration; DWI = driving while intoxicated; Y = yes; N = no; A = alternative; S = suspension; R = revocation; Nms = no mandatory sanction.
First offense Second offense Third offense
Administrative per se (BAC level)
Illegal per se (BAC level)
Lower BAC for youthful DWI offenders
(BAC level and age)
SOURCE: U.S. Department of Transportation, National Highway Traffic Safety Administration, Traffic Safety Facts 2000 , Washington, DC: 2001, available at http://www-nrd.nhtsa.dot.gov/pdf/nrd-30/NCSA/TSFAnn/TSF2000.pdf as of Jan. 4, 2002.
BTS State Transportation Profile B-7 Oklahoma

Safety
State Rural UrbanAlabama 70 70 65 65Alaska 65 55 65 55Arizona 75 55 55 55Arkansas 70, Trucks: 65 55 60 55California 70, Trucks: 55 65 70 55Colorado 75 65 65 55Connecticut 65 55 65 55Delaware 65 55 65 55District of Columbia NA 55 NA 25Florida 70 65 70 65Georgia 70 65 65 65Hawaii 55 50 45 45Idaho 75, Trucks: 65 65 65 65Illinois 65, Trucks: 55 55 65 55Indiana 65, Trucks: 60 55 55 55Iowa 65 55 65 55Kansas 70 70 70 65Kentucky 65 55 55 55Louisiana 70 55 70 65Maine 65 55 55 55Maryland 65 65 65 55Massachusetts 65 65 65 55Michigan 70, Trucks: 55 65 70 55Minnesota 70 65 65 55Mississippi 70 70 70 65Missouri 70 60 70 65Montana 75, Trucks: 65 65 Day: 70, Night: 65 Day: 70, Night: 65Nebraska 75 65 65 60Nevada 75 65 70 70New Hampshire 65 65 55 55New Jersey 65 55 65 55New Mexico 75 55 65 55New York 65 65 65 55North Carolina 70 65 65 55North Dakota 70 55 65 Day: 65, Night: 55Ohio 65, Trucks: 55 65 55 55Oklahoma 75 70 70 70Oregon 65, Trucks: 55 55 55 55Pennsylvania 65 55 65 55Rhode Island 65 55 55 55South Carolina 70 70 60 55South Dakota 75 65 65 65Tennessee 70 70 70 55Texas 70 70 70 70Utah 75 65 55 55Vermont 65 55 50 50Virginia 65 55 65 55Washington 70, Trucks: 60 60 55 55West Virginia 70 55 65 55Wisconsin 65 65 65 55Wyoming 75 60 65 65
KEY: NA = not applicable.
Interstate Other limited-access roads2 Other roads
Table 2-8: Maximum Posted Speed Limits by System: 2001 (Speed limit in miles per hour)1
SOURCE: Insurance Institute for Highway Safety, Highway Loss Data Institute, available at http://www.hwysafety.org/ safety_facts/state_laws/speed_limit_laws.htm as of Oct. 1, 2001.
2 Limited-access roads are multi-laned roads with restricted access using exit and entrance ramps rather than intersections.
NOTE: Interstates are divided into urban and rural sections based primarily on population size and population density.
1 Many roads, particularly urban interstates, often have a lower posted speed limit than the maximum allowable shown in this table.
Oklahoma B-8 BTS State Transportation Profile

Safety
State StateAlabama 257 20 143 Montana 156 4 108Alaska 89 2 82 Nevada 40 1 25Arizona 222 27 147 New Hampshire 18 0 15Arkansas 371 30 225 New Jersey 528 28 432California 1,133 101 808 Nebraska 362 8 247Colorado 199 10 112 New Mexico 138 4 106Connecticut 203 6 159 New York 1,330 32 1,168Delaware 59 2 47 North Carolina 243 24 121District of Columbia 107 0 90 North Dakota 122 9 82Florida 405 45 303 Ohio 575 28 339Georgia 395 23 231 Oklahoma 231 22 124Hawaii 0 0 0 Oregon 214 9 152Idaho 109 11 53 Pennsylvania 752 23 583Illinois 1,484 69 1,109 Rhode Island 21 1 19Indiana 540 36 317 South Carolina 192 20 141Iowa 367 9 211 South Dakota 64 3 43Kansas 337 21 226 Tennessee 296 15 163Kentucky 272 14 170 Texas 1,260 90 777Louisiana 465 16 310 Utah 129 5 88Maine 79 2 58 Vermont 29 1 22Maryland 173 9 103 Virginia 252 13 169Massachusetts 228 17 183 Washington 317 16 230Michigan 434 23 300 West Virginia 128 9 93Minnesota 431 11 303 Wisconsin 390 20 258Mississippi 250 17 120 Wyoming 156 2 107Missouri 367 29 221 United States 16,919 937 11,643
NOTE FOR DATA ON THIS PAGE: "Accidents/incidents" includes all events reportable to the U.S. Department of Transportation, Federal Railroad Administration under applicable regulations. These include: train accidents, reported on Form F 6180.54, comprised of collisions, derailments, and other events involving the operation of on-track equipment and causing reportable damage above an established threshold ($6,600 in 1998); highway-rail grade crossing incidents, reported on Form F 6180.57, involving impact between railroad on-track equipment and highway users at crossings; and other incidents, reported on Form F 6180.55a, involving all other reportable incidents or exposures that cause a fatality or injury to any person, or an occupational illness to a railroad employee.
SOURCE FOR DATA ON THIS PAGE: U.S. Department of Transportation, Federal Railroad Administration, Railroad Safety Statistics Annual Report 2000, Washington, DC: 2001, table 2-11, available at http://safetydata.fra.dot.gov/officeofsafety/ as of Oct. 22, 2001.
Table 2-9: Total Rail Accidents/Incidents: 2000
Accidents/ Incidents Fatalities Injuries
Accidents/ Incidents Fatalities Injuries
Figure 2-2: Oklahoma Train Accidents(Excludes highway-grade crossing incidents and other
incidents)
50
3732
5247
61
0
10
20
30
40
50
60
70
1995 1996 1997 1998 1999 2000
BTS State Transportation Profile B-9 Oklahoma

Safety
State StateAlabama 5,418 95 10 39 Montana 3,514 24 1 2Alaska 336 7 0 0 Nebraska 6,575 55 7 14Arizona 1,628 29 8 13 Nevada 571 2 0 0Arkansas 4,655 115 27 36 New Hampshire 637 3 0 0California 12,775 174 27 54 New Jersey 2,493 36 5 10Colorado 3,271 36 6 8 New Mexico 1,355 17 0 11Connecticut 624 8 2 0 New York 6,216 41 5 14Delaware 456 10 0 7 North Carolina 7,813 113 14 25District of Columbia 42 2 0 0 North Dakota 6,343 17 6 2Florida 5,324 86 15 67 Ohio 9,633 148 15 38Georgia 8,453 128 10 38 Oklahoma 5,913 89 12 47Hawaii 8 0 0 0 Oregon 5,213 30 0 13Idaho 2,645 33 11 1 Pennsylvania 8,946 69 8 17Illinois 13,916 217 31 68 Rhode Island 189 0 0 0Indiana 9,129 194 23 55 South Carolina 4,270 80 10 24Iowa 9,317 109 6 31 South Dakota 3,495 11 0 5Kansas 10,756 67 11 18 Tennessee 5,062 90 8 26Kentucky 5,037 69 5 20 Texas 18,289 388 52 164Louisiana 6,726 181 14 88 Utah 1,755 18 2 7Maine 1,680 8 1 1 Vermont 1,192 2 0 0Maryland 1,390 19 1 2 Virginia 4,829 54 3 21Massachusetts 1,679 12 1 4 Washington 5,749 45 1 10Michigan 8,028 134 13 51 West Virginia 3,632 20 1 8Minnesota 8,219 91 6 40 Wisconsin 7,043 122 15 49Mississippi 4,850 113 15 44 Wyoming 1,151 3 0 0Missouri 8,001 88 17 27 United States 256,241 3,502 425 1,219
Injuries
Table 2-10: Highway-Rail Grade Crossing Incidents: 2000
SOURCE FOR DATA ON THIS PAGE: U.S. Department of Transportation, Federal Railroad Administration, Railroad Safety Statistics Annual Report 2000, Washington, DC: 2001, available at http://safetydata.fra.dot.gov/officeofsafety/ as of Oct. 22, 2001.
NOTE FOR DATA ON THIS PAGE: Any impact, regardless of severity, between railroad on-track equipment and any user of a public or private crossing site must be reported to the U.S. Department of Transportation, Federal Railroad Administration on Form F 6180.57. The crossing site includes sidewalks and pathways at, or associated with, the crossing. Counts of fatalities and injuries include motor vehicle occupants, people not in vehicles or on the trains, as well as people on the train or railroad equipment.
Number of grade crossings Incidents Fatalities Injuries
Number of grade crossings Incidents Fatalities
Figure 2-3: Oklahoma Highway-Rail Grade Crossing Fatalities and Injuries
15
2224
1214
12
64
38
56
39
26
47
0
10
20
30
40
50
60
70
1995 1996 1997 1998 1999 2000
Fatalities Injuries
Oklahoma B-10 BTS State Transportation Profile
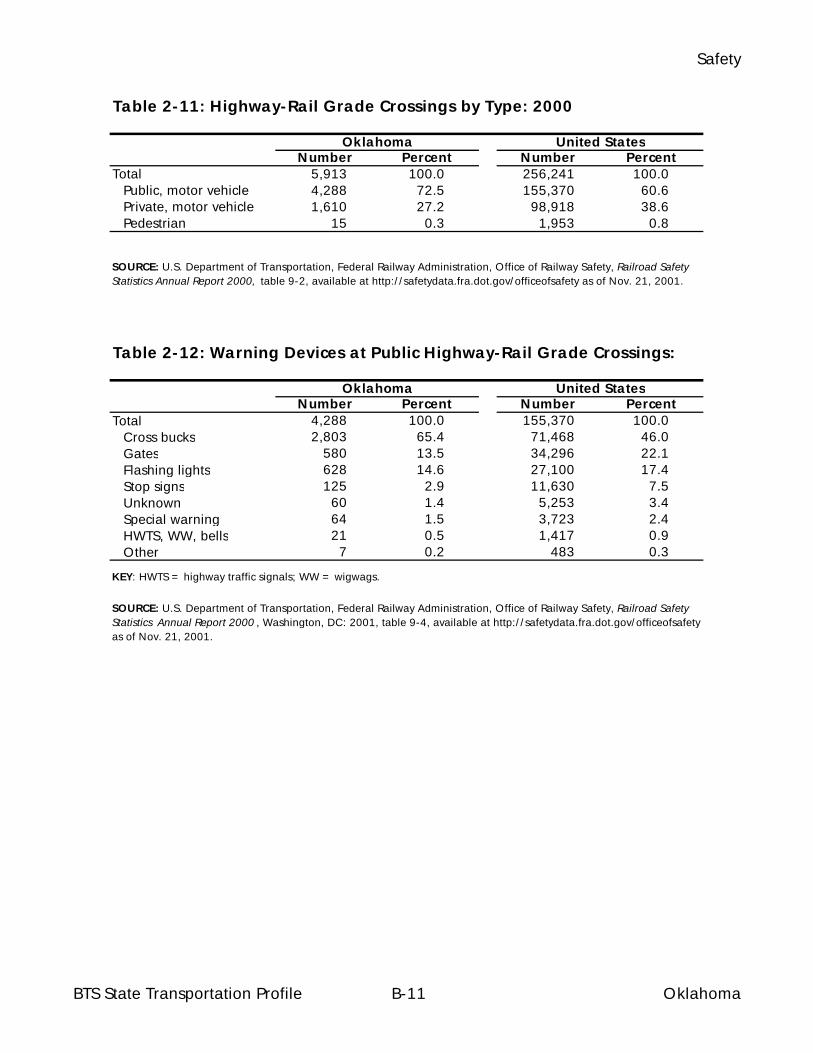
Safety
Total 5,913 100.0 256,241 100.0Public, motor vehicle 4,288 72.5 155,370 60.6Private, motor vehicle 1,610 27.2 98,918 38.6Pedestrian 15 0.3 1,953 0.8
Total 4,288 100.0 155,370 100.0Cross bucks 2,803 65.4 71,468 46.0Gates 580 13.5 34,296 22.1Flashing lights 628 14.6 27,100 17.4Stop signs 125 2.9 11,630 7.5Unknown 60 1.4 5,253 3.4Special warning 64 1.5 3,723 2.4HWTS, WW, bells 21 0.5 1,417 0.9Other 7 0.2 483 0.3
Table 2-11: Highway-Rail Grade Crossings by Type: 2000
OklahomaNumber PercentNumber Percent
United StatesOklahoma
SOURCE: U.S. Department of Transportation, Federal Railway Administration, Office of Railway Safety, Railroad Safety Statistics Annual Report 2000, table 9-2, available at http://safetydata.fra.dot.gov/officeofsafety as of Nov. 21, 2001.
SOURCE: U.S. Department of Transportation, Federal Railway Administration, Office of Railway Safety, Railroad Safety Statistics Annual Report 2000 , Washington, DC: 2001, table 9-4, available at http://safetydata.fra.dot.gov/officeofsafety as of Nov. 21, 2001.
Table 2-12: Warning Devices at Public Highway-Rail Grade Crossings:
NumberNumber Percent Percent
United States
KEY: HWTS = highway traffic signals; WW = wigwags.
BTS State Transportation Profile B-11 Oklahoma

Safety
Type of personWorker on duty (railroad employee) 0 63Employee not on duty 0 2Passenger on train 0 2Nontrespasser 11 47Trespasser 11 8Worker on duty (contractor) 0 1Contractor (other) 0 1Worker on duty (volunteer) 0 0Volunteer (other) 0 0Nontrespasser (off railroad property) 0 0
SOURCE FOR DATA ON THIS PAGE: U.S. Department of Transportation, Federal Railroad Administration, Railroad Safety Statistics Annual Report 2000, Washington, DC: 2001, available at http://safetydata.fra. dot.gov/ officeofsafety/ as of Oct. 22, 2001.
NOTE FOR DATA ON THIS PAGE: As defined by the U.S. Department of Transportation, Federal Railroad Administration, a trespasser is any person on a part of railroad property used in railroad operations whose presence is prohibited, forbidden, or unlawful. Employees who are trespassing on railroad property are reported as trespassers.
Table 2-13: Types of People Injured in Oklahoma Train Accidents/Incidents: 2000
Fatalities Injuries
(Includes highway-rail crossing)
Figure 2-4: Railroad Trespasser Deaths and Injuries in Oklahoma (Excludes highway-rail crossing)
2
6 67 7
10
2
13
11
5
9
7
0
5
10
15
1995 1996 1997 1998 1999 2000
Deaths Injuries
Oklahoma B-12 BTS State Transportation Profile

Safety
Automated guideway 0 0 0 0 0 0 0Cable car 0 0 0 0 0 0 0Commuter rail 0 0 0 0 0 0 0Demand responsive 12 0 3 12 1 11 35Ferry boat 0 0 0 0 0 0 0Heavy rail 0 0 0 0 0 0 0Light rail 0 0 0 0 0 0 0Motor bus 41 0 43 96 0 109 109Trolley bus 0 0 0 0 0 0 0Van pool 0 0 0 0 0 0 0
Table 2-15: U.S. Transit Safety Data: 2000
Automated guideway 1 0 0 16 0 15 34Cable car 10 0 15 10 0 11 10Commuter rail 267 104 95 1,981 2 1,865 8,047Demand responsive 3,055 6 1,603 1,510 11 1,494 6,910Ferry boat 7 0 6 719 0 730 106Heavy rail 389 55 316 12,388 22 10,530 5,034Light rail 343 30 361 979 0 978 3,062Motor bus 23,184 93 20,800 19,847 8 20,967 43,717Trolley bus 122 0 103 257 0 265 103Van pool 186 1 65 5 0 5 563
Table 2-14: Oklahoma Transit Safety Data: 2000
Number of incidents Fatalities
Number of incidents Fatalities Injuries
Number of incidents
Total property damage
($ thousands)
Total property damage
($ thousands)
Collision NoncollisionNumber of incidents Fatalities Injuries Injuries
Collision
Injuries
Noncollision
SOURCE FOR DATA ON THIS PAGE: U.S. Department of Transportation, Federal Transit Administration, 2000 National Transit Database, available at http://www.ntdprogram.com as of Dec. 5, 2001.
Fatalities
NOTES FOR DATA ON THIS PAGE: Collision includes at-grade crossings and suicides. Noncollision includes: 1) derailments/buses going off road; 2) personal casualties in parking facilities, inside vehicles, on right of way, boarding/alighting, and in station/bus stops; and 3) nonarson fires.
BTS State Transportation Profile B-13 Oklahoma

Safety
Number of accidentsTotal 104 7,740
Fatal 10 616Nonfatal injury 57 3,292Property damage 37 3,832
Number of personsKilled 13 701Injured 75 4,355
These data do not include: 1) accidents involving only slight injury not requiring medical treatment beyond first-aid; 2) accidents involving property damage of $500 or less; 3) accidents not caused or contributed to by a vessel, its equipment, or its appendages; and 4) accidents in which the boat was used solely as a platform for other activities, such as swimming or skin diving. Such cases are not included because the victims freely left the safety of a boat. However, the data do include accidents involving people in the water who are struck by their boat or another boat.
SOURCE FOR DATA ON THIS PAGE: U.S. Department of Transportation, U.S. Coast Guard, Boating Statistics, 2000, Washington, DC: 2001, available at http://www.uscgboating.org/Saf/pdf/Boating_Statistics_2000.pdf as of Nov. 14, 2001.
Oklahoma
Table 2-16: Recreational Boating Accidents: 2000
United States
NOTES FOR DATA ON THIS PAGE: An accident is listed under one category only, with fatal being the highest priority, followed by nonfatal injury, followed by property damage. For example, if two vessels are in an accident resulting in a fatality and a nonfatal injury, the accident is counted as a fatal accident involving two vessels.
NOTE: Guam, Puerto Rico, and the Virgin Islands are included in the U.S. total.
Figure 2-5: Oklahoma Recreational Boating Accidents
11
9 9
1112
10
1211
9
12
16
13
0
5
10
15
20
1995 1996 1997 1998 1999 2000
Fatal accidentsFatalities
Oklahoma B-14 BTS State Transportation Profile

Safety
Number of accidents Total 10 633 24 696Number of persons Killed 2 191 2 215 Injured 14 476 22 542
Table 2-17: Alcohol Involvement in Recreational Boating Accidents
NOTE FOR DATA ON THIS PAGE: Alcohol involvement in a boating accident includes any accident in which alcoholic beverages are consumed in the boat and the investigating official has determined that the operator was impaired or affected while operating the boat.
SOURCES FOR DATA ON THIS PAGE: U.S. Department of Transportation, U.S. Coast Guard, Boating Statistics 2000 , Washington, DC: 2001; U.S. Department of Transportation, U.S. Coast Guard, Boating Statistics 1999, W ashington, DC: 2000, available at http://www.uscgboating.org/Saf/pdf/Boating_Statistics_2000.pdf and http://www.uscgboating.org /Saf/pdf/Boating_Statistics_1999.pdf as of Nov. 14, 2001.
Oklahoma United States Oklahoma United States1999 2000
Figure 2-6: Oklahoma Recreational Boating Accidents Involving Alcohol
9 9 910
24
32 2 2 2
12
7 7
14
22
0
5
10
15
20
25
30
1996 1997 1998 1999 2000
Accidents Persons killed Persons injured
BTS State Transportation Profile B-15 Oklahoma

Safety
Oklahoma 234 1 0 0 0 592United States 17,514 13 246 18 228 72,728
NOTE FOR DATA ON THIS PAGE: Hazardous materials incident data are subject to revision and correction by the Office of Hazardous Materials Safety.
Table 2-18: Hazardous Materials Incidents: 2000
Injuries
Hazardous materials transportation incidents required to be reported are defined in the Code of Federal Regulations (CFR), 49 CFR Part 171.15, 171.16 (Form F 5800.1).
Hazardous material incident locations are often listed as the terminals or sorting centers where they are discovered. Therefore, states with this type of a facility may show a disproportionate number of incidents.
Incidents Deaths
NOTES: U.S. total includes U.S. territories or foreign locations.
SOURCE FOR DATA ON THIS PAGE: U.S. Department of Transportation, Research and Special Programs Administration, Office of Hazardous Materials Safety, Hazmat Summary by State for Calendar Year 2000 , and earlier years, Washington, DC: 2002, available at http://hazmat.dot.gov as of Apr. 24, 2002.
Hazardous materials deaths and injuries are caused by the hazardous material in commerce.
(Not including pipelines)
Total Major MinorDamages
($ thousands)
Figure 2-7: Oklahoma Hazardous Materials Incidents (Not including pipelines)
133
113
133 132
188
234
100
150
200
250
1995 1996 1997 1998 1999 2000
Oklahoma B-16 BTS State Transportation Profile

Safety
ModeHighway 226 0 0 1 586Rail 5 0 0 0 6Air 3 0 0 0 0Water1 0 0 0 0 0Total 234 0 0 1 592
Damages
Table 2-19: Oklahoma Hazardous Materials Incidents by Mode: 2000(Not including pipelines)
Injuries
SOURCE FOR DATA ON THIS PAGE: U.S. Department of Transportation, Research and Special Programs Administration, Office of Hazardous Materials Safety, Hazmat Summary by State for Calendar Year 2000 , and earlier years, Washington, DC: 2002, available at http://hazmat.dot.gov/ as of Apr. 24, 2002.
Minor ($ thousands)
1Includes only packaged shipments (i.e., nonbulk shipments).
Total incidents Deaths Major
NOTE FOR DATA ON THIS PAGE: Hazardous materials incident data are subject to revision and correction by the Office of Hazardous Materials Safety.
118103
124 125
169
226
14 8 5 6 5 52114
4 1 30 0 0 0 0 00
50
100
150
200
250
1995 1996 1997 1998 1999 2000
Highway Rail Air Water
Figure 2-8: Oklahoma Hazardous Materials Incidents by Mode(Not including pipelines)
BTS State Transportation Profile B-17 Oklahoma

Safety
1995 1996 1997 1998 1999 2000Oklahoma Number of incidents 4 0 2 3 5 4 Number of fatalities 3 0 0 2 0 0 Number of injuries 0 0 1 0 0 4 Property damage ($ thousands) 230 0 68 15 1,444 62
United States, total Number of incidents 97 110 102 137 119 154 Number of fatalities 16 471 9 17 19 22 Number of injuries 43 1091 67 65 85 59 Property damage ($ thousands) 10,951 16,2531 12,493 19,055 25,914 23,399
NOTE: Incidents are reported on Form RSPA F 7100.1.
1995 1996 1997 1998 1999 2000Oklahoma Number of incidents 2 5 2 5 4 2 Number of fatalities 0 0 0 0 0 0 Number of injuries 0 0 0 1 1 0 Property damage ($ thousands) 65 281 128 520 223 2,100
United States, total Number of incidents 64 77 73 99 54 80 Number of fatalities 2 1 1 1 2 15 Number of injuries 10 5 5 11 8 18 Property damage ($ thousands) 9,958 13,078 12,078 29,749 17,696 17,868
NOTE: Incidents are reported on Form RSPA F 7100.2.
NOTES FOR DATA ON THIS PAGE: Incident means any of the following events:
II. An event that results in an emergency shutdown of an LNG facility.
SOURCE FOR DATA ON THIS PAGE: U.S. Department of Transportation, Research and Special Programs Administration, Office of Pipeline Safety, available at http://ops.dot.gov as of Jan. 7, 2002.
Table 2-20: Natural Gas Distribution Pipeline Incidents
I. An event that involves a release of gas from a pipeline or of liquefied natural gas (LNG) facility and a) a death or personal injury necessitating in-patient hospitalization or b) estimated property damage, including cost of gas lost, of the operator or others, or both, of $50,000 or more.
III. An event that is significant, in the judgment of the operator, even though it did not meet the criteria of I or II.
Table 2-21: Natural Gas Transmission Pipeline Incidents
1 Includes 33 fatalities, 42 injuries, and $5,000,000 property damage associated with an incident in San Juan, Puerto Rico that was attributed to natural gas at the time. The cause of the incident is currently in dispute and subject to litigation.
Historical totals may change as the Office of Pipeline Safety receives supplemental information on incidents.
Oklahoma B-18 BTS State Transportation Profile

Safety
1995 1996 1997 1998 1999 2000Oklahoma Number of incidents 18 24 21 13 14 10 Number of fatalities 0 0 0 0 0 0 Number of injuries 0 0 0 0 2 0 Property damage ($ thousands) 1,425 1,403 1,299 1,085 2,252 287
United States, total Number of incidents 188 193 171 153 168 147 Number of fatalities 3 5 0 2 4 1 Number of injuries 11 13 5 6 20 4 Property damage ($ thousands) 32,519 81,083 42,811 62,865 43,109 115,704
NOTES: Historical totals may change as the Office of Pipeline Safety receives supplemental information on incidents.
SOURCE: U.S. Department of Transportation, Research and Special Programs Administration, Office of Pipeline Safety, available at http://ops.dot.gov as of Jan. 7, 2002.
Table 2-22: Hazardous Liquid Pipeline Incidents
Incidents are reported on Form RSPA F 7100.1. An accident report is required for each failure in a pipeline system in which there is a release of the hazardous liquid or carbon dioxide transported resulting in any of the following:1. Explosion or fire not intentionally set by the operator;
5. Bodily harm to any person resulting in: a. loss of consciousness; or b. necessity to carry the person from the scene; or c. necessity for medical treatment; or d. disability which prevents the discharge of normal duties or the pursuit of normal activities beyond the day of the accident;6. Estimated property damage, including cost of clean-up and recovery, value of lost product, and damage to the property of the operator or others, or both, exceeding $50,000.
2. Loss of 50 or more barrels (8 or more cubic meters) of hazardous liquid or carbon dioxide;3. Escape to the atmosphere of more than 5 barrels (0.8 cubic meters) a day of highly volatile liquids;4. Death of any person;
BTS State Transportation Profile B-19 Oklahoma

B-20

C Freight Transportation


Freight
State of origin State of originOklahoma 1 20,133 83,798 South Carolina 27 433 159Wyoming 2 189 17,962 Pennsylvania 28 813 148Kansas 3 2,203 11,291 Washington 29 320 134Texas 4 11,400 8,617 Florida 30 493 133Arkansas 5 1,935 6,684 Oregon 31 212 129Missouri 6 2,188 2,181 Montana 32 36 46Louisiana 7 760 1,381 South Dakota 33 S 40Michigan 8 2,255 1,101 Arizona 34 170 33Iowa 9 1,209 959 Maine 35 88 30Illinois 10 1,713 927 Maryland 36 116 20Ohio 11 1,754 710 Massachusetts 37 530 20California 12 4,187 698 New Hampshire 38 S 10Nebraska 13 554 675 Vermont 39 21 2Indiana 14 944 536 Delaware 40 S 1Wisconsin 15 994 440 Alaska 41 S SAlabama 16 608 322 Connecticut 42 470 SKentucky 17 625 313 District of Columbia 43 S SMississippi 18 432 283 Hawaii 44 S SNorth Carolina 19 1,086 254 Idaho 45 S SNew Mexico 20 50 253 Nevada 46 52 SNew Jersey 21 725 247 North Dakota 47 72 SMinnesota 22 767 235 Rhode Island 48 30 SGeorgia 23 775 188 Tennessee 49 1,125 SColorado 24 511 187 Utah 50 194 SNew York 25 1,520 186 West Virginia 51 32 SVirginia 26 1,190 162 From all states 66,807 143,442
NOTES: The Commodity Flow Survey covers business establishments in mining, manufacturing, wholesale trade, and selected retail industries. The survey also covers selected auxiliary establishments (e.g., warehouses) of in-scope multiunit and retail companies. The survey excludes establishments classified as farms, forestry, fisheries, governments, construction, transportation, foreign establishments, services, and most establishments in retail. Due to industry-wide reporting problems, shipments by oil and gas extraction establishments are also excluded. "From all states" total includes all domestic shipments to the destination state, including intrastate shipments.
KEY: S = data do not meet publication standards because of high sampling variability or other reasons.
SOURCE: U.S. Department of Transportation, Bureau of Transportation Statistics and U.S. Department of Commerce, U.S. Census Bureau, 1997 Commodity Flow Survey , Washington, DC: 1999, available at http://www.bts.gov/ntda/ cfs/cfs97od.html as of Nov. 2, 2001.
(Descending order by weight)Table 3-1: Domestic Shipments to Oklahoma by State: 1997
Value($ millions)
Weight (thousand short tons)
Value($ millions)
Weight (thousand short tons)Rank Rank
BTS State Transportation Profile C-1 Oklahoma

Freight
State of destination
State of destination
Oklahoma 1 20,133 83,798 New Mexico 27 352 200 Texas 2 9,080 13,254 Kentucky 28 244 166 Kansas 3 1,693 4,518 Virginia 29 407 154 Arkansas 4 1,750 3,513 North Carolina 30 536 136 Missouri 5 1,662 2,370 Washington 31 657 132 Louisiana 6 1,116 1,978 Wyoming 32 175 108 California 7 3,662 966 Massachusetts 33 472 91 Tennessee 8 729 803 Maryland 34 589 87 Colorado 9 871 773 Oregon 35 347 81 Illinois 10 1,518 693 Montana 36 315 62 Nebraska 11 261 636 Idaho 37 32 45 Alabama 12 387 595 Alaska 38 78 35 Michigan 13 749 488 Connecticut 39 102 21 Arizona 14 407 478 Delaware 40 25 7 Florida 15 1,420 427 New Hampshire 40 34 7 Georgia 16 783 422 Maine 41 19 4 Ohio 17 S 412 West Virginia 42 56 S Minnesota 18 679 411 Rhode Island 42 S S Wisconsin 19 801 406 New Jersey 42 440 S Iowa 20 389 379 Vermont 42 27 S Indiana 21 399 364 District of 42 7 S Mississippi 22 384 349 Utah 42 322 S New York 23 696 313 Hawaii 42 13 S Pennsylvania 24 499 253 Nevada 42 185 S South Carolina 25 199 219 South Dakota 42 51 S North Dakota 26 133 210 To all states 57,609 121,404
NOTES: The Commodity Flow Survey covers business establishments in mining, manufacturing, wholesale trade, and selected retail industries. The survey also covers selected auxiliary establishments (e.g., warehouses) of in-scope multiunit and retail companies. The survey excludes establishments classified as farms, forestry, fisheries, governments, construction, transportation, foreign establishments, services, and most establishments in retail. Due to industry-wide reporting problems, shipments by oil and gas extraction establishments are also excluded. "To all states" total includes all domestic shipments from the state of origin, including intrastate shipments.
(Descending order by weight)
SOURCE: U.S. Department of Transportation, Bureau of Transportation Statistics and U.S. Department of Commerce, U.S. Census Bureau, 1997 Commodity Flow Survey , Washington, DC: 1999, available at http://www.bts.gov/ntda/ cfs/cfs97od.html as of Nov. 2, 2001.
KEY: S = data do not meet publication standards because of high sampling variability or other reasons.
Table 3-2: Domestic Shipments from Oklahoma by State: 1997
Rank RankValue
($ millions)
Weight (thousand short tons)
Value($ millions)
Weight (thousand short tons)
Oklahoma C-2 BTS State Transportation Profile

Freight
All modes 57,609 100.0 121,404 100.0 23,869 100.0 Single modes 50,654 87.9 118,379 97.5 22,888 95.9
Truck 43,088 74.8 99,423 81.9 13,580 56.9For-hire 24,513 42.6 37,729 31.1 9,548 40.0Private truck 18,222 31.6 60,225 49.6 3,827 16.0
Rail 4,240 7.4 11,863 9.8 7,255 30.4Water 285 0.5 1,915 1.6 1,839 7.7
Shallow draft 285 0.5 1,915 1.6 1,839 7.7Great Lakes Z Z Z Z Z ZDeep draft Z Z Z Z Z Z
Air (including truck and air) 1,782 3.1 110 Z 123 0.5Pipeline 1,259 2.2 5,068 4.2 S S
Multiple modes 4,640 8.1 468 0.4 373 1.6Parcel, U.S. Postal Service, or courier service 4,469 7.8 185 0.2 144 0.6Truck and rail intermodal combination 162 0.3 219 0.2 182 0.8Truck and water S S S S S SRail and water Z Z Z Z Z ZOther multiple modes Z Z Z Z Z Z
Other and unknown modes 2,315 4.0 2,557 2.1 608 2.5
SOURCE: U.S. Department of Transportation, Bureau of Transportation Statistics and U.S. Department of Commerce, U.S. Census Bureau, 1997 Commodity Flow Survey: Washington, DC: 1999, available at http://www.bts.gov/ntda/cfs/ cfs97od.html as of Nov. 2, 2001.
Table 3-3: Shipments Originating in Oklahoma by Mode of Transportation: 1997
Value Number
($ millions) PercentNumber
(thousands) PercentNumber (millions) Percent
Ton-miles Short tons
KEY: S = data do not meet publication standards because of high sampling variability or other reasons; Z = zero or less than 1 unit of measure.
NOTE: The Commodity Flow Survey covers business establishments in mining, manufacturing, wholesale trade, and selected retail industries. The survey also covers selected auxiliary establishments (e.g., warehouses) of in-scope multiunit and retail companies. The survey excludes establishments classified as farms, forestry, fisheries, governments, construction, transportation, foreign establishments, services, and most establishments in retail. Due to industry-wide reporting problems, shipments by oil and gas extraction establishments are also excluded.
BTS State Transportation Profile C-3 Oklahoma

Freight
State of destination
Oklahoma 16,413 74,540 Texas 7,137 9,710 Kansas 1,280 3,503 Arkansas 1,507 2,917 Missouri 1,406 1,954 California 2,862 531 Illinois 1,151 516 Colorado 675 358 Tennessee 509 327 Louisiana 592 325
All other states 9,556 4,742
Total, all states 43,088 99,423
State of origin
Oklahoma 16,413 74,540 Arkansas 1,683 5,770 Texas 9,209 5,601 Kansas 1,647 5,219 Missouri 1,570 1,338 Louisiana 603 878 Illinois 1,195 650 California 1,317 502 Ohio 1,099 499 Iowa 922 454
All other states 11,609 4,753
Total, all states 47,267 100,204
Value ($ millions)
Weight (thousand short tons)
SOURCE FOR DATA ON THIS PAGE: U.S. Department of Transportation, Bureau of Transportation Statistics and U.S. Department of Commerce, U.S. Census Bureau, 1997 Commodity Flow Survey , Washington, DC: 2000, data from CD-ROM, CD-EC97-CFS.
Table 3-4: Domestic Shipments from Oklahoma by Truck: 1997
Value ($ millions)
Weight (thousand short tons)
Table 3-5: Domestic Shipments to Oklahoma by Truck: 1997
NOTE FOR DATA ON THIS PAGE: Some unpublished estimates can be derived from other data published on this table. However, figures obtained in this manner are subject to these same limitations.
Oklahoma C-4 BTS State Transportation Profile


C-6

Freight
Table 3-6 : Truck Shipments from Oklahoma by Commodity: 1997(Descending order by weight)
Commodity (2-digit commodity code)
Gravel and crushed stone (12) 93 23,461
Nonmetallic mineral products (31) 1,874 13,681
Gasoline and aviation turbine fuel (17) 2,273 7,528
Coal and petroleum products, n.e.c. (19) 789 3,539
Cereal grains (02) 400 3,213
Fuel oils (18) 586 2,332
Wood products (26) 798 2,257
Animal feed and products of animal origin, n.e.c. (04) 707 2,147
Articles of base metal (33) 3,491 1,987
Fertilizers (22) 334 1,843
Base metal in primary or semifinished forms and in finished basic shapes (32) 1,595 1,567
Mixed freight (43) 2,111 1,090Other prepared foodstuffs and fats and oils (07) 1,106 894
Plastics and rubber (24) 2,332 881
Coal (15) 23 870
Meat, fish, seafood, and their preparations (05) 1,506 862
Machinery (34) 5,007 719
Milled grain products and preparations, and bakery products (06) 758 705
Miscellaneous manufactured products (40) 2,998 679
Alcoholic beverages (08) 741 504
All other commodities 13,566 28,664
Total, all commodities 43,088 99,423
KEY: n.e.c. = not elsewhere classified.
NOTE: There are 41 two-digit Standard Classification of Transported Goods (SCTG) commodity codes.
Value ($ millions)
Weight (thousand short tons)
SOURCE: U.S. Department of Transportation, Bureau of Transportation Statistics and U.S. Department of Commerce, U.S. Census Bureau, 1997 Commodity Flow Survey , Washington, DC: 2000, data from CD-ROM, CD-EC97-CFS.
BTS State Transportation Profile C-7 Oklahoma

Freight
CommodityCoal 18,246,816 59.7 14,649,935 54.1Lumber and wood products 2,013,540 6.6 2,211,560 8.2Nonmetallic minerals 1,865,431 6.1 2,093,925 7.7Farm products 1,908,092 6.2 1,784,393 6.6Chemicals 1,457,676 4.8 1,390,752 5.1All other 5,067,272 16.6 4,968,728 18.3Oklahoma, total 30,558,827 100.0 27,099,293 100.0
CommodityNonmetallic minerals 7,336,758 38.2 8,211,087 40.5Farm products 2,549,866 13.3 3,037,040 15.0Chemicals 2,551,944 13.3 2,644,832 13.0Petroleum 1,629,414 8.5 1,992,368 9.8Glass and stone 1,413,908 7.4 U ULumber and wood products U U 1,109,380 5.5All other 3,710,148 19.3 3,303,597 16.3Oklahoma, total 19,192,038 100.0 20,298,304 100.0
NOTE FOR DATA ON THIS PAGE: Includes the five largest commodities (by tonnage terminated or originated) of the 38 two-digit Standard Transportation Commodity Code groupings plus all others for state total. Includes intrastate shipments.
SOURCE FOR DATA ON THIS PAGE: Association of American Railroads, Railroads and States-2000, Washington, DC: January 2002, available at http://www.aar.org/abouttheindustry/ stateinformation.asp as of Mar. 18, 2002; and Railroads and States -1999 , Washington, DC: January 2002, available at http://www.aar.org/abouttheindustry/stateinformation.asp as of Mar. 18, 2002.
2000Percent of
total1999Percent of
total
KEY: U = data are unavailable.
Table 3-8: Rail Shipments Originating in Oklahoma(Short tons)
Table 3-7: Rail Shipments Terminating in Oklahoma(Short tons)
1999 Percent of
total 2000Percent of
total
Oklahoma C-8 BTS State Transportation Profile


C-10

Freight
DestinationTotal originating in Oklahoma 2,016,680 100.0
Louisiana 1,261,877 62.6Ohio 131,127 6.5Illinois 129,172 6.4Tennessee 84,815 4.2Kentucky 81,551 4.0Iowa 59,915 3.0Indiana 59,588 3.0Missouri 54,130 2.7Alabama 44,165 2.2Texas 37,408 1.9Arkansas 30,009 1.5Mississippi 17,045 0.8Oklahoma (intrastate) 8,997 0.4Pennsylvania 7,802 0.4West Virginia 7,673 0.4Minnesota 1,406 0.1
OriginTotal shipped to Oklahoma 1,785,285 100.0
Louisiana 1,134,663 63.6Kentucky 159,250 8.9Mississippi 139,592 7.8Arkansas 90,352 5.1Texas 62,216 3.5Illinois 46,674 2.6West Virginia 41,363 2.3Ohio 37,370 2.1Tennessee 23,785 1.3Pennsylvania 20,672 1.2Minnesota 11,513 0.6Oklahoma (intrastate) 8,997 0.5Alabama 4,096 0.2Indiana 3,135 0.2Missouri 1,607 0.1
Short tonsPercent of
total
SOURCE FOR DATA ON THIS PAGE: U.S. Army Corps of Engineers, Waterborne Commerce Statistics Center, Origin and Destination of Waterborne Commerce of the United States, 2000 , available at http://www.wrsc.usace.army.mil as of Feb.12, 2002.
Table 3-9: Foreign and Domestic Waterborne Shipments Originating in Oklahoma by Destination: 2000
Short tonsPercent of
total
Table 3-10: Foreign and Domestic Waterborne Shipments to Oklahoma by Origin: 2000
BTS State Transportation Profile C-11 Oklahoma

Freight
CommodityTotal 2,016,680 100.0
Food and food products 1,165,222 57.8Petroleum products 98,797 4.9Chemical fertilizers 58,825 2.9Primary nonmetal products 6,305 0.3Sand, gravel, shells, clay, salt, and slag 5,847 0.3Unknown and not elsewhere classified products2 681,684 33.8
CommodityTotal 2,016,680 100.0
Food and food products 1,165,222 57.8Petroleum products 98,797 4.9Chemical fertilizers 58,825 2.9Primary nonmetal products 6,305 0.3Sand, gravel, shells, clay, salt, and slag 5,847 0.3Unknown and not elsewhere classified products2 681,684 33.8
1 "Domestic" includes intrastate shipments.2 To protect confidentiality, if three or more vessel operating companies do not carry a particular commodity from a state of origin to a state of destination, then that commodity is reclassified to "unknown and not elsewhere classified products."
SOURCE FOR DATA ON THIS PAGE: U.S. Army Corps of Engineers, Waterborne Commerce Statistics Center, State to State and Region to Region Commodity Tonnages, Public Domain database, available at http://www.wrsc. usace.army.mil/ndc/ datapdom.htm as of Oct. 30, 2001.
Table 3-11: Foreign and Domestic Waterborne Shipments Originating in Oklahoma by Commodity: 20001
Short tonsPercent of
total
Short tonsPercent of
total
Table 3-12: Domestic Waterborne Shipments Originating in Oklahoma by Commodity: 20001
Oklahoma C-12 BTS State Transportation Profile
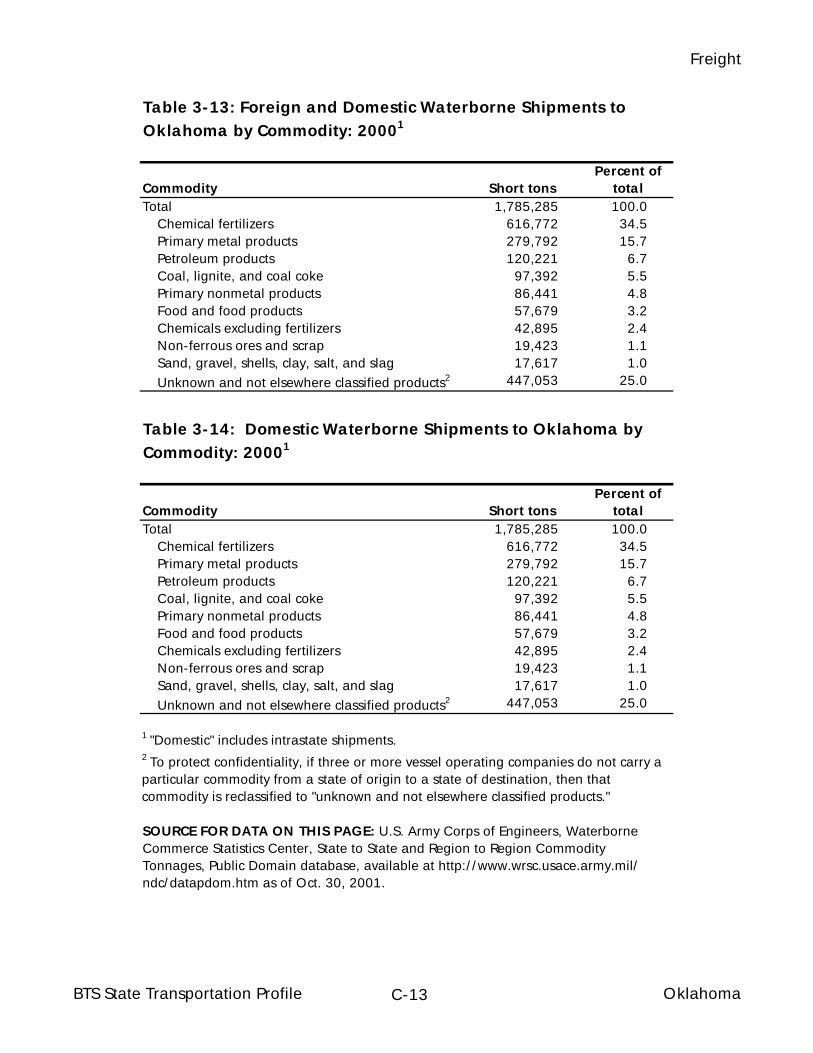
Freight
CommodityTotal 1,785,285 100.0
Chemical fertilizers 616,772 34.5Primary metal products 279,792 15.7Petroleum products 120,221 6.7Coal, lignite, and coal coke 97,392 5.5Primary nonmetal products 86,441 4.8Food and food products 57,679 3.2Chemicals excluding fertilizers 42,895 2.4Non-ferrous ores and scrap 19,423 1.1Sand, gravel, shells, clay, salt, and slag 17,617 1.0Unknown and not elsewhere classified products2 447,053 25.0
1 "Domestic" includes intrastate shipments.
Table 3-13: Foreign and Domestic Waterborne Shipments to Oklahoma by Commodity: 20001
2 To protect confidentiality, if three or more vessel operating companies do not carry a particular commodity from a state of origin to a state of destination, then that commodity is reclassified to "unknown and not elsewhere classified products."
SOURCE FOR DATA ON THIS PAGE: U.S. Army Corps of Engineers, Waterborne Commerce Statistics Center, State to State and Region to Region Commodity Tonnages, Public Domain database, available at http://www.wrsc.usace.army.mil/ ndc/datapdom.htm as of Oct. 30, 2001.
Short tonsPercent of
total
Table 3-14: Domestic Waterborne Shipments to Oklahoma by Commodity: 20001
Short tonsPercent of
total
BTS State Transportation Profile C-13 Oklahoma

Freight
StateAlabama 17,233 139,250 6,796 25Alaska 467,057 141,482 52,354 10,232Arizona 70,430 66,143 36,115 27,465Arkansas 1,886 12,578 6,534 2,955California 1,176,476 504,757 237,537 87,278Colorado 106,816 61,503 55,370 31,711Connecticut 14,802 54,627 10,260 1,575Delaware 0 3,251 0 0District of Columbia 92,526 6,208 46,511 6,615Florida 461,831 334,177 85,818 14,182Georgia 204,986 66,293 116,174 3,961Hawaii 208,048 52,473 33,768 476Idaho 11,231 5,064 3,065 1,307Illinois 318,957 202,867 112,959 9,111Indiana 408,262 85,326 24,814 134,145Iowa 15,346 53,766 7,429 3,984Kansas 6,200 20,199 2,597 18Kentucky 16,427 823,924 5,093 0Louisiana 29,577 21,753 11,399 1,758Maine 8,428 11,368 185 91Maryland 25,723 24,781 19,850 3,573Massachusetts 114,243 422,158 31,133 9,384Michigan 87,127 68,108 41,678 4,848Minnesota 85,691 51,285 59,550 9,192Mississippi 398 11,338 2,198 0Missouri 71,317 67,157 67,876 4,120Montana 16,261 7,917 1,987 3,341Nebraska 12,188 26,366 10,825 6,546Nevada 45,636 12,641 30,407 1,373New Hampshire 17,995 30,439 740 11New Jersey 352,556 115,712 54,837 4,550New Mexico 12,845 29,355 9,327 3,379New York 317,258 167,388 113,892 5,622North Carolina 85,996 85,765 35,985 3,498North Dakota 5,424 383 222 2,820Ohio 283,292 292,529 48,750 6,442Oklahoma 25,773 16,804 9,022 9Oregon 73,035 59,101 12,655 22,729Pennsylvania 156,043 312,359 45,377 9,035Puerto Rico 78,117 44,530 4,319 3,312Rhode Island 3,883 2,753 2,543 0South Carolina 17,237 76,688 3,234 6South Dakota 8,114 12,298 1,040 4,583Tennessee 1,324,829 60,779 31,342 6,417Texas 440,864 482,724 138,548 47,644Utah 66,549 133,609 30,908 25,073Vermont 3,257 19 122 0Virginia 20,961 35,881 5,189 3,492Washington 152,299 84,367 34,449 55,975West Virginia 4,306 128 4 0Wisconsin 30,060 19,618 11,558 1,088Wyoming 6,786 11 5 0United States, total 7,582,577 5,422,002 1,714,348 584,950
Nonscheduled
SOURCE: U.S. Department of Transportation, Bureau of Transportation Statistics, Airport Activity Statistics of Certificated Air Carriers: Summary Tables, Twelve Months Ending December 31, 2000, Washington, DC: 2001, available at http://www.bts.gov/publications/ airactstats2000/ as of Oct. 29, 2001.
Table 3-15: Scheduled and Nonscheduled Air Freight and MailEnplaned: 2000 (Short tons)
Scheduled Scheduled NonscheduledFreight Mail
Oklahoma C-14 BTS State Transportation Profile

Freight
Oklahoma 1,185 210 1,037 356United States, total 154,847 97,159 210,270 113,437
SOURCE FOR DATA ON THIS PAGE: U.S. Department of Transportation, Bureau of Transportation Statistics, Transborder Surface Freight Data , available at http://www.bts. gov/ntda/tbscd/reports.html as of August 2002.
Table 3-16: Surface Merchandise Trade with Canada and Mexico: 2000 (Millions of current dollars)
Exports toCanada Canada Mexico
Imports fromMexico
Figure 3-1: Oklahoma Surface Merchandise Trade with Canada and Mexico (Millions of current dollars)
0
200
400
600
800
1,000
1,200
1,400
1997 1998 1999 2000
Imports from Mexico
Exports to Mexico
Imports from Canada
Exports to Canada
BTS State Transportation Profile C-15 Oklahoma
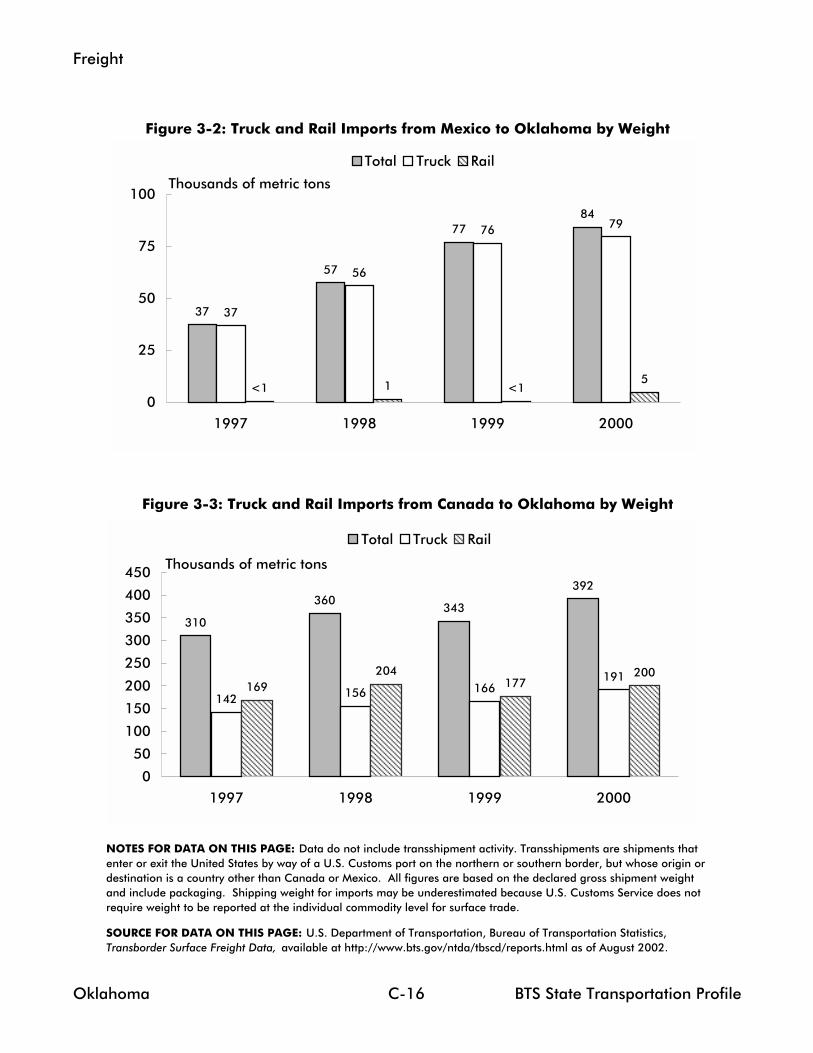
Freight
Figure 3-2: Truck and Rail Imports from Mexico to Oklahoma by Weight
Figure 3-3: Truck and Rail Imports from Canada to Oklahoma by Weight
SOURCE FOR DATA ON THIS PAGE: U.S. Department of Transportation, Bureau of Transportation Statistics, Transborder Surface Freight Data, available at http://www.bts.gov/ntda/tbscd/reports.html as of August 2002.
NOTES FOR DATA ON THIS PAGE: Data do not include transshipment activity. Transshipments are shipments that enter or exit the United States by way of a U.S. Customs port on the northern or southern border, but whose origin or destination is a country other than Canada or Mexico. All figures are based on the declared gross shipment weight and include packaging. Shipping weight for imports may be underestimated because U.S. Customs Service does not require weight to be reported at the individual commodity level for surface trade.
310
360343
392
142 156 166191
169204
177200
0
50
100
150
200
250
300
350
400
450
1997 1998 1999 2000
Total Truck Rail
Thousands of metric tons
37
57
7784
37
56
76 79
1 5<1<1
0
25
50
75
100
1997 1998 1999 2000
Total Truck Rail
Thousands of metric tons
Oklahoma C-16 BTS State Transportation Profile

D Passenger Travel


Passenger Travel
Table 4-1: Commuting to Work: 2000
ModeTotal 1,506,738 100.0 127,448,586 100.0
Car, truck, or van -- drove alone 1,232,430 81.8 97,243,457 76.3Car, truck, or van -- carpooled 166,060 11.0 14,299,090 11.2Public transportation (including taxi) 7,806 0.5 6,592,685 5.2Walked 32,119 2.1 3,417,546 2.7Other means 25,159 1.7 1,820,578 1.4Worked at home 43,164 2.9 4,075,230 3.2
Mean travel time to work (minutes) 19.6 24.3
NOTE: Data are for workers 16 years and over.
Licensed driversTotal 2,295,036 100.0 190,625,023 100.0
Male 1,126,475 49.1 95,796,069 50.3Female 1,168,561 50.9 94,828,953 49.7
United StatesNumber Percent Number Percent
SOURCE FOR TABLE 4-2 and FIGURE 4-1: U.S. Department of Transportation, Federal Highway Administration, Highway Statistics 2000 , Washington, DC: 2001.
United States
SOURCE: U.S. Department of Commerce, U.S. Census Bureau, Census 2000 Supplementary Survey, Profile of Selected Economic Characteristics , available at http://www.census.gov/c2ss/www/ as of Oct. 16, 2001.
Number PercentOklahoma
Number Percent
Table 4-2: Licensed Drivers: 2000
Oklahoma
Figure 4-1: Licensed Drivers in Oklahoma by Age and Sex: 2000
0
20
40
60
80
100
120
140
19 andunder
20-24 25-29 30-34 35-39 40-44 45-49 50-54 55-59 60-64 65-69 70-74 75-79 80-84 85 andoverAge
Male
Female
Thousands
BTS State Transportation Profile D-1 Oklahoma

Table 4-3: Urban Transit Agencies in Oklahoma: 2000
Transit agencies Modes provided Urbanized area
Central Oklahoma Transit and Parking Authority (COTPA) Bus, demand responsive Oklahoma City 4,485 17 11 3 115
Metropolitan Tulsa Transit Authority (MTTA) Bus, demand responsive Tulsa 3,306 12 12 4 228
SOURCE: U.S. Department of Transportation, Federal Transit Administration, National Transit Database, available at http://www.ntdprogram.com/NTD/Profiles.nsf/ProfileInformation?OpenForm&2000&All as of Dec. 6, 2001.
Vehicles available for
maximum service
Capital funds
expended ($ millions)
Operating funds
expended ($ millions)
Average weekday unlinked
trips
Annual unlinked
passenger trips

Passenger Travel
1International travelers to the United States from Canada and Mexico are not included.
SOURCE: U.S. Department of Commerce, International Trade Administration, Office of Tourism Industries, Overseas Visitors to Select U.S. States and Territories 2000-1999 (Ranked by 2000 Market Share), Washington, DC: 2001, available at http://tinet.ita.doc.gov/ as of Oct. 19, 2001; U.S. Department of Commerce, International Trade Administration, Office of Tourism Industries, Overseas Visitors to Select U.S. States and Territories 1996-1995 , Washington, DC: 2001, available at http://tinet.ita.doc.gov/ as of Nov. 13, 2001.
KEY: S = data are unavailable due to low sampling size of overseas visitors.
Figure 4-2: Overseas Visitors to Oklahoma1
62
68
7371
73
S50
55
60
65
70
75
80
1995 1996 1997 1998 1999 2000
Vis
itors
(th
ousa
nds)
BTS State Transportation Profile D-3 Oklahoma

D-4

E Registered Vehicles andVehicle-Miles Traveled


Vehicles
Motor vehicle typeAll motor vehicles 2,999,108 73,029 3,072,137 225,821,241
Automobiles 1,575,442 11,673 1,587,115 133,621,420Buses 2,332 14,261 16,593 746,125Trucks1 1,364,050 46,733 1,410,783 87,107,628
Light trucks 1,191,533 U 1,191,533 77,796,827Farm trucks 167,741 U 167,741 1,885,170Truck tractors 13,307 U 13,307 1,587,611
Motorcycles 57,284 362 57,646 4,346,068
KEY: U = data are unavailable.
Type OklahomaTotal 193,556 21,541,490Private and commercial 191,509 21,283,681
Commercial trailers2 114,099 4,685,60665,774 14,113,392
House trailers 11,636 2,484,683
Publicly owned 2,047 257,809Federal government 36 4,277
2,011 253,532
Table 5-2: Oklahoma and U.S. Trailer and Semi-Trailer Registrations: 20001
Table 5-1: Oklahoma and U.S. Motor-Vehicle Registrations: 2000
3 Several states do not require the registration of light farm or automobile trailers.
Private and commercial
Publicly owned
Oklahoma total
United States total
SOURCE: U.S. Department of Transportation, Federal Highway Administration, Highway Statistics 2000 , Washington, DC: 2001, tables MV-1 and MV-9.
1Includes light trucks (pickups, vans, sport utility vehicles, and other light trucks) as well as medium and large trucks.
United States
NOTE: Mobile homes and house trailers are shown for states that require registration and are able to segregate them from other trailers. In states where this classification is not available, house trailers are included with light car trailers.
SOURCE: U.S. Department of Transportation, Federal Highway Administration, Highway Statistics 2000 , Washington, DC: 2001, table MV-11.
Light farm trailers, car trailers, etc.3
State, county, municipal government
1 The completeness of data on trailer registrations varies greatly among states. Data are reported to the extent available and, in some cases, are supplemented by estimates of the Federal Highway Administration.2 This row includes all commercial type vehicles and semi-trailers that are in private or for-hire use.
BTS State Transportation Profile E-1 Oklahoma

Vehicles
Table 5-3: Oklahoma Truck Characteristics and Use: 1997 (Percent unless otherwise specified)
Vehicular and operational characteristics
Vehicular and operational characteristics
Total, number (thousands) 1,373.5 205.9
Major use 100.0 100.0 Year model 100.0 100.0Agriculture 10.8 17.6 1 to 2 years old 13.7 21.3Forestry and lumbering 0.1 0.8 3 to 4 years old 14.6 17.6Mining and quarrying 1.7 4.9 Over 4 years old 71.6 61.1Construction 7.9 9.9Manufacturing 2.1 3.5 Vehicle acquisition 100.0 100.0Wholesale and retail trade 6.5 11.9 Purchased new 36.2 45.8For-hire transportation 6.0 38.6 Purchased used 59.1 40.9Utilities and service 4.7 5.2 Leased from someone or 4.7 13.3Personal transportation 55.3 0.9 not reportedOther and not reported 5.0 6.6
Truck type 100.0 100.0Body type 100.0 100.0 Single-unit trucks 90.3 43.6
Pickup, panel, minivan, and 85.0 NA 2 axles 89.3 36.6 sport utility 3 axles or more 1.0 7.0Platform and cattlerack 4.3 28.6 Combination 9.7 56.4Van 5.8 38.5 3 axles 0.4 1.5Public utility 0.4 2.5 4 axles 2.3 8.0Multistop or stepvans 0.7 4.6 5 axles or more 7.0 47.0Dump 0.8 5.2 Trailer not specified V VTank for liquids or dry bulk 0.9 5.7Other or not reported 2.2 14.9 Range of operation 100.0 100.0
Local 64.9 31.5Vehicle size 100.0 100.0 Short-range 16.7 18.1
Light 87.2 14.3 Long-range 9.3 38.8Medium 2.1 13.8 Off-the-road or not 9.2 11.5Light-heavy 1.2 8.2 reportedHeavy-heavy 9.5 63.7
Fuel type 100.0 100.0Annual miles driven 100.0 100.0 Gasoline 85.8 24.8
Less than 5,000 21.9 23.9 Diesel, liquefied gas, 13.3 70.75,000 to 9,999 14.3 8.1 and other 0.8 4.510,000 to 19,999 35.6 9.5 Not reported20,000 to 29,999 12.7 6.930,000 or more 15.4 51.6
KEY: NA = not applicable; V = less than .05 percent.
SOURCE: U.S. Department of Commerce, U.S. Census Bureau, Vehicle Inventory and Use Survey, state-specific report, Washington, DC: 1999, available at http://www.census.gov/econ/www/viusmain.html as of Dec. 27, 2001.
Trucks, excluding pickups,
panels, vans, sport utilities, and station
wagonsAll trucks
Trucks, excluding pickups,
panels, vans, sport utilities, and station
wagons All trucks
Oklahoma E-2 BTS State Transportation Profile

Vehicles
Table 5-4: Highway Vehicle-Miles Traveled (VMT): 2000
State State
Alabama 56,534 12,716 Montana 9,882 10,812Alaska 4,613 7,501 Nebraska 18,081 10,568Arizona 49,768 11,428 Nevada 17,639 9,504Arkansas 29,167 11,107 New Hampshire 12,021 9,687California 306,649 9,053 New Jersey 67,446 8,015Colorado 41,771 9,712 New Mexico 22,760 13,580Connecticut 30,756 9,057 New York 129,057 6,801Delaware 8,240 10,510 North Carolina 89,504 11,120Dist. of Columbia 3,498 6,115 North Dakota 7,217 11,241Florida 152,136 9,609 Ohio 105,898 9,328Georgia 105,010 12,969 Oklahoma 43,355 12,563Hawaii 8,543 7,014 Oregon 35,010 11,175Idaho 13,534 10,467 Pennsylvania 102,337 8,316Illinois 102,866 8,225 Rhode Island 8,359 8,326Indiana 70,862 12,779 South Carolina 45,538 7,971Iowa 29,433 10,059 South Dakota 8,432 11,168Kansas 28,130 10,599 Tennessee 65,732 11,698Kentucky 46,803 11,579 Texas 220,064 10,613Louisiana 40,849 9,430 Utah 22,597 11,226Maine 14,190 11,129 Vermont 6,811 11,184Maryland 50,174 9,809 Virginia 74,801 10,564Massachusetts 52,796 8,513 Washington 53,330 9,251Michigan 97,792 9,839 West Virginia 19,242 10,684Minnesota 52,601 10,693 Wisconsin 57,266 10,261Mississippi 35,536 12,187 Wyoming 8,090 16,410Missouri 67,083 11,990 United States 2,749,803 9,811
SOURCE FOR DATA ON THIS PAGE: U.S. Department of Transportation, Federal Highway Administration, Highway Statistics , annual editions, available at http://www.fhwa.dot. gov/ohim/ohimstat.htm as of Dec. 6, 2001.
VMT per capita
Total VMT (millions)
VMT per capita
Total VMT (millions)
Figure 5-1: Highway Vehicle-Miles Traveled, United States and Oklahoma
95
100
105
110
115
1995 1996 1997 1998 1999 2000
Index 1995 = 100
United States
Oklahoma
BTS State Transportation Profile E-3 Oklahoma

Federal-aid urbanized area1
Oklahoma City 4,714 25,980 1,083 647 1,674 4.4 24 746 11,975Tulsa 2,761 18,006 803 305 2,633 3.4 22 530 11,833Fort Smith 821 2,449 165 93 1,774 5.0 15 81 8,595Lawton 421 1,972 115 47 2,447 3.7 17 64 3,866
KEY: DVMT = daily vehicle-miles of travel; U = data are unavailable.
Table 5-5: Highway, Demographic, and Geographic Characteristics of Urbanized Areas in Oklahoma: 2000
Total DVMT per
capita
Total estimated
freeway lane miles2
Average daily traffic per
freeway lane mile
SOURCE: U.S. Department of Transportation, Federal Highway Administration, Highway Statistics, 2000, Washington, DC: 2001, available at http://www.fhwa.dot.gov/ohim/ohimstat.htm as of Dec. 6, 2001.
Total roadway
milesTotal DVMT (thousands)
Estimated population (thousands)
Net land area (square miles)
Persons per
square mile
Miles of roadway
per person
1A "federal-aid urbanized area" is an area with 50,000 or more persons that, at a minimum, encompasses the land area delineated as the urbanized area by the U.S. Census Bureau. Areas are ranked by population. 2Lane miles estimated by the Federal Highway Administration (FHWA).
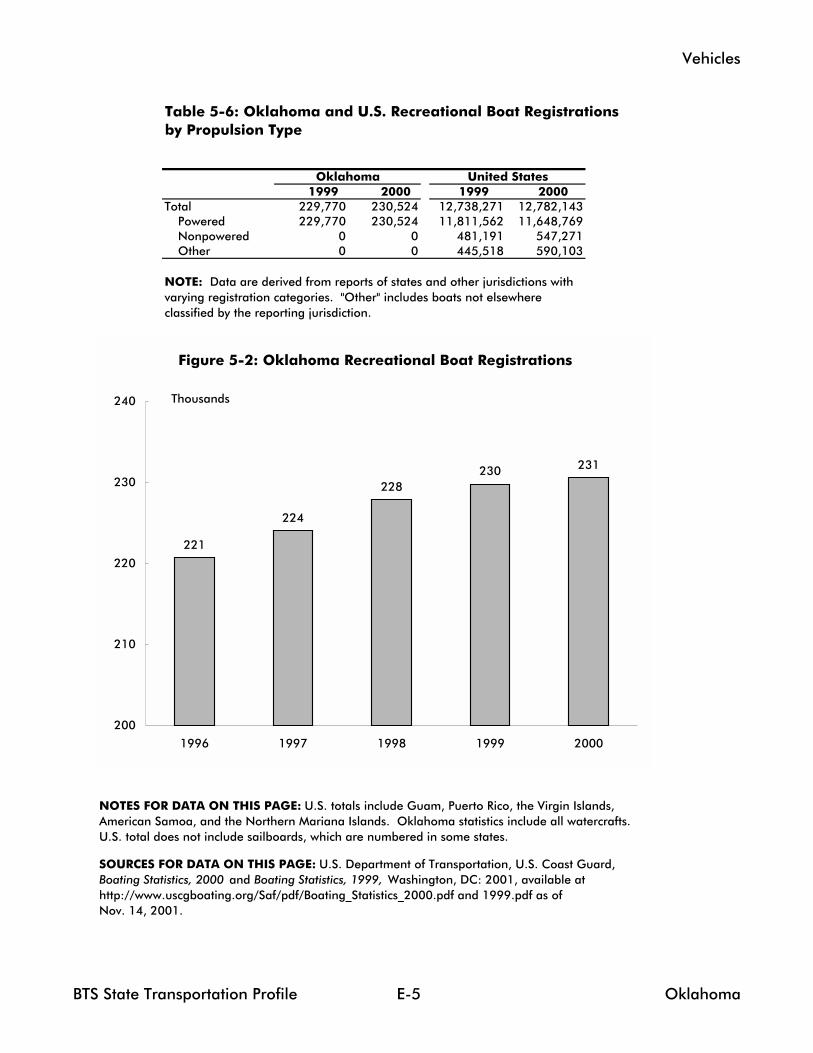
Vehicles
1999 2000 1999 2000 Total 229,770 230,524 12,738,271 12,782,143
Powered 229,770 230,524 11,811,562 11,648,769Nonpowered 0 0 481,191 547,271Other 0 0 445,518 590,103
Table 5-6: Oklahoma and U.S. Recreational Boat Registrations by Propulsion Type
SOURCES FOR DATA ON THIS PAGE: U.S. Department of Transportation, U.S. Coast Guard, Boating Statistics, 2000 and Boating Statistics, 1999, Washington, DC: 2001, available at http://www.uscgboating.org/Saf/pdf/Boating_Statistics_2000.pdf and 1999.pdf as of Nov. 14, 2001.
Oklahoma United States
NOTES FOR DATA ON THIS PAGE: U.S. totals include Guam, Puerto Rico, the Virgin Islands, American Samoa, and the Northern Mariana Islands. Oklahoma statistics include all watercrafts. U.S. total does not include sailboards, which are numbered in some states.
NOTE: Data are derived from reports of states and other jurisdictions with varying registration categories. "Other" includes boats not elsewhere classified by the reporting jurisdiction.
Figure 5-2: Oklahoma Recreational Boat Registrations
221
224
228230 231
200
210
220
230
240
1996 1997 1998 1999 2000
Thousands
BTS State Transportation Profile E-5 Oklahoma

Vehicles
Alabama 3,480 462Alaska 5,925 692Arizona 6,062 824Arkansas 2,660 442California 23,454 3,183Colorado 5,246 651Connecticut 1,793 241Delaware 2,068 303District of Columbia 152 13Florida 14,096 2,299Georgia 4,809 702Hawaii 435 184Idaho 2,328 336Illinois 7,478 998Indiana 3,964 503Iowa 2,772 331Kansas 3,611 494Kentucky 2,033 244Louisiana 3,012 677Maine 1,086 114Maryland 3,436 487Massachusetts 2,717 329Michigan 7,236 935Minnesota 5,141 707Mississippi 2,038 256Missouri 3,777 545Montana 2,374 271Nebraska 2,013 275Nevada 2,715 774New Hampshire 1,485 203New Jersey 3,791 583New Mexico 2,990 430New York 6,082 816North Carolina 5,620 769North Dakota 1,585 419Ohio 6,486 840Oklahoma 4,080 648Oregon 4,687 564Pennsylvania 5,648 724Rhode Island 393 45South Carolina 2,689 387South Dakota 1,376 157Tennessee 4,228 638Texas 18,869 2,980Utah 1,673 234Vermont 600 57Virginia 3,354 414Washington 7,166 912West Virginia 1,075 136Wisconsin 4,649 590Wyoming 778 98United States, total 217,215 30,916
Table 5-7: General Aviation and Air Taxi Aircraft and Hours Flown: 2000(Excludes commuter aircraft)
SOURCE: U.S. Department of Transportation, Federal Aviation Administration, General Aviation and Air Taxi Activity Survey: 2000 . Washington, DC: 2002, available at http://www.api.faa.gov/GASurvey/index.htm as of July 22, 2002.
NOTE: These data are derived from a sample survey of general aviation and air taxi aircraft. The data are estimates subject to sampling as well as nonsampling error.
Active aircraftHours flown (thousands)
Oklahoma E-6 BTS State Transportation Profile

Vehicles
Table 5-8: Active Aviation Pilots and Flight Instructors: 20001
Airplane pilots2
Alabama 7,262 1,170 3,065 1,649 1,084 294 920Alaska 8,638 833 3,686 2,130 1,906 83 1,118Arizona 17,429 2,329 6,508 3,345 4,654 593 2,617Arkansas 4,988 776 2,153 1,206 788 65 634California 71,053 10,173 31,571 13,448 12,786 3,075 8,984Colorado 17,539 2,320 6,256 3,144 5,138 681 2,549Connecticut 6,523 944 2,714 989 1,648 228 837Delaware 1,462 245 532 236 413 36 233District of Columbia 476 86 191 99 69 31 45Florida 47,191 6,672 16,324 10,059 13,267 869 6,890Georgia 18,087 2,441 6,053 2,845 6,448 300 2,107Hawaii 2,927 471 611 587 1,031 227 0Idaho 4,480 581 2,148 950 711 90 535Illinois 21,521 3,497 9,168 3,832 4,606 418 3,054Indiana 11,715 1,874 5,728 2,091 1,867 155 1,488Iowa 6,135 912 3,372 1,130 667 54 771Kansas 8,412 1,169 4,136 1,729 1,268 110 1,184Kentucky 6,720 988 2,397 1,155 2,104 76 919Louisiana 5,894 911 2,224 1,474 1,035 250 701Maine 3,105 444 1,494 608 522 37 384Maryland 8,383 1,217 3,499 1,535 1,869 263 1,194Massachusetts 9,692 1,583 4,535 1,711 1,480 383 1,242Michigan 17,755 3,008 8,517 3,008 2,852 370 2,388Minnesota 15,530 2,244 6,728 2,949 3,417 192 2,025Mississippi 4,111 594 1,595 1,086 750 86 490Missouri 11,070 1,549 5,008 2,045 2,312 156 1,548Montana 3,613 481 1,718 878 469 67 431Nebraska 4,141 654 2,054 884 524 25 432Nevada 6,270 691 2,131 1,141 2,095 212 864New Hampshire 4,242 499 1,544 676 1,417 106 613New Jersey 11,403 1,826 4,909 1,833 2,417 418 1,517New Mexico 4,406 787 1,788 916 772 143 549New York 18,649 3,628 8,020 3,305 2,819 877 2,516North Carolina 14,769 2,148 6,144 2,600 3,615 262 1,732North Dakota 2,458 401 1,153 688 199 17 292Ohio 19,301 3,065 8,602 3,338 3,857 439 2,839Oklahoma 8,654 1,392 3,839 1,893 1,453 77 1,180Oregon 9,942 1,625 4,972 1,910 1,175 260 1,123Pennsylvania 18,022 2,683 7,604 3,075 4,124 536 2,575Rhode Island 1,216 184 569 210 223 30 136South Carolina 6,363 933 2,708 1,343 1,244 135 714South Dakota 2,230 328 1,034 549 302 17 263Tennessee 12,132 1,675 4,351 2,024 3,826 256 1,600Texas 48,396 6,613 16,857 9,044 14,839 1,043 6,487Utah 6,591 1,205 2,678 1,116 1,468 124 768Vermont 1,487 220 681 261 264 61 162Virginia 14,640 1,987 5,114 2,835 4,299 405 2,055Washington 21,116 2,929 8,170 3,896 5,535 586 2,658West Virginia 1,992 312 953 399 293 35 274Wisconsin 11,275 1,768 5,682 1,884 1,830 111 1,455Wyoming 1,812 254 901 354 273 30 195United States, total 593,218 87,319 244,389 112,092 134,024 15,394 78,287
3Includes helicopter, glider, and recreational pilots. Does not include pilots holding an airplane certificate. A recreational pilot may fly no more than one passenger in a light, single engine aircraft with no more than four seats during good weather and daylight hours and, unless authorized, no more than 50 miles from the home airport.
1An active pilot is a person who holds a pilot certificate and a valid medical certificate issued within the last 25 months.
SOURCE: U.S. Department of Transportation, Federal Aviation Administration, U.S. Civil Airmen Statistics 2000 . Washington, DC: 2002, available at http://www.api.faa.gov/CivilAir/index.htm as of July 22, 2002.
NOTE: Excludes U.S. military personnel holding civilian certificates who are stationed in a foreign country and pilots in U.S. territories.
4Not included in total. A flight instructor must hold a flight instructor certificate in addition to a pilot certificate.
Airline transport Misc.3
Flight instructor4
2Includes pilots with an airplane only certificate and those with an airplane and a helicopter and/or glider certificate.
Total Students Private Commercial
BTS State Transportation Profile E-7 Oklahoma

E-8

F Economy and Finance


Economy and Finance
Business type
Total transportation and warehousing 2,260 33,588 1,020,604Air transportation 53 2,324 53,905Water transportation 2 0-19 DTruck transportation 1,507 18,781 544,400Transit and ground passenger transportation 57 500-999 DPipeline transportation 144 3,490 184,140Scenic and sightseeing transportation 6 0-19 DSupport activities for transportation 306 3,911 105,009Couriers and messengers 130 4,029 115,906Warehousing and storage 55 250-499 D
KEY: D = withheld to avoid disclosing data for individual companies.
Business type
Total transportation and warehousing 187,339 3,627,057 116,682,214Air transportation 5,285 582,838 24,414,357Water transportation 1,950 71,844 3,039,510Truck transportation 108,749 1,384,178 43,626,168Transit and ground passenger transportation 16,254 370,022 6,729,332Pipeline transportation 2,550 48,149 3,032,689Scenic and sightseeing transportation 2,267 22,877 540,702Support activities for transportation 31,392 440,175 14,915,625Couriers and messengers 11,938 578,368 16,725,960Warehousing and storage 6,954 128,606 3,657,871
Table 6-1: Transportation and Warehousing Establishments and Employment in Oklahoma: 1999
SOURCE FOR DATA ON THIS PAGE: U.S. Deparment of Commerce, U.S. Census Bureau, 1999 County Business Patterns , Washington, DC: May 2001, available at http://www.census.gov/epcd/cbp/view/ cbpview.html as of Oct. 25, 2001.
1 The transportation and warehousing sector (North American Industrial Classification System [NAICS] 48 and 49) includes industries providing transportation of passengers and cargo, warehousing and storage for goods, scenic and sightseeing transportation, and support activities related to modes of transportation. Establishments in these industries use transportation equipment or transportation related facilities as a productive asset. The type of equipment depends on the mode of transportation. The modes of transportation comprise air, rail, water, road, and pipeline.
Establishments1
(number)Number of employees
Annual payroll ($ thousands)
Establishments1
(number)Number of employees
Annual payroll ($ thousands)
Table 6-2: Transportation and Warehousing Establishments and Employment in the United States: 1999
BTS State Transportation Profile F-1 Oklahoma

Economy and Finance
Table 6-3: Transportation Revenues Collected by State and Local Governments in Oklahoma($ millions)
ModeTotal (current $) 957 72 980 87 1,019 87 1,074 90 1,100 102 Highway 957 11 980 10 1,019 11 1,074 11 1,100 17 Transit Z 4 Z 4 Z 4 Z 5 Z 5 Air Z 56 Z 71 Z 71 Z 73 Z 79 Water Z 2 Z 2 Z 1 Z 1 Z 1
Total (chained 1996 $) 979 74 980 87 993 85 1,030 86 1,028 96 Highway 979 11 980 10 993 11 1,030 11 1,028 16 Transit Z 4 Z 4 Z 4 Z 4 Z 5 Air Z 58 Z 71 Z 69 Z 70 Z 74 Water Z 2 Z 2 Z 1 Z 1 Z 1
Table 6-4: Transportation Expenditures by State and Local Governments in Oklahoma1
($ millions)
ModeTotal (current $) 528 425 618 403 587 449 635 454 769 481 Highway 528 320 618 331 586 359 635 372 769 360 Transit Z 20 Z 25 Z 26 Z 29 Z 36 Air 0 84 0 47 0 62 1 54 0 84 Water Z Z 0 Z 0 2 0 Z 0 Z
Total (chained 1996 $) 540 435 618 403 572 437 609 435 719 449 Highway 540 328 618 331 572 350 609 356 718 337 Transit Z 21 Z 25 Z 25 Z 28 Z 34 Air 0 86 0 47 0 60 1 51 0 79 Water Z Z 0 Z 0 2 0 Z 0 Z
1Includes federal grants.
KEY FOR DATA ON THIS PAGE: Z = zero or less than 1 unit of measure.
1995 1996 1997 1998 1999State Local State Local
1995 1996State
1997 1998 1999State Local State Local State Local State Local
NOTE FOR DATA ON THIS PAGE: Dollars are converted using a chain-type price index from U.S. Department of Commerce, Bureau of Economic Analysis, National Income and Product Accounts Tables, Washington, DC, 2001, table 7.1, available at http://www.bea.doc.gov/bea/dn/nipaweb/ as of Dec. 12, 2001.
SOURCE FOR DATA ON THIS PAGE: U.S. Department of Commerce, U.S. Census Bureau, State and Local Government Finance Estimates, available at ftp://ftp.census.gov/pub/outgoing/govs/ as of October 2001.
Local
State LocalLocal State Local State
Oklahoma F-2 BTS State Transportation Profile

Economy and Finance
Table 6-5: State Motor-Fuel Tax Rates: 2000(Cents per gallon)
State Gasoline DieselAlabama 18.00 19.00 17.00 18.00Alaska 8.00 8.00 0.00 0.00Arizona 18.00 27.00 18.00 18.00Arkansas 19.50 20.50 16.50 18.60California 18.00 18.00 6.00 18.00Colorado 22.00 20.50 20.50 22.00Connecticut 32.00 18.00 0.00 31.00Delaware 23.00 22.00 22.00 23.00District of Columbia 20.00 20.00 20.00 20.00Florida 13.10 25.10 16.00 13.10Georgia 7.50 7.50 7.50 7.50Hawaii 16.00 16.00 11.00 16.00Idaho 25.00 25.00 18.10 22.50Illinois 19.00 21.50 19.00 19.00Indiana 15.00 16.00 0.00 15.00Iowa 20.00 22.50 20.00 19.00Kansas 20.00 22.00 19.00 20.00Kentucky 16.40 13.40 15.00 16.40Louisiana 20.00 20.00 16.00 20.00Maine 19.00 20.00 18.00 19.00Maryland 23.50 24.25 23.50 23.50Massachusetts 21.00 21.00 8.10 21.00Michigan 19.00 15.00 15.00 19.00Minnesota 20.00 20.00 15.00 20.00Mississippi 18.40 18.40 17.00 18.40Missouri 17.00 17.00 17.00 17.00Montana 27.00 27.75 0.00 27.00Nebraska 22.80 22.80 22.80 22.80Nevada 24.75 27.75 22.00 24.75New Hampshire 19.50 19.50 18.00 19.50New Jersey 10.50 13.50 5.25 10.50New Mexico 18.50 19.50 0.00 18.50New York 29.30 27.95 8.00 29.30North Carolina 21.20 21.20 21.20 21.20North Dakota 21.00 21.00 21.00 21.00Ohio 22.00 22.00 22.00 22.00Oklahoma 17.00 14.00 17.00 17.00Oregon 24.00 24.00 24.00 24.00Pennsylvania 25.90 30.80 18.90 25.90Rhode Island 29.00 29.00 29.00 29.00South Carolina 16.00 16.00 16.00 16.00South Dakota 22.00 22.00 20.00 20.00Tennessee 20.00 17.00 14.00 20.00Texas 20.00 20.00 15.00 20.00Utah 24.50 24.50 24.50 24.50Vermont 20.00 17.00 0.00 20.00Virginia 17.50 16.00 10.00 17.50Washington 23.00 23.00 0.00 23.00West Virginia 25.35 25.35 25.35 25.35Wisconsin 25.40 25.40 25.40 25.40Wyoming 14.00 14.00 0.00 14.00Federal tax 18.40 24.40 13.60 13.001 Tax rates for gasoline blended with 10 percent ethanol.
NOTE: Tax rates in effect as of Jan. 1, 2000.
Liquified petroleum
gas Gasohol1
SOURCE: U.S. Department of Transportation, Federal Highway Administration, Highway Statistics 2000, Washington, DC: 2001, table MF-121T.
BTS State Transportation Profile F-3 Oklahoma

F-4

G Energy and Environment

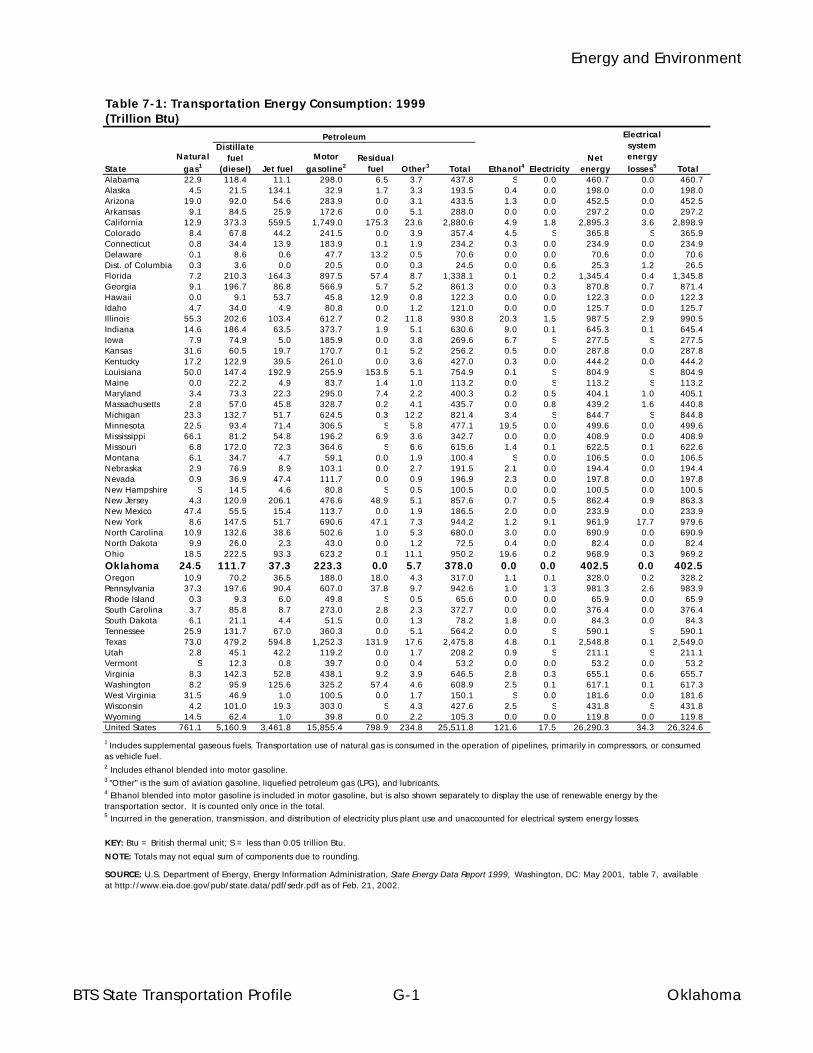
Energy and Environment
(Trillion Btu)
StateAlabama 22.9 118.4 11.1 298.0 6.5 3.7 437.8 S 0.0 460.7 0.0 460.7Alaska 4.5 21.5 134.1 32.9 1.7 3.3 193.5 0.4 0.0 198.0 0.0 198.0Arizona 19.0 92.0 54.6 283.9 0.0 3.1 433.5 1.3 0.0 452.5 0.0 452.5Arkansas 9.1 84.5 25.9 172.6 0.0 5.1 288.0 0.0 0.0 297.2 0.0 297.2California 12.9 373.3 559.5 1,749.0 175.3 23.6 2,880.6 4.9 1.8 2,895.3 3.6 2,898.9Colorado 8.4 67.8 44.2 241.5 0.0 3.9 357.4 4.5 S 365.8 S 365.9Connecticut 0.8 34.4 13.9 183.9 0.1 1.9 234.2 0.3 0.0 234.9 0.0 234.9Delaware 0.1 8.6 0.6 47.7 13.2 0.5 70.6 0.0 0.0 70.6 0.0 70.6Dist. of Columbia 0.3 3.6 0.0 20.5 0.0 0.3 24.5 0.0 0.6 25.3 1.2 26.5Florida 7.2 210.3 164.3 897.5 57.4 8.7 1,338.1 0.1 0.2 1,345.4 0.4 1,345.8Georgia 9.1 196.7 86.8 566.9 5.7 5.2 861.3 0.0 0.3 870.8 0.7 871.4Hawaii 0.0 9.1 53.7 45.8 12.9 0.8 122.3 0.0 0.0 122.3 0.0 122.3Idaho 4.7 34.0 4.9 80.8 0.0 1.2 121.0 0.0 0.0 125.7 0.0 125.7Illinois 55.3 202.6 103.4 612.7 0.2 11.8 930.8 20.3 1.5 987.5 2.9 990.5Indiana 14.6 186.4 63.5 373.7 1.9 5.1 630.6 9.0 0.1 645.3 0.1 645.4Iowa 7.9 74.9 5.0 185.9 0.0 3.8 269.6 6.7 S 277.5 S 277.5Kansas 31.6 60.5 19.7 170.7 0.1 5.2 256.2 0.5 0.0 287.8 0.0 287.8Kentucky 17.2 122.9 39.5 261.0 0.0 3.6 427.0 0.3 0.0 444.2 0.0 444.2Louisiana 50.0 147.4 192.9 255.9 153.5 5.1 754.9 0.1 S 804.9 S 804.9Maine 0.0 22.2 4.9 83.7 1.4 1.0 113.2 0.0 S 113.2 S 113.2Maryland 3.4 73.3 22.3 295.0 7.4 2.2 400.3 0.2 0.5 404.1 1.0 405.1Massachusetts 2.8 57.0 45.8 328.7 0.2 4.1 435.7 0.0 0.8 439.2 1.6 440.8Michigan 23.3 132.7 51.7 624.5 0.3 12.2 821.4 3.4 S 844.7 S 844.8Minnesota 22.5 93.4 71.4 306.5 S 5.8 477.1 19.5 0.0 499.6 0.0 499.6Mississippi 66.1 81.2 54.8 196.2 6.9 3.6 342.7 0.0 0.0 408.9 0.0 408.9Missouri 6.8 172.0 72.3 364.6 S 6.6 615.6 1.4 0.1 622.5 0.1 622.6Montana 6.1 34.7 4.7 59.1 0.0 1.9 100.4 S 0.0 106.5 0.0 106.5Nebraska 2.9 76.9 8.9 103.1 0.0 2.7 191.5 2.1 0.0 194.4 0.0 194.4Nevada 0.9 36.9 47.4 111.7 0.0 0.9 196.9 2.3 0.0 197.8 0.0 197.8New Hampshire S 14.5 4.6 80.8 S 0.5 100.5 0.0 0.0 100.5 0.0 100.5New Jersey 4.3 120.9 206.1 476.6 48.9 5.1 857.6 0.7 0.5 862.4 0.9 863.3New Mexico 47.4 55.5 15.4 113.7 0.0 1.9 186.5 2.0 0.0 233.9 0.0 233.9New York 8.6 147.5 51.7 690.6 47.1 7.3 944.2 1.2 9.1 961.9 17.7 979.6North Carolina 10.9 132.6 38.6 502.6 1.0 5.3 680.0 3.0 0.0 690.9 0.0 690.9North Dakota 9.9 26.0 2.3 43.0 0.0 1.2 72.5 0.4 0.0 82.4 0.0 82.4Ohio 18.5 222.5 93.3 623.2 0.1 11.1 950.2 19.6 0.2 968.9 0.3 969.2Oklahoma 24.5 111.7 37.3 223.3 0.0 5.7 378.0 0.0 0.0 402.5 0.0 402.5Oregon 10.9 70.2 36.5 188.0 18.0 4.3 317.0 1.1 0.1 328.0 0.2 328.2Pennsylvania 37.3 197.6 90.4 607.0 37.8 9.7 942.6 1.0 1.3 981.3 2.6 983.9Rhode Island 0.3 9.3 6.0 49.8 S 0.5 65.6 0.0 0.0 65.9 0.0 65.9South Carolina 3.7 85.8 8.7 273.0 2.8 2.3 372.7 0.0 0.0 376.4 0.0 376.4South Dakota 6.1 21.1 4.4 51.5 0.0 1.3 78.2 1.8 0.0 84.3 0.0 84.3Tennessee 25.9 131.7 67.0 360.3 0.0 5.1 564.2 0.0 S 590.1 S 590.1Texas 73.0 479.2 594.8 1,252.3 131.9 17.6 2,475.8 4.8 0.1 2,548.8 0.1 2,549.0Utah 2.8 45.1 42.2 119.2 0.0 1.7 208.2 0.9 S 211.1 S 211.1Vermont S 12.3 0.8 39.7 0.0 0.4 53.2 0.0 0.0 53.2 0.0 53.2Virginia 8.3 142.3 52.8 438.1 9.2 3.9 646.5 2.8 0.3 655.1 0.6 655.7Washington 8.2 95.9 125.6 325.2 57.4 4.6 608.9 2.5 0.1 617.1 0.1 617.3West Virginia 31.5 46.9 1.0 100.5 0.0 1.7 150.1 S 0.0 181.6 0.0 181.6Wisconsin 4.2 101.0 19.3 303.0 S 4.3 427.6 2.5 S 431.8 S 431.8Wyoming 14.5 62.4 1.0 39.8 0.0 2.2 105.3 0.0 0.0 119.8 0.0 119.8United States 761.1 5,160.9 3,461.8 15,855.4 798.9 234.8 25,511.8 121.6 17.5 26,290.3 34.3 26,324.6
Table 7-1: Transportation Energy Consumption: 1999
Petroleum Electrical system energy losses5 Total
Motor gasoline2Jet fuel
Net energyTotal Ethanol4 Electricity
Natural gas1
Distillate fuel
(diesel)Residual
fuel Other3
KEY: Btu = British thermal unit; S = less than 0.05 trillion Btu.
NOTE: Totals may not equal sum of components due to rounding.
SOURCE: U.S. Department of Energy, Energy Information Administration, State Energy Data Report 1999, Washington, DC: May 2001, table 7, available at http://www.eia.doe.gov/pub/state.data/pdf/sedr.pdf as of Feb. 21, 2002.
1 Includes supplemental gaseous fuels. Transportation use of natural gas is consumed in the operation of pipelines, primarily in compressors, or consumed as vehicle fuel.2 Includes ethanol blended into motor gasoline.3 "Other" is the sum of aviation gasoline, liquefied petroleum gas (LPG), and lubricants.4 Ethanol blended into motor gasoline is included in motor gasoline, but is also shown separately to display the use of renewable energy by the transportation sector. It is counted only once in the total.5 Incurred in the generation, transmission, and distribution of electricity plus plant use and unaccounted for electrical system energy losses.
BTS State Transportation Profile G-1 Oklahoma

Energy and Environment
(Trillion Btu)
StateAlabama 2,004.8 460.7 23.0 341.0 17.0 226.3 11.3 976.7 48.7Alaska 694.7 198.0 28.5 47.7 6.9 63.1 9.1 385.9 55.5Arizona 1,219.8 452.5 37.1 279.0 22.9 266.7 21.9 221.6 18.2Arkansas 1,203.7 297.2 24.7 193.3 16.1 123.8 10.3 589.4 49.0California 8,375.4 2,898.9 34.6 1,416.2 16.9 1,236.5 14.8 2,823.7 33.7Colorado 1,155.5 365.9 31.7 261.4 22.6 255.1 22.1 273.1 23.6Connecticut 839.3 234.9 28.0 245.2 29.2 196.8 23.4 162.4 19.3Delaware 278.8 70.6 25.3 56.0 20.1 44.8 16.1 107.4 38.5District of Columbia 169.8 26.5 15.6 33.5 19.7 106.2 62.5 3.7 2.2Florida 3,852.9 1,345.8 34.9 1,017.8 26.4 809.5 21.0 679.8 17.6Georgia 2,798.1 871.4 31.1 553.1 19.8 416.3 14.9 957.3 34.2Hawaii 241.4 122.3 50.7 23.0 9.5 24.8 10.3 71.3 29.5Idaho 518.3 125.7 24.3 95.9 18.5 86.9 16.8 209.8 40.5Illinois 3,882.6 990.5 25.5 897.4 23.1 722.0 18.6 1,272.6 32.8Indiana 2,735.8 645.4 23.6 483.6 17.7 300.7 11.0 1,306.2 47.7Iowa 1,121.7 277.5 24.7 222.5 19.8 158.5 14.1 463.3 41.3Kansas 1,050.0 287.8 27.4 200.9 19.1 169.2 16.1 392.2 37.4Kentucky 1,830.2 444.2 24.3 315.9 17.3 219.0 12.0 851.1 46.5Louisiana 3,615.4 804.9 22.3 325.0 9.0 236.5 6.5 2,249.0 62.2Maine 528.6 113.2 21.4 97.6 18.5 57.6 10.9 260.2 49.2Maryland 1,378.2 405.1 29.4 358.6 26.0 337.1 24.5 277.4 20.1Massachusetts 1,569.1 440.8 28.1 411.7 26.2 325.2 20.7 391.4 24.9Michigan 3,239.6 844.8 26.1 744.3 23.0 568.1 17.5 1,082.5 33.4Minnesota 1,675.3 499.6 29.8 340.2 20.3 217.9 13.0 617.7 36.9Mississippi 1,208.5 408.9 33.8 202.6 16.8 145.6 12.0 451.4 37.4Missouri 1,768.0 622.6 35.2 431.7 24.4 334.1 18.9 379.6 21.5Montana 412.4 106.5 25.8 61.8 15.0 48.0 11.6 196.1 47.6Nebraska 602.0 194.4 32.3 130.0 21.6 111.3 18.5 166.2 27.6Nevada 615.3 197.8 32.1 122.4 19.9 97.1 15.8 198.0 32.2New Hampshire 335.4 100.5 30.0 81.9 24.4 56.2 16.8 96.9 28.9New Jersey 2,588.7 863.3 33.3 539.9 20.9 540.8 20.9 644.7 24.9New Mexico 635.0 233.9 36.8 93.2 14.7 105.6 16.6 202.4 31.9New York 4,283.0 979.6 22.9 1,092.3 25.5 1,216.1 28.4 994.9 23.2North Carolina 2,446.9 690.9 28.2 562.7 23.0 439.5 18.0 753.7 30.8North Dakota 365.7 82.4 22.5 54.2 14.8 42.6 11.6 186.4 51.0Ohio 4,323.4 969.2 22.4 866.7 20.0 632.1 14.6 1,855.3 42.9Oklahoma 1,377.5 402.5 29.2 259.1 18.8 197.7 14.4 518.2 37.6Oregon 1,109.2 328.2 29.6 238.4 21.5 190.5 17.2 352.1 31.7Pennsylvania 3,715.5 983.9 26.5 858.6 23.1 582.6 15.7 1,290.4 34.7Rhode Island 261.1 65.9 25.2 66.0 25.3 52.2 20.0 77.0 29.5South Carolina 1,493.0 376.4 25.2 288.1 19.3 210.3 14.1 618.2 41.4South Dakota 239.0 84.3 35.3 53.3 22.3 39.2 16.4 62.2 26.0Tennessee 2,070.5 590.1 28.5 441.5 21.3 328.1 15.8 710.8 34.3Texas 11,501.0 2,549.0 22.2 1,323.3 11.5 1,147.2 10.0 6,481.5 56.4Utah 693.9 211.1 30.4 127.5 18.4 120.2 17.3 235.1 33.9Vermont 165.0 53.2 32.2 42.6 25.8 29.4 17.8 39.9 24.2Virginia 2,227.3 655.7 29.4 494.4 22.2 462.8 20.8 614.4 27.6Washington 2,240.8 617.3 27.5 435.7 19.4 332.0 14.8 855.9 38.2West Virginia 735.4 181.6 24.7 141.9 19.3 101.0 13.7 310.8 42.3Wisconsin 1,810.5 431.8 23.8 375.8 20.8 285.4 15.8 717.4 39.6Wyoming 421.8 119.8 28.4 35.9 8.5 42.1 10.0 224.0 53.1United States 95,682.4 26,324.6 27.5 18,382.3 19.2 15,058.5 15.7 35,917.1 37.5
KEY: Btu = British thermal unit; Number = trillion Btu.
Table 7-2: Energy Consumption by End-Use Sector: 1999
Number Percent NumberNumber PercentTransportation Residential
1 U.S. total energy and U.S. industrial sector include 57.7 trillion Btu of net imports of coal coke that is not allocated to the states. State and U.S. totals include 92.6 trillion Btu of net imports of electricity generated from nonrenewable energy sources.2 End-use sector data include electricity sales and associated electrical system energy losses.
SOURCE: U.S. Department of Energy, Energy Information Administration, State Energy Data Report 1999, Washington, DC: May 2001, available at http://www.eia.doe.gov/pub/state.data/pdf/sedr.pdf as of Feb. 21, 2002.
End-use sectors2
Total energy consumed1 Percent
IndustrialNumber Percent
Commercial
Oklahoma G-2 BTS State Transportation Profile

Energy and Environment
Figure 7-1: Energy Consumption by End-Use Sector: 1999
SOURCE: U.S. Department of Energy, Energy Information Administration, State Energy Data Report 1999, Washington, DC: May 2001, table 9, available at http://www.eia.doe.gov/pub/state.data/pdf/sedr.pdf as of Feb. 21, 2002.
Oklahoma
Transportation29%
Residential19%
Industrial38%
Commercial14%
United States
Transportation28%
Residential19%
Industrial37%
Commercial16%
BTS State Transportation Profile G-3 Oklahoma

Energy and Environment
KEY: Btu = British thermal units.
SOURCE: U.S. Department of Energy, Energy Information Administration, State Energy Data Report 1999, Washington, DC: May 2001, available at http://www.eia.doe.gov/pub/state.data/pdf/sedr.pdf as of Feb. 21, 2002.
Figure 7-2: Oklahoma Transportation Energy Consumption
8396
102 106112
30 27 30 3037
215222
216 219 223
0
50
100
150
200
250
1995 1996 1997 1998 1999
Distillate fuel (diesel) Jet fuel Motor gasolineTrillion Btu
Oklahoma G-4 BTS State Transportation Profile

Energy and Environment
StateAlabama 4,370 437.8 100.2 460.7 105.4Alaska 620 193.5 312.1 198.0 319.4Arizona 4,778 433.5 90.7 452.5 94.7Arkansas 2,551 288.0 112.9 297.2 116.5California 33,145 2,880.6 86.9 2,898.9 87.5Colorado 4,056 357.4 88.1 365.9 90.2Connecticut 3,282 234.2 71.4 234.9 71.6Delaware 754 70.6 93.6 70.6 93.6District of Columbia 519 24.5 47.2 26.5 51.1Florida 15,111 1,338.1 88.6 1,345.8 89.1Georgia 7,788 861.3 110.6 871.4 111.9Hawaii 1,185 122.3 103.2 122.3 103.2Idaho 1,252 121.0 96.6 125.7 100.4Illinois 12,128 930.8 76.7 990.5 81.7Indiana 5,943 630.6 106.1 645.4 108.6Iowa 2,869 269.6 94.0 277.5 96.7Kansas 2,654 256.2 96.5 287.8 108.4Kentucky 3,961 427.0 107.8 444.2 112.1Louisiana 4,372 754.9 172.7 804.9 184.1Maine 1,253 113.2 90.3 113.2 90.3Maryland 5,172 400.3 77.4 405.1 78.3Massachusetts 6,175 435.7 70.6 440.8 71.4Michigan 9,864 821.4 83.3 844.8 85.6Minnesota 4,776 477.1 99.9 499.6 104.6Mississippi 2,768 342.7 123.8 408.9 147.7Missouri 5,468 615.6 112.6 622.6 113.9Montana 883 100.4 113.7 106.5 120.6Nebraska 1,666 191.5 114.9 194.4 116.7Nevada 1,809 196.9 108.8 197.8 109.3New Hampshire 1,201 100.5 83.7 100.5 83.7New Jersey 8,143 857.6 105.3 863.3 106.0New Mexico 1,740 186.5 107.2 233.9 134.4New York 18,197 944.2 51.9 979.6 53.8North Carolina 7,651 680.0 88.9 690.9 90.3North Dakota 634 72.5 114.4 82.4 130.0Ohio 11,257 950.2 84.4 969.2 86.1Oklahoma 3,358 378.0 112.6 402.5 119.9Oregon 3,316 317.0 95.6 328.2 99.0Pennsylvania 11,994 942.6 78.6 983.9 82.0Rhode Island 991 65.6 66.2 65.9 66.5South Carolina 3,886 372.7 95.9 376.4 96.9South Dakota 733 78.2 106.7 84.3 115.0Tennessee 5,484 564.2 102.9 590.1 107.6Texas 20,044 2,475.8 123.5 2,549.0 127.2Utah 2,130 208.2 97.7 211.1 99.1Vermont 594 53.2 89.6 53.2 89.6Virginia 6,873 646.5 94.1 655.7 95.4Washington 5,756 608.9 105.8 617.3 107.2West Virginia 1,807 150.1 83.1 181.6 100.5Wisconsin 5,250 427.6 81.4 431.8 82.2Wyoming 480 105.3 219.4 119.8 249.6United States 272,691 25,511.8 93.6 26,324.6 96.5 1 Calculated by the Bureau of Transportation Statistics.
KEY: Btu = British thermal unit.
SOURCE: U.S. Department of Energy, Energy Information Administration, State Energy Data Report 1999, Washington, DC: May 2001, available at http://www.eia.doe.gov/pub/state.data/pdf/sedr.pdf as of Feb. 21, 2002.
Table 7-3: Transportation Energy Consumption per Capita: 1999
Per capita1
(million Btu)Total
(trillion Btu)Total
(trillion Btu)Per capita1
(million Btu)
All energy sourcesPetroleum
Population (thousands)
BTS State Transportation Profile G-5 Oklahoma

Energy and Environment
(Millions of gallons)
Vehicle ownership
Private and commercial 1,716 126,735 50 2,876 729 33,377 2,495 162,988
Public use 33 2,149 2 96 N N 35 2,245Total 1,749 128,884 52 2,972 729 33,377 2,530 165,232
KEY: N = data do not exist.
United States
Table 7-4: Oklahoma and U.S. Motor-Fuel Use: 20001
Gasoline Special fuel (mainly diesel) Total useHighway use Nonhighway use
1Based on reports from state motor-fuel tax agencies. Gasohol is included with gasoline. Public use and nonhighway use were estimated by the Federal Highway Administration.
SOURCE: U.S. Department of Transportation, Federal Highway Administration, Highway Statistics 2000 , Washington, DC: October 2001, available at http://www.fhwa.dot.gov/ohim/hs00/pdf/mf21.pdf as of Apr. 20, 2002.
NOTE: The term "motor fuel" applies to gasoline and all other fuels, including special fuels, coming under the purview of the state motor-fuel tax laws. "Special fuels" include diesel fuel and, to the extent they can be quantified, liquefied petroleum gases such as propane. Gasohol, a blend of gasoline and fuel alcohol, is included with gasoline.
OklahomaUnited States Oklahoma Oklahoma
United States
United States Oklahoma
Oklahoma G-6 BTS State Transportation Profile

Energy and Environment
StateAlabama 0 0Alaska 9,338 2,742,486Arizona 48,593 15,130,670Arkansas 1,989 653,497California 777,160 487,177,331Colorado 104,377 45,351,408Connecticut 46,049 28,335,802Delaware 1,262 242,013District of Columbia 0 0Florida 70,991 62,276,735Georgia 33,530 20,247,589Hawaii 3,103 1,743,452Idaho 200 583,002Illinois 97,803 70,985,221Indiana 18,568 20,297,106Iowa 7,857 3,215,640Kansas 2,103 2,082,034Kentucky 8,249 5,306,199Louisiana 12,077 5,974,212Maine 561 292,861Maryland 99,587 153,227,923Massachusetts 10,250 5,259,055Michigan 67,071 60,139,968Minnesota 101,811 62,694,176Mississippi 0 0Missouri 6,113 4,179,360Montana 0 0Nebraska 5,060 4,026,138Nevada 17,847 10,855,220New Hampshire 6,392 5,785,519New Jersey 142,055 210,429,029New Mexico 21,196 9,306,885New York 110,698 116,448,616North Carolina 45,977 24,702,615North Dakota 0 0Ohio 138,197 68,064,386Oklahoma 13,186 4,229,909Oregon 72,552 30,075,899Pennsylvania 83,526 88,259,488Rhode Island 0 0South Carolina 2,665 1,713,629South Dakota 0 0Tennessee 28,846 20,574,450Texas 55,310 39,635,228Utah 70,260 24,841,367Vermont 1,004 356,344Virginia1 153,313 143,003,313Washington 74,812 32,296,683West Virginia 408 170,529Wisconsin 29,730 28,768,150Wyoming 293 100,271United States 2,611,953 1,931,107,534
1Includes 4,061 meters of federal barriers on the Dulles Access Highway.
Total length (meters)
Barrier cost ($ 1998)
SOURCE: U.S. Department of Transportation, Federal Highway Administration, Office of Planning, Environment, and Real Estate, available at http://www.fhwa.dot.gov/environment/ab_noise.htm as of Feb. 20, 2002.
Table 7-5: Highway Noise Barriers: 1999
BTS State Transportation Profile G-7 Oklahoma

G-8
H Information onData Sources


Data Sources
BTS State Transportation Profile H-1 Oklahoma
Airline freight and passenger dataThe U.S. Department of Transportation’s(USDOT) Bureau of Transportation Statistics(BTS) collects and compiles data on thevolume of revenue passengers, freight, andmail traffic handled and reported by thenation’s large certificated air carriers. Thesecarriers hold Certificates of PublicConvenience and Necessity (CPN) issued bythe USDOT authorizing the performance of airtransportation. Large certificated air carriersoperate aircraft with seating capacity of morethan 60 seats or a maximum payload capacityof more than 18,000 pounds or conductinternational operations. Data for commuters,intrastate, nonscheduled air taxi operators, andforeign flag air carriers are not included in thisBTS data.
Additional information:
Contact: USDOT, Bureau of TransportationStatistics, Office of Airline Information
Print source: USDOT, Bureau ofTransportation Statistics, Office of AirlineInformation. Airport Activity Statistics.Washington, DC: Annual issues.
Internet: http://www.bts.gov
Commodity Flow SurveyThe Commodity Flow Survey (CFS) providesdata on the movement of freight by type ofcommodity shipped and by mode of transport.In 1997, 100,000 domestic establishmentswere randomly selected from a universe ofapproximately 800,000 engaged in mining,manufacturing, wholesale, warehouses ofmulti-establishment companies, and someselected activities in retail and service. Thesurvey excluded establishments classified asfarms, forestry, fisheries, governments,construction, transportation, foreignestablishments, services, and most
establishments in retail. For the 1997 CFS,each selected establishment reported a sampleof about 25 outbound shipments for a one-week period in each of four calendar quartersin 1997. This produced a total sample of over5 million shipments. Due to industry-widereporting problems, shipments by oil and gasextraction establishments were excluded fromdata tabulations.
For each sampled 1997 CFS shipment, zipcode of origin and destination, 5-digitStandard Classification of Transported Goods(SCTG) code, weight, value, and modes oftransport were provided. Information onwhether the shipment was containerized, ahazardous material, or an export was alsoobtained. Route-distance for each mode, foreach shipment, is imputed from a Mode-Distance Table developed by Oak RidgeNational Laboratory. Distance was used tocompute ton-mileage by mode of transport.The CFS provides nationwide geographiccoverage in 89 National TransportationAnalysis Regions, stratified by state and, forthe 1997 CFS, metropolitan area.
Additional information:
Contact: USDOT, Bureau of TransportationStatistics, Office of Statistical Programs
Print source: USDOT, Bureau ofTransportation Statistics and U.S. Departmentof Commerce, Bureau of the Census, [state]:1997 Commodity Flow Survey. EC97TCF-[state], Washington, DC: 1999.
Internet: http://www.bts.gov/ntda/cfs/
Commuting dataCommuting data are derived from the Census2000 Supplementary Survey (C2SS). TheC2SS used the questionnaire and methodsdeveloped for the American CommunitySurvey to collect demographic, social,

Data Sources
Oklahoma H-2 BTS State Transportation Profile
economic, and housing data from a nationalsample of 700,000 households. Group quarterswere not included in the sample. The C2SSwas conducted in 1,203 counties with monthlysamples of about 58,000 housing units.Economic, demographic, and housingcharacteristics from the Census 2000Supplementary Survey are reported for theUnited States as a whole, the 50 states, and theDistrict of Columbia.
The Census 2000 Supplementary Survey is notdirectly comparable with the 1990 Census forseveral reasons, one being that the former didnot include group quarters. This mayunderstate some categories such as walking.
Additional information:
Contact: USDOC, U.S. Census Bureau,Demographic Surveys Division
Internet: http://www.census.gov
Gas and hazardous liquid pipeline dataU.S. fatality and injury data for natural gaspipelines and hazardous liquid pipelines arebased on reports filed with the U.S.Department of Transportation, Office ofPipeline Safety (OPS) under 49 CFR 191.Accidents must be reported as soon aspossible, but no later than 30 days afterdiscovery. Undetected releases are a possiblesource of error; even if subsequently detectedand reported, it may not be possible toaccurately reconstruct the accident. Propertydamage figures are estimates.
Gas pipeline incidents involve: 1) releases ofgas from a pipeline or liquefied natural gas(LNG) or gas from an LNG facility that resultsin a) death or personal injury necessitating in-patient hospitalization, or b) estimatedproperty damage, including cost of gas lost, ofthe operator or others, or both, of $50,000 ormore; 2) an event that results in an emergency
shutdown of an LNG facility; or 3) an eventthat is significant, in the judgment of theoperator, even though it did not meet thecriteria of 1) or 2).
For hazardous liquids pipelines, an accidentreport is required for each failure in a pipelinesystem in which there is a release of thehazardous liquid or carbon dioxide transportedresulting in any of the following: 1) explosionor fire not intentionally set by the operator; 2)loss of 50 or more barrels (8 or more cubicmeters) of hazardous liquid or carbon dioxide;3) escape to the atmosphere of more than 5barrels (0.8 cubic meters) a day of highlyvolatile liquids; 4) death of any person; 5)bodily harm to any person resulting in one ormore of the following: a) loss ofconsciousness, b) an individual being carriedfrom the scene, c) medical treatment, or d)disability which prevents the discharge ofnormal duties or the pursuit of normalactivities beyond the day of the accident; or 6)estimated property damage, including cost ofclean-up and recovery, value of lost product,and damage to the property of the operator orothers, or both, exceeding $50,000.
Additional information:
Contact: USDOT, Research and SpecialPrograms Administration, Office of PipelineSafety
Internet: http://ops.dot.gov
Government transportation revenue andexpenditure dataThe U.S. Department of Commerce(USDOC), U.S. Census Bureau conducts anAnnual Survey of Government Finances.Alternatively, every five years, in years endingin a ‘2’ or ‘7’, a Census of Governments,including a finance portion, is conducted. Thesurvey coverage includes all state and localgovernments in the United States. For both the

Data Sources
BTS State Transportation Profile H-3 Oklahoma
Census and annual survey, the finance detaildata is equivalent, encompassing the entirerange of government finance activities—revenue, expenditure, debt, and assets.
The data collection for the annual survey usestwo methods: mail canvas and centralcollection from state sources. Data for localgovernments includes county, municipal,township, special district, and school districtdata. Data for state governments are compiledfrom state government audits, budgets, andother financial reports into the classificationcategories used for reporting by the CensusBureau.
Reporting of government finances by theCensus Bureau involves presentation of datain terms of uniform categories. While oftensimilar to, or identical to, the classificationused by the state or local government, therecould be instances in which a significantdifference exists between the name of a stateor local financial item and the final category towhich it is assigned by the Census Bureau.
Like financial transactions are combined. Thefinancial categories for revenue involvegrouping of items by source. Revenue items ofthe same kind are merged. Financialtransactions for expenditures are classifiedboth by function and by object category. Debtitems are classified by term (short- and long-term), as well as by type of debt and, to alimited extent, by purpose. Assets also are putinto uniform categories, grouped by type ofholding, with holdings for insurance trustsystems grouped separately from generalgovernment.
The share of government sector financialtotals contributed by a state government or bylocal governments differs materially from onestate to another. Users can review theGovernment Finance and Employment
Classification Manual for additionalinformation regarding the financial categories.The financial amounts in the tables and filesare statistical in nature and do not representaccounting statements or conditions.
The local government statistics are developedfrom a sample survey. Therefore, the localtotals, as well as state and local aggregates, areconsidered estimated amounts subject tosampling error. State government finance dataare not subject to sampling. Consequently,state-local aggregates for individual states aremore reliable (on a relative standard errorbasis) than the local government estimatesthey include.
Additional information:
Contact: USDOC, U.S. Census Bureau,Finance Branch
Print Sources: USDOC, U.S. Census Bureau,Federal Aid to States: 2000
Internet: http://www.census.gov
Hazardous materials incidents dataIncidents resulting in certain unintentionalreleases of hazardous materials must bereported under 49 CFR 171.16. Each carriermust submit a report to the USDOT, Researchand Special Programs Administration (RSPA)within 30 days of the incident, includinginformation on the mode of transportationinvolved, results of the incident, and anarrative description of the accident. Thesereports are generally made available onRSPA’s incident database within 90 days ofreceipt.
Fatalities and injuries are counted only ifdirectly caused by a hazardous material. Forexample, a truck operator killed by impactforces during a motor vehicle crash would notbe counted as a hazardous-material fatality.

Data Sources
Oklahoma H-4 BTS State Transportation Profile
RSPA contacts the submitting carrier bytelephone to verify all reported fatalities.
Although RSPA acknowledges that there issome level of underreporting, it believes thatthe underreporting is mostly limited to small,nonserious incidents. The reportingrequirements were extended to intrastatehighway carriers on October 1, 1998, and theresponse rate from this new group is expectedto increase over time. Property damage figuresare estimates determined by the carrier prior tothe 30-day reporting deadline, and aregenerally not subsequently updated. Propertydamage figures, therefore, may underestimateactual damages.
Additional information:
Contact: USDOT, Research and SpecialPrograms Administration, Office ofHazardous Materials Planning and Analysis
Print source: USDOT, Research and SpecialPrograms Administration, Office ofHazardous Materials Safety, Hazmat Summaryby State for Calendar Year 2000. Washington,DC: 2001
Internet: http://hazmat.dot.gov
Highway mileage, condition, and use,driver licenses, and highway vehicleregistrations dataData on roadway mileage, condition, and useare extracted from the Highway PerformanceMonitoring System (HPMS), which uses astratified simple random sample of highwaylinks (small sections of roadway) selectedfrom state inventory files. The HPMS samplewas designed as a fixed sample to minimizedata collection costs, but adjustments tomaintain representativeness are carried outperiodically. The HPMS also consists ofuniverse reporting (a complete census) for theInterstate and the National Highway System,
and tabular summary reporting of limitedinformation.
Data are collected independently by the 50states, Metropolitan Planning Organizations(MPOs), and lower jurisdictions. Many of thegeometric data items rarely change, such asnumber of lanes; others change frequently,such as traffic. The U.S. Department ofTransportation, Federal HighwayAdministration (FHWA) provides guidelinesfor data collection in the HPMS Field Manual,which the states follow to varying extentsdepending on matters such as staff, resources,state perspective, uses of the data, andstate/MPO/local needs for the data. StateDepartments of Transportation (DOTs) reportHPMS data annually to the FHWA.
HPMS data are subject to sampling andnonsampling error. Nonsampling error is themajor concern with these data. For some ofthe most variable and important data items,such as traffic, guidelines for measurementand data collection have been produced. Stateshave the option of using the guidelines orusing their own procedures. Many data itemsare difficult and costly to collect and arereported as estimates not based on directmeasurement. The data are collected andreported by many entities and individualswithin the responsible organizations. Most doa reasonably good job, but staff turnover, cost,equipment issues, etc., can create difficulties.
States provide vehicle registration data to theFHWA. Vehicle registration data are shownon a calendar-year basis. Efforts are made toexclude transfers, re-registrations, and anyother factors that could result in duplication inthe vehicle counts. Registration practices forcommercial vehicles differ greatly among thestates. Some states register a tractor-semitrailer combination as a single unit; othersregister the tractor and the semitrailer

Data Sources
BTS State Transportation Profile H-5 Oklahoma
separately. Some states register buses withtrucks or automobiles, while many states donot report house and light utility trailersseparately from commercial trailers orsemitrailers. Some states do not requireregistration of car or light utility trailers. Insome instances, FHWA has supplemented thedata supplied by the states with informationobtained from other sources.
States also provide driver licensing data to theFHWA. Although efforts are made tominimize license duplication, drivers whomove from one state to another are sometimescounted in both states until the license fromthe previous state of residence expires.Problems with the data also arise from the factthat: 1) some individuals obtain their driverslicenses in states other than those of legalresidence; 2) some individuals fraudulentlyobtain multiple licenses; 3) not all individualswho drive are licensed; and 4) the purging ofexpired licenses or licenses from deceasedindividuals is not performed on a continualbasis.
Additional information:
Contact: USDOT, Federal HighwayAdministration, Office of Highway PolicyInformation
Print source: USDOT, Federal HighwayAdministration, Highway Statistics.Washington, DC: Annual issues.
Internet: http://www.fhwa.dot.gov/ohim/index.html
Highway safety dataFatalities: Highway fatality data are extractedfrom the Fatality Analysis Reporting System(FARS), which is compiled by the U.S.
Department of Transportation (USDOT),National Highway Traffic SafetyAdministration (NHTSA). Data are gatheredfrom a census of police accident reports(PARs), state vehicle registration files, statedrivers licensing files, state highwaydepartment data, vital statistics, deathcertificates, coroner/medical examiner reports,hospital medical reports, and emergencymedical service reports. A separate form iscompleted for each fatal crash. Blood alcoholconcentration (BAC) is estimated when notknown. Statistical procedures used forunknown data in FARS can be found in theNHTSA report, A Method for EstimatingPosterior BAC Distributions for PersonsInvolved in Fatal Traffic Accidents, DOT HS807 094 (Washington, DC: July 1986).
Data are collected from relevant state agenciesand electronically submitted for inclusion inthe FARs database on a continuous basis.Cross-verification of PARs with deathcertificates helps prevent undercounting.Moreover, when data are entered, they arechecked automatically for acceptable rangevalues and consistency, enabling quickcorrections when necessary. Several programscontinually monitor the data for completenessand accuracy. Periodically, sample cases areanalyzed for accuracy and consistency.
FARS data do not include motor vehiclefatalities on nonpublic roads. These arethought to account for about 2 percent orfewer of the total motor vehicle fatalities peryear.
Injuries and crashes: NHTSA’s GeneralEstimates System (GES) data are a nationallyrepresentative sample of police-reportedcrashes that contributed to an injury or fatalityor resulted in property damage and involved atleast one motor vehicle traveling on atrafficway. GES data collectors randomly

Data Sources
Oklahoma H-6 BTS State Transportation Profile
sample PARs and forward copies to a centralcontractor for coding into a standard GESsystem format. Documents such as policediagrams or supporting text provided by theofficers might be further reviewed to completea data entry. A NHTSA study of injuries frommotor vehicle crashes estimated the total countof nonfatal injuries at over 5 million comparedwith the GES’s estimate of 3.2 million in1998.
Additional information:
Contact: USDOT, National Highway TrafficSafety Administration, National Center forStatistics and Analysis
Print source: USDOT, National HighwayTraffic Safety Administration, Traffic SafetyFacts. Washington, DC: Annual issues.
Internet: http://www.nhtsa.dot.gov
International visitors dataData on international visitors to the UnitedStates are based on international arrivals by airto the United States (excluding those fromCanada and Mexico). Information is derivedfrom the Immigration and NaturalizationService’s (INS) Visitor Arrivals Program (I-94) and the U.S. Department of Commerce,Tourism Industries Office’s Survey ofInternational Air Travelers. The surveyobtains data on overseas travel patterns,characteristics, and spending patterns ofinternational travelers to and from the UnitedStates. Between 69,000 and 95,000 travelersare surveyed each year. The survey results areweighted so they represent the internationaltravel populations of U.S. residents and non-residents based upon Immigration andNaturalization Service data.
Additional information:
Contact: U.S. Department of Commerce(USDOC), International TradeAdministration, Tourism Industries Office
Print source: USDOC, International TradeAdministration, Tourism Industries Office,Overseas Visitors to Select U.S. States andTerritories. Washington, DC: Annual issues;and USDOC, International TradeAdministration, Tourism Industries Office,Overseas Visitors to Select U.S.Cities/Hawaiian Islands. Washington, DC:Annual issues.
Internet: http://tinet.ita.doc.gov/
Passenger border crossing dataU.S. Custom Service personnel collectpassenger border-crossing entry data for allU.S. land, air, and maritime ports. Thesenumbers reflect all entries, and it is notpossible to divide these data into separateentries for same-day and overnight travel orby country of residence for the traveler.Additionally, for border-crossing figures, thetotal number of people is not the number ofunique individuals, but rather indicates thenumber of border crossings. Multiplecrossings by the same individual count asmultiple border crossings.
Additional information:
Contact: USDOT, Bureau of TransportationStatistics, Office of Transportation Analysis
Internet: http://www.bts.gov
Railroad industry and shipments dataThe Association of American Railroads(AAR) database aggregates data from severalsources concerning the freight railroadindustry and movement of freight, bothnationally and statewide. The state-specific

Data Sources
BTS State Transportation Profile H-7 Oklahoma
data include commerce, employment, andfinancial contributions.
The primary source of data for Class Irailroads is Schedule 700 of the R-1 AnnualReport to the Surface Transportation Board(STB) by individual carriers (100 percentreporting) and the 2000 Carload WaybillSample. The primary source of data for non-Class I railroads is AAR’s Profiles of U.S.Railroads from statistics supplied annually bynearly all operating U.S. freight railroads.Some of the data are estimated based on moreaggregated, national figures.
The STB defines Class I railroads as havingoperating revenues at or above a thresholdindexed to a base of $250 million (1991) andadjusted annually in concert with changes inthe Railroad Freight Rate Index published bythe Bureau of Labor Statistics.Declassification from Class I status occurswhen a railroad falls below the applicablethreshold for three consecutive years.Although few in number, Class I railroadsaccount for over 90 percent of the industry’srevenue.
The AAR determines the number of non-ClassI railroads through an annual survey sent toeach U.S. freight railroad.
Historical reliability may vary due to changesin the railroad industry, includingbankruptcies, mergers, and declassification bythe STB. Small data errors may also haveoccurred because of independent rounding inthis series by the AAR.
Additional information:
Contact: Association of American Railroads,Policy and Economics Department
Internet: http://www.aar.org
Railroad safety dataRailroads are required to file a report for eachaccident or incident to the Federal RailroadAdministration (FRA). These include: 1) trainaccidents, reported on Form F 6180.54,comprised of collisions, derailments, and otherevents involving the operation of on-trackequipment and causing reportable damageabove an established threshold ($6,600 in1998); 2) highway-rail grade crossingincidents, reported on Form F 6180.57,involving impact between railroad on-trackequipment and highway users at crossings;and 3) other incidents, reported on Form F6180.55a, involving all other reportableincidents or exposures that cause a fatality orinjury to any person or an occupational illnessto a railroad employee.
Railroads are required by FRA regulations touse the current FRA Guide for PreparingAccident/Incident Reports when preparingreports.
The Systems Support Division of FRAmaintains the Railroad Accident/IncidentReporting System (RAIRS), consisting of fourdatabases: rail equipment, injury/illness,grade-crossing accidents, and railroadsummary (freight and passenger). Thesedatabases include information on all railroadaccidents, grade-crossing accidents, railroademployee casualties, and any other injuries onrailroad property, and provide the basis foraccident analyses and assessment as well asannual reports. The databases are updatedmonthly from information submitted by therailroads.
Additional information:
Contact: USDOT, Federal RailroadAdministration, Office of Safety

Data Sources
Oklahoma H-8 BTS State Transportation Profile
Print publication: USDOT, Federal RailroadAdministration, Railroad Safety Statistics.Washington, DC: Annual issues.
Internet: http://www.fra.dot.gov
Recreational boating safety and vehiclesdataThe U.S. Coast Guard, of the U.S. Departmentof Transportation, collects data on recreationalboating accidents from two sources: 1)Boating Accident Report (BAR) dataforwarded to the Coast Guard by jurisdictionswith an approved boat numbering and casualtyreporting system, and 2) reports of CoastGuard investigations of fatal boating accidentsthat occurred on waters under federaljurisdiction. Recreational Boating AccidentInvestigation data are used if submitted to theCoast Guard and are relied on as much aspossible to provide accident statistics. In theabsence of investigations, information iscollected from reports filed by boat operators.
Boat operators are required to file a BAR if anaccident results in 1) loss of life, 2) personalinjury that requires medical treatment beyondfirst aid, 3) damage to the vessel and otherproperty exceeding $500, or 4) complete lossof the vessel.
Boat operators are required to report theiraccidents to authorities in the state where theaccident occurred. States with approved boatnumbering systems furnish the Coast Guardwith BAR data. The minimum reportingrequirements are set by federal regulation, butstates are allowed to have stricterrequirements. The Coast Guard reportsrecreational boating safety data in the reportBoating Statistics, which only coversaccidents meeting the federal minimumreporting requirements.
The statistics in Boating Statistics coverboating accidents reported on waters of jointfederal and state jurisdiction, and exclusivestate jurisdiction.
The Coast Guard believes over 90 percent offatal accidents are included in BoatingStatistics. A smaller percentage of nonfatalaccidents are reported because of reportingthresholds, ignorance of the law, anddifficulties enforcing the law. Federal lawdoes not require the reporting of accidents onprivate waters where states have nojurisdiction. Reports of accidents on suchwaters are included when received by theCoast Guard if they satisfy the otherrequirements of inclusion. Accidents excludedare those in which the boat was used as aplatform for other activities (e.g., swimming),and those in which a person dies of naturalcauses aboard a boat. However, the data doinclude accidents involving people in thewater who are struck by their boat or anotherboat.
Additional information:
Contact: USDOT, U.S. Coast Guard, Office ofBoating Safety
Print source: USDOT, U.S. Coast Guard,Office of Boating Safety, Boating Statistics,Washington, DC: Annual issues.
Internet: http://www.uscgboating.org
Transborder surface freight dataThe Transborder Surface Freight Dataset isextracted from the Census Foreign TradeStatistics Program and made available by theBureau of Transportation Statistics. Importand export data are extracted fromadministrative records required by theDepartments of Commerce and Treasury. Thisdataset incorporates all shipments entering orexiting the United States by surface modes of

Data Sources
BTS State Transportation Profile H-9 Oklahoma
transport (that is, other than air or maritimevessel) to and from Canada or Mexico. Priorto January 1997, this dataset also includedtranshipments in its detailed tables, that is,shipments entering or exiting the United Statesby way of U.S. Customs ports on the northernor southern borders, even when the actualorigin or final destination of the goods wasother than Canada or Mexico. Shipments thatneither originate nor terminate in the UnitedStates (i.e., intransit shipments) are beyond thescope of this dataset because they are notconsidered U.S. international trade shipments.
Users should be aware that the trade datafields (such as value and commodityclassification) are typically more rigorouslyreviewed than transportation data fields (i.e.,mode of transportation and port of entry/exit).Users should also be aware that the use offoreign trade data to describe physicaltransportation flows might not be direct. Forexample, this dataset provides surfacetransportation information for individualCustoms districts and ports on the northernand southern borders. However, because offiling procedures for trade documents, theseports may or may not reflect where goodsphysically crossed the border. This is becausethe filer of information may choose to filetrade documents at one port, while shipmentsactually enter or exit at another port.
Import data are generally more accurate thanexport data. This is primarily due to the factthat Customs uses import documents forenforcement purposes, while it performs nosimilar function for exports.
Additional information:
Contact: USDOT, Bureau of TransportationStatistics, Office of Transportation Analysis
Internet: http://www.bts.gov
Transit operating, financial, and safetydataTransit data are from the National TransitDatabase (NTD) produced by the USDOT,Federal Transit Administration (FTA). Dataare collected from transit agencies that receiveUrbanized Area Formula Program funds.Transit operators that do not report to FTA arethose that do not receive federal funding,typically private, small, and rural operators.FTA reviews and validates informationsubmitted by individual transit agencies.Reliability may vary because some transitagencies cannot obtain accurate information ormay interpret certain data definitionsdifferently than intended.
In 2000, 592 agencies reported to the NTD. Ofthat total, 67 transit agencies receivedexemptions from detailed reporting becausethey operated 9 or fewer vehicles, and 7 wereexcluded because their data were incomplete.Thus, 518 individual reporters were includedin the NTD accounting for 90 to 95 percent oftransit passenger-miles.
Data are collected on a range of variablesincluding capital and operating funding, transitservice supplied and consumed, and transitsafety and security. Transit operators mustreport fatalities, injuries, accidents, incidents,and property damage in excess of $1,000.
Additional information:
Contact: USDOT, Federal TransitAdministration
Print source: USDOT, Federal TransitAdministration, Data Tables. Washington,DC: Annual issues; and USDOT, FederalTransit Administration, National TransitDatabase Reporting Manual. Washington,DC: Annual issues.
Internet: http://www.fta.dot.gov
Data Sources
Oklahoma H-10 BTS State Transportation Profile
Transportation establishment,employees, and payroll dataData on employees, establishments, andpayroll are taken from County BusinessPatterns, a database of employment in theUnited States using the North AmericanIndustry Classification System (NAICS). Dataare collected annually. Data are extracted fromthe Business Register, the Census Bureau’sfile of all known single and multi-establishment companies. The AnnualCompany Organization Survey andquinquennial Economic Censuses provideindividual establishment data for multi-location firms. Data for single-location firmsare obtained from various programs conductedby the Census Bureau, such as the EconomicCensuses, the Annual Survey ofManufactures, and Current Business Surveys.They are also obtained from administrativerecords of the Internal Revenue Service (IRS),the Social Security Administration (SSA), andthe Bureau of Labor Statistics (BLS).
Additional information:
Contact: USDOC, U.S. Census Bureau,Economic Planning and Coordination Division
Print source: USDOC, U.S. Census Bureau,[State]: County Business Patterns 1999.CBP/99-6. Washington, DC: 2001.
Internet: http://www.census.gov/epcd/cbp/view/cbpview.html
Vehicle Inventory and Use SurveyThe Vehicle Inventory and Use Survey(VIUS) collects data on the physical andoperational characteristics of private andcommercial trucks in the United States. The1997 VIUS sampled about 131,000 trucksfrom an estimated universe of over 75 milliontrucks. The sample excludes vehicles owned
by federal, state, and local governmentincluding ambulances, buses, motor homes,farm tractors, unpowered trailer units, andtrucks reported to have been sold, junked, orwrecked prior to July 1, 1996. Light trucksregistered as cars, as is the practice in manystates, were included. Unregistered trucksused off-road are not included. Censusdelivered a mail-out/mail-back survey to theowner identified in the vehicle registrationrecords. Data collection is staggered as staterecords become available. Owners report dataonly for the vehicles selected. The responserate for the 1997 VIUS was about 85 percent.
Additional information:
Contact: USDOC, U.S. Census Bureau,Service Sector Statistics Division
Print source: USDOC, U.S. Census Bureau,[state]: 1997 Vehicle Inventory and UseSurvey. EC97TV-[state]. Washington, DC:1999.
Internet: http://www.census.gov/svsd/www/tiusview.html
Waterborne imports and vessel dataThe U.S. Department of Transportation’sMaritime Administration (MARAD) classifiesmerchant-based vessels by size and type andreports this information in its annualpublication, Merchant Fleets of the World.MARAD compiles these figures from a dataservice provided by Lloyd’s MaritimeInformation Service. The parent company,Lloyd’s Register (LR), collects data fromseveral sources, including its offices aroundthe world, data transfers and agreements withother classification societies, questionnaires toship owners and shipbuilders, feedback fromgovernment agencies, and input from portagents.

Data Sources
BTS State Transportation Profile H-11 Oklahoma
MARAD’s Office of Statistical and EconomicAnalysis maintains the waterborne databankused to compile the annual import and exportstatistics from monthly and quarterly dataprovided by the U.S. Army Corps ofEngineers. MARAD publishes the data inreports of vessel movements, trade and cargoby type of service, U.S. and foreign port,country of origin/destination, commodity,value, weight, and containerized cargo.
MARAD distributes the reports and performsspecial tabulations and customized maritimedata reports created for other governmentagencies and the private sector on areimbursable basis. MARAD also providesthese services for historic data and maintainsthe Schedule K Classification of Foreign Portsby Geographic Trade Area and Country.
Additional information:
Contact: USDOT, Maritime Administration,Office of Statistical and Economic Analysis
Print source: USDOT, MaritimeAdministration, Merchant Fleets of the World.
Internet: http://www.marad.dot.gov
Waterborne shipments dataThe U.S. Army Corps of Engineers’ (Corps)Navigation Data Center (NDC) collects dataon waterborne commodity and vesselmovements, domestic commercial vesselcharacteristics, port and waterway facilities,and navigation dredging projects.
The NDC’s databases contain information onphysical characteristics, infrastructure, andcommodities for principal facilities on theU.S. coast, Great Lakes, and inland ports. Thedata consists of listings of port area’swaterfront facilities, including information onberthing, cranes, transit sheds, grain elevators,marine repair plants, fleeting areas, anddocking and storage facilities.
All vessel operators of record report theirdomestic waterborne traffic movements to theCorps via ENG Forms 3925 and 3925b. Cargomovements are reported according to points ofloading and unloading. Excluded cargomovements are: 1) cargo carried on generalferries, 2) coal and petroleum products loadedfrom shore facilities directly into vessels forfuel use, 3) military cargo moved in U.S.Department of Defense vessels, and 4) cargoweighing less than 100 tons moved ongovernment equipment. The Corps calculateston-miles by multiplying the cargo’s tonnageby the distance between points of loading andunloading.
An annual survey of companies that operateinland waterway vessels is the principal sourceof data for inland non self-propelled vessels,self-propelled vessels, and flag passenger andcargo vessels. More than 3,000 surveys aresent to these companies, and response rates aretypically above 90 percent.
Additional information:
Contact: U.S. Army Corps of Engineers,Waterborne Commerce Statistics Center
Print source: U.S. Army Corps of Engineers,Waterborne Commerce of the United States.New Orleans, LA: Annual issues.
Internet: http://www.wrsc.usace.army.mil

H-12

I Glossary


Glossary
BTS State Transportation Profile I-1 Oklahoma
British thermal unit (Btu): The amount ofenergy required to raise the temperature of 1pound of water 1 degree Fahrenheit (F) at ornear 39.2 degrees F and 1 atmosphere ofpressure.
Certificated airport: An airport holding anoperating certificate issued by the FederalAviation Administration in accordance withCode of Federal Regulations (CFR) Title 14,Chapter 1, Part 139 allowing it to servescheduled or unscheduled air carrier aircraftdesigned for more than 30 passengers.
Commuter rail: Urban passenger trainservice for short-distance travel between acentral city and adjacent suburb. Does notinclude rapid rail transit or light rail transitservice.
Container: A box-like device used to store,protect, and handle a number of packages oritems as a unit of transit that can beinterchanged between trucks, trains, andships without rehandling the contents.
Controlled right-of-way: Lanes restrictedfor at least a portion of the day for use bytransit vehicles and other high occupancyvehicles (HOVs).
Demand responsive: Transit serviceprovided without a fixed route and without afixed schedule that operates in response tocalls from passengers or their agents to thetransit operator or dispatcher. Service isusually provided using cars, vans, or buseswith fewer than 25 seats.
Directional route-miles: The mileage ineach direction over which publictransportation vehicles travel while inrevenue service. Directional route-miles area measure of the facility or roadway, not theservice carried on the facility such as thenumber of routes or vehicle-miles.
Directional route-miles are computed withregard to direction of service, but withoutregard to the number of traffic lanes or railtracks existing in the right-of-way.
Dry-bulk carrier (water): A ship withspecialized holds for carrying dry cargo suchas coal, grain, and iron ore in unpackagedbulk form.
Enplanements: The total number ofrevenue passengers boarding aircraft.
Exclusive right-of-way: Lanes reserved atall times for transit use and other highoccupancy vehicles (HOVs).
Ferryboat (transit): Vessels that carrypassengers and/or vehicles over a body ofwater. Generally steam or diesel-powered,ferryboats may also be hovercraft, hydrofoil,and other high-speed vessels. The vessel islimited in its use to the carriage of deckpassengers or vehicles or both, operates on ashort run on a frequent schedule betweentwo points over the most direct water routesother than in ocean or coastwise service, andis offered as a public service of a typenormally attributed to a bridge or tunnel.
Full container ship: Ships equipped withpermanent container cells, with little or nospace for other types of cargo.
Heavy rail: An electric railway with thecapacity to transport a heavy volume ofpassenger traffic and characterized byexclusive rights-of-way, multi-car trains,high speed, rapid acceleration, sophisticatedsignaling, and high-platform loading. Alsoknown as “subway,” “elevated (railway),” ormetropolitan railway (metro).”
Light rail: A streetcar-type vehicleoperated on city streets, semi-exclusiverights-of-way, or exclusive rights-of-way.

Glossary
Oklahoma I-2 BTS State Transportation Profile
Service may be provided by step-entryvehicles or by level boarding.
Major arterial highway: A major highwayused primarily for through traffic.
Metric ton: 1,814 pounds (2,000 poundsmultiplied by 0.907).
Minor arterial: In rural areas, roadslinking cities and larger towns. In urbanareas, roads distributing trips to smallgeographic area but not penetratingidentifiable neighborhoods.
Minor collector highway: In rural areas,routes that serve intracounty rather thanstatewide travel. In urban areas, streets thatprovide direct access to neighborhoods andarterials.
Mixed right-of-way: Lanes used for generalautomobile traffic.
Motor bus: A rubber-tired, self-propelled,manually steered bus with fuel supplyonboard the vehicle. Motor bus typesinclude intercity, school, and transit.
Natural gas distribution pipeline: Smallerthan transmission pipelines and maintainedby companies that distribute natural gaslocally (intrastate). Distribution pipelinesystems are analogous to networks of lesserroads and residential streets that peopletravel after getting off the freeway.
Natural gas transmission pipeline:Analogous to a major freeway, it is the maininterstate transportation route for movinglarge amounts of natural gas from the sourceof production to points of distribution.Transmission pipelines are designed tomove large amounts of natural gas fromareas where the gas is extracted and stored
to the local distribution companies thatprovide natural gas to homes and businesses.
Principal arterial highway: Major streetsor highways, many of multilane or freewaydesign, serving high-volume traffic corridormovements that connect major generators oftravel.
Short ton: 2,000 pounds.
Tanker: An oceangoing ship designed tohaul liquid bulk cargo in world trade.
Ton-mile: The movement of one ton ofcargo the distance of one statute mile.
Trackage rights: The authority of onerailroad to use the tracks of another railroadfor a fee.
Trolley bus: Rubber-tired, electric transitvehicle, manually steered and propelled by amotor drawing current, normally throughoverhead wires, from a central powersource.
Unlinked passenger trips: The number ofpassengers who board public transportationvehicles. A passenger is counted each timehe or she boards a vehicle even if on thesame journey from origin to destination.
Vanpool: Public-sponsored commuterservice operating under prearrangedschedules for previously formed groups ofriders in 8- to 18-seat vehicles. Drivers arealso commuters who receive little or nocompensation besides the free ride.
Vehicle-miles traveled (highway): Milesof travel by all types of motor vehicles asdetermined by the states on the basis ofactual traffic counts and establishedestimating procedures.


U.S. Department of Transportation Bureau of Transportation Statistics


![National Plug-In Electric Vehicle Infrastructure Analysis › sites › prod › files › 2017 › 09 › f... · Trips (Traveler Analysis Framework [TAF]), and Full Interstate Corridor](https://img.dokumen.tips/doc/110x75/5f27930f0a0f552bb807a208/national-plug-in-electric-vehicle-infrastructure-analysis-a-sites-a-prod-a.jpg)