Embed Size (px)
Citation preview

Franklin Regional Council of Governments
12 Olive Street, Suite 2
Greenfield, MA 01301
TRANSPORTATION LISTENING SESSIONS IN SUPPORT OF THE TRANSPORTATION AND
CLIMATE INITIATIVE
FRANKLIN COUNTY, MA
JUNE 30, 2019

1
Contents Overview ....................................................................................................................................................... 2
Background ................................................................................................................................................... 2
The Listening Sessions ................................................................................................................................... 2
Potential solutions ........................................................................................................................................ 3
Franklin Regional Planning Board Listening Session – May 23, 2019 ........................................................... 4
Members in Attendance ........................................................................................................................... 4
Staff/Guests .............................................................................................................................................. 5
Introduction and Voting Process .............................................................................................................. 5
FRPB Voting Outcomes ............................................................................................................................. 5
Discussion and Common Themes ............................................................................................................. 5
Regional Leaders Listening Session – June 20, 2019 ..................................................................................... 6
Participants ............................................................................................................................................... 6
Staff/Guests .............................................................................................................................................. 6
Introduction and Voting Process .............................................................................................................. 6
Regional Leaders Voting Outcomes .......................................................................................................... 6
Discussion and Common Themes ............................................................................................................. 7
Overall Themes ............................................................................................................................................. 7
Community Profiles ....................................................................................................................................... 8
Map of Municipal and Regional Participation in the Listening Sessions .................................................. 8
Franklin Regional Planning Board Listening Session ................................................................................. 8
Regional Leaders Listening Session ......................................................................................................... 22
Appendix A – Listening Sessions Vote Totals .............................................................................................. 26

2
Overview The Franklin Regional Council of Governments (FRCOG) contracted with The Nature Conservancy (TNC)
to conduct listening sessions with Franklin County leaders on potential solutions rural residents would
be most interested in pursuing to combat climate change through reductions in emissions generated by
the transportation sector.
Background Franklin County is comprised of 26 municipalities and is the most rural area in the Commonwealth of
Massachusetts. It has a population of approximately 70,000 people spread out over 725 square miles,
and has a population density of roughly 100 people per square mile. Currently, public transportation is
very limited, and most county residents rely on the personal automobile to access work, school, medical
appointments, errands, recreation and more. Most vehicles have traditional combustion engines, but
with a strong contingent of progressive county residents, electric vehicles are growing in popularity, and
mobility options that don’t involve a private automobile are desired.
The Transportation and Climate Initiative (TCI) is a collaboration of environmental, energy and
transportation agencies of 12 Northeast and Mid-Atlantic states, and the District of Columbia whose
mission is to improve transportation, develop the clean energy economy, and reduce carbon emissions
from the transportation sector for the economic and social benefit of all. Massachusetts joined the
collaborative in December, 2018. With over 40% of greenhouse gases produced by the transportation
sector, it is recognized that any efforts to address climate change through carbon reduction must
address the emissions generated by the transportation sector.
Acceptable solutions to reducing carbon emissions from the transportation sector can vary widely
between urban, suburban and rural areas. Understanding that rural areas can sometimes be left out of
such conversations, TNC made a concerted effort to reach out to rural residents through a survey
conducted in the Fall of 2018. Building on this work, TNC contracted with the FRCOG to conduct rural
listening sessions with Franklin County leaders to gauge their interest in various solutions for
reducing/eliminating emissions from the transportation sector. For the sake of discussion, participants
were told that ideas were being explored on how to generate a revenue stream to invest in
implementing solutions. However, the purpose of the listening sessions was not to debate revenue
generation. Rather they were to assume that revenue was available, and discuss the merits of potential
solutions that could be implemented with that revenue.
The Listening Sessions Two listening sessions were held with regional leaders in the Spring of 2019. The first was with the
Franklin Regional Planning Board (FRPB) on May 23, 2019 at 6:00 p.m. The second was with leaders of
regional organizations in Franklin County on June 20, 2019 at noon. Both meetings took place at the
John W. Olver Transit Center in Greenfield, MA.

3
Potential solutions The Listening Sessions centered on discussion of potential solutions to combat climate change through
reductions in carbon emissions generated by the transportation sector. These possible solutions
included:
Infrastructure
o Design and construction funding to repair roads and bridges to reduce
congestion
o Design and construction funding for bicycle and pedestrian facilities in town
centers
o Design and construction funding for bicycle and pedestrian facilities between
regional employment centers (e.g. Greenfield, Montague and Deerfield, Orange
and Athol
o Design and Construction funding of Complete Streets improvements
o Install additional Bus Shelters, Bike Racks/Bike Lockers
o Increase Park and Ride Facilities
o Other
Land Use
o Conserve Forests for Carbon Storage
o Funding for town center water & sewer feasibility studies to support compact
development
o Funding for design and construction of water or sewer infrastructure in town
centers to support mixed use districts, compact development, and access to
transit and bike/pedestrian facilities
o Provide incentives for utilizing Open Space Residential Design (OSRD) for new
subdivisions
o Conduct feasibility study of establishing Regional Transfer of Development
Rights program
o Other
Public Transportation Options
o Provide Transit Service during weekend and evenings
o Expand Transit Routes to unserved village centers (e.g. Bernardston/Northfield,
Ashfield/Conway)
o Provide Transit Services at Park and Ride locations
o Micro-transit Services for Elderly and Disabled, as well as general population
o Support Establishment of East-West Passenger Rail
o Increase commuter options on North-South Rail to connect employment centers
(e.g. Greenfield, Northampton, Holyoke and Springfield)
o Other
Cleaner Vehicles
o Expand Electric Vehicle Charging Stations
o Electric & Hybrid Vehicle Purchase Incentives or Subsidies
o Parking Incentives for Electric Vehicles (e.g. reserved/free parking spots in public
parking areas

4
o Subsidies for vehicles that run on biodiesel
o Establish Bike Share Program
o Other
Options for Underserved populations (e.g. Seniors, Low-Income residents)
o Subsidies for Transit Passes
o Subsidies for Taxi, Uber & Lyft Services
o Subsidies for Hybrid and Electric Vehicles
o Micro-transit Services
o Increase affordable and work force housing in mixed use districts and areas
served by public transit
o Other
Non-Transportation Options/Technology
o Broadband to support working at home
o Web Medical Visits; Expansion of Town Nurse Services
o Remote Shopping
o Other
Other Ideas
o Incentives for employers sponsored vanpools
o Carpool matching services
o Other
Franklin Regional Planning Board Listening Session – May 23, 2019 The FRPB is a regional organization made up of representatives from each of the 26 Franklin County
municipal Select Boards and municipal Planning Boards, along with some At-Large member with
particular areas of expertise.
Members in Attendance
• Kenneth Miller – Ashfield Planning Board
• John Baronas – Deerfield At-Large
• Mike Shaffer – Erving Planning Board
• John Ward – Gill Select Board
• Charles Olchowski – Greenfield At-Large
• Richard Nathhorst – Leverett Planning Board
• Jerry Lund – Leyden At-Large
• Wayne Hachey – New Salem Select Board
• Julia Blyth – Northfield Select Board
• James Basford – Orange At-Large
• Ted Cady – Warwick Planning Board
• Chuck Washer – Shelburne Select Board
• Tom Miner – Shelburne At-Large
• Micki Paddock – Shutesbury At-Large

5
Staff/Guests
• Peggy Sloan, Planning Director FRCOG
• Maureen Mullaney, Transportation and GIS Program Manager FRCOG
• Steve Long, The Nature Conservancy
• Sarah Jackson, The Nature Conservancy
Introduction and Voting Process
FRPB members were given a short powerpoint presentation to educate them on the Transportation and
Climate Initiative, outline the results of the TCI polling conducted in the Fall of 2018, and to review what
the evening’s activities and discussion would entail.
The Potential Solutions (referenced above) were printed on large size paper and placed around the
meeting room. Participants were given six dots with which to vote on the solutions they most
supported. Once this exercise was complete, a discussion about the top selections commenced.
FRPB Voting Outcomes
The full list of potential options, and the total number of votes per option, are contained in Appendix A.
In summary, the top Potential Solutions identified by the FRPB were:
• Expand Electric Vehicle Charging Stations (8)
• Provide Incentives for Electric & Hybrid Vehicle Purchase (7)
• Expand/Provide Broadband to allow working from home (7)
• Provide Parking Incentives for Electric Vehicles (6)
• Increase Park & Ride Facilities (6)
• Support Establishment of East-West Passenger Rail from Greenfield to Boston (6)
• Conserve Forests for Carbon Storage (6)
Discussion and Common Themes
The most common theme throughout this Listening Session was that participants believed that
maintaining the ability to use a personal automobile would continue to be necessary and important in
rural areas. Therefore, much of the discussion centered on expanding the number of electric vehicles on
the road by creating incentives to purchase zero emission vehicles, and building the infrastructure
needed to support them. There was a robust discussion about how the regional energy grid, which
generally does not use oil or coal except in rare times of very high demand, is much cleaner than our
cars, and that by electrifying the fleet we would reap significant reductions in carbon emission.
Second to supporting cleaner vehicles, there was also significant support for incentives to drive less.
This entails creating more park and ride lots, establishing employer sponsored vanpools from the denser
parts of the county, and establishing east-west passenger rail. One participant suggested that incentives
to drive less would be most effective if they are developed in combination with each other. For
example, commuters may be more likely to drive electric vehicles and utilize public transportation if
they were able to charge for free at park and ride lots, or use subsidized passes for transit.

6
Finally, other Potential Solutions that garnered significant interest were conserving forests for carbon
storage, and programs that have urban areas compensate rural areas for the environmental qualities
that they provide. While admittedly very complicated, and unprecedented, the idea of Regional
Transfer of Development Rights is one concept that begins to tackle this idea.
Regional Leaders Listening Session – June 20, 2019 Directors and representatives of local non-profits came together on June 20, 2019 to discuss Potential
Solutions to eliminating carbon emissions from the transportation sector. The following individuals and
organizations were in attendance:
Participants
• Bob Armstrong, Conway Select Board
• Glen Ohlund, Franklin County Regional Housing Redevelopment Authority
• Linda Dunlavy, Executive Director FRCOG
• Tina Cote, Administrator FRTA
• Michael Perreault, Assistant Administrator FRTA
• Judy Raper, Greenfield Community College
• Tim Dolan, Greenfield Community College and Town of Greenfield
• Susan Worgaftik, Greening Greenfield
• Nancy Hazard, Greening Greenfield
• Carol Letson, Greening Greenfield
• Teri Anderson, MassHire Franklin Hampshire Career Center
Staff/Guests
• Peggy Sloan, Planning Director FRCOG
• Maureen Mullaney, Transportation and GIS Program Manager FRCOG
• Sarah Jackson, The Nature Conservancy
• Phil Huffman, The Nature Conservancy (Vermont)
• Bruce Cleudenning, The Nature Conservancy (New Hampshire)
Introduction and Voting Process
Participants were given a short powerpoint presentation to educate them on the Transportation and
Climate Initiative, outline the results of the TCI polling conducted in the Fall of 2018, and to review what
the afternoon’s activities and discussion would entail.
The Potential Solutions (referenced above) were printed on large size paper and placed around the
meeting room. Participants were given six dots with which to vote on the solutions they most
supported. Once this exercise was complete, a discussion about the top selections commenced.
Regional Leaders Voting Outcomes
The full list of potential options, and the total number of votes per option, are contained in Appendix A.

7
In summary, the top Potential Solutions identified by Regional Leaders were:
• Increase affordable and work force housing in mixed use districts and areas served by public
transit (10)
• Provide transit service on evenings and weekends (9)
• Provide incentives or subsidies to purchase electric and hybrid vehicles (9)
• Expand Transit Routes to unserved village centers (6)
• Support Establishment of East-West Passenger Rail from Greenfield to Boston (6)
• Increase commuter options on North-South rail to connect employment centers (6)
Discussion and Common Themes
The most common theme at this Listening Session was the need and desire to have more densely
developed village centers that provide a mix of land uses and support a quality of life not dependent on
individual vehicles or driving. In some cases this was reflective of a desire to provide better public
transportation and, thus, employment and educational opportunities for residents without cars. In
other cases it was indicative of a desire to create a more sustainable living and working environment in
which personal automobiles aren’t necessary to conduct most activities of daily life.
There was lengthy discussion about why people choose to live in rural areas and, perhaps, the
reluctance of some to give up their wide-open spaces for denser development. However, by and large,
most participants believed it was possible to have both denser development supporting mobility not
dependent on the personal car, while also allowing people to live in the most rural areas of the county
where driving would be required. In the case of those choosing to live outside the village areas,
incentives and subsidies for electric vehicles had strong support.
Finally, there was a robust discussion about the cultural shift necessary in order to take advantage of
non-driving solutions. For example, participants recommended rethinking the traditional 9 am – 5 pm
work day. Flexible schedules and working remotely from home were two ideas that participants felt had
strong potential and merit. The latter, however, requires broadband which is an issue is some parts of
Franklin County and rural areas in general.
Overall Themes The discussions held at the two listening sessions were actually quite different, but there were areas of
common ground. Overall, based on the input from the two Listening Sessions, the following themes
capture the opinions of the participants in both sessions:
• Incentives to transition the vehicle fleet to electric cars with zero emissions
• Denser/more compact development to allow living and working without the need of a personal
car
• Significantly expanded public transportation including passenger rail
8
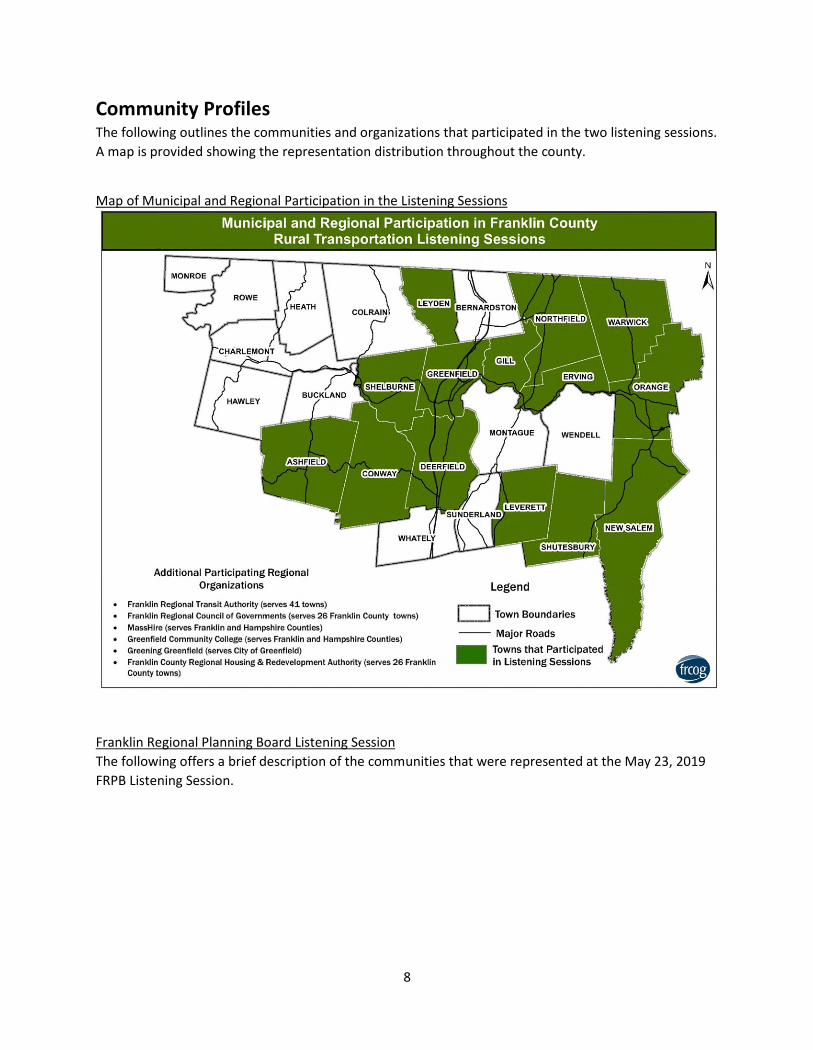
Community Profiles The following outlines the communities and organizations that participated in the two listening sessions.
A map is provided showing the representation distribution throughout the county.
Map of Municipal and Regional Participation in the Listening Sessions
Franklin Regional Planning Board Listening Session
The following offers a brief description of the communities that were represented at the May 23, 2019
FRPB Listening Session.

PROFILES OF FRANKLIN COUNTY, MA COMMUNITIESASHFIELD, MA
Town of Ashfield 25,765.6 Total square milesSelect Board/Town Meeting 79% % Foresthttps://www.ashfield.org/ 9% % Cropland or Pasture
2% % Residential0% % Commercial or Industrial0% % Water
1,598 Total population 96% % White race16% % Under 18 years 0% % Black or African American race64% % 18-64 years 1% % Asian race21% % 65 years and over 0% % Other race49.9 Median Age 3% % Two or more races
2% % of Hispanic or Latino origin of any race
701 Total households Highest educational attainment for2.28 Average household size population age 25 years and over438 Total families 23% % High school graduate or equivalency2.73 Average family size 9% % Associate's degree
25% % Bachelor's degree8% % of population who are veterans 23% % Graduate degree
12% % of population with a disability$72,422 Median household income
65% % of workers in private sector $86,406 Median family income18% % of workers in government sector $41,408 Per capita income16% % of workers self-employed 7.7% Poverty rate
1,182 Total size of labor force 35% % of households with less than $50,000 income1,157 Number of employed 17% % of households $50,000-$74,999 income
2.1 Unemployment rate 21% % of households $75,000-$99,999 income15% % of households $100,000-$149,999 income13% % of households $150,000 and above income
872 Total number of housing units 85% % of workers who commute by car, truck or van83% % Owner-occupied housing units 1% % of workers who commute by public transit17% % Renter-occupied housing units 2% % of workers who commute by walking
1% % of workers who commute by other means 3% % of housing units with no vehicles 11% % of workers who worked at home
25% % of housing units with 1 vehicle72% % of housing units with 2 or more vehicles 33.9 Mean travel time to work (minutes)
Data source: U.S. Census Bureau, 2017 American Community Survey (ACS) Five-year Estimates; MA EOLWD Labor Market Information, 2018 LAUS
HOUSING AND TRANSPORTATION
SOCIO-ECONOMICS
Data source: U.S. Census Bureau, 2017 American Community Survey (ACS) Five-year Estimates
MUNICIPALITY AND LAND USE
DEMOGRAPHICSData source: MassGIS, 2005 Land Use Data
Data source: U.S. Census Bureau, 2017 American Community Survey (ACS) Five-year Estimates

PROFILES OF FRANKLIN COUNTY, MA COMMUNITIESDEERFIELD, MA
Town of Deerfield 21,387.6 Total square milesSelectboard/Town Meeting 56% % Foresthttps://www.deerfieldma.us/ 19% % Cropland or Pasture
7% % Residential1% % Commercial or Industrial3% % Water
5,049 Total population 95% % White race21% % Under 18 years 2% % Black or African American race62% % 18-64 years 1% % Asian race17% % 65 years and over 0% % Other race47.3 Median Age 3% % Two or more races
4% % of Hispanic or Latino origin of any race
2,011 Total households Highest educational attainment for2.37 Average household size population age 25 years and over
1,316 Total families 15% % High school graduate or equivalency2.86 Average family size 9% % Associate's degree
25% % Bachelor's degree6% % of population who are veterans 30% % Graduate degree
11% % of population with a disability$78,949 Median household income
66% % of workers in private sector $97,824 Median family income16% % of workers in government sector $40,230 Per capita income17% % of workers self-employed 8.3% Poverty rate
3,121 Total size of labor force 30% % of households with less than $50,000 income3,039 Number of employed 17% % of households $50,000-$74,999 income
2.6 Unemployment rate 16% % of households $75,000-$99,999 income18% % of households $100,000-$149,999 income18% % of households $150,000 and above income
2,173 Total number of housing units 78% % of workers who commute by car, truck or van78% % Owner-occupied housing units 2% % of workers who commute by public transit22% % Renter-occupied housing units 12% % of workers who commute by walking
2% % of workers who commute by other means 3% % of housing units with no vehicles 6% % of workers who worked at home
27% % of housing units with 1 vehicle69% % of housing units with 2 or more vehicles 22.7 Mean travel time to work (minutes)
HOUSING AND TRANSPORTATION
Data source: U.S. Census Bureau, 2017 American Community Survey (ACS) Five-year Estimates
MUNICIPALITY AND LAND USE
Data source: MassGIS, 2005 Land Use Data
DEMOGRAPHICS
Data source: U.S. Census Bureau, 2017 American Community Survey (ACS) Five-year Estimates
SOCIO-ECONOMICS
Data source: U.S. Census Bureau, 2017 American Community Survey (ACS) Five-year Estimates; MA EOLWD Labor Market Information, 2018 LAUS

PROFILES OF FRANKLIN COUNTY, MA COMMUNITIESERVING, MA
Town of Erving 9,194.0 Total square milesBoard of Selectmen/Town Meeting 83% % Foresthttp://www.erving-ma.org/ 1% % Cropland or Pasture
4% % Residential1% % Commercial or Industrial4% % Water
1,841 Total population 96% % White race22% % Under 18 years 2% % Black or African American race59% % 18-64 years 1% % Asian race19% % 65 years and over 0% % Other race41.9 Median Age 2% % Two or more races
1% % of Hispanic or Latino origin of any race
720 Total households Highest educational attainment for2.56 Average household size population age 25 years and over499 Total families 43% % High school graduate or equivalency2.99 Average family size 15% % Associate's degree
10% % Bachelor's degree11% % of population who are veterans 5% % Graduate degree12% % of population with a disability
$78,949 Median household income66% % of workers in private sector $97,824 Median family income16% % of workers in government sector $40,230 Per capita income17% % of workers self-employed 8.3% Poverty rate
3,121 Total size of labor force 30% % of households with less than $50,000 income3,039 Number of employed 17% % of households $50,000-$74,999 income
2.6 Unemployment rate 16% % of households $75,000-$99,999 income18% % of households $100,000-$149,999 income18% % of households $150,000 and above income
787 Total number of housing units 94% % of workers who commute by car, truck or van85% % Owner-occupied housing units 2% % of workers who commute by public transit15% % Renter-occupied housing units 2% % of workers who commute by walking
1% % of workers who commute by other means 4% % of housing units with no vehicles 1% % of workers who worked at home
26% % of housing units with 1 vehicle70% % of housing units with 2 or more vehicles 25.4 Mean travel time to work (minutes)
HOUSING AND TRANSPORTATION
Data source: U.S. Census Bureau, 2017 American Community Survey (ACS) Five-year Estimates
MUNICIPALITY AND LAND USE
Data source: MassGIS, 2005 Land Use Data
DEMOGRAPHICS
Data source: U.S. Census Bureau, 2017 American Community Survey (ACS) Five-year Estimates
SOCIO-ECONOMICS
Data source: U.S. Census Bureau, 2017 American Community Survey (ACS) Five-year Estimates; MA EOLWD Labor Market Information, 2018 LAUS
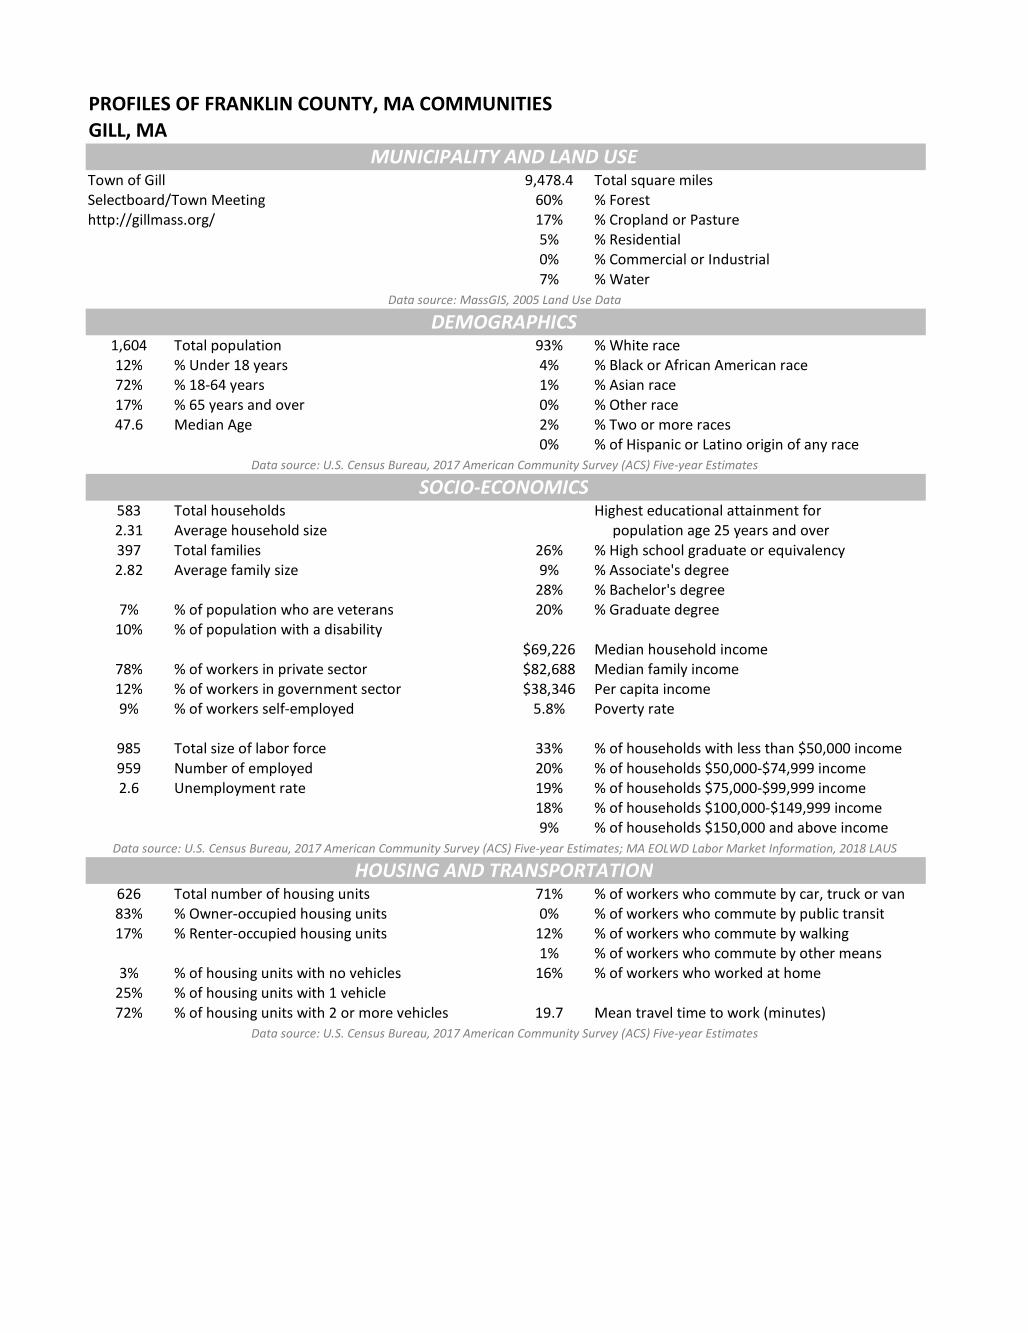
PROFILES OF FRANKLIN COUNTY, MA COMMUNITIESGILL, MA
Town of Gill 9,478.4 Total square milesSelectboard/Town Meeting 60% % Foresthttp://gillmass.org/ 17% % Cropland or Pasture
5% % Residential0% % Commercial or Industrial7% % Water
1,604 Total population 93% % White race12% % Under 18 years 4% % Black or African American race72% % 18-64 years 1% % Asian race17% % 65 years and over 0% % Other race47.6 Median Age 2% % Two or more races
0% % of Hispanic or Latino origin of any race
583 Total households Highest educational attainment for2.31 Average household size population age 25 years and over397 Total families 26% % High school graduate or equivalency2.82 Average family size 9% % Associate's degree
28% % Bachelor's degree7% % of population who are veterans 20% % Graduate degree
10% % of population with a disability$69,226 Median household income
78% % of workers in private sector $82,688 Median family income12% % of workers in government sector $38,346 Per capita income9% % of workers self-employed 5.8% Poverty rate
985 Total size of labor force 33% % of households with less than $50,000 income959 Number of employed 20% % of households $50,000-$74,999 income2.6 Unemployment rate 19% % of households $75,000-$99,999 income
18% % of households $100,000-$149,999 income9% % of households $150,000 and above income
626 Total number of housing units 71% % of workers who commute by car, truck or van83% % Owner-occupied housing units 0% % of workers who commute by public transit17% % Renter-occupied housing units 12% % of workers who commute by walking
1% % of workers who commute by other means 3% % of housing units with no vehicles 16% % of workers who worked at home
25% % of housing units with 1 vehicle72% % of housing units with 2 or more vehicles 19.7 Mean travel time to work (minutes)
HOUSING AND TRANSPORTATION
Data source: U.S. Census Bureau, 2017 American Community Survey (ACS) Five-year Estimates
MUNICIPALITY AND LAND USE
Data source: MassGIS, 2005 Land Use Data
DEMOGRAPHICS
Data source: U.S. Census Bureau, 2017 American Community Survey (ACS) Five-year Estimates
SOCIO-ECONOMICS
Data source: U.S. Census Bureau, 2017 American Community Survey (ACS) Five-year Estimates; MA EOLWD Labor Market Information, 2018 LAUS

PROFILES OF FRANKLIN COUNTY, MA COMMUNITIESGREENFIELD, MA
Town of Greenfield 14,036.3 Total square milesMayor/City Council 45% % Foresthttp://greenfield-ma.gov/ 12% % Cropland or Pasture
19% % Residential4% % Commercial or Industrial2% % Water
17,474 Total population 92% % White race18% % Under 18 years 3% % Black or African American race62% % 18-64 years 1% % Asian race20% % 65 years and over 2% % Other race43.9 Median Age 3% % Two or more races
7% % of Hispanic or Latino origin of any race
7,884 Total households Highest educational attainment for2.13 Average household size population age 25 years and over
4,058 Total families 29% % High school graduate or equivalency2.83 Average family size 13% % Associate's degree
17% % Bachelor's degree9% % of population who are veterans 14% % Graduate degree
16% % of population with a disability$47,821 Median household income
76% % of workers in private sector $70,729 Median family income15% % of workers in government sector $30,089 Per capita income9% % of workers self-employed 13.2% Poverty rate
9,890 Total size of labor force 51% % of households with less than $50,000 income9,596 Number of employed 18% % of households $50,000-$74,999 income
3 Unemployment rate 13% % of households $75,000-$99,999 income12% % of households $100,000-$149,999 income6% % of households $150,000 and above income
8,334 Total number of housing units 89% % of workers who commute by car, truck or van56% % Owner-occupied housing units 0% % of workers who commute by public transit44% % Renter-occupied housing units 5% % of workers who commute by walking
1% % of workers who commute by other means 11% % of housing units with no vehicles 5% % of workers who worked at home43% % of housing units with 1 vehicle46% % of housing units with 2 or more vehicles 19.4 Mean travel time to work (minutes)
HOUSING AND TRANSPORTATION
Data source: U.S. Census Bureau, 2017 American Community Survey (ACS) Five-year Estimates
MUNICIPALITY AND LAND USE
Data source: MassGIS, 2005 Land Use Data
DEMOGRAPHICS
Data source: U.S. Census Bureau, 2017 American Community Survey (ACS) Five-year Estimates
SOCIO-ECONOMICS
Data source: U.S. Census Bureau, 2017 American Community Survey (ACS) Five-year Estimates; MA EOLWD Labor Market Information, 2018 LAUS

PROFILES OF FRANKLIN COUNTY, MA COMMUNITIESLEVERETT, MA
Town of Leverett 14,737.5 Total square milesSelect Board/Town Meeting 85% % Foresthttp://www.leverett.ma.us/ 3% % Cropland or Pasture
4% % Residential0% % Commercial or Industrial1% % Water
1,997 Total population 96% % White race18% % Under 18 years 1% % Black or African American race56% % 18-64 years 2% % Asian race26% % 65 years and over 0% % Other race50.9 Median Age 1% % Two or more races
1% % of Hispanic or Latino origin of any race
818 Total households Highest educational attainment for2.42 Average household size population age 25 years and over598 Total families 15% % High school graduate or equivalency2.83 Average family size 6% % Associate's degree
26% % Bachelor's degree7% % of population who are veterans 39% % Graduate degree9% % of population with a disability
$87,174 Median household income61% % of workers in private sector $101,607 Median family income23% % of workers in government sector $46,486 Per capita income16% % of workers self-employed 6.0% Poverty rate
1,146 Total size of labor force 28% % of households with less than $50,000 income1,116 Number of employed 15% % of households $50,000-$74,999 income
2.6 Unemployment rate 15% % of households $75,000-$99,999 income18% % of households $100,000-$149,999 income24% % of households $150,000 and above income
855 Total number of housing units 79% % of workers who commute by car, truck or van88% % Owner-occupied housing units 1% % of workers who commute by public transit12% % Renter-occupied housing units 1% % of workers who commute by walking
3% % of workers who commute by other means 2% % of housing units with no vehicles 16% % of workers who worked at home
20% % of housing units with 1 vehicle78% % of housing units with 2 or more vehicles 25.9 Mean travel time to work (minutes)
HOUSING AND TRANSPORTATION
Data source: U.S. Census Bureau, 2017 American Community Survey (ACS) Five-year Estimates
MUNICIPALITY AND LAND USE
Data source: MassGIS, 2005 Land Use Data
DEMOGRAPHICS
Data source: U.S. Census Bureau, 2017 American Community Survey (ACS) Five-year Estimates
SOCIO-ECONOMICS
Data source: U.S. Census Bureau, 2017 American Community Survey (ACS) Five-year Estimates; MA EOLWD Labor Market Information, 2018 LAUS

PROFILES OF FRANKLIN COUNTY, MA COMMUNITIESLEYDEN, MA
Town of Leyden 11,504.6 Total square milesBoard of Selectmen/Town Meeting 80% % Foresthttp://www.townofleyden.com/ 11% % Cropland or Pasture
3% % Residential0% % Commercial or Industrial0% % Water
676 Total population 100% % White race16% % Under 18 years 0% % Black or African American race67% % 18-64 years 0% % Asian race17% % 65 years and over 0% % Other race54.9 Median Age 0% % Two or more races
0% % of Hispanic or Latino origin of any race
285 Total households Highest educational attainment for2.37 Average household size population age 25 years and over216 Total families 24% % High school graduate or equivalency2.65 Average family size 14% % Associate's degree
26% % Bachelor's degree11% % of population who are veterans 14% % Graduate degree13% % of population with a disability
$76,771 Median household income64% % of workers in private sector $80,000 Median family income20% % of workers in government sector $39,375 Per capita income15% % of workers self-employed 5.2% Poverty rate
496 Total size of labor force 23% % of households with less than $50,000 income484 Number of employed 24% % of households $50,000-$74,999 income2.4 Unemployment rate 21% % of households $75,000-$99,999 income
20% % of households $100,000-$149,999 income12% % of households $150,000 and above income
323 Total number of housing units 92% % of workers who commute by car, truck or van94% % Owner-occupied housing units 0% % of workers who commute by public transit6% % Renter-occupied housing units 0% % of workers who commute by walking
1% % of workers who commute by other means 2% % of housing units with no vehicles 7% % of workers who worked at home
24% % of housing units with 1 vehicle74% % of housing units with 2 or more vehicles 26.9 Mean travel time to work (minutes)
HOUSING AND TRANSPORTATION
Data source: U.S. Census Bureau, 2017 American Community Survey (ACS) Five-year Estimates
MUNICIPALITY AND LAND USE
Data source: MassGIS, 2005 Land Use Data
DEMOGRAPHICS
Data source: U.S. Census Bureau, 2017 American Community Survey (ACS) Five-year Estimates
SOCIO-ECONOMICS
Data source: U.S. Census Bureau, 2017 American Community Survey (ACS) Five-year Estimates; MA EOLWD Labor Market Information, 2018 LAUS

PROFILES OF FRANKLIN COUNTY, MA COMMUNITIESNEW SALEM MA
Town of New Salem 37,555.8 Total square milesSelectboard/Town Meeting 68% % Foresthttp://www.newsalem-massachusetts.org/ 1% % Cropland or Pasture
1% % Residential0% % Commercial or Industrial
24% % Water
1,019 Total population 96% % White race20% % Under 18 years 0% % Black or African American race58% % 18-64 years 1% % Asian race22% % 65 years and over 0% % Other race51.2 Median Age 3% % Two or more races
0% % of Hispanic or Latino origin of any race
433 Total households Highest educational attainment for2.35 Average household size population age 25 years and over290 Total families 28% % High school graduate or equivalency2.81 Average family size 7% % Associate's degree
19% % Bachelor's degree13% % of population who are veterans 21% % Graduate degree13% % of population with a disability
$71,908 Median household income63% % of workers in private sector $86,250 Median family income26% % of workers in government sector $36,687 Per capita income12% % of workers self-employed 6.1% Poverty rate
621 Total size of labor force 32% % of households with less than $50,000 income604 Number of employed 19% % of households $50,000-$74,999 income2.7 Unemployment rate 16% % of households $75,000-$99,999 income
24% % of households $100,000-$149,999 income9% % of households $150,000 and above income
484 Total number of housing units 91% % of workers who commute by car, truck or van90% % Owner-occupied housing units 1% % of workers who commute by public transit10% % Renter-occupied housing units 1% % of workers who commute by walking
1% % of workers who commute by other means 2% % of housing units with no vehicles 7% % of workers who worked at home
21% % of housing units with 1 vehicle76% % of housing units with 2 or more vehicles 31.1 Mean travel time to work (minutes)
HOUSING AND TRANSPORTATION
Data source: U.S. Census Bureau, 2017 American Community Survey (ACS) Five-year Estimates
MUNICIPALITY AND LAND USE
Data source: MassGIS, 2005 Land Use Data
DEMOGRAPHICS
Data source: U.S. Census Bureau, 2017 American Community Survey (ACS) Five-year Estimates
SOCIO-ECONOMICS
Data source: U.S. Census Bureau, 2017 American Community Survey (ACS) Five-year Estimates; MA EOLWD Labor Market Information, 2018 LAUS

PROFILES OF FRANKLIN COUNTY, MA COMMUNITIESNORTHFIELD, MA
Town of Northfield 37,555.8 Total square milesBoard of Selectmen/Town Meeting 68% % Foresthttps://www.northfieldma.gov/ 1% % Cropland or Pasture
1% % Residential0% % Commercial or Industrial3% % Water
3,012 Total population 96% % White race22% % Under 18 years 0% % Black or African American race62% % 18-64 years 2% % Asian race16% % 65 years and over 0% % Other race46 Median Age 1% % Two or more races
2% % of Hispanic or Latino origin of any race
1,214 Total households Highest educational attainment for2.46 Average household size population age 25 years and over802 Total families 28% % High school graduate or equivalency2.99 Average family size 18% % Associate's degree
18% % Bachelor's degree11% % of population who are veterans 20% % Graduate degree19% % of population with a disability
$69,028 Median household income74% % of workers in private sector $88,582 Median family income21% % of workers in government sector $33,657 Per capita income5% % of workers self-employed 4.0% Poverty rate
1,825 Total size of labor force 32% % of households with less than $50,000 income1,779 Number of employed 20% % of households $50,000-$74,999 income
2.5 Unemployment rate 16% % of households $75,000-$99,999 income22% % of households $100,000-$149,999 income9% % of households $150,000 and above income
1,447 Total number of housing units 95% % of workers who commute by car, truck or van78% % Owner-occupied housing units 0% % of workers who commute by public transit22% % Renter-occupied housing units 1% % of workers who commute by walking
2% % of workers who commute by other means 4% % of housing units with no vehicles 2% % of workers who worked at home
32% % of housing units with 1 vehicle64% % of housing units with 2 or more vehicles 28.8 Mean travel time to work (minutes)
HOUSING AND TRANSPORTATION
Data source: U.S. Census Bureau, 2017 American Community Survey (ACS) Five-year Estimates
MUNICIPALITY AND LAND USE
Data source: MassGIS, 2005 Land Use Data
DEMOGRAPHICS
Data source: U.S. Census Bureau, 2017 American Community Survey (ACS) Five-year Estimates
SOCIO-ECONOMICS
Data source: U.S. Census Bureau, 2017 American Community Survey (ACS) Five-year Estimates; MA EOLWD Labor Market Information, 2018 LAUS

PROFILES OF FRANKLIN COUNTY, MA COMMUNITIESORANGE, MA
Town of Orange 23,029.5 Total square milesBoard of Selectmen/Town Meeting 72% % Foresthttps://www.townoforange.org/ 5% % Cropland or Pasture
8% % Residential1% % Commercial or Industrial3% % Water
7,703 Total population 97% % White race20% % Under 18 years 0% % Black or African American race64% % 18-64 years 1% % Asian race16% % 65 years and over 0% % Other race45.3 Median Age 2% % Two or more races
2% % of Hispanic or Latino origin of any race
3,134 Total households Highest educational attainment for2.44 Average household size population age 25 years and over
1,971 Total families 41% % High school graduate or equivalency3.07 Average family size 9% % Associate's degree
11% % Bachelor's degree11% % of population who are veterans 6% % Graduate degree20% % of population with a disability
$43,191 Median household income74% % of workers in private sector $56,217 Median family income16% % of workers in government sector $22,823 Per capita income10% % of workers self-employed 10.3% Poverty rate
3,638 Total size of labor force 57% % of households with less than $50,000 income3,472 Number of employed 16% % of households $50,000-$74,999 income
4.6 Unemployment rate 10% % of households $75,000-$99,999 income12% % of households $100,000-$149,999 income5% % of households $150,000 and above income
3,539 Total number of housing units 89% % of workers who commute by car, truck or van68% % Owner-occupied housing units 1% % of workers who commute by public transit32% % Renter-occupied housing units 4% % of workers who commute by walking
1% % of workers who commute by other means 10% % of housing units with no vehicles 6% % of workers who worked at home36% % of housing units with 1 vehicle54% % of housing units with 2 or more vehicles 26.1 Mean travel time to work (minutes)
HOUSING AND TRANSPORTATION
Data source: U.S. Census Bureau, 2017 American Community Survey (ACS) Five-year Estimates
MUNICIPALITY AND LAND USE
Data source: MassGIS, 2005 Land Use Data
DEMOGRAPHICS
Data source: U.S. Census Bureau, 2017 American Community Survey (ACS) Five-year Estimates
SOCIO-ECONOMICS
Data source: U.S. Census Bureau, 2017 American Community Survey (ACS) Five-year Estimates; MA EOLWD Labor Market Information, 2018 LAUS

PROFILES OF FRANKLIN COUNTY, MA COMMUNITIESSHELBURNE, MA
Town of Shelburne 14,977.8 Total square milesSelect Board/Town Meeting 72% % Foresthttp://townofshelburne.com/ 13% % Cropland or Pasture
4% % Residential0% % Commercial or Industrial1% % Water
1,935 Total population 97% % White race16% % Under 18 years 1% % Black or African American race60% % 18-64 years 1% % Asian race25% % 65 years and over 0% % Other race53.1 Median Age 1% % Two or more races
0% % of Hispanic or Latino origin of any race
881 Total households Highest educational attainment for2.12 Average household size population age 25 years and over479 Total families 18% % High school graduate or equivalency2.76 Average family size 10% % Associate's degree
27% % Bachelor's degree5% % of population who are veterans 22% % Graduate degree
18% % of population with a disability$61,141 Median household income
64% % of workers in private sector $86,375 Median family income17% % of workers in government sector $45,892 Per capita income19% % of workers self-employed 8.5% Poverty rate
1,210 Total size of labor force 42% % of households with less than $50,000 income1,171 Number of employed 19% % of households $50,000-$74,999 income
3.2 Unemployment rate 13% % of households $75,000-$99,999 income15% % of households $100,000-$149,999 income11% % of households $150,000 and above income
980 Total number of housing units 82% % of workers who commute by car, truck or van66% % Owner-occupied housing units 0% % of workers who commute by public transit34% % Renter-occupied housing units 6% % of workers who commute by walking
2% % of workers who commute by other means 7% % of housing units with no vehicles 10% % of workers who worked at home
38% % of housing units with 1 vehicle54% % of housing units with 2 or more vehicles 25.7 Mean travel time to work (minutes)
HOUSING AND TRANSPORTATION
Data source: U.S. Census Bureau, 2017 American Community Survey (ACS) Five-year Estimates
MUNICIPALITY AND LAND USE
Data source: MassGIS, 2005 Land Use Data
DEMOGRAPHICS
Data source: U.S. Census Bureau, 2017 American Community Survey (ACS) Five-year Estimates
SOCIO-ECONOMICS
Data source: U.S. Census Bureau, 2017 American Community Survey (ACS) Five-year Estimates; MA EOLWD Labor Market Information, 2018 LAUS

PROFILES OF FRANKLIN COUNTY, MA COMMUNITIESSHUTESBURY, MA
Town of Shutesbury 17,331.6 Total square milesSelect Board/Town Meeting 90% % Foresthttps://www.shutesbury.org/ 1% % Cropland or Pasture
2% % Residential0% % Commercial or Industrial2% % Water
1,752 Total population 93% % White race20% % Under 18 years 1% % Black or African American race65% % 18-64 years 0% % Asian race15% % 65 years and over 1% % Other race46.7 Median Age 4% % Two or more races
5% % of Hispanic or Latino origin of any race
743 Total households Highest educational attainment for2.36 Average household size population age 25 years and over476 Total families 13% % High school graduate or equivalency2.87 Average family size 6% % Associate's degree
28% % Bachelor's degree4% % of population who are veterans 41% % Graduate degree9% % of population with a disability
$76,927 Median household income55% % of workers in private sector $95,833 Median family income31% % of workers in government sector $39,166 Per capita income14% % of workers self-employed 11.3% Poverty rate
1,128 Total size of labor force 30% % of households with less than $50,000 income1,103 Number of employed 17% % of households $50,000-$74,999 income
2.2 Unemployment rate 16% % of households $75,000-$99,999 income20% % of households $100,000-$149,999 income16% % of households $150,000 and above income
854 Total number of housing units 89% % of workers who commute by car, truck or van90% % Owner-occupied housing units 0% % of workers who commute by public transit10% % Renter-occupied housing units 1% % of workers who commute by walking
1% % of workers who commute by other means 3% % of housing units with no vehicles 9% % of workers who worked at home
32% % of housing units with 1 vehicle64% % of housing units with 2 or more vehicles 29.5 Mean travel time to work (minutes)
HOUSING AND TRANSPORTATION
Data source: U.S. Census Bureau, 2017 American Community Survey (ACS) Five-year Estimates
MUNICIPALITY AND LAND USE
Data source: MassGIS, 2005 Land Use Data
DEMOGRAPHICS
Data source: U.S. Census Bureau, 2017 American Community Survey (ACS) Five-year Estimates
SOCIO-ECONOMICS
Data source: U.S. Census Bureau, 2017 American Community Survey (ACS) Five-year Estimates; MA EOLWD Labor Market Information, 2018 LAUS

PROFILES OF FRANKLIN COUNTY, MA COMMUNITIESWARWICK, MA
Town of Warwick 24,082.0 Total square milesSelectboard/Town Meeting 88% % Foresthttp://www.warwickma.org/ 3% % Cropland or Pasture
2% % Residential0% % Commercial or Industrial1% % Water
750 Total population 97% % White race12% % Under 18 years 0% % Black or African American race65% % 18-64 years 1% % Asian race23% % 65 years and over 0% % Other race55.8 Median Age 1% % Two or more races
2% % of Hispanic or Latino origin of any race
342 Total households Highest educational attainment for2.19 Average household size population age 25 years and over219 Total families 27% % High school graduate or equivalency2.72 Average family size 10% % Associate's degree
22% % Bachelor's degree11% % of population who are veterans 12% % Graduate degree13% % of population with a disability
$57,885 Median household income70% % of workers in private sector $80,469 Median family income21% % of workers in government sector $31,173 Per capita income9% % of workers self-employed 5.7% Poverty rate
518 Total size of labor force 42% % of households with less than $50,000 income507 Number of employed 21% % of households $50,000-$74,999 income2.1 Unemployment rate 15% % of households $75,000-$99,999 income
13% % of households $100,000-$149,999 income8% % of households $150,000 and above income
456 Total number of housing units 90% % of workers who commute by car, truck or van96% % Owner-occupied housing units 0% % of workers who commute by public transit4% % Renter-occupied housing units 0% % of workers who commute by walking
1% % of workers who commute by other means 1% % of housing units with no vehicles 9% % of workers who worked at home
29% % of housing units with 1 vehicle70% % of housing units with 2 or more vehicles 37.4 Mean travel time to work (minutes)
HOUSING AND TRANSPORTATION
Data source: U.S. Census Bureau, 2017 American Community Survey (ACS) Five-year Estimates
MUNICIPALITY AND LAND USE
Data source: MassGIS, 2005 Land Use Data
DEMOGRAPHICS
Data source: U.S. Census Bureau, 2017 American Community Survey (ACS) Five-year Estimates
SOCIO-ECONOMICS
Data source: U.S. Census Bureau, 2017 American Community Survey (ACS) Five-year Estimates; MA EOLWD Labor Market Information, 2018 LAUS

22
Regional Leaders Listening Session
The following offers a description of the organizations that were represented at the June 20, 2019
Listening Session.
Franklin County Regional Housing Authority
The Franklin County Regional Housing and Redevelopment Authority (HRA) serves the housing and
community development needs of the twenty-six towns of Franklin County in northwestern
Massachusetts. The HRA works with residents to successfully access a wide variety of housing resources,
and also work with the municipalities of Franklin County to apply for and administer grant funding for
various infrastructure and community development projects.
Franklin Regional Council of Governments
The Franklin Regional Council of Governments (FRCOG) is a political subdivision of the Commonwealth
of Massachusetts and is the Regional Planning Agency (RPA) for Franklin County, Massachusetts, the
most rural region of the State. The governing body of the organization has representatives from all 26
communities, the Franklin Regional Planning Board, and two regionally elected officials. As the RPA for
Franklin County, the FRCOG provides land use, natural resource, economic development and
transportation planning services to Franklin County communities and the region. In addition, the FRCOG
provides extensive GIS database development, mapping, and analysis services and are an affiliate of the
Massachusetts State Data Center. The FRCOG’s interests include the natural resources, recreation
opportunities and amenities, and the local and regional economy of Franklin County.
Franklin Regional Transit Authority
The Franklin Regional Transit Authority (FRTA) was established in 1978 with the provisions of Chapter
161B and it currently serves 41 communities throughout Franklin, Hampden, Hampshire and Worcester
Counties. While it is not the largest Transit Authority in Massachusetts, the FRTA covers the greatest
distance at 1121.08 square miles of service coverage and in the most geographically rural area in the
state. The FRTA is the only Transit Authority in the Commonwealth that does not have evening or
weekend service.
Greenfield Community College
Greenfield Community College is located in the beautiful and historic Pioneer Valley of western
Massachusetts, between the foothills of the Berkshire Mountains and the fertile farmland of the
Connecticut River watershed. GCC is known for the caring and supportive attitude of the faculty and
staff, academic excellence, and for the broad support it enjoys from the surrounding community. Its Fall
2018 enrollment exceeded 3,000.
Greening Greenfield
Greening Greenfield is a group of concerned citizens working with residents, businesses and town government to build a more resilient and sustainable Greenfield. Greening Greenfield aims to make Greenfield, MA a more sustainable, resilient and vibrant place to live. Among other things, Greening Greenfield works to help Greenfield reach its 2050 goals to reduce energy use by 80%, and reduce the funds leaving our community to purchase energy to ZERO.

23
MassHire Franklin Hampshire Career Center
MassHire Franklin Hampshire Career Center provides employment and training services at no charge to job seekers and employers in Franklin County, Hampshire County, and the North Quabbin area. MassHire has been operated by the Franklin Hampshire Employment and Training Consortium since 1981. The Franklin Hampshire region is one of the most rural in Massachusetts with over 1,400 square miles of geography and a total population of approximately 245,000. MassHire serves the 50 communities of Franklin and Hampshire Counties as well as the communities of Royalston, Athol, Phillipston, and Petersham in Worcester County that are part of the North Quabbin area.

PROFILES OF FRANKLIN COUNTY, MA COMMUNITIESCONWAY, MA
Town of Conway 24,210.1 Total square milesSelectboard/Town Meeting 84% % Foresthttp://www.townofconway.com/ 8% % Cropland or Pasture
3% % Residential0% % Commercial or Industrial1% % Water
1,800 Total population 99% % White race19% % Under 18 years 0% % Black or African American race60% % 18-64 years 0% % Asian race21% % 65 years and over 1% % Other race51.3 Median Age 0% % Two or more races
2% % of Hispanic or Latino origin of any race
729 Total households Highest educational attainment for2.47 Average household size population age 25 years and over497 Total families 14% % High school graduate or equivalency2.86 Average family size 8% % Associate's degree
26% % Bachelor's degree8% % of population who are veterans 36% % Graduate degree
11% % of population with a disability$100,398 Median household income
66% % of workers in private sector $128,393 Median family income16% % of workers in government sector $51,071 Per capita income17% % of workers self-employed 2.3% Poverty rate
1,233 Total size of labor force 19% % of households with less than $50,000 income1,208 Number of employed 21% % of households $50,000-$74,999 income
2.0 Unemployment rate 9% % of households $75,000-$99,999 income24% % of households $100,000-$149,999 income27% % of households $150,000 and above income
879 Total number of housing units 83% % of workers who commute by car, truck or van86% % Owner-occupied housing units 1% % of workers who commute by public transit14% % Renter-occupied housing units 3% % of workers who commute by walking
1% % of workers who commute by other means 1% % of housing units with no vehicles 13% % of workers who worked at home
27% % of housing units with 1 vehicle72% % of housing units with 2 or more vehicles 28.9 Mean travel time to work (minutes)
HOUSING AND TRANSPORTATION
Data source: U.S. Census Bureau, 2017 American Community Survey (ACS) Five-year Estimates
MUNICIPALITY AND LAND USE
Data source: MassGIS, 2005 Land Use Data
DEMOGRAPHICS
Data source: U.S. Census Bureau, 2017 American Community Survey (ACS) Five-year Estimates
SOCIO-ECONOMICS
Data source: U.S. Census Bureau, 2017 American Community Survey (ACS) Five-year Estimates; MA EOLWD Labor Market Information, 2018 LAUS

PROFILES OF FRANKLIN COUNTY, MA COMMUNITIESGREENFIELD, MA
Town of Greenfield 14,036.3 Total square milesMayor/City Council 45% % Foresthttp://greenfield-ma.gov/ 12% % Cropland or Pasture
19% % Residential4% % Commercial or Industrial2% % Water
17,474 Total population 92% % White race18% % Under 18 years 3% % Black or African American race62% % 18-64 years 1% % Asian race20% % 65 years and over 2% % Other race43.9 Median Age 3% % Two or more races
7% % of Hispanic or Latino origin of any race
7,884 Total households Highest educational attainment for2.13 Average household size population age 25 years and over
4,058 Total families 29% % High school graduate or equivalency2.83 Average family size 13% % Associate's degree
17% % Bachelor's degree9% % of population who are veterans 14% % Graduate degree
16% % of population with a disability$47,821 Median household income
76% % of workers in private sector $70,729 Median family income15% % of workers in government sector $30,089 Per capita income9% % of workers self-employed 13.2% Poverty rate
9,890 Total size of labor force 51% % of households with less than $50,000 income9,596 Number of employed 18% % of households $50,000-$74,999 income
3 Unemployment rate 13% % of households $75,000-$99,999 income12% % of households $100,000-$149,999 income6% % of households $150,000 and above income
8,334 Total number of housing units 89% % of workers who commute by car, truck or van56% % Owner-occupied housing units 0% % of workers who commute by public transit44% % Renter-occupied housing units 5% % of workers who commute by walking
1% % of workers who commute by other means 11% % of housing units with no vehicles 5% % of workers who worked at home43% % of housing units with 1 vehicle46% % of housing units with 2 or more vehicles 19.4 Mean travel time to work (minutes)
HOUSING AND TRANSPORTATION
Data source: U.S. Census Bureau, 2017 American Community Survey (ACS) Five-year Estimates
MUNICIPALITY AND LAND USE
Data source: MassGIS, 2005 Land Use Data
DEMOGRAPHICS
Data source: U.S. Census Bureau, 2017 American Community Survey (ACS) Five-year Estimates
SOCIO-ECONOMICS
Data source: U.S. Census Bureau, 2017 American Community Survey (ACS) Five-year Estimates; MA EOLWD Labor Market Information, 2018 LAUS
26
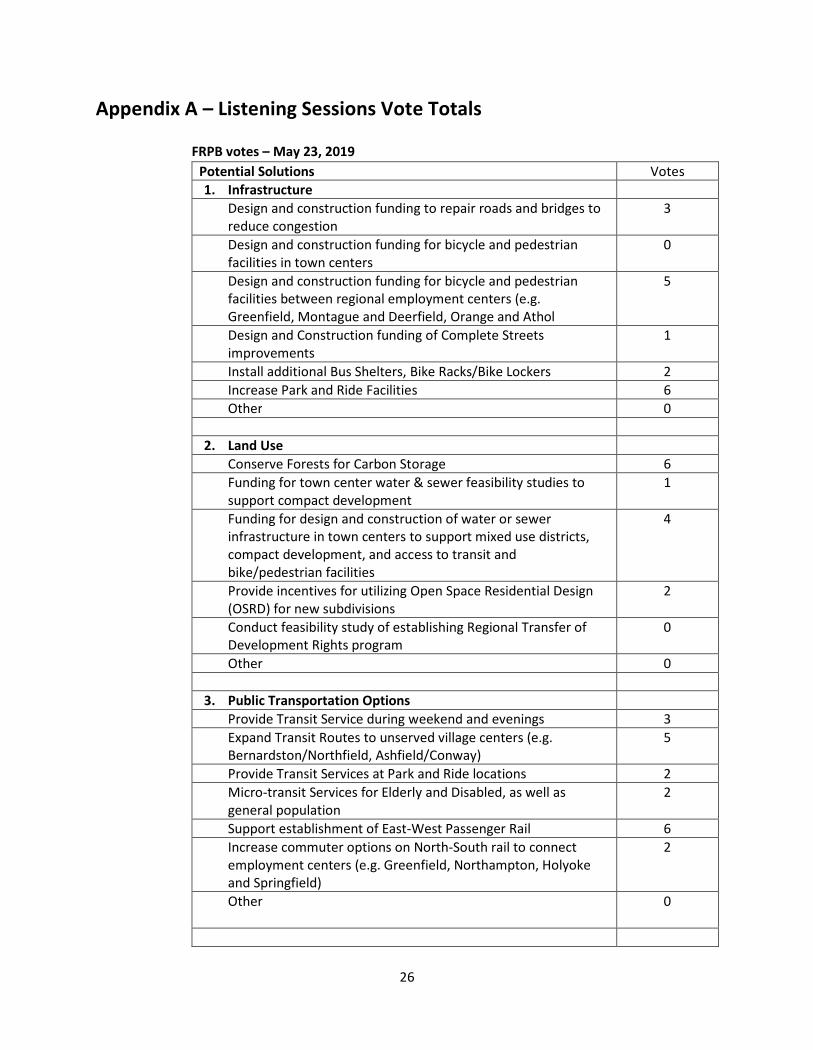
Appendix A – Listening Sessions Vote Totals
FRPB votes – May 23, 2019
Potential Solutions Votes
1. Infrastructure
Design and construction funding to repair roads and bridges to reduce congestion
3
Design and construction funding for bicycle and pedestrian facilities in town centers
0
Design and construction funding for bicycle and pedestrian facilities between regional employment centers (e.g. Greenfield, Montague and Deerfield, Orange and Athol
5
Design and Construction funding of Complete Streets improvements
1
Install additional Bus Shelters, Bike Racks/Bike Lockers 2
Increase Park and Ride Facilities 6
Other 0
2. Land Use
Conserve Forests for Carbon Storage 6
Funding for town center water & sewer feasibility studies to support compact development
1
Funding for design and construction of water or sewer infrastructure in town centers to support mixed use districts, compact development, and access to transit and bike/pedestrian facilities
4
Provide incentives for utilizing Open Space Residential Design (OSRD) for new subdivisions
2
Conduct feasibility study of establishing Regional Transfer of Development Rights program
0
Other 0
3. Public Transportation Options
Provide Transit Service during weekend and evenings 3
Expand Transit Routes to unserved village centers (e.g. Bernardston/Northfield, Ashfield/Conway)
5
Provide Transit Services at Park and Ride locations 2
Micro-transit Services for Elderly and Disabled, as well as general population
2
Support establishment of East-West Passenger Rail 6
Increase commuter options on North-South rail to connect employment centers (e.g. Greenfield, Northampton, Holyoke and Springfield)
2
Other
0

27
4. Cleaner Vehicles
Expand Electric Vehicle Charging Stations 8
Electric & Hybrid Vehicle Purchase Incentives or Subsidies 7
Parking Incentives for Electric Vehicles (e.g. reserved/free parking spots in public parking areas
6
Subsidies for vehicles that run on biodiesel 0
Establish Bike Share Program 0
Other
0
5. Options for Underserved populations (e.g. Seniors, Low-Income residents)
Subsidies for Transit Passes 4
Subsidies for Taxi, Uber & Lyft Services 1
Subsidies for Hybrid and Electric Vehicles 2
Micro-transit Services 4
Increase affordable and work force housing in mixed use districts and areas served by public transit
3
Other 0
6. Non-Transportation Options/Technology
Broadband to support working at home 7
Web Medical Visits; Expansion of Town Nurse Services 3
Remote Shopping 2
Other 0
7. Other Ideas
Incentives for employer sponsored vanpools 4
Carpool matching services 1
Other – Time of Day Toll Road Fee (congestion pricing) 0
Other – Training Elders to do on-line shopping 0

28
Regional Leaders’ votes – June 20, 2019
Potential Solutions Votes
1. Infrastructure
Design and construction funding to repair roads and bridges to reduce congestion
0
Design and construction funding for bicycle and pedestrian facilities in town centers
1
Design and construction funding for bicycle and pedestrian facilities between regional employment centers (e.g. Greenfield, Montague and Deerfield, Orange and Athol
0
Design and Construction funding of Complete Streets improvements
1
Install additional Bus Shelters, Bike Racks/Bike Lockers 2
Increase Park and Ride Facilities 1
Other 0
2. Land Use
Conserve Forests for Carbon Storage 0
Funding for town center water & sewer feasibility studies to support compact development
2
Funding for design and construction of water or sewer infrastructure in town centers to support mixed use districts, compact development, and access to transit and bike/pedestrian facilities
5
Provide incentives for utilizing Open Space Residential Design (OSRD) for new subdivisions
0
Conduct feasibility study of establishing Regional Transfer of Development Rights program
0
Other 0
3. Public Transportation Options
Provide Transit Service during weekend and evenings 9
Expand Transit Routes to unserved village centers (e.g. Bernardston/Northfield, Ashfield/Conway)
6
Provide Transit Services at Park and Ride locations 0
Micro-transit Services for Elderly and Disabled, as well as general population
4
Support establishment of East-West Passenger Rail 6
Increase commuter options on North-South rail to connect employment centers (e.g. Greenfield, Northampton, Holyoke and Springfield)
6
Other
0

29
4. Cleaner Vehicles
Expand Electric Vehicle Charging Stations 0
Electric & Hybrid Vehicle Purchase Incentives or Subsidies 9
Parking Incentives for Electric Vehicles (e.g. reserved/free parking spots in public parking areas
0
Subsidies for vehicles that run on biodiesel 0
Establish Bike Share Program 0
Other – Charging for Apartments/Condos; on-street metered charging
2
Other – Charging at Park & Ride lots 1
5. Options for Underserved populations (e.g. Seniors, Low-Income residents)
Subsidies for Transit Passes 5
Subsidies for Taxi, Uber & Lyft Services 2
Subsidies for Hybrid and Electric Vehicles 1
Micro-transit Services 3
Increase affordable and work force housing in mixed use districts and areas served by public transit
10
Other 0
6. Non-Transportation Options/Technology
Broadband to support working at home 5
Web Medical Visits; Expansion of Town Nurse Services 0
Remote Shopping 0
Other – Broadband to support rideshare dispatch 1
Other – Motivate businesses to support working at home 1
Other – Cell service expansion (not all areas of Franklin County have service)
1
7. Other Ideas
Incentives for employer sponsored vanpools 1
Carpool matching services 0
Other – Incentives from Employers to Walk to Work 2
Other – Flexible Work Schedule 0
Other – Pricing Incentives 0