Embed Size (px)
Citation preview

1
N C S L S P R I N G F O R U M 2 0 0 9 – A F O C U S O N P U B L I C – P R I V A T E P A R T N E R S H I P S
2 2 A P R I L 2 0 0 9
W A S H I N G T O N , D C
Transportation Funding Overview:
Challenges and Opportunities
Joung H. LeeSenior Analyst for Transportation Finance and Business Development
American Association of State Highway and Transportation Officials
Deputy Director for Operations
Center for Excellence in Project Finance

2
N C S L S P R I N G F O R U M 2 0 0 9 – A F O C U S O N P U B L I C – P R I V A T E P A R T N E R S H I P S
2 2 A P R I L 2 0 0 9
W A S H I N G T O N , D C
Session Objectives
• To examine current trends impacting the Highway Trust Fund
• To outline AASHTO’s policy recommendations for the next surface transportation authorization
• To look at potential resources for investment
• To answer questions about these topics

3
N C S L S P R I N G F O R U M 2 0 0 9 – A F O C U S O N P U B L I C – P R I V A T E P A R T N E R S H I P S
2 2 A P R I L 2 0 0 9
W A S H I N G T O N , D C
Current Trends and Challenges
Vehicle Miles Traveled - February 2003 to February 2009(Moving 12 Month Total)
2,750
2,800
2,850
2,900
2,950
3,000
3,050
3,100
Feb-03
May-03
Aug-03
Nov-03
Feb-04
May-04
Aug-04
Nov-04
Feb-05
May-05
Aug-05
Nov-05
Feb-06
May-06
Aug-06
Nov-06
Feb-07
May-07
Aug-07
Nov-07
Feb-08
May-08
Aug-08
Nov-08
Feb-09
(Bill
ions
of M
iles)

Truck, Buses, and Trailer Retail Tax Receipts (1957-2008)
0
500
1,000
1,500
2,000
2,500
3,000
3,500
4,000
4,500
1957
1960
1963
1966
1969
1972
1975
1978
1981
1984
1987
1990
1993
1996
1999
2002
2005
2008
Mill
ions
of D
olla
rs (2
008
Con
stan
t)

Purchasing Power Loss of the Highway Program
$32.5$42.0
$51.8 $55.0
$-
$10
$20
$30
$40
$50
$60
FY 2003Funding
Level
ActualEnacted as of
May 2008
FY 2003Inflated for
CostIncreases
(PPI)
Young-Oberstar $375
BillionProposal
(Bill
ions
)
Source: Transportation Weekly

Reduced Highway and Transit Program Levels Beyond 2010
36.941.0
44.2 43.4
36.5
8.6 9.9 9.0 9.5 10.3 10.3
21.7
36.3
5.2
0
5
10
15
20
25
30
35
40
45
50
2005 2006 2007 2008 2009 2010 2011
($ b
illio
ns)
Highways Transit

Source: Federal Highway Administration

"Federal Share" of Highway Investment (assumed to be 45% of total needs)Current Law HTF/HA Revenues extended through 2030
Note: Annual Revenue / VMT growth assumed to slow from 2.2% in 2007 to 0.7% by 2030.Note: Nominal Federal gasoline tax rate assumed to remain at 18.4 cents through 2030.
0
20
40
60
80
100
120
140
160
2007 2008 2009 2010 2011 2012 2013 2014 2015 2016 2017 2018 2019 2020 2021 2022 2023 2024 2025 2026 2027 2028 2029 2030
Year
$ B
illio
ns
"Improve" Target "Maintain" Target HTF/HA Baseline Revenues

10
N C S L S P R I N G F O R U M 2 0 0 9 – A F O C U S O N P U B L I C – P R I V A T E P A R T N E R S H I P S
2 2 A P R I L 2 0 0 9
W A S H I N G T O N , D C
A Restructured Program

11
N C S L S P R I N G F O R U M 2 0 0 9 – A F O C U S O N P U B L I C – P R I V A T E P A R T N E R S H I P S
2 2 A P R I L 2 0 0 9
W A S H I N G T O N , D C
Program Purpose and Structure
• The National Surface Transportation Policy and Revenue Study Commission recommended that the federal program be consolidated and reformed to address “objectives of genuine national interest”
• AASHTO supports the Commission’s push for program and process reform to address the national needs

12
N C S L S P R I N G F O R U M 2 0 0 9 – A F O C U S O N P U B L I C – P R I V A T E P A R T N E R S H I P S
2 2 A P R I L 2 0 0 9
W A S H I N G T O N , D C
Legislative Recommendations• Between 2010 and 2015, in order to invest in a
robust surface transportation program to meet significant national needs, Congress should fund a $545 billion multimodal program comprised of:
o Highway program funded at $375 billion (2015 level = $75 billion)
o Transit program funded at $93 billion (2015 level = $18.5 billion)
o Freight program funded at $42 billion(2015 level = $9 billion)
o Intercity passenger rail program funded at $35 billion(2015 level = $7.0 billion)

13
N C S L S P R I N G F O R U M 2 0 0 9 – A F O C U S O N P U B L I C – P R I V A T E P A R T N E R S H I P S
2 2 A P R I L 2 0 0 9
W A S H I N G T O N , D C
Legislative Recommendations
• Maintain the current federal and state sharesfor highway and transit capital programs
• We need to restore purchasing power by making sure the impact of inflation on commodities and construction costs must be addressed in setting investment levels
• Eliminate or drastically limit earmarking in federal transportation programs
• Develop policies that support maximum flexibility to allow for use of both conventional and innovative funding and financing tools

14
N C S L S P R I N G F O R U M 2 0 0 9 – A F O C U S O N P U B L I C – P R I V A T E P A R T N E R S H I P S
2 2 A P R I L 2 0 0 9
W A S H I N G T O N , D C
Legislative Recommendations
• Strong accountability measures must accompany substantially increased funding to ensure resources are spent as efficiently and effectively as possible
• Adopt a long‐range approach to funding the surface transportation system that gradually moves away from dependence on the current motor fuels tax to a distance‐based direct user fee such as a fee on vehicle miles traveled
• Assure that any climate change legislation that creates a new revenue source, either through a carbon tax or cap‐and‐trade, provides substantial funding for transportation
15
N C S L S P R I N G F O R U M 2 0 0 9 – A F O C U S O N P U B L I C – P R I V A T E P A R T N E R S H I P S
2 2 A P R I L 2 0 0 9
W A S H I N G T O N , D C
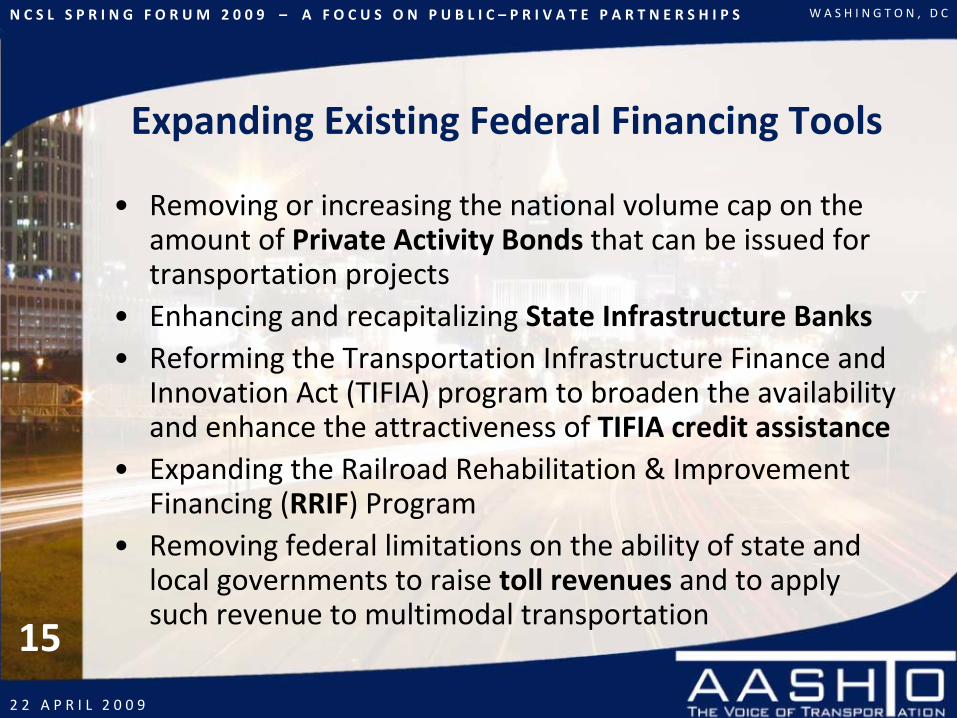
Expanding Existing Federal Financing Tools
• Removing or increasing the national volume cap on the amount of Private Activity Bonds that can be issued for transportation projects
• Enhancing and recapitalizing State Infrastructure Banks• Reforming the Transportation Infrastructure Finance and
Innovation Act (TIFIA) program to broaden the availability and enhance the attractiveness of TIFIA credit assistance
• Expanding the Railroad Rehabilitation & Improvement Financing (RRIF) Program
• Removing federal limitations on the ability of state and local governments to raise toll revenues and to apply such revenue to multimodal transportation

Proposed Program Funding Levelsto Restore Purchasing Power
Potential Program Name 2010 2011 2012 2013 2014 2015 TOTAL
Preservation and Renewal $28.00 $30.80 $33.60 $36.40 $39.20 $42.00 $210.00
Highway Freight (Based on Existing Revenues) $2.40 $2.64 $2.88 $3.12 $3.36 $3.60 $18.00
Highway Safety Improvement Program $2.60 $2.86 $3.12 $3.38 $3.64 $3.90 $19.50
Operations $2.40 $2.64 $2.88 $3.12 $3.36 $3.60 $18.00
Transportation System Improvement/Congestion Reduction $11.10 $12.21 $13.32 $14.43 $15.54 $16.65 $83.25
Environment Program $3.50 $3.85 $4.20 $4.55 $4.90 $5.25 $26.25
TOTAL - Highways $50.00 $55.00 $60.00 $65.00 $70.00 $75.00 $375.00
TOTAL - Transit $12.5 $13.7 $14.9 $16.1 $17.3 $18.5 $93.00
TOTAL - Freight (Based on New Revenues Outside of Highway Trust Fund) $5.0 $5.8 $6.6 $7.4 $8.2 $9.0 $42.00
TOTAL - Intercity Passenger Rail $5.0 $5.3 $5.6 $5.9 $6.2 $7.0 $35.00
GRAND TOTAL $72.50 $79.80 $87.10 $94.40 $101.70 $109.50 $545.00

Annual Average Annual TotalIllustrative Revenues Revenues Revenues
Funding Mechanisms Rate 2010 2010-2015 2010-2015Annual Highway Miles Traveled Fee (Cars Only) 17,298$ 1.0¢ 17,298$ 17,616$ 105,696$
Annual Highway Miles Traveled Fee (All light duty vehicles) 27,610$ 1.0¢ 27,610$ 28,682$ 172,094$ Annual Highway User Vehicle Fee $1.00 Fee = 263$ $1.00 263$ 275$ 1,652$
Carbon Tax or Cap And Trade Auction Proceeds 553$ 30.0¢ 16,594$ 17,250$ 103,501$
Container Tax 57$ $20.00 1,137$ 1,336$ 8,013$ Diesel Tax Increase Plus Indexing 1¢/gal = 411$ 13.0¢ 5,337$ 5,976$ 35,856$
Existing Highway Trust Fund Sources 40,566$ 42,569$ 255,413$
Gas Tax Increase Plus Indexing 1¢/gal = 1,380$ 10.0¢ 13,796$ 15,082$ 90,489$
General Fund Support for Intercity Passenger Rail 3,000$ 3,000$ 18,000$
General Fund Transfers for Transit 3,167$ 3,167$ 19,000$
Index Existing Highway Trust Fund Sources Beginning in 2010 791$ 3,032$ 18,192$
Index Heavy Vehicle Use Tax Retroactively to 1997 411$ 536$ 3,217$
Interest on Highway Trust Fund Balances 200$ 200$ 1,200$
Motor Fuel Tax Exemption Reimbursement (Retroactive and Future) 1,057$ 1,099$ 6,593$
Sales Tax on Motor Fuels 1.0% of Sales = 6,136$ 2.5% 15,340$ 15,658$ 93,949$
Share of US Customs Revenues 1% of Receipts = 314$ 5.0% 1,570$ 1,817$ 10,904$
Tax Credit Bonds for Highways and Transit 8,333$ 8,333$ 50,000$
Tax Credit Bonds for Intercity Passenger Rail 4,167$ 4,167$ 25,000$
Ton Freight Charge -- All Modes 1¢/ton = 162$ 10.0¢ 1,617$ 1,801$ 10,804$
Ton Freight Charge -- Truck Only 1¢/ton = 111$ 10.0¢ 1,115$ 1,242$ 7,452$
Ton-Mile Freight Charge -- All Modes 1¢/ton-mile = 42,763$ 0.1¢ 4,276$ 4,763$ 28,579$
Ton-Mile Freight Charge -- Truck Only 1¢/ton-mile = 12,516$ 0.1¢ 1,252$ 1,394$ 8,365$
US Freight Bill -- All Modes 1% of Sales = 7,708$ 1.0% 7,708$ 8,585$ 51,513$
US Freight Bill -- Truck Only 1% of Sales = 6,497$ 1.0% 6,497$ 7,237$ 43,420$
Vehicle Sales Tax on New Passenger Cars/Light-duty Trucks 1% of Sales = 4,853$ 2.0% 9,707$ 10,812$ 64,870$
Vehicle Sales Tax on New/Used Passenger Cars/Light-duty Trucks 1% of Sales = 9,012$ 2.0% 18,024$ 20,077$ 120,461$
Total Revenues 210,831$ 225,705$ 1,354,232$
1¢/gal or equiv =
$1 per TEU =
Surface Transportation Funding Options Matrix (all revenue estimates in $millions)
Mechanism Yield(2010)
1¢/VMT =
1¢/VMT =

18
N C S L S P R I N G F O R U M 2 0 0 9 – A F O C U S O N P U B L I C – P R I V A T E P A R T N E R S H I P S
2 2 A P R I L 2 0 0 9
W A S H I N G T O N , D C
Thank You
Joung H. LeeSenior Analyst for Transportation Finance and Business Development
AASHTO ‐ American Association of State Highway and Transportation Officials444 North Capitol Street NW, Suite 249
Washington, DC 20001Phone: (202) 624‐5818
Fax: (202) 624‐5469Email: [email protected]
Web: www.transportation.org