Embed Size (px)
Citation preview
Transportation Finance in
Massachusetts: An Unsustainable System
Findings of the Massachusetts Transportation Finance
Commission
March 28, 2007
Transportation Finance in Massachusetts:
An Unsustainable System
Findings of the Massachusetts Transportation Finance
Commission
March 28, 2007
Members of the Commission:
Chairman: Stephen J. Silveira, Vice President ML Strategies, LLC
James A. Aloisi, Jr., Goulston & Storrs Harold Hestnes, Esq., WilmerHale
Alan G. Macdonald, Executive Director, Massachusetts Business Roundtable Patricia McGovern, Senior Vice President, Beth Israel Deaconess Medical Center
John M. Pourbaix, Jr., Executive Director, Construction Industries of Massachusetts, Inc. Paul Regan, Executive Director, MBTA Advisory Board
Honorable Joseph C. Sullivan, Former Chairman, Joint Legislative Committee on Transportation Kevin J. Sullivan, Senior Vice President, Sovereign Bank
Frank A. Tramontozzi, P.E., Senior Vice President, Fay Spofford & Thorndike Christopher P. Vincze, Chief Executive Officer, TRC Solutions
Michael J. Widmer, President, Massachusetts Taxpayers Foundation
About the Massachusetts Transportation Finance Commission
Chapter 196 of the Acts of 2004 established a special Transportation Finance Commission to develop a comprehensive, multimodal, long-range, transportation finance plan for the Commonwealth of Massachusetts. Specifically, the Commission was given a two-part charge:
1. To analyze the state’s long-term capital and operating needs for the transportation system,1 the funds expected to be available, and to estimate the extent to which a gap exists; and
2. To make recommendations to close this funding gap through potential cost savings, efficiencies, and additional revenue.
This report presents the Transportation Finance Commission’s analysis of the Commonwealth’s ability to fund needed surface transportation improvements. After a brief Introduction in Section 1.0, Section 2.0 provides policy context for the problem, explaining the big-picture, cross-cutting themes that emerged from the Commission’s study. Section 3.0 describes our estimate of the resource gap for restoring and maintaining the system in a state of good repair.2 Following public discussion on the depth and breadth of the problem facing our transportation system, the Commission will issue a second report that contains options and recommendations to address the issues described in this report.
1 The enabling legislation called for the Commission to look out 25 years. However, after the
Romney Administration issued their 20-year transportation plan, the Commission adjusted to analyze the same time frame.
2 The term “state of good repair” is used in the transit industry to denote a condition whereby all
capital assets are functioning at their intended capacity within their design life.

Transportation Finance in Massachusetts: Findings of the An Unsustainable System Massachusetts Transportation Finance Commission
1
11..00 IInnttrroodduuccttiioonn
We take our transportation system for granted. We use it for virtually every aspect of our lives: work, education, recreation, and medical necessities, to name a few. It is also vital for transporting goods and services. It provides the basic underpinning of our economy. Despite the importance of recent advances in technology – notably the “World Wide Web” of the information superhighway – the concrete and steel web of streets, roads, transit services, rail lines, and water and air transportation remains the original “web” – the critical component of our quality of life and economic vitality.
Since most of the system was built at least a generation or two ago, it seems as if it has always been here and always will be, without requiring any extraordinary attention. But this is not the case. The MBTA, our region’s major transit agency is over 100 years old and has been undermaintained for at least the last few decades. The Interstate Highway System is 50 years old, and similarly has been undermaintained. It is possible to sustain such a course for some period of time, but not indefinitely. The Transportation Finance Commission has concluded that our system has been neglected for years, and that the system we take for granted will fail if we do not take prompt and decisive action.
The Transportation Finance Commission reviewed the most recent actions and decisions of the transportation agencies, spending trends over the past 20 years, and plans for the next 20 years. In each and every instance, we chose to take a very conservative view to make sure we did not overstate the size of the problem. Nonetheless, we estimate that over the next 20 years, the cost just to maintain our transportation system exceeds the anticipated resources available by $15 billion to $19 billion. This does nothing to address necessary expansions or enhancements.
Our findings paint a dire picture. Numerous decisions were made in the past that have led us to this juncture. But this report is not about pointing fingers or assigning blame. We need to grasp the enormity of the problem that we face, recognize that “business as usual” will not suffice, and work together to develop sustainable solutions for our transportation system.

Transportation Finance in Massachusetts: Findings of the An Unsustainable System Massachusetts Transportation Finance Commission
3
22..00 TThhee SShhaappee ooff tthhee TTrraannssppoorrttaattiioonn FFiinnaannccee PPrroobblleemm iinn MMaassssaacchhuusseettttss
The Massachusetts transportation system is in deep financial trouble because we have not faced up to the reality of how much it costs to preserve the system. We have frequently chosen to develop new (and often desirable) transportation projects. But these have come at the direct expense of maintaining the system that we have. Further inaction at this juncture will cause the problem to get worse, and the costs to restore the system to reasonable condition will multiply. The real cost of neglect will be felt in our regional economy and in our way of life. The Transportation Finance Commission found that:
A. Virtually every transportation agency in the state is running structural deficits and resorting to short-term quick fixes that hide systemic financial problems;
B. The condition of our roads, bridges, and transit systems are all in broad decline;
C. Revenue is being squeezed from all sides; and
D. We have no money for transit or highway enhancements or expansions without further sacrificing our existing systems and exacerbating our problems.
The rest of Section 2.0 is organized around these four conclusions.
AA.. VViirrttuuaallllyy EEvveerryy TTrraannssppoorrttaattiioonn AAggeennccyy iinn tthhee SSttaattee IIss RRuunnnniinngg SSttrruuccttuurraall DDeeffiicciittss aanndd RReessoorrttiinngg ttoo SShhoorrtt--TTeerrmm QQuuiicckk FFiixxeess TThhaatt HHiiddee SSyysstteemmiicc FFiinnaanncciiaall PPrroobblleemmss
Our transportation agencies do not have the resources to do their jobs properly. This lack of funding has led to stop-gap approaches that have kept the system operating in the short term, but threaten the system’s long-term viability. Despite the promise of Forward Funding, the MBTA struggles to balance its books, spending more money than it takes in. This is also true at MassHighway, where routine operations such as grass-cutting are now funded through 20-year bonds. The Department of Conservation and Recreation (DCR) is responsible for many of the Boston region’s most critical arteries, yet has little expertise and no funding to care for them properly. Even the Massachusetts Turnpike Authority, the
Transportation Finance in Massachusetts: Findings of the An Unsustainable System Massachusetts Transportation Finance Commission
4
agency with the most potential control over its revenues, operates at a deficit, choosing to rely on short-term, nonsustainable revenue strategies over stable long-term practices. Moreover, the Regional Transit Authorities around the state must borrow to cover their operating expenses. These conditions and practices point to a financial picture that is heading for a collision with reality.
TThhee MMaassssaacchhuusseettttss BBaayy TTrraannssppoorrttaattiioonn AAuutthhoorriittyy ((MMBBTTAA)) HHaass aa CCrriittiiccaall aanndd GGrroowwiinngg SSttrruuccttuurraall FFuunnddiinngg GGaapp
Forward Funding legislation was enacted in 2000 to place the MBTA on a sound financial footing, and the MBTA developed a finance plan to carry out the legislation.3 But even with three fare increases over the last seven years and short-term actions to fund operations from capital programs, the MBTA is not positioned to produce a sustainable balanced budget. The MBTA has not achieved the operating cost savings envisioned in the Forward Funding legislation, and sales tax revenue and ridership growth have been disappointing. As a result, the MBTA finds itself in a downward spiral in which it cannot generate the revenue necessary to achieve a state of good repair (SGR), meaning that the MBTA cannot improve service quality, retain and attract riders, and increase revenue over time.
MMBBTTAA OOppeerraattiinngg CCoossttss NNoott CCoonnttrroolllleedd
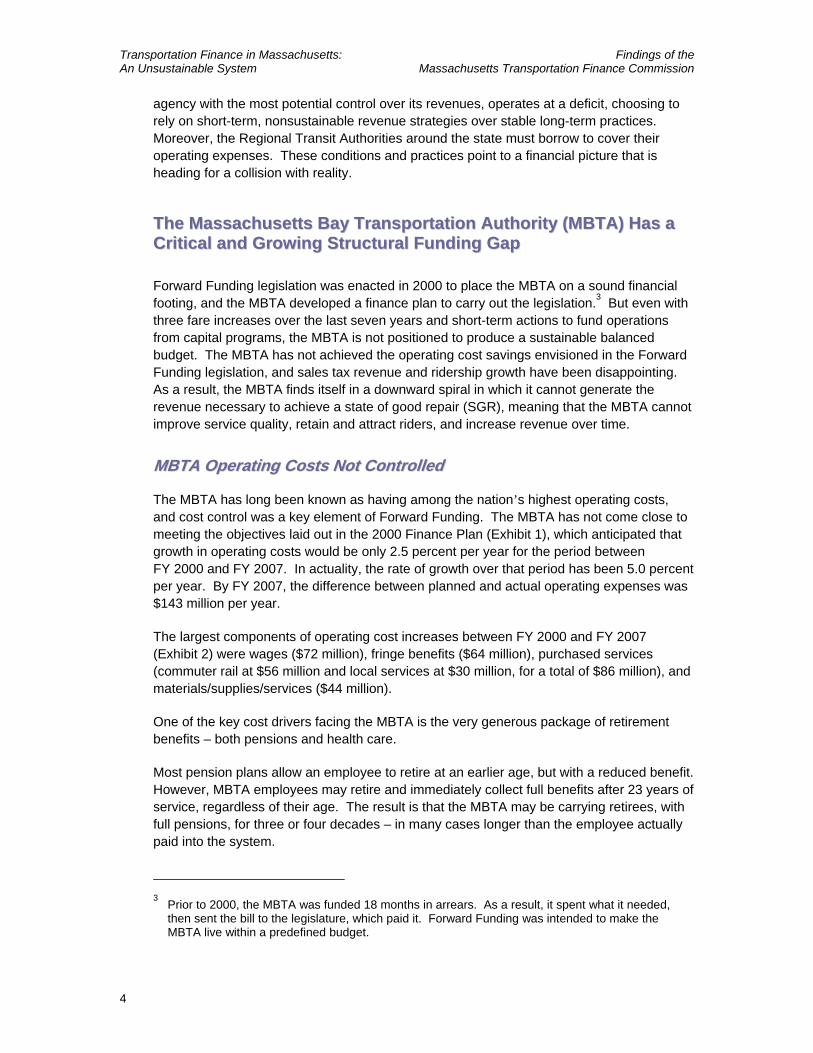
The MBTA has long been known as having among the nation’s highest operating costs, and cost control was a key element of Forward Funding. The MBTA has not come close to meeting the objectives laid out in the 2000 Finance Plan (Exhibit 1), which anticipated that growth in operating costs would be only 2.5 percent per year for the period between FY 2000 and FY 2007. In actuality, the rate of growth over that period has been 5.0 percent per year. By FY 2007, the difference between planned and actual operating expenses was $143 million per year.
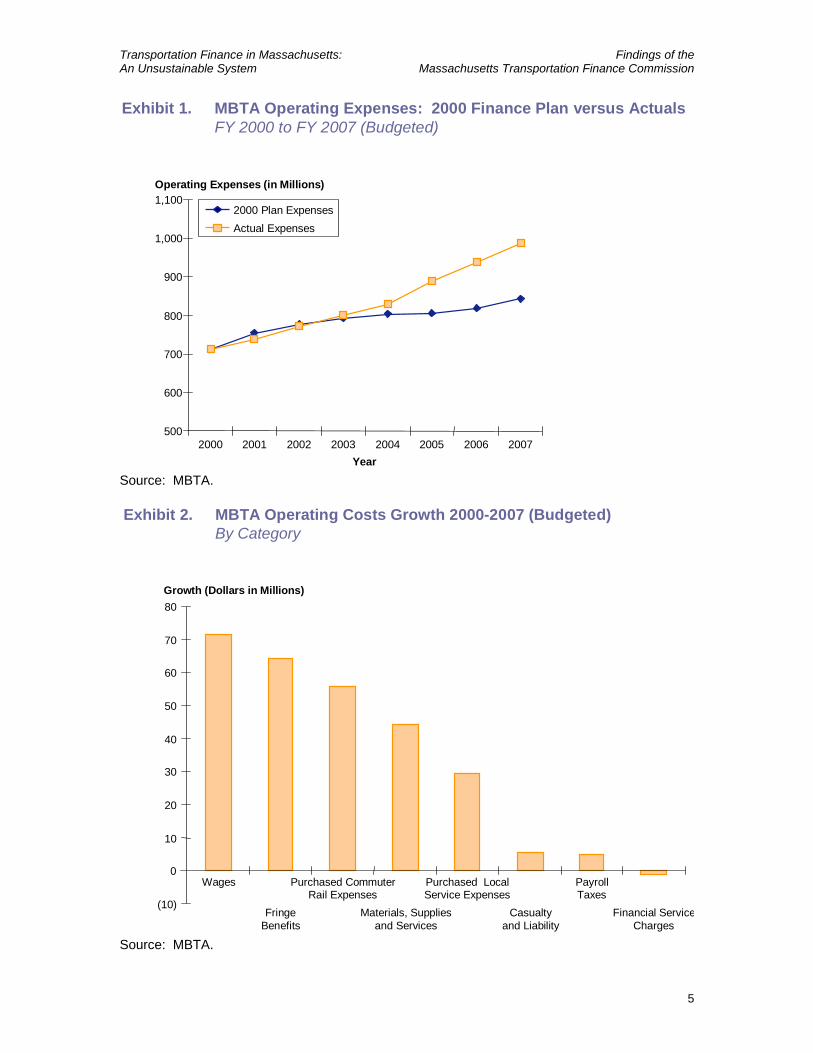
The largest components of operating cost increases between FY 2000 and FY 2007 (Exhibit 2) were wages ($72 million), fringe benefits ($64 million), purchased services (commuter rail at $56 million and local services at $30 million, for a total of $86 million), and materials/supplies/services ($44 million).
One of the key cost drivers facing the MBTA is the very generous package of retirement benefits – both pensions and health care.
Most pension plans allow an employee to retire at an earlier age, but with a reduced benefit. However, MBTA employees may retire and immediately collect full benefits after 23 years of service, regardless of their age. The result is that the MBTA may be carrying retirees, with full pensions, for three or four decades – in many cases longer than the employee actually paid into the system.
3 Prior to 2000, the MBTA was funded 18 months in arrears. As a result, it spent what it needed,
then sent the bill to the legislature, which paid it. Forward Funding was intended to make the MBTA live within a predefined budget.
Transportation Finance in Massachusetts: Findings of the An Unsustainable System Massachusetts Transportation Finance Commission
5
Exhibit 1. MBTA Operating Expenses: 2000 Finance Plan versus ActualsFY 2000 to FY 2007 (Budgeted)
Operating Expenses (in Millions)
2000 Plan ExpensesActual Expenses
Year
500
600
700
800
900
1,000
1,100
2000 2001 2002 2003 2004 2005 2006 2007
Source: MBTA.
Exhibit 2. MBTA Operating Costs Growth 2000-2007 (Budgeted)By Category
(10)
0
10
20
30
40
50
60
70
80
Wages
FringeBenefits
Purchased CommuterRail Expenses
Materials, Suppliesand Services
Purchased LocalService Expenses
Casualtyand Liability
PayrollTaxes
Financial ServiceCharges
Growth (Dollars in Millions)
Source: MBTA.
Transportation Finance in Massachusetts: Findings of the An Unsustainable System Massachusetts Transportation Finance Commission
6
In fact, the retirement benefits package makes it more attractive to retire early than to stay employed. MBTA retirees are able to match the take-home pay of their most lucrative years while they were still working because MBTA pensions are state tax-free. Furthermore, they are eligible to receive Social Security with no offset from their pension payments. Over the past three years about 10 percent of new (non-disability) retirees are under 50 years of age and almost one-third are under 55.
Health care costs are a particular problem. The MBTA’s health care costs are 34 percent higher than the median surveyed transit agency for single premiums and 44 percent higher for family premiums. The combination of early retirement and 100 percent employer-paid health care premiums for retirees with no co-pays puts enormous pressure on the MBTA’s health care budget. It is striking that retirees account for almost half of the MBTA’s health care costs, and even more striking that almost two-thirds of the MBTA’s retiree health care costs are spent on retirees who are under age 65. These are the most expensive years to cover – costs are escalating because of age, but the retirees are not yet eligible for Medicare. It is critical for the MBTA to gain control over these escalating health care costs.
SSaalleess TTaaxx RReevveennuueess DDeeddiiccaatteedd ttoo tthhee MMBBTTAA DDiidd NNoott AAcchhiieevvee GGrroowwtthh TTaarrggeettss aanndd WWiillll NNoott CCaattcchh UUpp OOvveerr TTiimmee
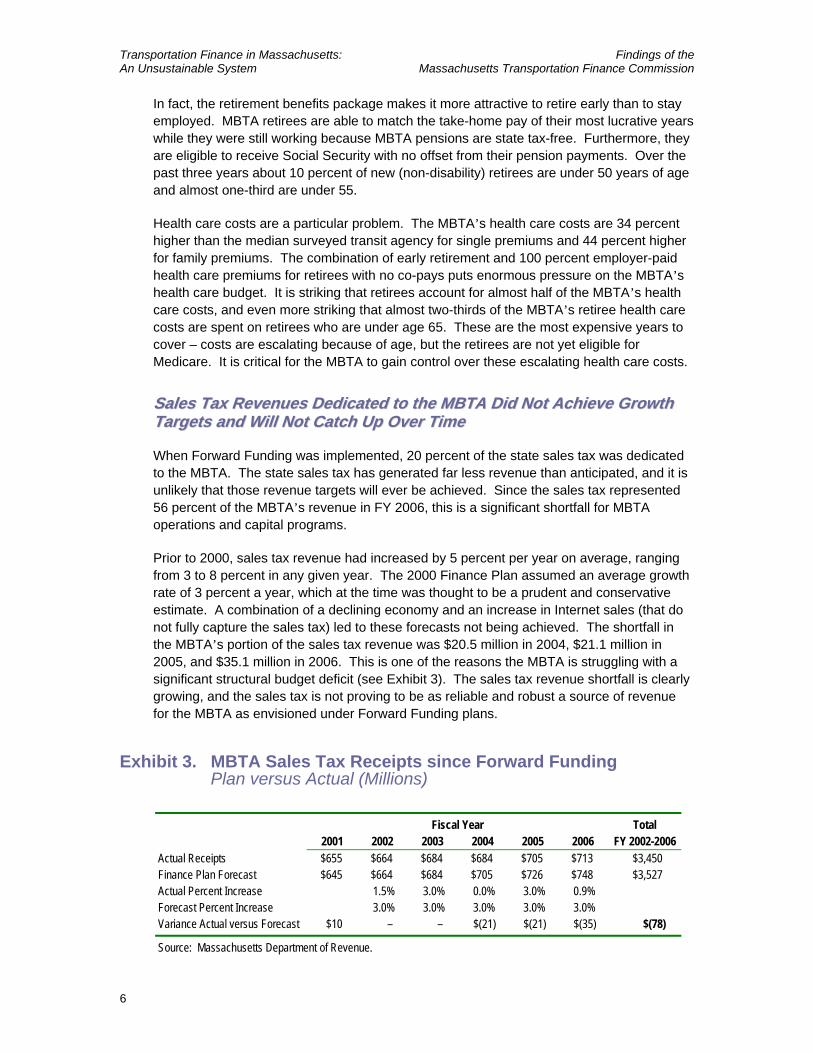
When Forward Funding was implemented, 20 percent of the state sales tax was dedicated to the MBTA. The state sales tax has generated far less revenue than anticipated, and it is unlikely that those revenue targets will ever be achieved. Since the sales tax represented 56 percent of the MBTA’s revenue in FY 2006, this is a significant shortfall for MBTA operations and capital programs.
Prior to 2000, sales tax revenue had increased by 5 percent per year on average, ranging from 3 to 8 percent in any given year. The 2000 Finance Plan assumed an average growth rate of 3 percent a year, which at the time was thought to be a prudent and conservative estimate. A combination of a declining economy and an increase in Internet sales (that do not fully capture the sales tax) led to these forecasts not being achieved. The shortfall in the MBTA’s portion of the sales tax revenue was $20.5 million in 2004, $21.1 million in 2005, and $35.1 million in 2006. This is one of the reasons the MBTA is struggling with a significant structural budget deficit (see Exhibit 3). The sales tax revenue shortfall is clearly growing, and the sales tax is not proving to be as reliable and robust a source of revenue for the MBTA as envisioned under Forward Funding plans.
Exhibit 3. MBTA Sales Tax Receipts since Forward Funding Plan versus Actual (Millions)
Fiscal Year Total 2001 2002 2003 2004 2005 2006 FY 2002-2006
Actual Receipts $655 $664 $684 $684 $705 $713 $3,450 Finance Plan Forecast $645 $664 $684 $705 $726 $748 $3,527 Actual Percent Increase 1.5% 3.0% 0.0% 3.0% 0.9% Forecast Percent Increase 3.0% 3.0% 3.0% 3.0% 3.0% Variance Actual versus Forecast $10 – – $(21) $(21) $(35) $(78)
Source: Massachusetts Department of Revenue.
Transportation Finance in Massachusetts: Findings of the An Unsustainable System Massachusetts Transportation Finance Commission
7
FFaarreess HHaavvee IInnccrreeaasseedd,, BBuutt RReevveennuuee GGrroowwtthh HHaass LLaaggggeedd PPrroojjeeccttiioonnss
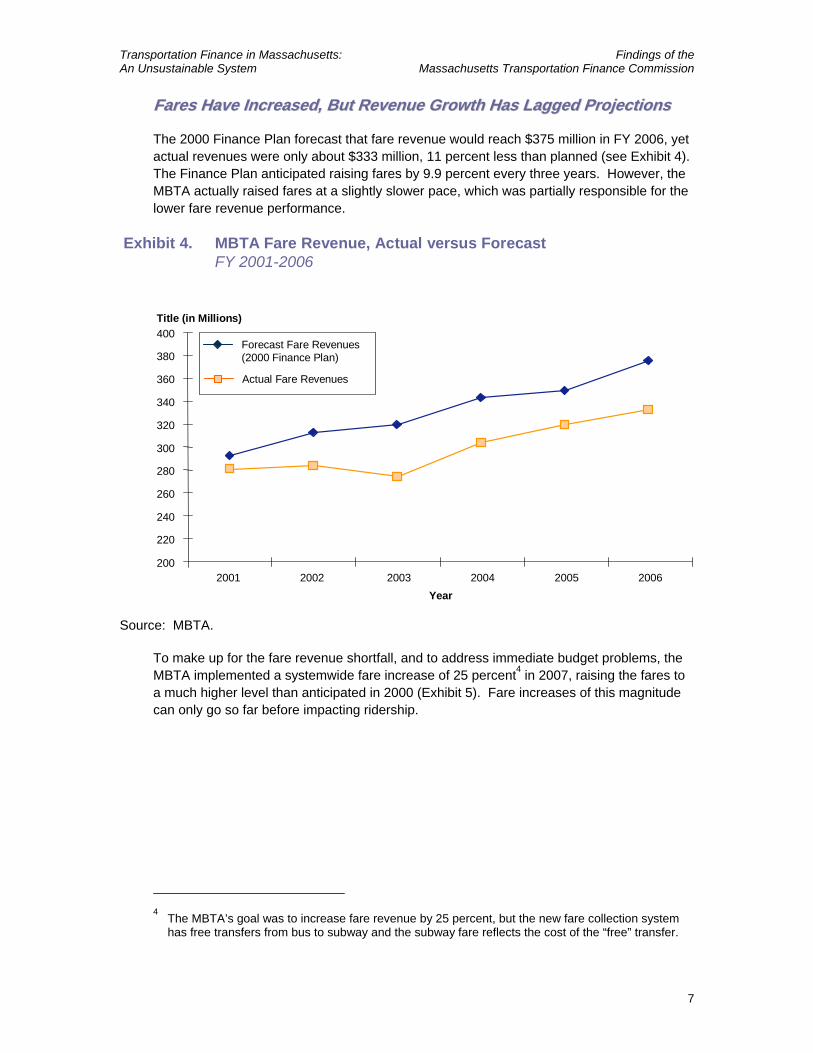
The 2000 Finance Plan forecast that fare revenue would reach $375 million in FY 2006, yet actual revenues were only about $333 million, 11 percent less than planned (see Exhibit 4). The Finance Plan anticipated raising fares by 9.9 percent every three years. However, the MBTA actually raised fares at a slightly slower pace, which was partially responsible for the lower fare revenue performance.
Exhibit 4. MBTA Fare Revenue, Actual versus ForecastFY 2001-2006
Forecast Fare Revenues (2000 Finance Plan)
Actual Fare Revenues
200
220
240
260
280
300
320
340
360
380
400
2001 2002 2003 2004 2005 2006Year
Title (in Millions)
Source: MBTA.
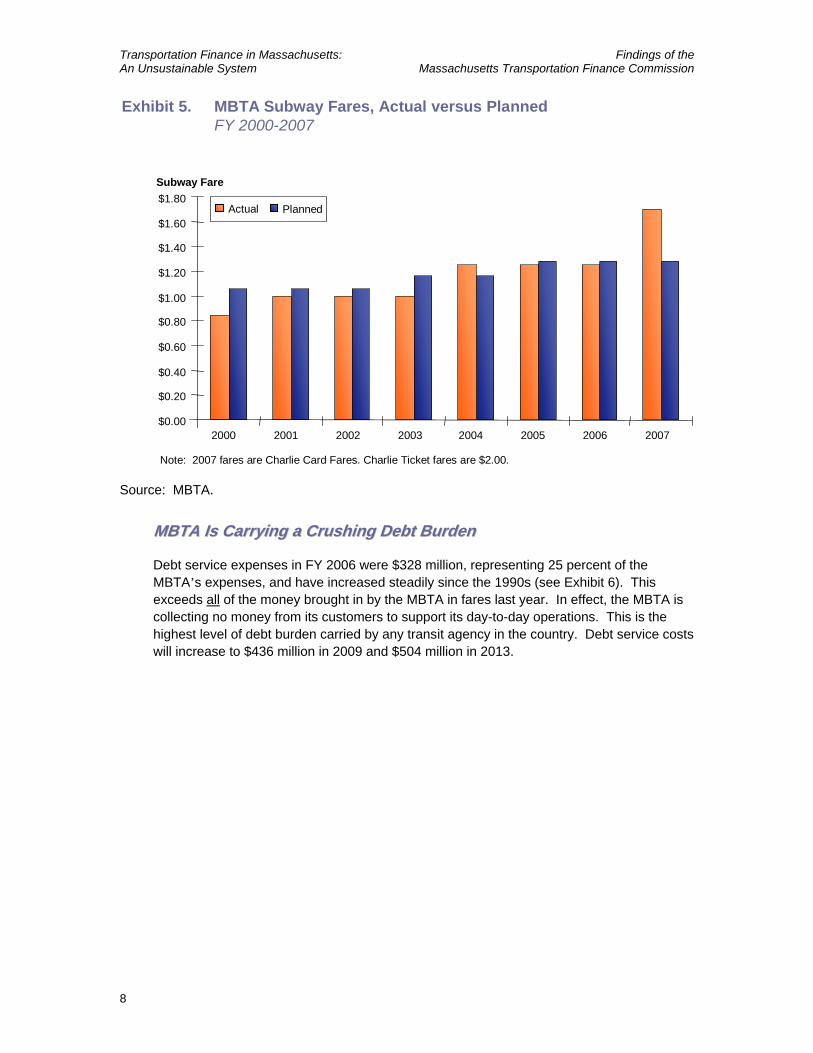
To make up for the fare revenue shortfall, and to address immediate budget problems, the MBTA implemented a systemwide fare increase of 25 percent4 in 2007, raising the fares to a much higher level than anticipated in 2000 (Exhibit 5). Fare increases of this magnitude can only go so far before impacting ridership.
4 The MBTA’s goal was to increase fare revenue by 25 percent, but the new fare collection system
has free transfers from bus to subway and the subway fare reflects the cost of the “free” transfer.
Transportation Finance in Massachusetts: Findings of the An Unsustainable System Massachusetts Transportation Finance Commission
8
Exhibit 5. MBTA Subway Fares, Actual versus PlannedFY 2000-2007
$0.00
$0.20
$0.40
$0.60
$0.80
$1.00
$1.20
$1.40
$1.60
$1.80
2000 2001 2002 2003 2004 2005 2006 2007
Actual Planned
Note: 2007 fares are Charlie Card Fares. Charlie Ticket fares are $2.00.
Subway Fare
Source: MBTA.
MMBBTTAA IIss CCaarrrryyiinngg aa CCrruusshhiinngg DDeebbtt BBuurrddeenn
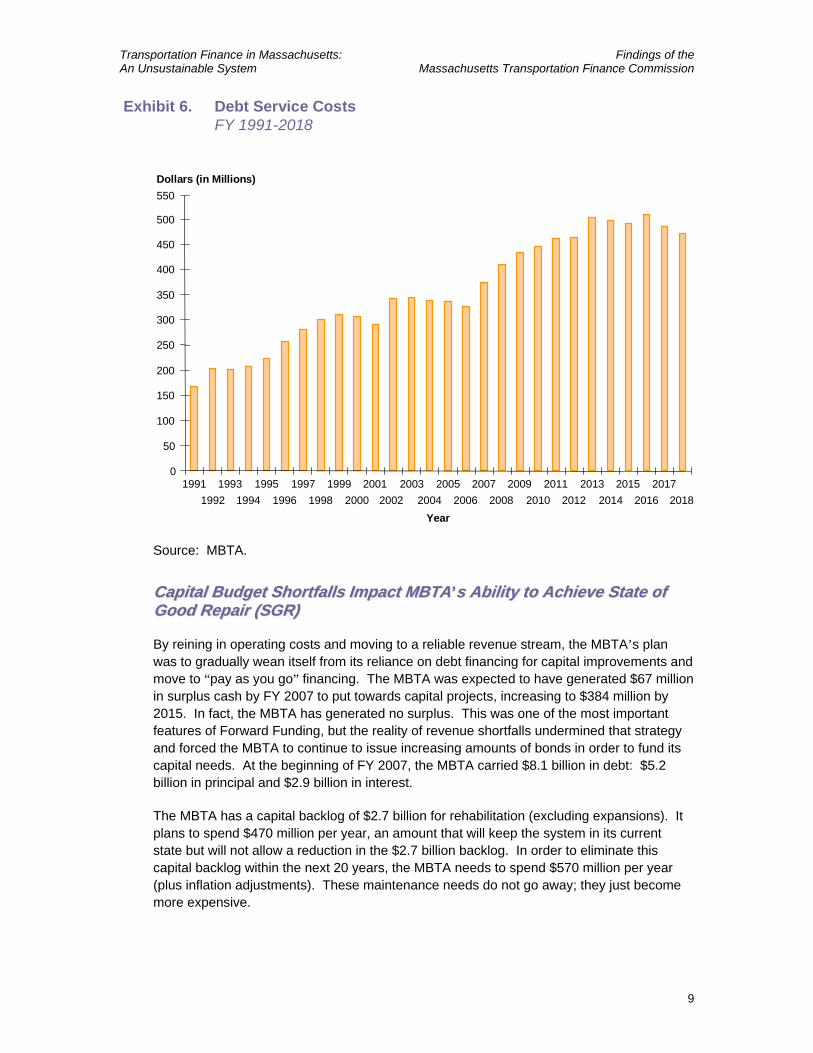
Debt service expenses in FY 2006 were $328 million, representing 25 percent of the MBTA’s expenses, and have increased steadily since the 1990s (see Exhibit 6). This exceeds all of the money brought in by the MBTA in fares last year. In effect, the MBTA is collecting no money from its customers to support its day-to-day operations. This is the highest level of debt burden carried by any transit agency in the country. Debt service costs will increase to $436 million in 2009 and $504 million in 2013.
Transportation Finance in Massachusetts: Findings of the An Unsustainable System Massachusetts Transportation Finance Commission
9
Exhibit 6. Debt Service CostsFY 1991-2018
Year
Dollars (in Millions)
19911992
19931994
19951996
19971998
19992000
20012002
20032004
20052006
20072008
20092010
20112012
20132014
20152016
20172018
0
50
100
150
200
250
300
350
400
450
500
550
Source: MBTA.
CCaappiittaall BBuuddggeett SShhoorrttffaallllss IImmppaacctt MMBBTTAA’’ss AAbbiilliittyy ttoo AAcchhiieevvee SSttaattee ooff GGoooodd RReeppaaiirr ((SSGGRR))
By reining in operating costs and moving to a reliable revenue stream, the MBTA’s plan was to gradually wean itself from its reliance on debt financing for capital improvements and move to “pay as you go” financing. The MBTA was expected to have generated $67 million in surplus cash by FY 2007 to put towards capital projects, increasing to $384 million by 2015. In fact, the MBTA has generated no surplus. This was one of the most important features of Forward Funding, but the reality of revenue shortfalls undermined that strategy and forced the MBTA to continue to issue increasing amounts of bonds in order to fund its capital needs. At the beginning of FY 2007, the MBTA carried $8.1 billion in debt: $5.2 billion in principal and $2.9 billion in interest.
The MBTA has a capital backlog of $2.7 billion for rehabilitation (excluding expansions). It plans to spend $470 million per year, an amount that will keep the system in its current state but will not allow a reduction in the $2.7 billion backlog. In order to eliminate this capital backlog within the next 20 years, the MBTA needs to spend $570 million per year (plus inflation adjustments). These maintenance needs do not go away; they just become more expensive.
Transportation Finance in Massachusetts: Findings of the An Unsustainable System Massachusetts Transportation Finance Commission
10
RReeggiioonnaall TTrraannssiitt AAuutthhoorriittiieess MMuusstt BBoorrrrooww ttoo CCoovveerr SShhoorrtt--TTeerrmm OOppeerraattiinngg EExxppeennsseess
The debt problem also affects Regional Transit Authorities (RTAs). For FY 2007, the RTAs are expected to have a total operating revenues of $200 million. In FY 2007, the RTAs expect to receive approximately $57 million annually in State contract assistance and about $21 million in local assessments to help bridge the gap between revenues and expenses. They receive this money in arrears, as the MBTA did before Forward Funding. To deal with this time delay, the RTAs borrow funds using Revenue Anticipation Notes (RANs). About half of the RANs are attributable to state contract assistance with the other half issued to cover local assessments. This means that the RTAs are spending money on interest for normal operations – not a good operating strategy. Overall, the RTAs are expected to incur about $2.4 million in interest expense.
MMaassssHHiigghhwwaayy HHaass AAddoopptteedd UUnnssuussttaaiinnaabbllee BBuussiinneessss PPrraaccttiicceess ttoo CCoommppeennssaattee FFoorr IInnaaddeeqquuaattee FFiinnaanncciiaall RReessoouurrcceess..
MassHighway is responsible for over 2,800 centerline miles of highway in the state (8 percent of the total) and 4,400 bridges. Budget cuts over the last 15 years have severely reduced MassHighway’s staffing levels, which keeps it from effectively carrying out its core mission of overseeing and maintaining the highway system. In addition, MassHighway has resorted to funding most of its operating expenses out of its capital budget, which shortchanges its capital needs and makes operations more expensive because of interest expenses. On top of this, MassHighway’s future has been mortgaged in other ways through the use of Grant Anticipation Notes (GANs) and Advance Construction techniques, which are discussed below.
MMaassssHHiigghhwwaayy DDooeess NNoott HHaavvee tthhee SSttaaffff aanndd BBuuddggeett ttoo AAddeeqquuaatteellyy OOvveerrsseeee aanndd MMaaiinnttaaiinn tthhee HHiigghhwwaayy SSyysstteemm
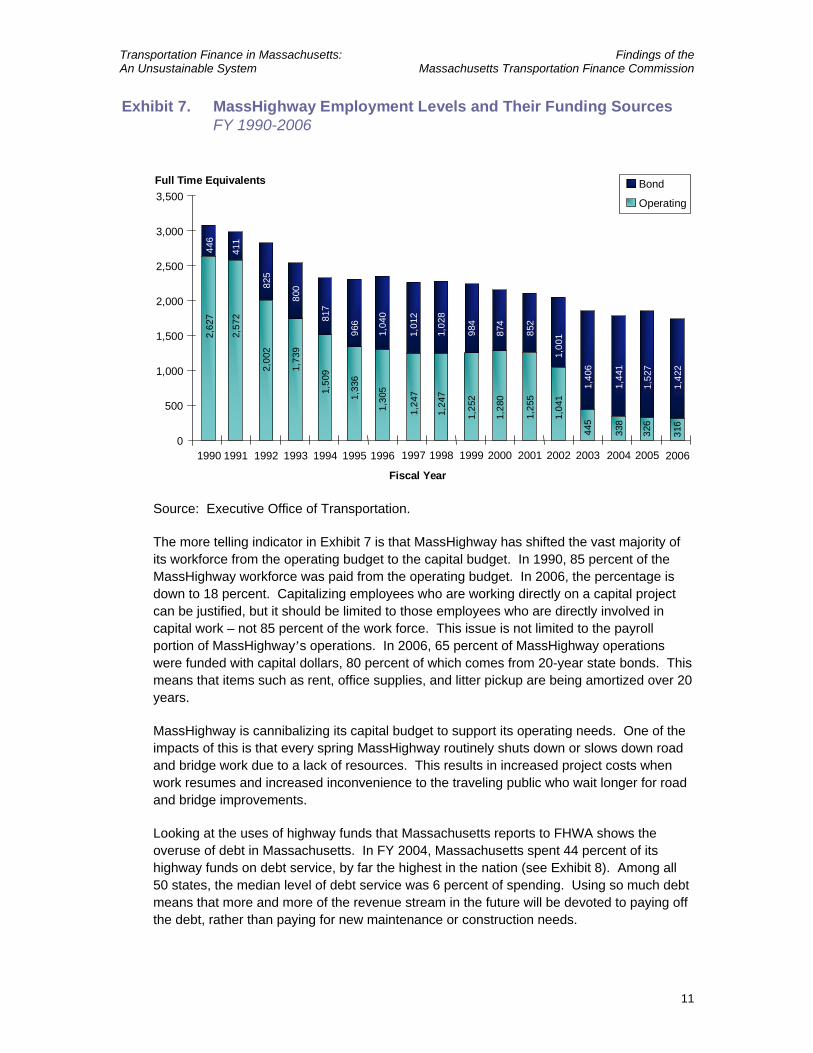
MassHighway has experienced a dramatic decline in its workforce. The agency had over 3,000 workers in 1990 and is now down to 1,740 in 2006 (see Exhibit 7).Staff reductions in and of themselves are not necessarily bad if the workload has been absorbed effectively by the remaining staff or outsourced, but the overall capacity of the agency appears to have declined. This is confirmed by a report done in 2003 by FHWA that indicated that staffing levels in July 2001 were “well below the minimum needed to fulfill the necessary construction and materials testing functions of the statewide construction program,” and that “there are a significant number of personnel who lack the necessary training and qualifications to perform inspection, sampling, and testing of construction materials.” Staffing levels today are even lower.
Transportation Finance in Massachusetts: Findings of the An Unsustainable System Massachusetts Transportation Finance Commission
11
Exhibit 7. MassHighway Employment Levels and Their Funding SourcesFY 1990-2006
Full Time Equivalents
2,62
744
6
2,57
241
1
2,00
282
5
1,73
980
0
1,50
981
7
1,33
696
6
1,30
51,
040
1,24
71,
012
1,24
71,
028
1,25
298
4
1,28
087
4
1,25
585
2
1,04
11,
001
445
1,40
6
338
1,44
1
326
1,52
7
316
1,42
2
0
500
1,000
1,500
2,000
2,500
3,000
3,500
1990 1991 1992 1993 1994 1995 1996 1997 1998 1999 2000 2001 2002 2003 2004 2005 2006
Fiscal Year
Bond
Operating
Source: Executive Office of Transportation.
The more telling indicator in Exhibit 7 is that MassHighway has shifted the vast majority of its workforce from the operating budget to the capital budget. In 1990, 85 percent of the MassHighway workforce was paid from the operating budget. In 2006, the percentage is down to 18 percent. Capitalizing employees who are working directly on a capital project can be justified, but it should be limited to those employees who are directly involved in capital work – not 85 percent of the work force. This issue is not limited to the payroll portion of MassHighway’s operations. In 2006, 65 percent of MassHighway operations were funded with capital dollars, 80 percent of which comes from 20-year state bonds. This means that items such as rent, office supplies, and litter pickup are being amortized over 20 years.
MassHighway is cannibalizing its capital budget to support its operating needs. One of the impacts of this is that every spring MassHighway routinely shuts down or slows down road and bridge work due to a lack of resources. This results in increased project costs when work resumes and increased inconvenience to the traveling public who wait longer for road and bridge improvements.
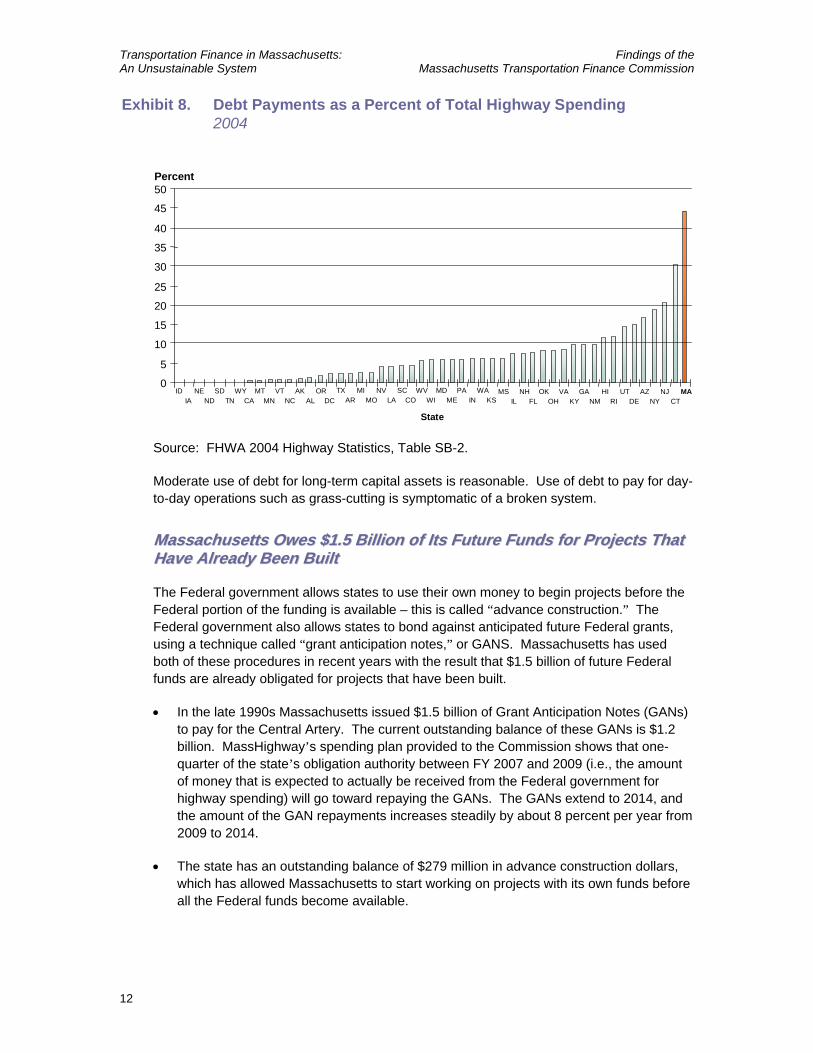
Looking at the uses of highway funds that Massachusetts reports to FHWA shows the overuse of debt in Massachusetts. In FY 2004, Massachusetts spent 44 percent of its highway funds on debt service, by far the highest in the nation (see Exhibit 8). Among all 50 states, the median level of debt service was 6 percent of spending. Using so much debt means that more and more of the revenue stream in the future will be devoted to paying off the debt, rather than paying for new maintenance or construction needs.
Transportation Finance in Massachusetts: Findings of the An Unsustainable System Massachusetts Transportation Finance Commission
12
Exhibit 8. Debt Payments as a Percent of Total Highway Spending2004
0
5
10
15
20
25
30
35
40
45
50Percent
IDIA
NEND
SDTN
WYCA
MTMN
VTNC
AKAL
ORDC
TXAR
MIMO
NVLA
SCCO
WVWI
MDME
PAIN
WAKS
MSIL
NHFL
OKOH
VAKY
GANM
HIRI
UTDE
AZNY
NJCT
MA
State
Source: FHWA 2004 Highway Statistics, Table SB-2.
Moderate use of debt for long-term capital assets is reasonable. Use of debt to pay for day-to-day operations such as grass-cutting is symptomatic of a broken system.
MMaassssaacchhuusseettttss OOwweess $$11..55 BBiilllliioonn ooff IIttss FFuuttuurree FFuunnddss ffoorr PPrroojjeeccttss TThhaatt HHaavvee AAllrreeaaddyy BBeeeenn BBuuiilltt
The Federal government allows states to use their own money to begin projects before the Federal portion of the funding is available – this is called “advance construction.” The Federal government also allows states to bond against anticipated future Federal grants, using a technique called “grant anticipation notes,” or GANS. Massachusetts has used both of these procedures in recent years with the result that $1.5 billion of future Federal funds are already obligated for projects that have been built.
• In the late 1990s Massachusetts issued $1.5 billion of Grant Anticipation Notes (GANs) to pay for the Central Artery. The current outstanding balance of these GANs is $1.2 billion. MassHighway’s spending plan provided to the Commission shows that one-quarter of the state’s obligation authority between FY 2007 and 2009 (i.e., the amount of money that is expected to actually be received from the Federal government for highway spending) will go toward repaying the GANs. The GANs extend to 2014, and the amount of the GAN repayments increases steadily by about 8 percent per year from 2009 to 2014.
• The state has an outstanding balance of $279 million in advance construction dollars, which has allowed Massachusetts to start working on projects with its own funds before all the Federal funds become available.
Transportation Finance in Massachusetts: Findings of the An Unsustainable System Massachusetts Transportation Finance Commission
13
SSoommee ooff tthhee BBoossttoonn RReeggiioonn’’ss MMoosstt CCrriittiiccaall RRooaaddss aanndd BBrriiddggeess AArree tthhee RReessppoonnssiibbiilliittyy ooff tthhee DDeeppaarrttmmeenntt ooff CCoonnsseerrvvaattiioonn aanndd RReeccrreeaattiioonn ((DDCCRR)),, WWhhiicchh DDooeess NNoott HHaavvee tthhee RReessoouurrcceess ttoo PPrrooppeerrllyy MMaannaaggee IIttss TTrraannssppoorrttaattiioonn AAsssseettss
The main priority of DCR is parks, not parkways. The result is that DCR roads and bridges are in seriously poor condition. This is critical because DCR’s roadways carry high volumes on some of the Boston region’s most critical links – Storrow Drive, Soldiers Field Road, the Longfellow Bridge, to name a few.
DCR oversees a transportation network that includes 275 centerline miles of urban parkways and 187 bridges, including all Charles River crossings within Boston, Watertown, Cambridge, and Somerville. Unlike other agencies with transportation oversight, DCR has little technical expertise related to managing these transportation assets. In fact, in 2000 $50 million of MassHighway bond funds were allocated to DCR for use on DCR’s bridges. But, as of 2007, only $19 million has been spent.
In recognition of this problem, DCR has transferred responsibility to repair seven bridges to MassHighway, which has the expertise to carry it out. However, MassHighway took on these new responsibilities without the dollars needed to actually do the projects, putting the DCR bridges in direct competition for funds with MassHighway bridges. In addition, these major projects are just a fraction of DCR’s transportation portfolio and today DCR retains responsibility for numerous critical links in our transportation web.
TThhee MMaassssaacchhuusseettttss TTuurrnnppiikkee OOppeerraatteess aatt aa DDeeffiicciitt
A series of decisions regarding the funding of the CA/T project, combined with the Turnpike Authority’s deficit-masking financing techniques and the Commonwealth’s toll discount mandates, have established a precarious financial profile for the Massachusetts Turnpike.
The Western Turnpike (I-90 between the New York border and Route 128) and the Metropolitan Highway System (I-90 east of Route 128 along with the Sumner/Callahan/Ted Williams Tunnels and Central Artery facilities) are run as separate financial entities, and as such have different issues and concerns. They are discussed separately below.
Transportation Finance in Massachusetts: Findings of the An Unsustainable System Massachusetts Transportation Finance Commission
14
MMeettrrooppoolliittaann HHiigghhwwaayy SSyysstteemm ((MMHHSS)) BBuurrddeenneedd bbyy PPaayymmeennttss ttoo CCAA//TT PPrroojjeecctt
When additional funding was required to pay for the escalating cost of the CA/T project5 starting in 1999, the state turned to the Turnpike Authority to cover a significant share of the shortfall. In addition, the Commonwealth committed existing funding, including a portion of license and registry fees, but chose not to raise new revenue. Massport, which is a major beneficiary of the CA/T project, was asked to make a limited contribution ($365 million). In total, the Turnpike Authority is paying $1.8 billion of the CA/T project cost, with about $1.4 billion of this funded through debt. In addition, the Authority has been legislatively mandated to operate and maintain the CA/T project facilities upon their completion – at a projected cost of over $35 million per year (plus annual inflation).
MHS tolls will be used to pay off the $1.4 billion in CA/T-related debt over the next 30 years, as well as the annual operations and maintenance expenses and future capital reinvestment needs.
SSttaattee CCoonnttrraacctt AAssssiissttaannccee ffoorr tthhee MMHHSS iiss NNoott SSuuffffiicciieenntt
When the Turnpike Authority borrowed additional funds in 1999 to finance its share of the CA/T project, two steps were taken to delay and minimize toll increases in the early years. First, the debt was structured in a way that it increased over time, in line with scheduled MHS toll increases in 2002, 2008, 2014, 2020, and 2026. The Authority also pledged to bondholders a future stream of annual “contract assistance” payments from the state. The Commonwealth agreed to pay up to $25 million per year for the operation and maintenance (O&M) of the nontolled Central Artery (I-93) and Central Artery North Area (CANA) tunnel. The Authority, in turn, pledged these annual contract assistance payments to the bondholders to help fund a portion of the annual debt service cost.
There are two primary concerns with this contract assistance agreement. First, the operating and maintenance cost reimbursement from the state is legislatively capped at $25 million per year – although the projected cost to operate and maintain the Central Artery and CANA is expected to far exceed this amount over time. Second, because the contract assistance payments are used to pay debt service on prior borrowings for the CA/T project, MHS tolls are effectively paying for all operating and maintenance costs associated with the nontolled Central Artery. As a result future MHS toll increases need to assume the growing cost of Central Artery operating and maintenance costs above the $25 million cap. This leaves fewer toll dollars available for maintenance and capital reinvestment of the tolled highway and tunnel system over time.
5 This report does not take into account any potential cash flow issues that may arise in connection
with the completion of the Central Artery Tunnel project, nor does it take into account additional financial exposure to the Turnpike Authority or the Commonwealth arising from the July 2006 incident in the I-90 Connector tunnel, and the subsequent stem to stern engineering reviews of the MHS. As of the publication of this report, Phase 2 of the stem to stern review has not been completed.
Transportation Finance in Massachusetts: Findings of the An Unsustainable System Massachusetts Transportation Finance Commission
15
TToollll DDiissccoouunntt PPrrooggrraammss EExxaacceerrbbaattee MMHHSS FFiinnaanncciiaall PPrroobblleemmss
Contributing to the financial problems of the MHS was a delayed toll increase initially scheduled for January 2002. The increase was delayed for six months, costing the Authority nearly $30 million, and when it was implemented in July 2002 it was accompanied by a toll discount program for passenger cars that use the Turnpike’s FAST LANE electronic toll collection system. This FAST LANE discount program costs the Authority about $12 million per year.
Another legislated discount program costs the MHS about $5 million per year by requiring the Authority to offer a 40-cent toll to certain Boston residents for use of the Sumner and Ted Williams Tunnels – an 87 percent discount off the current $3.00 tunnel toll. These legislated discount programs reduce the amount of toll revenue (about $17 million per year) that can be used for roadway and tunnel maintenance and reinvestment.
MMHHSS SSttrruuccttuurraall DDeeffiicciittss AArree MMaasskkeedd bbyy OOnnee--TTiimmee DDeeaallss IInncclluuddiinngg SSwwaappttiioonnss aanndd LLaanndd SSaallee PPrroocceeeeddss
The result of all this is an unbalanced MHS budget. The Turnpike Authority has resorted to short-term cash infusions such as the sale of Allston property to Harvard University and proceeds from financing mechanisms called “swaptions”6 in order to appear to have a balanced budget. Using the proceeds of these one-time transactions to subsidize discount programs and short-term operations (rather than long-term capital needs) masks the fact that the MHS takes in less money than it has to pay out, which is not sustainable.
Another response of the Turnpike Authority to this funding squeeze has been to underfund maintenance. A recent internal report at the Turnpike found that the Authority has been underfunding maintenance on the Turnpike as a whole by about $25 million per year. Annual maintenance and capital reinvestment needs will only grow, as the final CA/T project facilities are completed – and age over time. The temptation to shortchange maintenance of the brand new highway system must be resisted; it would be a mistake of epic proportions to fail to properly maintain the CA/T after spending nearly $15 billion to construct it. This should be a top priority of the Turnpike Authority – but it is unclear if tolls alone will be enough to cover the growing cost in the future.
As of January 1, 2006 the Turnpike had $2.4 billion in outstanding debt – primarily the result of borrowing to pay for the CA/T project. As discussed above, the MHS payments on this debt were structured to be lower in the early years and increase in later years – delaying the full impact of the Authority’s CA/T funding commitment. In the coming year, MHS debt service costs will increase by 35 percent, a $26 million increase. At the same time, the one-time revenue boost from swaption and Allston land sale proceeds (which averaged about $24 million annually from 2003 through 2007) will be exhausted. The difference will need to
6 A swaption is a complex financial transaction that allows the seller (the Turnpike Authority in this
case) to receive an upfront payment but exposes the seller to financial risks depending on future interest rates. The MHS swaptions involve 35 percent of the Turnpike’s $2.2 billion in outstanding MHS debt.
Transportation Finance in Massachusetts: Findings of the An Unsustainable System Massachusetts Transportation Finance Commission
16
be made up primarily from a 2008 MHS toll increase. Debt service costs will escalate again in 2014 and 2020, necessitating future toll increases as well.
Prior to approval of the Authority’s 2007 budget, the financial plan for the MHS called for about a 25 percent toll increase in 2008 to meet the increasing financial obligations of the MHS. If the toll increase is not implemented in 2008, projected MHS revenue would be about $40 million per year lower than necessary. As a result, the debt service coverage ratio for the MHS (i.e., total revenues less operating costs, divided by debt service expense) would fall below the 1.35 level required in the Authority’s bond covenants in all years until the toll increase is implemented. Without the toll increase, the Authority would be in default of its obligations under the MHS Trust Agreement and the MHS bonds would most likely be downgraded as well, which would trigger additional negative financial impacts for the MHS.
It should be noted that, due to subsequent cost increases and expense reallocation decisions made as part of the 2007 budget process, the level of the 2008 toll increase is expected to be significantly more than initially planned. The actual required amount is still to be determined.
DDeeffiicciitt SSppeennddiinngg ffoorr tthhee WWeesstteerrnn TTuurrnnppiikkee
At the beginning of 2006 the Western Turnpike had $211 million in outstanding debt and a balance of about $93 million in its reserve fund, which had been built up over the years as income from tolls and other revenue sources exceeded total expenses – a normal process for turnpikes to guard against unexpected future costs.
However, starting in 2008 the Western Turnpike finances will be running at an operating deficit, assuming no increase in toll rates. If the Turnpike Authority stays on its current path, it will purposefully spend down its Western Turnpike reserve funds to fill the annual revenue gap, with the intention of transferring the roadway to MassHighway in the future. By statute, when the Western Turnpike bonds are paid in full in 2017, MassHighway is to make a determination whether it will accept the 123 miles of the Western Turnpike into the state highway system. The problem with this strategy is that the Commonwealth has no plans in place – or financial resources available – to assume responsibility for the Western Turnpike. Without action, the Turnpike will have drawn down its reserves and neither the Turnpike nor MassHighway will have the resources available to operate, maintain, and rehabilitate this vital transportation link.
BB.. TThhee CCoonnddiittiioonn ooff OOuurr RRooaaddss,, BBrriiddggeess,, aanndd TTrraannssiitt SSyysstteemmss AArree AAllll iinn BBrrooaadd DDeecclliinnee
Across the board, our transportation system is experiencing broad decline. The MBTA is struggling to achieve a state of good repair, but it does not have enough money. MassHighway is underfunding upkeep and rehabilitation of its highways and bridges. The bridges and parkways of DCR are in severe neglect and facing immediate needs, and the Turnpike Authority has been under-investing in maintenance and rehabilitation.
Transportation Finance in Massachusetts: Findings of the An Unsustainable System Massachusetts Transportation Finance Commission
17
We all know that if we do regular maintenance on our house or car, they will perform better, avoid major breakdowns that are costly to repair, and cost us less in the long run. The same is true of our transportation system, yet it is difficult to achieve the public decision-making that leads to these wise investments – there are no ribbon-cutting ceremonies for maintenance projects. In addition, as noted above, the high cost of the CA/T project has sapped our limited resources for the past few years.
Past trends and future economic conditions raise concern that this level of under-investment will continue into the future, causing us to fall further and further behind and increasing the long-term cost to the taxpayers of the Commonwealth. The longer we wait to face these difficult issues, the harder it will be for us to recover.
MMBBTTAA SSttrruugggglleess ttoo AAcchhiieevvee aa ““SSttaattee ooff GGoooodd RReeppaaiirr””
The MBTA has a policy commitment to achieve and maintain a state of good repair. It has developed the tools to understand how much it needs to attain this objective within 20 years, and that amount is $570 million per year. Nevertheless, as noted earlier, it has the resources to spend only $470 million per year. The result is a system that may discourage customers, plus increases the certainty of greater rehabilitation needs in the future.
MMaassssHHiigghhwwaayy hhaass UUnnddeerr--IInnvveesstteedd iinn tthhee SSttaattee’’ss RRooaadd aanndd BBrriiddggee PPrrooggrraamm ffoorr DDeeccaaddeess
Massachusetts roads and bridges have been chronically underfunded, which has resulted in decades of deferred maintenance. This long-term neglect has led to a daunting backlog of road and bridge needs that becomes more expensive and disruptive every year. Instead of focusing on preventive maintenance, which is cost-effective, MassHighway finds itself carrying out a reactive maintenance program to fix those roads and bridges that are in failing conditions.
Rather than raising additional revenue to pay for its share of the $14.65 billion Central Artery project, the Commonwealth allocated some transportation resources away from maintaining the statewide road and bridge program. This under-investment caused the Federal government to require the Commonwealth to restore basic funding levels to the road and bridge program. The original target was $400 million a year from 2001 through 2005, and $450 million per year from 2006 through 2012; MassHighway has met those targets thus far.
Transportation Finance in Massachusetts: Findings of the An Unsustainable System Massachusetts Transportation Finance Commission
18
MMaassssHHiigghhwwaayy HHaass LLaacckkeedd aa CCoooorrddiinnaatteedd SSeett ooff AAsssseett MMaannaaggeemmeenntt SSyysstteemmss ttoo PPrriioorriittiizzee tthhee UUssee ooff LLiimmiitteedd SSttaattee aanndd FFeeddeerraall FFuunnddiinngg
In the past, MassHighway has made only limited use of asset management systems7, while other states have used such systems more extensively to help make informed investment decisions. MassHighway uses an asset management system to direct improvements on the Federal Aid Highway System, but the rest of the roadways are not covered. MassHighway is in the planning stages of developing asset management systems for these other roadways.
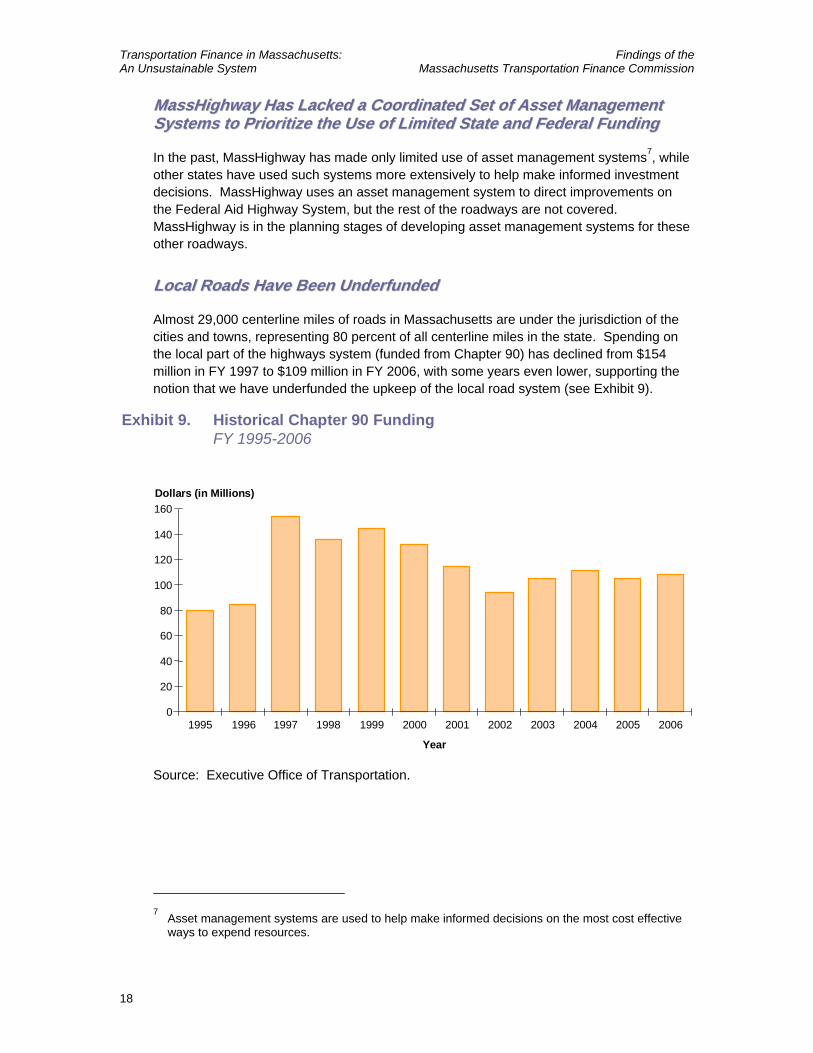
LLooccaall RRooaaddss HHaavvee BBeeeenn UUnnddeerrffuunnddeedd
Almost 29,000 centerline miles of roads in Massachusetts are under the jurisdiction of the cities and towns, representing 80 percent of all centerline miles in the state. Spending on the local part of the highways system (funded from Chapter 90) has declined from $154 million in FY 1997 to $109 million in FY 2006, with some years even lower, supporting the notion that we have underfunded the upkeep of the local road system (see Exhibit 9).
Exhibit 9. Historical Chapter 90 FundingFY 1995-2006
Dollars (in Millions)
Year
1995 1996 1997 1998 1999 2000 2001 2002 2003 20040
20
40
60
80
100
120
140
160
2005 2006
Source: Executive Office of Transportation.
7 Asset management systems are used to help make informed decisions on the most cost effective
ways to expend resources.
Transportation Finance in Massachusetts: Findings of the An Unsustainable System Massachusetts Transportation Finance Commission
19
DDCCRR’’ss BBrriiddggeess aanndd PPaarrkkwwaayyss AArree iinn SSeevveerree NNeegglleecctt,, YYeett TThheeyy AArree KKeeyy TTrraannssppoorrttaattiioonn LLiinnkkss iinn tthhee BBoossttoonn MMeettrroo AArreeaa
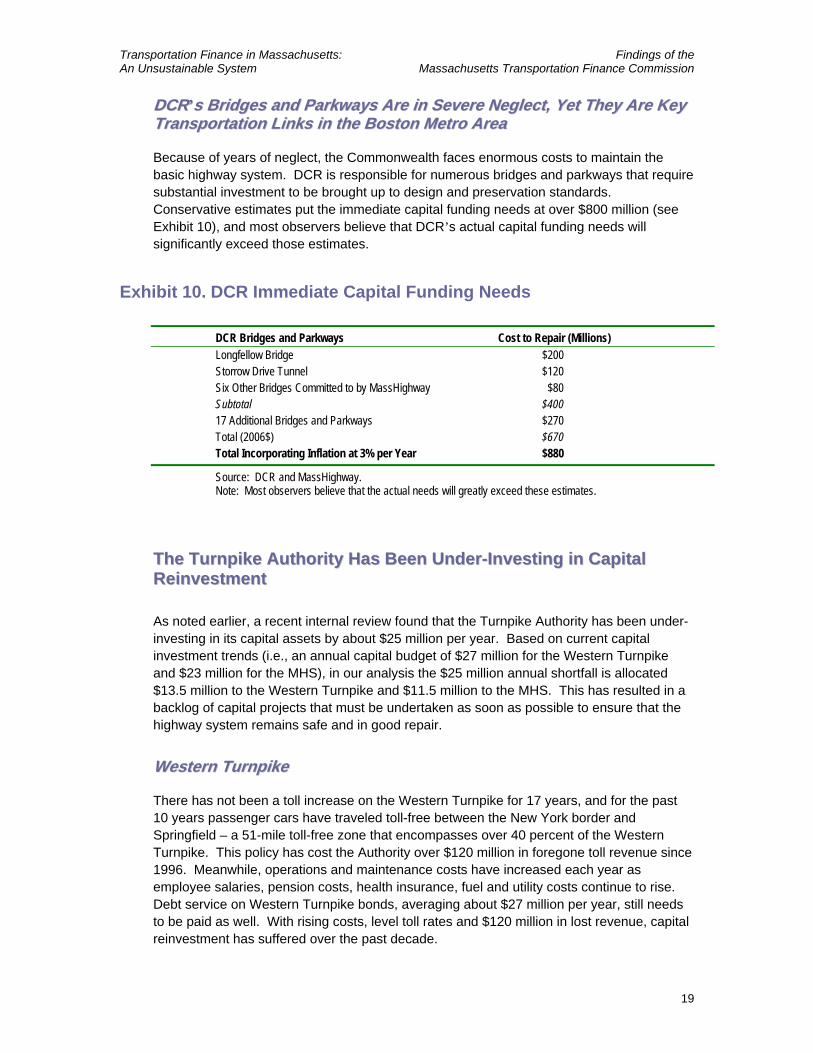
Because of years of neglect, the Commonwealth faces enormous costs to maintain the basic highway system. DCR is responsible for numerous bridges and parkways that require substantial investment to be brought up to design and preservation standards. Conservative estimates put the immediate capital funding needs at over $800 million (see Exhibit 10), and most observers believe that DCR’s actual capital funding needs will significantly exceed those estimates.
Exhibit 10. DCR Immediate Capital Funding Needs
DCR Bridges and Parkways Cost to Repair (Millions) Longfellow Bridge $200 Storrow Drive Tunnel $120 Six Other Bridges Committed to by MassHighway $80 Subtotal $400 17 Additional Bridges and Parkways $270 Total (2006$) $670 Total Incorporating Inflation at 3% per Year $880
Source: DCR and MassHighway. Note: Most observers believe that the actual needs will greatly exceed these estimates.
TThhee TTuurrnnppiikkee AAuutthhoorriittyy HHaass BBeeeenn UUnnddeerr--IInnvveessttiinngg iinn CCaappiittaall RReeiinnvveessttmmeenntt
As noted earlier, a recent internal review found that the Turnpike Authority has been under-investing in its capital assets by about $25 million per year. Based on current capital investment trends (i.e., an annual capital budget of $27 million for the Western Turnpike and $23 million for the MHS), in our analysis the $25 million annual shortfall is allocated $13.5 million to the Western Turnpike and $11.5 million to the MHS. This has resulted in a backlog of capital projects that must be undertaken as soon as possible to ensure that the highway system remains safe and in good repair.
WWeesstteerrnn TTuurrnnppiikkee
There has not been a toll increase on the Western Turnpike for 17 years, and for the past 10 years passenger cars have traveled toll-free between the New York border and Springfield – a 51-mile toll-free zone that encompasses over 40 percent of the Western Turnpike. This policy has cost the Authority over $120 million in foregone toll revenue since 1996. Meanwhile, operations and maintenance costs have increased each year as employee salaries, pension costs, health insurance, fuel and utility costs continue to rise. Debt service on Western Turnpike bonds, averaging about $27 million per year, still needs to be paid as well. With rising costs, level toll rates and $120 million in lost revenue, capital reinvestment has suffered over the past decade.
Transportation Finance in Massachusetts: Findings of the An Unsustainable System Massachusetts Transportation Finance Commission
20
Assuming 3 percent per year inflation, the projected $13.5 million annual backlog of capital projects on the Western Turnpike will total $173 million by 2017, when the tolls are currently scheduled for elimination. Unless funding is made available for this work, the condition of the 50-year-old Turnpike’s roadway and bridges will deteriorate quickly, with severe negative impacts. First, the safety of the traveling public could be jeopardized as the pavement deteriorates, substandard guardrail is not replaced, and bridges begin to fail. Second, it will become much more expensive to undertake major rehabilitation and replacement work in the future as a result of deferred maintenance and repairs today. Third, the option of Western Turnpike toll removal in 2017 may become infeasible because the 123-mile Turnpike will not be in good enough condition for MassHighway to accept it into the state highway system as a nontolled Interstate.
MMeettrrooppoolliittaann HHiigghhwwaayy SSyysstteemm
During the past decade the Turnpike Authority has paid about $1.8 billion in CA/T Project costs by borrowing to its capacity, using MHS reserves, and selling surplus land to meet these commitments – all with funds that could have been dedicated to capital reinvestment. Meanwhile, actual MHS toll revenue has been less than initial forecasts by more than $100 million since 2002, due to a combination of factors: the 6-month delay in raising tolls in 2002 ($39 million), the FAST LANE discount program (over $50 million), the I-90 ceiling collapse (about $8 million to date), and traffic impacts from 9/11 and an economic decline. As with the Western Turnpike, costs have risen and debt service needs to be paid – so the easiest way to make ends meet is to defer capital reinvestment. The effects of this deferral may not be noticed at first, but the long-term negative impacts are tremendous – and costly.
The 12-mile Boston Extension is the primary route into Boston from the west; the Sumner/Callahan and Ted Williams Tunnels are major routes in the east and the direct links to Logan International Airport; the CANA Tunnel provides access to and from the Tobin Bridge; and the Central Artery (I-93) is the major north-south route into and out of the city. The age of this infrastructure ranges from the 1934 Sumner Tunnel to the 1964 Boston Extension, and to some CA/T Project facilities that are still under construction. It is critical that the older elements be upgraded to current safety standards while the newer CA/T structures are well maintained to protect the Commonwealth’s $14.6 billion investment in the project. This takes a tremendous commitment to maintenance and reinvestment, as well as a great deal of money to make it happen.
Assuming 3 percent per year inflation, the annual $11.5 million backlog of capital projects on the MHS will total $309 million over the next 20 years – but this $309 million is just the tip of the iceberg. The current backlog of MHS capital projects includes major reconstruction work to the Sumner and Callahan Tunnels – some started but never completed a decade ago. There is also work required at the Prudential Tunnel.
Although some may consider the CA/T “brand new,” it also needs to be recognized that the Ted Williams Tunnel opened in 1995, and the CANA Tunnel was constructed before then. These facilities already require reinvestment, and funding sources need to be identified for future upgrades and reinvestment in the rest of the more than $14 billion project. The recently prepared “Stem to Stern Safety Review” (Phase 1) for the MHS highlights many of these needs and should be considered a good starting point for prioritizing them. A safe,
Transportation Finance in Massachusetts: Findings of the An Unsustainable System Massachusetts Transportation Finance Commission
21
efficient, and well-maintained MHS is critical to the entire region and the funds necessary to provide for this must be identified and wisely reinvested.
CC.. RReevveennuuee IIss BBeeiinngg SSqquueeeezzeedd ffrroomm AAllll SSiiddeess
Achieving any meaningful revenue growth for the future will be a significant challenge. All of the MBTA’s revenue sources are at risk – fares have been raised three times since 2000, sales tax revenues are growing slowly, and local assessments are capped. Historically reliable pillars of highway funding are also at risk, and we have already taken out a hefty advance on a big share of our future Federal funding through Grant Anticipation Notes (GANs). Despite recent attempts to eliminate Turnpike tolls, they are critical to pay for debt service and maintenance.
MMBBTTAA RReevveennuueess FFaaccee MMuullttiippllee CChhaalllleennggeess
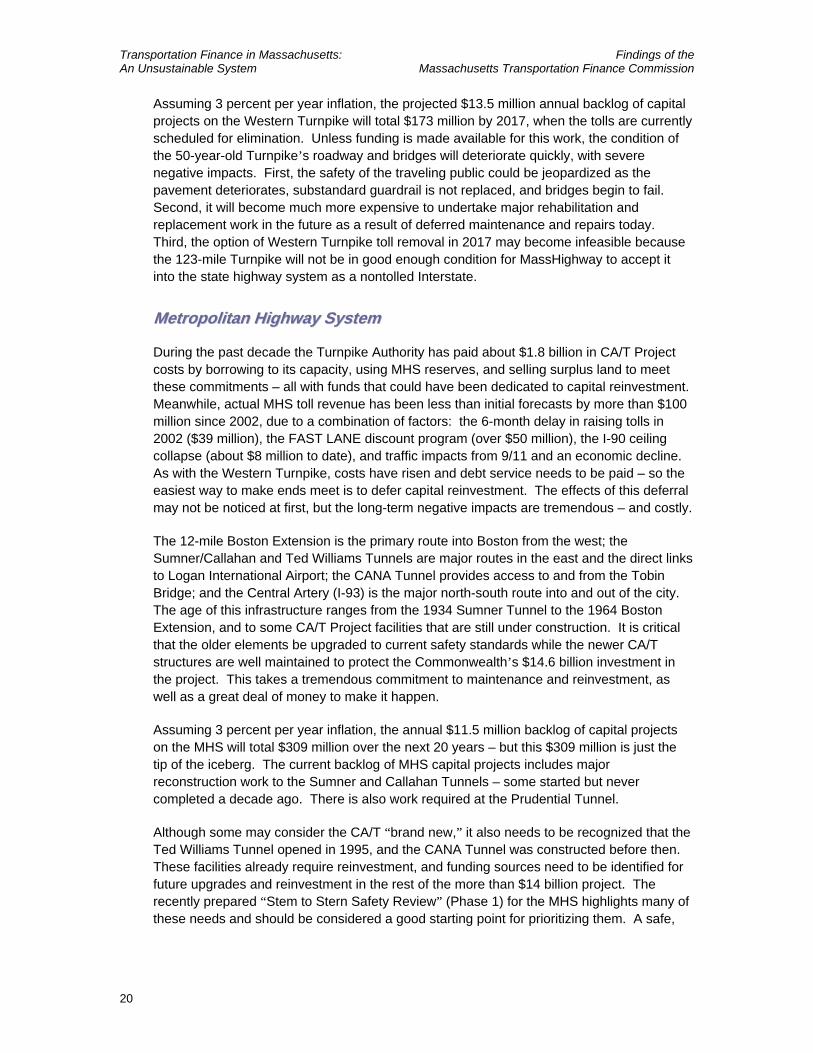
TThhrreeee MMBBTTAA FFaarree IInnccrreeaasseess SSiinnccee FFoorrwwaarrdd FFuunnddiinngg
Before Forward Funding, MBTA fares had lagged inflation by a considerable margin. One of the recommendations of Forward Funding was to have the fares catch up, and this has now been accomplished through three fare increases since Forward Funding (Exhibit 11). With its latest fare increase, MBTA fares have increased at more than double the rate of inflation over the past 20 years. The MBTA is no longer a low-fare transit property, and has limited ability to raise fares beyond inflation to solve its fiscal problems going forward.
Exhibit 11. Index of MBTA Subway Fares and Consumer Price Index1987-2007
0.0
0.5
1.0
1.5
2.0
2.5
3.0
1987 1989 1991 2001 2004 2007
MBTA Fares Consumer Price Index
$0.65
$0.85$0.75
$1.00
$1.25
$1.70
Sources: MBTA, Bureau of Labor Statistics.
Transportation Finance in Massachusetts: Findings of the An Unsustainable System Massachusetts Transportation Finance Commission
22
SSaalleess TTaaxx RReevveennuueess LLaagg FFoorreeccaassttss
As noted earlier, the sales tax has failed to be the reliable source of revenue that was expected. The MBTA’s Forward Funding plan relied on what was believed to be conservative assumptions regarding the growth of sales tax revenue over time. But sales tax revenue lagged the forecast by $21 million in FY 2004, increasing to $35 million in FY 2006, highlighting a gap that is expected to widen in the future.
Sales tax receipts are subject to the whims of the economy, are not under the control of MBTA management, and bear absolutely no relationship to the MBTA’s costs of operation. Although the Commonwealth has protected the MBTA from sales tax revenue decreases by guaranteeing the previous year’s revenue from the General Fund, this “floor” provides an insufficient cushion for the MBTA’s operations – costs continue to rise even when revenues don’t.
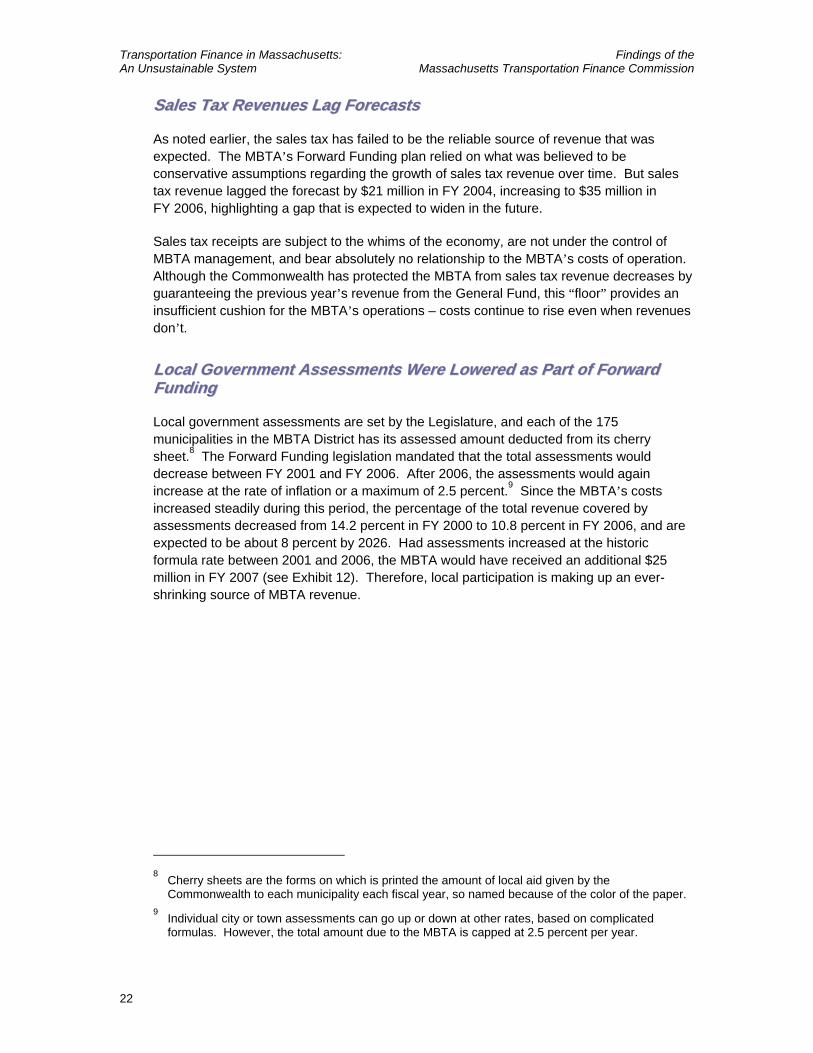
LLooccaall GGoovveerrnnmmeenntt AAsssseessssmmeennttss WWeerree LLoowweerreedd aass PPaarrtt ooff FFoorrwwaarrdd FFuunnddiinngg
Local government assessments are set by the Legislature, and each of the 175 municipalities in the MBTA District has its assessed amount deducted from its cherry sheet.8 The Forward Funding legislation mandated that the total assessments would decrease between FY 2001 and FY 2006. After 2006, the assessments would again increase at the rate of inflation or a maximum of 2.5 percent.9 Since the MBTA’s costs increased steadily during this period, the percentage of the total revenue covered by assessments decreased from 14.2 percent in FY 2000 to 10.8 percent in FY 2006, and are expected to be about 8 percent by 2026. Had assessments increased at the historic formula rate between 2001 and 2006, the MBTA would have received an additional $25 million in FY 2007 (see Exhibit 12). Therefore, local participation is making up an ever-shrinking source of MBTA revenue.
8 Cherry sheets are the forms on which is printed the amount of local aid given by the
Commonwealth to each municipality each fiscal year, so named because of the color of the paper. 9 Individual city or town assessments can go up or down at other rates, based on complicated
formulas. However, the total amount due to the MBTA is capped at 2.5 percent per year.
Transportation Finance in Massachusetts: Findings of the An Unsustainable System Massachusetts Transportation Finance Commission
23
Exhibit 12. MBTA Assessments, Actual versus Inflation Adjusted
Dollars (in Millions)
100
110
120
130
140
150
160
170
FY 2001 FY 2002 FY 2003 FY 2004 FY 2005 FY 2006 FY 2007
Assessments Actual Assessments at Inflation Rate
HHiissttoorriiccaallllyy RReelliiaabbllee PPiillllaarrss ooff TTrraannssppoorrttaattiioonn FFuunnddiinngg AArree NNoo LLoonnggeerr RReelliiaabbllee,, aanndd MMuucchh ooff FFuuttuurree FFuunnddiinngg AAllrreeaaddyy HHaass BBeeeenn SSppeenntt
FFeeddeerraall TTrraannssppoorrttaattiioonn FFuunnddss ttoo MMaassssaacchhuusseettttss HHaavvee DDeecclliinneedd
Due to budgetary constraints at the Federal level, the Commonwealth expects to receive about $50 million a year less for the years 2007 through 2009 compared to the three previous years (2004-2006). In fact, Massachusetts expects to receive less Federal funding in 2009 than it did in 1998.
Transportation Finance in Massachusetts: Findings of the An Unsustainable System Massachusetts Transportation Finance Commission
24
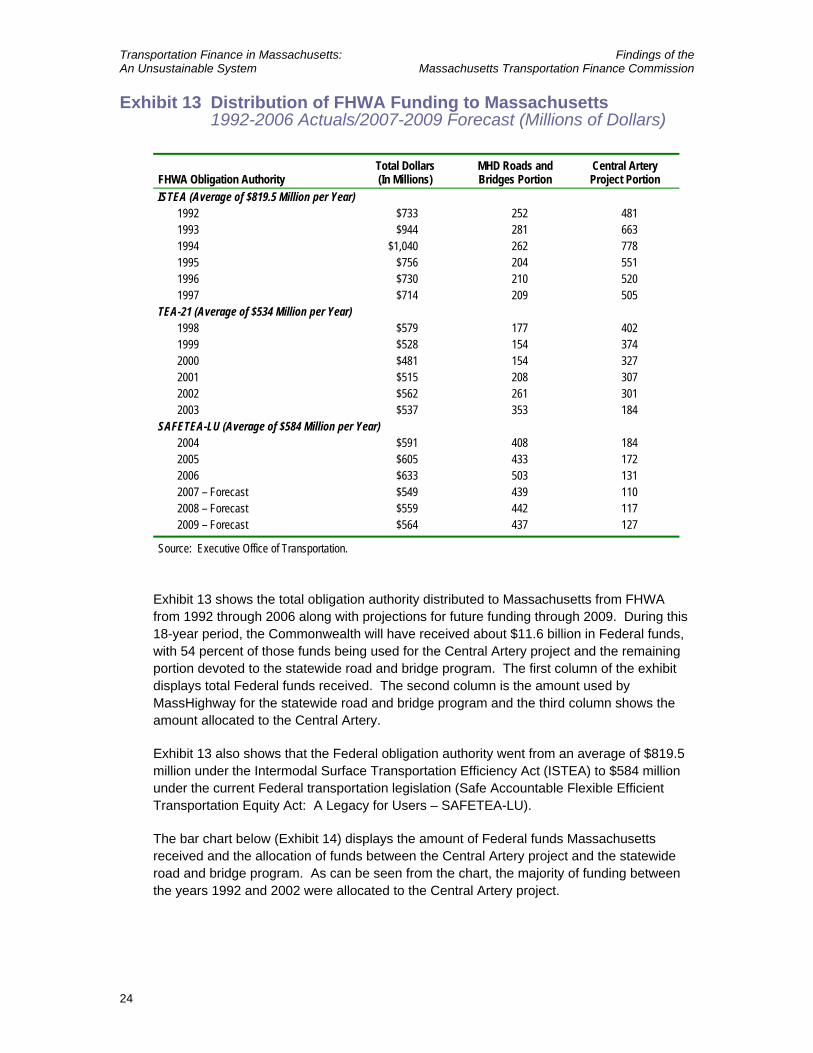
Exhibit 13 Distribution of FHWA Funding to Massachusetts 1992-2006 Actuals/2007-2009 Forecast (Millions of Dollars)
FHWA Obligation Authority Total Dollars (In Millions)
MHD Roads and Bridges Portion
Central Artery Project Portion
ISTEA (Average of $819.5 Million per Year) 1992 $733 252 481 1993 $944 281 663 1994 $1,040 262 778 1995 $756 204 551 1996 $730 210 520 1997 $714 209 505
TEA-21 (Average of $534 Million per Year) 1998 $579 177 402 1999 $528 154 374 2000 $481 154 327 2001 $515 208 307 2002 $562 261 301 2003 $537 353 184
SAFETEA-LU (Average of $584 Million per Year) 2004 $591 408 184 2005 $605 433 172 2006 $633 503 131 2007 – Forecast $549 439 110 2008 – Forecast $559 442 117 2009 – Forecast $564 437 127
Source: Executive Office of Transportation.
Exhibit 13 shows the total obligation authority distributed to Massachusetts from FHWA from 1992 through 2006 along with projections for future funding through 2009. During this 18-year period, the Commonwealth will have received about $11.6 billion in Federal funds, with 54 percent of those funds being used for the Central Artery project and the remaining portion devoted to the statewide road and bridge program. The first column of the exhibit displays total Federal funds received. The second column is the amount used by MassHighway for the statewide road and bridge program and the third column shows the amount allocated to the Central Artery.
Exhibit 13 also shows that the Federal obligation authority went from an average of $819.5 million under the Intermodal Surface Transportation Efficiency Act (ISTEA) to $584 million under the current Federal transportation legislation (Safe Accountable Flexible Efficient Transportation Equity Act: A Legacy for Users – SAFETEA-LU).
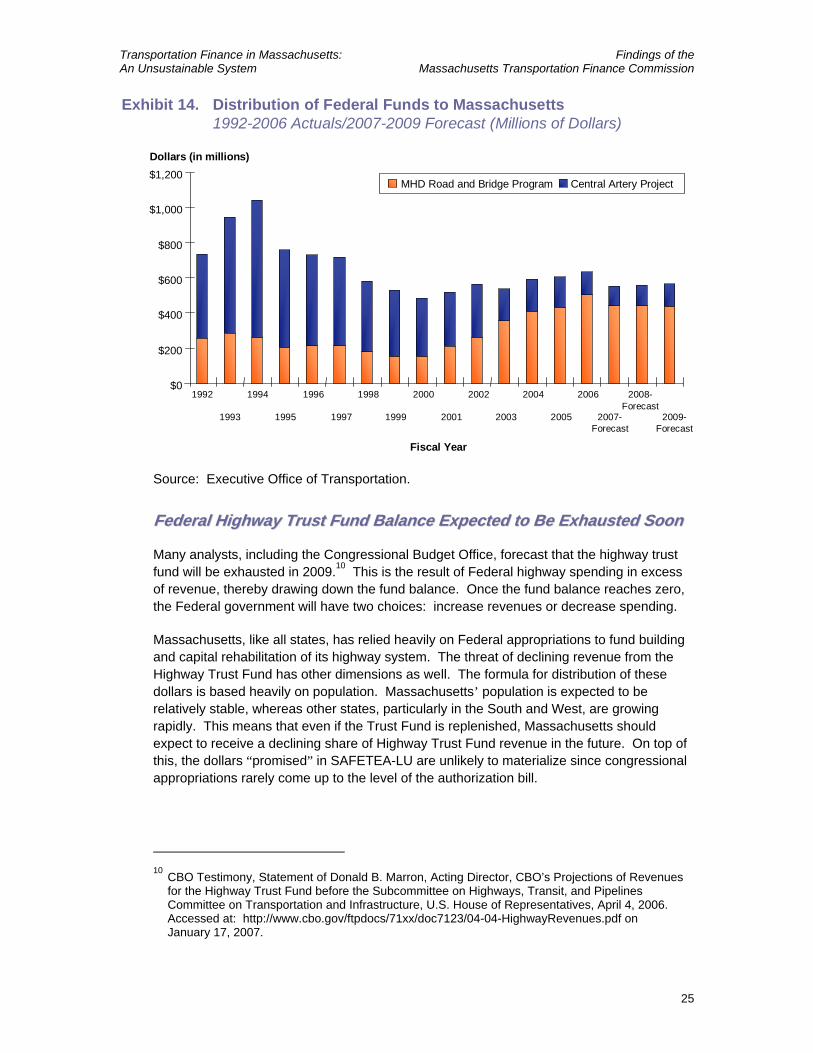
The bar chart below (Exhibit 14) displays the amount of Federal funds Massachusetts received and the allocation of funds between the Central Artery project and the statewide road and bridge program. As can be seen from the chart, the majority of funding between the years 1992 and 2002 were allocated to the Central Artery project.
Transportation Finance in Massachusetts: Findings of the An Unsustainable System Massachusetts Transportation Finance Commission
25
Exhibit 14. Distribution of Federal Funds to Massachusetts1992-2006 Actuals/2007-2009 Forecast (Millions of Dollars)
$0
$200
$400
$600
$800
$1,000
$1,200
1993 1995 1997 1999 2001 2003 2005 2007-Forecast
1992 1994 1996 1998 2000 2002 2004 2006 2008-Forecast
2009-Forecast
Fiscal Year
MHD Road and Bridge Program Central Artery Project
Dollars (in millions)
Source: Executive Office of Transportation.
FFeeddeerraall HHiigghhwwaayy TTrruusstt FFuunndd BBaallaannccee EExxppeecctteedd ttoo BBee EExxhhaauusstteedd SSoooonn
Many analysts, including the Congressional Budget Office, forecast that the highway trust fund will be exhausted in 2009.10 This is the result of Federal highway spending in excess of revenue, thereby drawing down the fund balance. Once the fund balance reaches zero, the Federal government will have two choices: increase revenues or decrease spending.
Massachusetts, like all states, has relied heavily on Federal appropriations to fund building and capital rehabilitation of its highway system. The threat of declining revenue from the Highway Trust Fund has other dimensions as well. The formula for distribution of these dollars is based heavily on population. Massachusetts’ population is expected to be relatively stable, whereas other states, particularly in the South and West, are growing rapidly. This means that even if the Trust Fund is replenished, Massachusetts should expect to receive a declining share of Highway Trust Fund revenue in the future. On top of this, the dollars “promised” in SAFETEA-LU are unlikely to materialize since congressional appropriations rarely come up to the level of the authorization bill.
10
CBO Testimony, Statement of Donald B. Marron, Acting Director, CBO’s Projections of Revenues for the Highway Trust Fund before the Subcommittee on Highways, Transit, and Pipelines Committee on Transportation and Infrastructure, U.S. House of Representatives, April 4, 2006. Accessed at: http://www.cbo.gov/ftpdocs/71xx/doc7123/04-04-HighwayRevenues.pdf on January 17, 2007.
Transportation Finance in Massachusetts: Findings of the An Unsustainable System Massachusetts Transportation Finance Commission
26
VVaalluuee ooff SSttaattee aanndd FFeeddeerraall FFuueell TTaaxxeess WWiillll CCoonnttiinnuuee ttoo DDeecclliinnee
The Highway Trust Fund relies on the Federal motor fuel tax. Likewise, much of our state funding for highways is derived from state fuel taxes. Neither of these taxes has been increased since the early 1990s.11 The value of the portion of the Massachusetts fuel tax devoted to transportation – 21 cents per gallon – set in 1991 is now worth only 14 cents in buying power. If inflation continues at about 3 percent a year, the 21 cent fuel tax from 1991 will buy less than 8 cents of transportation by 2026. Similarly, the 18.4 cent per gallon Federal fuel tax that has been with us since 1993 will be worth only 7 cents.
Exacerbating this trend is the expectation that cars will become more fuel-efficient in the future. One of the side effects of sudden increases in gasoline prices in 2005, and then again in 2006, was a renewed interest in fuel-efficient cars, including hybrid and alternative fuel vehicles. This means fewer gallons of gas purchases and fewer dollars in gas taxes per mile driven. President Bush, in his 2007 State of the Union message, declared a national goal to reduce fuel consumption by 20 percent over the next decade by tightening fuel economy standards and producing 35 billion gallons of renewable fuel such as ethanol. If successful, these measures will drastically reduce the amount of revenue available from fuel taxes. A 20 percent reduction in fuel consumption would cost the Commonwealth $120 million per year in revenues.
TTuurrnnppiikkee RReevveennuueess AArree SSttiillll NNeeeeddeedd DDeessppiittee MMoovveess ttoo EElliimmiinnaattee TThheemm
Based on revenue projections included in the Turnpike Authority’s bond offering statements, significant toll increases are anticipated every six years on the Metropolitan Highway System in order to meet increasing debt obligations. Debt service jumps by $26 million in 2008, while one-time revenues from the Allston land sale and swaption proceeds will be exhausted. The Authority also needs to address the continuation of legislatively required toll discount programs if alternative funding sources are not found to make up the effect of the ongoing revenue loss. Additional MHS toll increases will be needed in 2014 and 2020 as well, when there are similar jumps in debt service. This means that the planned toll increases are needed to pay for CA/T bonds; none of this revenue will be available to pay for new bricks and mortar. Higher toll increases are therefore an unlikely source of revenue enhancement to fund growing maintenance and reinvestment needs for the MHS, including the CA/T facilities.
On the Western Turnpike, tolls were last raised in 1990. Furthermore, passenger car tolls for travel between New York and Springfield (interchanges 1 through 6) were eliminated in 1996. This reduced the amount of toll revenue generated by the Turnpike by more than $12 million per year, while also contributing to additional traffic on this section of the highway. As a result, the per-mile cost to travel on the 123 miles of the Western Turnpike is among the lowest of any toll road in the country. As noted earlier, the Turnpike Authority
11
There was a 2.5 cent additional state gas tax imposed in 1991 for the purpose of cleaning up underground fuel tanks. These revenues can not be used for transportation purposes, and hence are not considered in this report.
Transportation Finance in Massachusetts: Findings of the An Unsustainable System Massachusetts Transportation Finance Commission
27
plans to draw down on Western Turnpike reserve funds until bonds are paid off in 2017. Recent proposals to eliminate tolls on the Western Turnpike earlier than this – in 2007 – have failed to include an adequate discussion on how to replace what would be $1.2 billion in foregone toll revenue between 2007 and 2026.
The Turnpike Authority’s plans to draw down Western Turnpike reserve funds in advance of turning the Turnpike over to MassHighway in 2017 is also troublesome. There is no evidence of a plan to fund continued operations, maintenance, and rehabilitation of the Western Turnpike after the debt is paid off. As illustrated numerous times in this report, MassHighway does not have sufficient funds now to take care of the system it currently maintains. Adding another 123 miles to the system is certainly not affordable, unless there is a solid plan for providing adequate revenue.
DD.. WWee HHaavvee NNoo MMoonneeyy ffoorr TTrraannssiitt oorr HHiigghhwwaayy EEnnhhaanncceemmeennttss oorr EExxppaannssiioonnss wwiitthhoouutt FFuurrtthheerr SSaaccrriiffiicciinngg OOuurr EExxiissttiinngg SSyysstteemmss aanndd EExxaacceerrbbaattiinngg OOuurr PPrroobblleemmss
The Commonwealth’s transportation finance picture is so dire that there is no money for expansions or enhancements unless we sacrifice maintenance. The estimated $15 to $19 billion gap in transportation over the next 20 years reflects only the cost to achieve and then keep our existing system in a state of good repair. This means that even if we close the funding gap to get existing infrastructure to a state of good repair, our transportation system will not be able to meet the emerging mobility needs to support an economically vibrant Commonwealth.
It is not practical, plausible, or prudent to pursue a course excluding any transportation enhancement or expansion projects for two decades. Such a course would put us at a significant competitive disadvantage. So as large as the funding gap is, it does not fully represent what the Commonwealth truly needs.
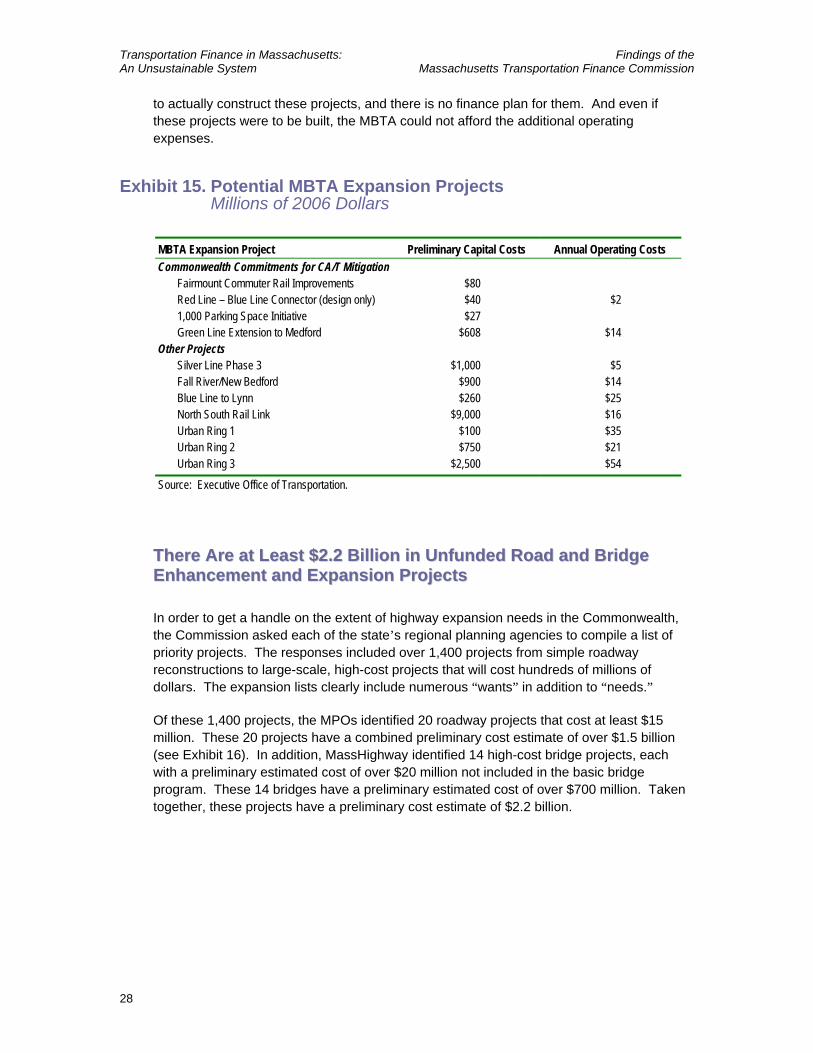
BBiilllliioonnss ooff DDoollllaarrss iinn MMBBTTAA EExxppaannssiioonn PPrroojjeeccttss AArree BBeeiinngg PPllaannnneedd TThhaatt HHaavvee NNoo IIddeennttiiffiieedd SSoouurrccee ooff FFuunnddiinngg
Neither the MBTA under Forward Funding nor the Commonwealth can afford any of the transit projects that have been deemed desirable by political and civic leaders. Although work is being done to advance these projects through design studies, there is no money for actual construction.
The MBTA has a variety of projects in planning that many people would like to move forward (see Exhibit 15). The Silver Line Phase 3 is considered essential by the City of Boston and the Greater Boston business community. The Commonwealth has committed to design the Blue Line/Red Line Connector and to construct the Green Line to Somerville project as part of the Central Artery mitigation program. No commitments have been made
Transportation Finance in Massachusetts: Findings of the An Unsustainable System Massachusetts Transportation Finance Commission
28
to actually construct these projects, and there is no finance plan for them. And even if these projects were to be built, the MBTA could not afford the additional operating expenses.
Exhibit 15. Potential MBTA Expansion Projects Millions of 2006 Dollars
MBTA Expansion Project Preliminary Capital Costs Annual Operating Costs Commonwealth Commitments for CA/T Mitigation
Fairmount Commuter Rail Improvements $80 Red Line – Blue Line Connector (design only) $40 $2 1,000 Parking Space Initiative $27 Green Line Extension to Medford $608 $14
Other Projects Silver Line Phase 3 $1,000 $5 Fall River/New Bedford $900 $14 Blue Line to Lynn $260 $25 North South Rail Link $9,000 $16 Urban Ring 1 $100 $35 Urban Ring 2 $750 $21 Urban Ring 3 $2,500 $54
Source: Executive Office of Transportation.
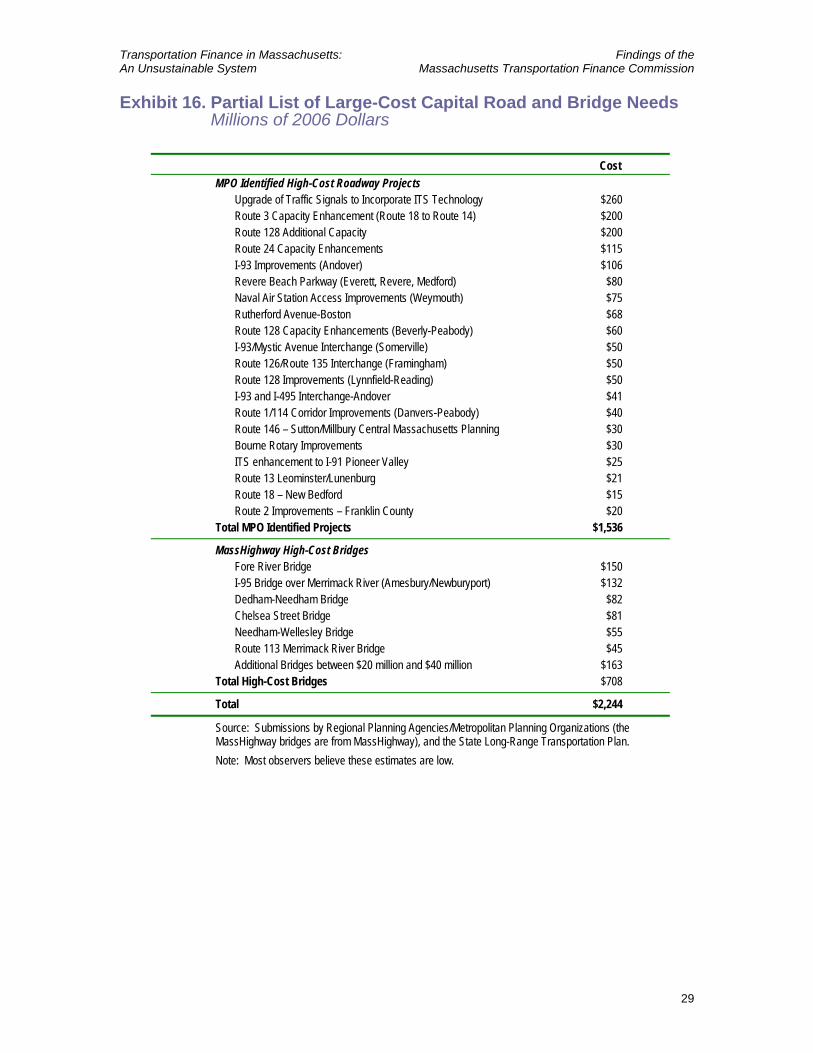
TThheerree AArree aatt LLeeaasstt $$22..22 BBiilllliioonn iinn UUnnffuunnddeedd RRooaadd aanndd BBrriiddggee EEnnhhaanncceemmeenntt aanndd EExxppaannssiioonn PPrroojjeeccttss
In order to get a handle on the extent of highway expansion needs in the Commonwealth, the Commission asked each of the state’s regional planning agencies to compile a list of priority projects. The responses included over 1,400 projects from simple roadway reconstructions to large-scale, high-cost projects that will cost hundreds of millions of dollars. The expansion lists clearly include numerous “wants” in addition to “needs.”
Of these 1,400 projects, the MPOs identified 20 roadway projects that cost at least $15 million. These 20 projects have a combined preliminary cost estimate of over $1.5 billion (see Exhibit 16). In addition, MassHighway identified 14 high-cost bridge projects, each with a preliminary estimated cost of over $20 million not included in the basic bridge program. These 14 bridges have a preliminary estimated cost of over $700 million. Taken together, these projects have a preliminary cost estimate of $2.2 billion.
Transportation Finance in Massachusetts: Findings of the An Unsustainable System Massachusetts Transportation Finance Commission
29
Exhibit 16. Partial List of Large-Cost Capital Road and Bridge Needs Millions of 2006 Dollars
Cost MPO Identified High-Cost Roadway Projects
Upgrade of Traffic Signals to Incorporate ITS Technology $260 Route 3 Capacity Enhancement (Route 18 to Route 14) $200 Route 128 Additional Capacity $200 Route 24 Capacity Enhancements $115 I-93 Improvements (Andover) $106 Revere Beach Parkway (Everett, Revere, Medford) $80 Naval Air Station Access Improvements (Weymouth) $75 Rutherford Avenue-Boston $68 Route 128 Capacity Enhancements (Beverly-Peabody) $60 I-93/Mystic Avenue Interchange (Somerville) $50 Route 126/Route 135 Interchange (Framingham) $50 Route 128 Improvements (Lynnfield-Reading) $50 I-93 and I-495 Interchange-Andover $41 Route 1/114 Corridor Improvements (Danvers-Peabody) $40 Route 146 – Sutton/Millbury Central Massachusetts Planning $30 Bourne Rotary Improvements $30 ITS enhancement to I-91 Pioneer Valley $25 Route 13 Leominster/Lunenburg $21 Route 18 – New Bedford $15 Route 2 Improvements – Franklin County $20
Total MPO Identified Projects $1,536
MassHighway High-Cost Bridges Fore River Bridge $150 I-95 Bridge over Merrimack River (Amesbury/Newburyport) $132 Dedham-Needham Bridge $82 Chelsea Street Bridge $81 Needham-Wellesley Bridge $55 Route 113 Merrimack River Bridge $45 Additional Bridges between $20 million and $40 million $163
Total High-Cost Bridges $708
Total $2,244
Source: Submissions by Regional Planning Agencies/Metropolitan Planning Organizations (the MassHighway bridges are from MassHighway), and the State Long-Range Transportation Plan. Note: Most observers believe these estimates are low.

Transportation Finance in Massachusetts: Findings of the An Unsustainable System Massachusetts Transportation Finance Commission
31
33..00 DDiimmeennssiioonnss ooff tthhee TTrraannssppoorrttaattiioonn FFuunnddiinngg GGaapp
The Legislature’s central charge to the Transportation Finance Commission was to estimate the transportation needs of the Commonwealth, and compare those needs to the available resources. Our belief is that the system has been inadequately maintained for decades. Our conclusion is that to simply bring the existing surface transportation system to a state of good repair and maintain it at that level, Massachusetts will need to close at least a $15 to $19 billion funding gap over the next 20 years. Expansion in capacity and/or service levels, widely considered necessary to serve a growing economy, are not included in the gap number and will cost even more. Moreover, the longer the lag in addressing the maintenance shortfalls, the bigger the ultimate price tag.
OOvveerraallll AApppprrooaacchh
To estimate the transportation funding gap in Massachusetts, the Transportation Finance Commission obtained financial trends and projections of capital and operating spending and needs from surface transportation agencies.12 Where possible, the Commission found outside spending benchmarks to determine whether past and planned future spending levels were reasonable. In developing its estimates, the Commission used the following guidelines:
• We used conservative – i.e., low-side – assumptions so as not to overstate the problem. The result is that the actual funding needs are most likely higher; there is little reason to hope that the needs are smaller.
• We estimated the cost to achieve and maintain the existing system in a “state of good repair.” As noted in Section 2.0, we have adopted the term “state of good repair” commonly used in the transit industry to reflect the condition whereby all capital assets are functioning at their intended capacity within their design life. There is no gold-plating here, just the amount needed to keep our existing system operating.
• We included operating and capital cost estimates. To provide the most complete picture of the transportation needs, the Commission has included both operating and capital costs.
12
Most of Massport’s operations are not involved in surface transportation.
Transportation Finance in Massachusetts: Findings of the An Unsustainable System Massachusetts Transportation Finance Commission
32
• We did not include the cost for any highway or transit enhancements or expansions beyond the Central Artery Environmental Transit Commitments. The estimated $15 to $19 billion gap, as large as it is, does not include a single transit expansion project or roadway enhancement project beyond legal commitments. We recognize that the Commonwealth must plan for major transportation improvements over the next two decades, but for purposes of the financial analysis, we chose to highlight the enormous funding shortfall simply to maintain the existing system.
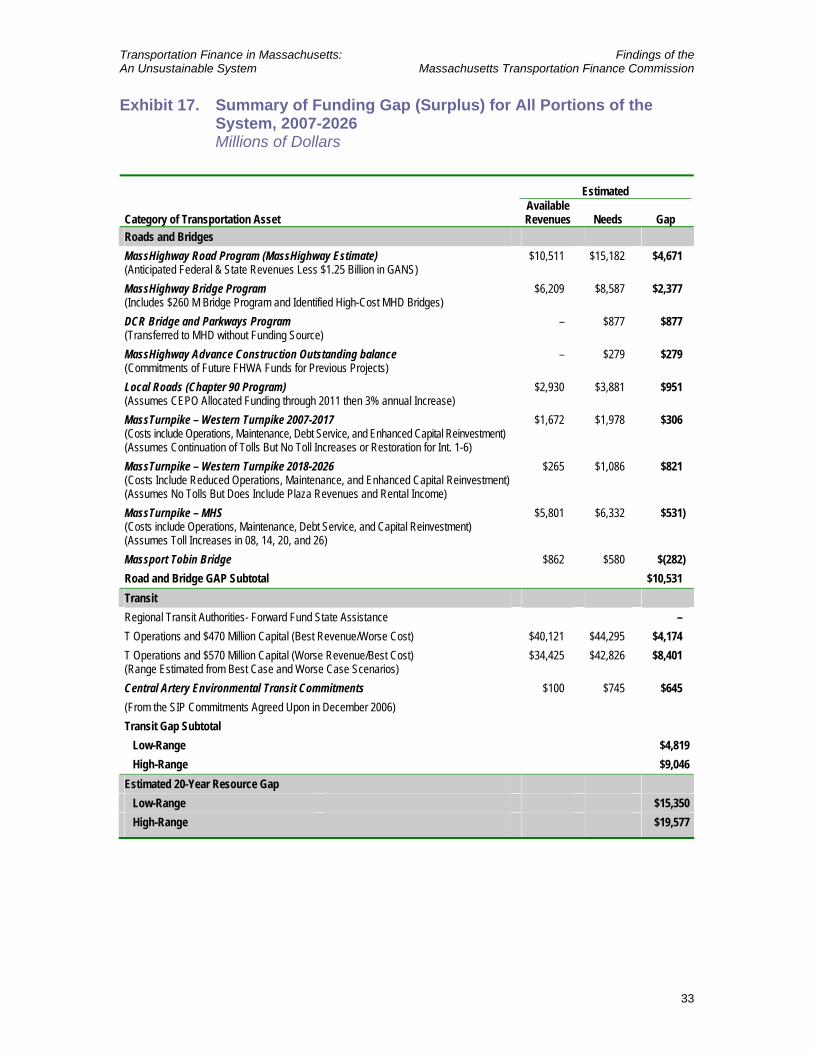
FFuunnddiinngg GGaapp SSuummmmaarryy
Exhibit 17 shows the estimated available revenues, estimated need, and resulting funding gap (or in a few cases, surplus) for each of the elements of the Massachusetts surface transportation system. A description of each of these components makes up the remainder of this section.
Transportation Finance in Massachusetts: Findings of the An Unsustainable System Massachusetts Transportation Finance Commission
33
Exhibit 17. Summary of Funding Gap (Surplus) for All Portions of the System, 2007-2026 Millions of Dollars
Estimated
Category of Transportation Asset Available Revenues Needs Gap
Roads and Bridges MassHighway Road Program (MassHighway Estimate) (Anticipated Federal & State Revenues Less $1.25 Billion in GANS)
$10,511 $15,182 $4,671
MassHighway Bridge Program (Includes $260 M Bridge Program and Identified High-Cost MHD Bridges)
$6,209 $8,587 $2,377
DCR Bridge and Parkways Program (Transferred to MHD without Funding Source)
– $877 $877
MassHighway Advance Construction Outstanding balance (Commitments of Future FHWA Funds for Previous Projects)
– $279 $279
Local Roads (Chapter 90 Program) (Assumes CEPO Allocated Funding through 2011 then 3% annual Increase)
$2,930 $3,881 $951
MassTurnpike – Western Turnpike 2007-2017 (Costs include Operations, Maintenance, Debt Service, and Enhanced Capital Reinvestment) (Assumes Continuation of Tolls But No Toll Increases or Restoration for Int. 1-6)
$1,672 $1,978 $306
MassTurnpike – Western Turnpike 2018-2026 (Costs Include Reduced Operations, Maintenance, and Enhanced Capital Reinvestment) (Assumes No Tolls But Does Include Plaza Revenues and Rental Income)
$265 $1,086 $821
MassTurnpike – MHS (Costs include Operations, Maintenance, Debt Service, and Capital Reinvestment) (Assumes Toll Increases in 08, 14, 20, and 26)
$5,801 $6,332 $531)
Massport Tobin Bridge $862 $580 $(282) Road and Bridge GAP Subtotal $10,531 Transit Regional Transit Authorities- Forward Fund State Assistance – T Operations and $470 Million Capital (Best Revenue/Worse Cost) $40,121 $44,295 $4,174 T Operations and $570 Million Capital (Worse Revenue/Best Cost) (Range Estimated from Best Case and Worse Case Scenarios)
$34,425 $42,826 $8,401
Central Artery Environmental Transit Commitments (From the SIP Commitments Agreed Upon in December 2006)
$100 $745 $645
Transit Gap Subtotal Low-Range $4,819 High-Range $9,046 Estimated 20-Year Resource Gap Low-Range $15,350 High-Range $19,577
Transportation Finance in Massachusetts: Findings of the An Unsustainable System Massachusetts Transportation Finance Commission
34
RRooaaddss aanndd BBrriiddggeess
The Finance Commission estimates that there is a funding gap of approximately $9 billion between what will be needed to bring the road and bridge system to a state of good repair and expected state and Federal funds. We looked at four components of the state road and bridge system:
1. State-Controlled Roads – Roads controlled by MassHighway, mainly the Interstate system and arterials that carry the greatest amount of traffic, constitute $4.7 billion of the funding gap.
2. State-Controlled Bridges – The system of bridges controlled by MassHighway has an estimated gap of $2.4 billion.
3. Municipally Controlled Roads – The upkeep of roads that fall under the jurisdiction of local cities and towns and are partially funded under Chapter 90 represents $950 million of the gap.
4. Department of Conservation and Recreation (DCR) Parkways and Bridges – There are almost $880 million in identified capital needs for DCR’s parkways and bridges for which there is no available funding.
SSttaattee--CCoonnttrroolllleedd RRooaaddwwaayyss
The Finance Commission estimates that MassHighway has approximately $15.2 billion in roadway needs over the next 20 years but only $10.5 billion in expected state and Federal funding, resulting in a funding gap of $4.7 billion. Details of the gap calculation are provided in Appendix A.
MMaassssHHiigghhwwaayy’’ss EEssttiimmaattee ooff NNeeeeddss
MassHighway estimates that it would cost approximately $565 million annually (see Exhibit 18) to meet its needs for the roadway system. This amounts to $15.2 billion over 20 years, including cost escalation of 3 percent per year.
The Commission used two sources to evaluate the accuracy of MassHighway’s estimate. The first source drew on analysis by the Federal Highway Administration (FHWA). Every 2 years, the FHWA estimates the resources needed to maintain the roadway system in a state of good repair for the entire nation, which is summarized in the Conditions and Performance Report.13 Using the national estimate prepared in 2004 as a benchmark, we found that Massachusetts should be spending about $486 million per year on the state-maintained roadway system, exclusive of bridges, enhancements, or expansions. This is about 86 percent of MassHighway’s estimate of $565 million. 13
U.S. Department of Transportation, 2004 Status of the Nation’s Highways, Bridges, and Transit, Conditions and Performance, Report to Congress.
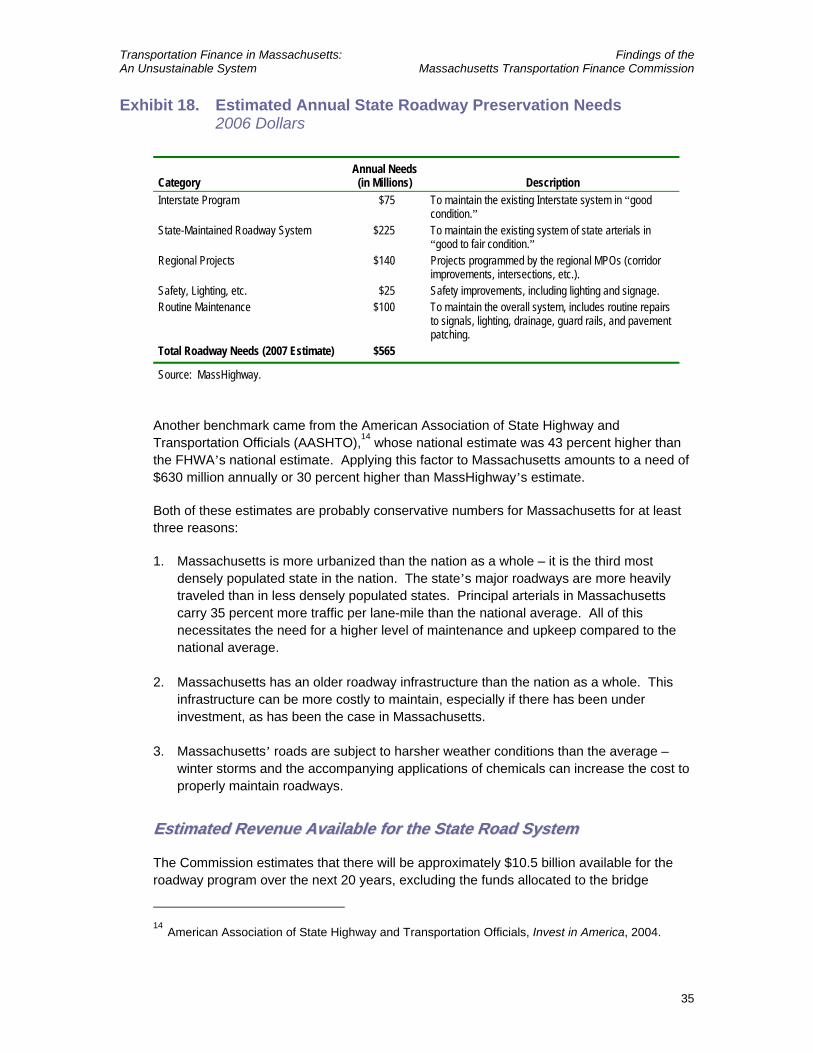
Transportation Finance in Massachusetts: Findings of the An Unsustainable System Massachusetts Transportation Finance Commission
35
Exhibit 18. Estimated Annual State Roadway Preservation Needs 2006 Dollars
Category Annual Needs
(in Millions) Description Interstate Program $75 To maintain the existing Interstate system in “good
condition.” State-Maintained Roadway System $225 To maintain the existing system of state arterials in
“good to fair condition.” Regional Projects $140 Projects programmed by the regional MPOs (corridor
improvements, intersections, etc.). Safety, Lighting, etc. $25 Safety improvements, including lighting and signage. Routine Maintenance $100 To maintain the overall system, includes routine repairs
to signals, lighting, drainage, guard rails, and pavement patching.
Total Roadway Needs (2007 Estimate) $565
Source: MassHighway.
Another benchmark came from the American Association of State Highway and Transportation Officials (AASHTO),14 whose national estimate was 43 percent higher than the FHWA’s national estimate. Applying this factor to Massachusetts amounts to a need of $630 million annually or 30 percent higher than MassHighway’s estimate.
Both of these estimates are probably conservative numbers for Massachusetts for at least three reasons:
1. Massachusetts is more urbanized than the nation as a whole – it is the third most densely populated state in the nation. The state’s major roadways are more heavily traveled than in less densely populated states. Principal arterials in Massachusetts carry 35 percent more traffic per lane-mile than the national average. All of this necessitates the need for a higher level of maintenance and upkeep compared to the national average.
2. Massachusetts has an older roadway infrastructure than the nation as a whole. This infrastructure can be more costly to maintain, especially if there has been under investment, as has been the case in Massachusetts.
3. Massachusetts’ roads are subject to harsher weather conditions than the average – winter storms and the accompanying applications of chemicals can increase the cost to properly maintain roadways.
EEssttiimmaatteedd RReevveennuuee AAvvaaiillaabbllee ffoorr tthhee SSttaattee RRooaadd SSyysstteemm
The Commission estimates that there will be approximately $10.5 billion available for the roadway program over the next 20 years, excluding the funds allocated to the bridge
14
American Association of State Highway and Transportation Officials, Invest in America, 2004.
Transportation Finance in Massachusetts: Findings of the An Unsustainable System Massachusetts Transportation Finance Commission
36
system. This is based on MassHighway’s Capital Expenditure Program Office (CEPO) forecasts of state and Federal funds for fiscal years 2007 through 2011 and escalating by 3 percent per year. These estimates are based on a continuation of Federal aid under SAFETEA-LU, which expires in 2009. However, given recent and expected trends in Federal funding, the number is likely to be less than that.
The $10.5 billion estimate of future revenue available for the roadway program reflects the need to repay $1.2 billion of the Grant Anticipation Notes (GANs) that will consume about one-third of Federal funds for highways between 2007 and 2014.
MMaassssHHiigghhwwaayy BBrriiddggee PPrrooggrraamm
Based on data provided by MassHighway, the Commission estimates that $6.2 billion will be available over the next 20 years for the bridge program, assuming that funding levels rise by 3 percent annually after 2011. However, the total estimated replacement and rehabilitation needs are estimated at $8.6 billion, leaving a gap of $2.4 billion. Appendix B shows the estimates of gaps between MassHighway estimate of needs for the bridges and available funds in 5-year increments.
BBaassiicc BBrriiddggee PPrrooggrraamm
Prior to 2004, MassHighway was spending approximately $130 million annually on its basic bridge program, but as a result the number of bridges that were structurally deficient and functionally obsolete was increasing – there were over 550 structurally deficient bridges in 2003.15
To address this problem, in 2004 the Commonwealth developed a plan to reduce its inventory of deficient bridges by budgeting approximately $200 million a year starting in 2004, which was accomplished by diverting $100 million from the road program to the bridge program. However, MassHighway has never spent more than $170 million a year on the bridge program.
Since these estimates were made in 2004, bridge construction costs have risen by at least 30 percent. This increase has dramatically impacted MassHighway’s ability to attain the goal of reducing structurally deficient bridges. According to MassHighway’s bridge program (PONTIS), $260 million is the amount needed in 2007 to begin to address at the number of structurally deficient bridges. MassHighway has estimated that this level of investment over 10 years would reduce the backlog of structurally deficient bridges from 550 to 400. Reducing the backlog of structurally deficient bridges from 550 to 400 over 13 years is encouraging, but hardly an aggressive program.
15
A structurally deficient bridge is closed or restricted to light vehicles only because of deteriorated structural components. Structurally deficient bridges are not necessarily unsafe. A functionally obsolete bridge is one that cannot safely service the volume or type of traffic using it. These bridges are not unsafe for all vehicles, but have older design features that prevent them from accommodating current traffic volumes and modern vehicle sizes and weights.
Transportation Finance in Massachusetts: Findings of the An Unsustainable System Massachusetts Transportation Finance Commission
37
For the purposes of the gap analysis, the Commission estimated the needs for the three components of MassHighway’s bridge program. They include:
1. Bridge program: this program covers rehabilitation needs for those bridges that need less than $20 million in capital reinvestment. For this program, MassHighway’s needs $260 million in 2007 and then has increased the needs by 3 percent in subsequent years to account for inflation. This results in a 20-year capital need of $7 billion.
2. Emergency repairs and maintenance: MassHighway needs $25 million a year, in 2007 dollars, for emergency bridge repairs and maintenance. These funds are used to make immediate repairs after a bridge sustains damage from a crash, for example. This results in a 20-year capital need of $670 million.
3. High-cost bridges: MassHighway has identified a number of bridges that will require extensive capital investment and because of their high cost are not able to be funded out of the regular bridge program. Currently, MassHighway has identified a list of bridges that the Commission estimates will cost at least $900 million to rehabilitate over the next 10 years.
The Commission estimates that there will be approximately $6.2 billion available to cover the needs for all three components of the bridge program over the next 20 years. This is based on MassHighway’s Capital Expenditure Program Office (CEPO) forecasts of state and Federal funds for fiscal years 2007 through 2011 and escalating by 3 percent per year. These estimates are based on a continuation of Federal aid under SAFETEA-LU, which expires in 2009. However, given recent and expected trends in Federal funding, the number is likely to be less than that. This results in a 20-year funding gap of $2.4 billion for the three components of MassHighway’s bridge program.
HHiigghh--CCoosstt BBrriiddggeess
As stated before, MassHighway has identified over $690 million in today’s dollars worth of high-cost bridge16 rehabilitations or replacements that are not included in the basic bridge rehabilitation program (see Exhibit 19). If the backlog of bridges is drawn down over 10 years, the total cost to repair these bridges is estimated at $900 million, once inflation is taken into account. This estimate is most certainly on the low side because it does not account for additional bridges that will need rehabilitation over the forecast period. The key point here is that these high-cost bridges are not included anywhere in the MassHighway regular bridge program. When any of these high-cost bridges is rehabilitated, the funds have to come from some other part of the MassHighway budget.
16
MassHighway defines a “high-cost” bridge as one that requires over $20 million in capital repairs. These bridges are normally funded outside of the regular bridge program.
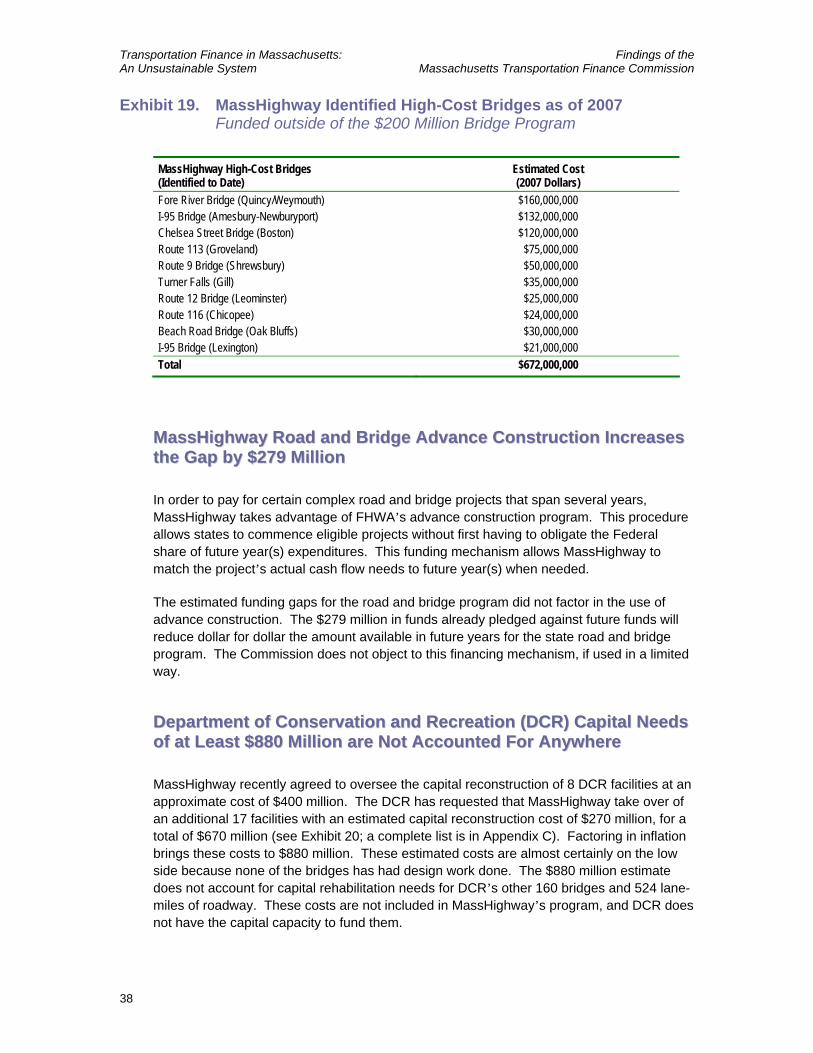
Transportation Finance in Massachusetts: Findings of the An Unsustainable System Massachusetts Transportation Finance Commission
38
Exhibit 19. MassHighway Identified High-Cost Bridges as of 2007 Funded outside of the $200 Million Bridge Program
MassHighway High-Cost Bridges (Identified to Date)
Estimated Cost (2007 Dollars)
Fore River Bridge (Quincy/Weymouth) $160,000,000 I-95 Bridge (Amesbury-Newburyport) $132,000,000 Chelsea Street Bridge (Boston) $120,000,000 Route 113 (Groveland) $75,000,000 Route 9 Bridge (Shrewsbury) $50,000,000 Turner Falls (Gill) $35,000,000 Route 12 Bridge (Leominster) $25,000,000 Route 116 (Chicopee) $24,000,000 Beach Road Bridge (Oak Bluffs) $30,000,000 I-95 Bridge (Lexington) $21,000,000 Total $672,000,000
MMaassssHHiigghhwwaayy RRooaadd aanndd BBrriiddggee AAddvvaannccee CCoonnssttrruuccttiioonn IInnccrreeaasseess tthhee GGaapp bbyy $$227799 MMiilllliioonn
In order to pay for certain complex road and bridge projects that span several years, MassHighway takes advantage of FHWA’s advance construction program. This procedure allows states to commence eligible projects without first having to obligate the Federal share of future year(s) expenditures. This funding mechanism allows MassHighway to match the project’s actual cash flow needs to future year(s) when needed.
The estimated funding gaps for the road and bridge program did not factor in the use of advance construction. The $279 million in funds already pledged against future funds will reduce dollar for dollar the amount available in future years for the state road and bridge program. The Commission does not object to this financing mechanism, if used in a limited way.
DDeeppaarrttmmeenntt ooff CCoonnsseerrvvaattiioonn aanndd RReeccrreeaattiioonn ((DDCCRR)) CCaappiittaall NNeeeeddss ooff aatt LLeeaasstt $$888800 MMiilllliioonn aarree NNoott AAccccoouunntteedd FFoorr AAnnyywwhheerree
MassHighway recently agreed to oversee the capital reconstruction of 8 DCR facilities at an approximate cost of $400 million. The DCR has requested that MassHighway take over of an additional 17 facilities with an estimated capital reconstruction cost of $270 million, for a total of $670 million (see Exhibit 20; a complete list is in Appendix C). Factoring in inflation brings these costs to $880 million. These estimated costs are almost certainly on the low side because none of the bridges has had design work done. The $880 million estimate does not account for capital rehabilitation needs for DCR’s other 160 bridges and 524 lane-miles of roadway. These costs are not included in MassHighway’s program, and DCR does not have the capital capacity to fund them.
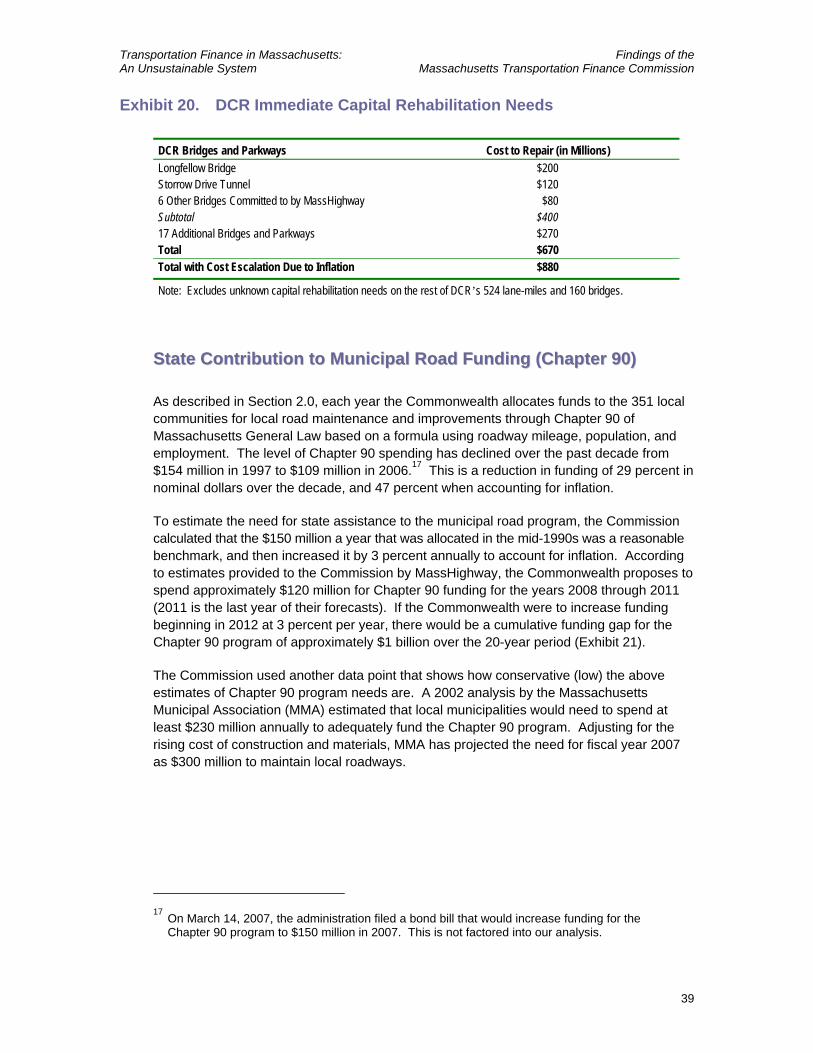
Transportation Finance in Massachusetts: Findings of the An Unsustainable System Massachusetts Transportation Finance Commission
39
Exhibit 20. DCR Immediate Capital Rehabilitation Needs
DCR Bridges and Parkways Cost to Repair (in Millions) Longfellow Bridge $200 Storrow Drive Tunnel $120 6 Other Bridges Committed to by MassHighway $80 Subtotal $400 17 Additional Bridges and Parkways $270 Total $670 Total with Cost Escalation Due to Inflation $880
Note: Excludes unknown capital rehabilitation needs on the rest of DCR’s 524 lane-miles and 160 bridges.
SSttaattee CCoonnttrriibbuuttiioonn ttoo MMuunniicciippaall RRooaadd FFuunnddiinngg ((CChhaapptteerr 9900))
As described in Section 2.0, each year the Commonwealth allocates funds to the 351 local communities for local road maintenance and improvements through Chapter 90 of Massachusetts General Law based on a formula using roadway mileage, population, and employment. The level of Chapter 90 spending has declined over the past decade from $154 million in 1997 to $109 million in 2006.17 This is a reduction in funding of 29 percent in nominal dollars over the decade, and 47 percent when accounting for inflation.
To estimate the need for state assistance to the municipal road program, the Commission calculated that the $150 million a year that was allocated in the mid-1990s was a reasonable benchmark, and then increased it by 3 percent annually to account for inflation. According to estimates provided to the Commission by MassHighway, the Commonwealth proposes to spend approximately $120 million for Chapter 90 funding for the years 2008 through 2011 (2011 is the last year of their forecasts). If the Commonwealth were to increase funding beginning in 2012 at 3 percent per year, there would be a cumulative funding gap for the Chapter 90 program of approximately $1 billion over the 20-year period (Exhibit 21).
The Commission used another data point that shows how conservative (low) the above estimates of Chapter 90 program needs are. A 2002 analysis by the Massachusetts Municipal Association (MMA) estimated that local municipalities would need to spend at least $230 million annually to adequately fund the Chapter 90 program. Adjusting for the rising cost of construction and materials, MMA has projected the need for fiscal year 2007 as $300 million to maintain local roadways.
17
On March 14, 2007, the administration filed a bond bill that would increase funding for the Chapter 90 program to $150 million in 2007. This is not factored into our analysis.
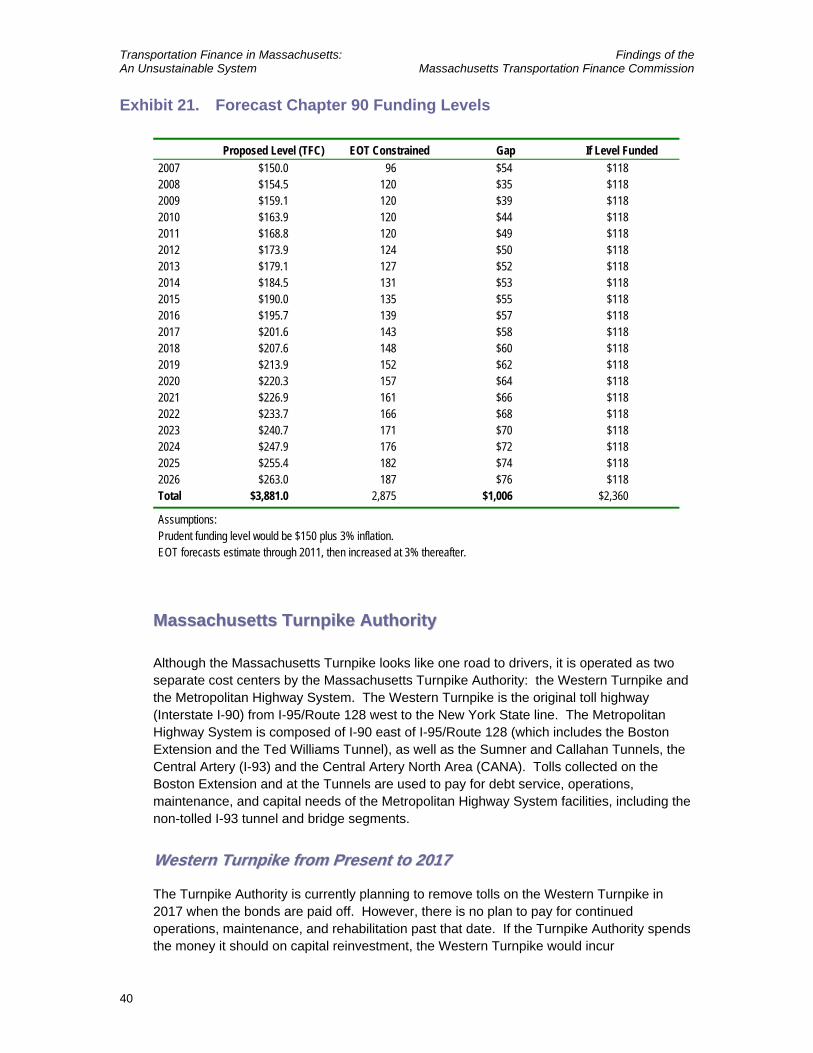
Transportation Finance in Massachusetts: Findings of the An Unsustainable System Massachusetts Transportation Finance Commission
40
Exhibit 21. Forecast Chapter 90 Funding Levels
Proposed Level (TFC) EOT Constrained Gap If Level Funded 2007 $150.0 96 $54 $118 2008 $154.5 120 $35 $118 2009 $159.1 120 $39 $118 2010 $163.9 120 $44 $118 2011 $168.8 120 $49 $118 2012 $173.9 124 $50 $118 2013 $179.1 127 $52 $118 2014 $184.5 131 $53 $118 2015 $190.0 135 $55 $118 2016 $195.7 139 $57 $118 2017 $201.6 143 $58 $118 2018 $207.6 148 $60 $118 2019 $213.9 152 $62 $118 2020 $220.3 157 $64 $118 2021 $226.9 161 $66 $118 2022 $233.7 166 $68 $118 2023 $240.7 171 $70 $118 2024 $247.9 176 $72 $118 2025 $255.4 182 $74 $118 2026 $263.0 187 $76 $118 Total $3,881.0 2,875 $1,006 $2,360
Assumptions: Prudent funding level would be $150 plus 3% inflation. EOT forecasts estimate through 2011, then increased at 3% thereafter.
MMaassssaacchhuusseettttss TTuurrnnppiikkee AAuutthhoorriittyy
Although the Massachusetts Turnpike looks like one road to drivers, it is operated as two separate cost centers by the Massachusetts Turnpike Authority: the Western Turnpike and the Metropolitan Highway System. The Western Turnpike is the original toll highway (Interstate I-90) from I-95/Route 128 west to the New York State line. The Metropolitan Highway System is composed of I-90 east of I-95/Route 128 (which includes the Boston Extension and the Ted Williams Tunnel), as well as the Sumner and Callahan Tunnels, the Central Artery (I-93) and the Central Artery North Area (CANA). Tolls collected on the Boston Extension and at the Tunnels are used to pay for debt service, operations, maintenance, and capital needs of the Metropolitan Highway System facilities, including the non-tolled I-93 tunnel and bridge segments.
WWeesstteerrnn TTuurrnnppiikkee ffrroomm PPrreesseenntt ttoo 22001177
The Turnpike Authority is currently planning to remove tolls on the Western Turnpike in 2017 when the bonds are paid off. However, there is no plan to pay for continued operations, maintenance, and rehabilitation past that date. If the Turnpike Authority spends the money it should on capital reinvestment, the Western Turnpike would incur
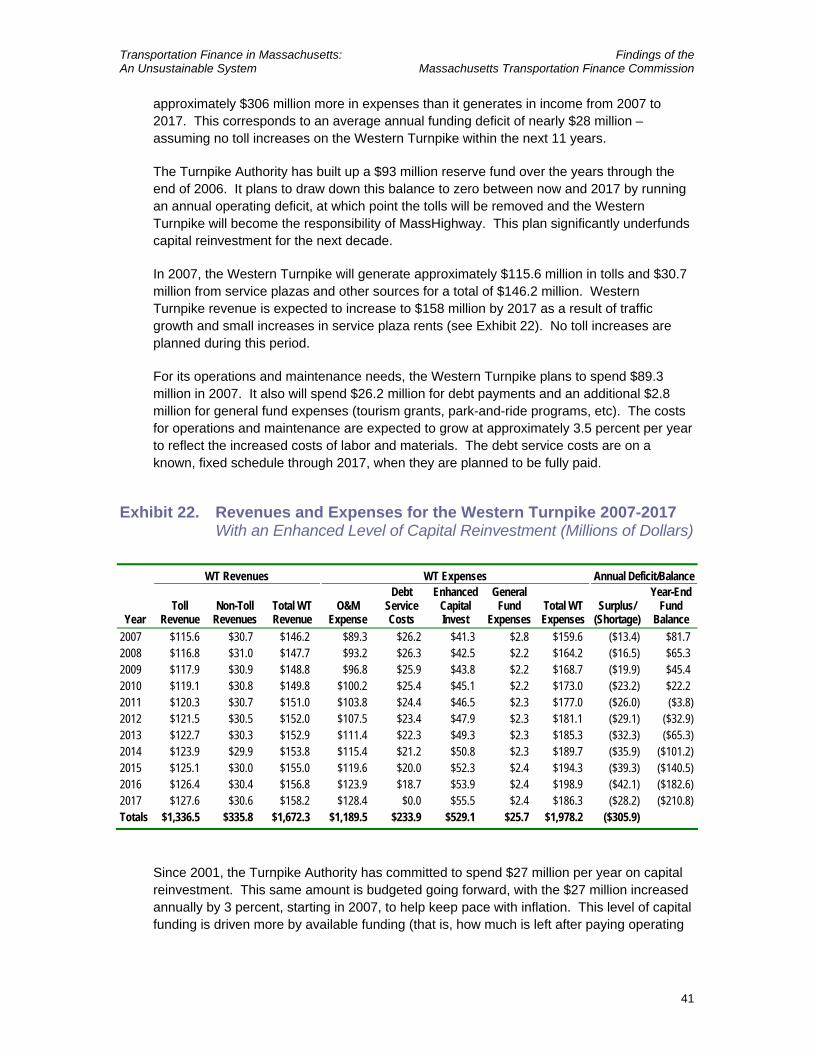
Transportation Finance in Massachusetts: Findings of the An Unsustainable System Massachusetts Transportation Finance Commission
41
approximately $306 million more in expenses than it generates in income from 2007 to 2017. This corresponds to an average annual funding deficit of nearly $28 million – assuming no toll increases on the Western Turnpike within the next 11 years.
The Turnpike Authority has built up a $93 million reserve fund over the years through the end of 2006. It plans to draw down this balance to zero between now and 2017 by running an annual operating deficit, at which point the tolls will be removed and the Western Turnpike will become the responsibility of MassHighway. This plan significantly underfunds capital reinvestment for the next decade.
In 2007, the Western Turnpike will generate approximately $115.6 million in tolls and $30.7 million from service plazas and other sources for a total of $146.2 million. Western Turnpike revenue is expected to increase to $158 million by 2017 as a result of traffic growth and small increases in service plaza rents (see Exhibit 22). No toll increases are planned during this period.
For its operations and maintenance needs, the Western Turnpike plans to spend $89.3 million in 2007. It also will spend $26.2 million for debt payments and an additional $2.8 million for general fund expenses (tourism grants, park-and-ride programs, etc). The costs for operations and maintenance are expected to grow at approximately 3.5 percent per year to reflect the increased costs of labor and materials. The debt service costs are on a known, fixed schedule through 2017, when they are planned to be fully paid.
Exhibit 22. Revenues and Expenses for the Western Turnpike 2007-2017 With an Enhanced Level of Capital Reinvestment (Millions of Dollars)
WT Revenues WT Expenses Annual Deficit/Balance
Year Toll
Revenue Non-Toll
Revenues Total WT Revenue
O&M Expense
Debt Service Costs
Enhanced Capital Invest
General Fund
Expenses Total WT Expenses
Surplus/ (Shortage)
Year-End Fund
Balance 2007 $115.6 $30.7 $146.2 $89.3 $26.2 $41.3 $2.8 $159.6 ($13.4) $81.7 2008 $116.8 $31.0 $147.7 $93.2 $26.3 $42.5 $2.2 $164.2 ($16.5) $65.3 2009 $117.9 $30.9 $148.8 $96.8 $25.9 $43.8 $2.2 $168.7 ($19.9) $45.4 2010 $119.1 $30.8 $149.8 $100.2 $25.4 $45.1 $2.2 $173.0 ($23.2) $22.2 2011 $120.3 $30.7 $151.0 $103.8 $24.4 $46.5 $2.3 $177.0 ($26.0) ($3.8) 2012 $121.5 $30.5 $152.0 $107.5 $23.4 $47.9 $2.3 $181.1 ($29.1) ($32.9) 2013 $122.7 $30.3 $152.9 $111.4 $22.3 $49.3 $2.3 $185.3 ($32.3) ($65.3) 2014 $123.9 $29.9 $153.8 $115.4 $21.2 $50.8 $2.3 $189.7 ($35.9) ($101.2) 2015 $125.1 $30.0 $155.0 $119.6 $20.0 $52.3 $2.4 $194.3 ($39.3) ($140.5) 2016 $126.4 $30.4 $156.8 $123.9 $18.7 $53.9 $2.4 $198.9 ($42.1) ($182.6) 2017 $127.6 $30.6 $158.2 $128.4 $0.0 $55.5 $2.4 $186.3 ($28.2) ($210.8) Totals $1,336.5 $335.8 $1,672.3 $1,189.5 $233.9 $529.1 $25.7 $1,978.2 ($305.9)
Since 2001, the Turnpike Authority has committed to spend $27 million per year on capital reinvestment. This same amount is budgeted going forward, with the $27 million increased annually by 3 percent, starting in 2007, to help keep pace with inflation. This level of capital funding is driven more by available funding (that is, how much is left after paying operating
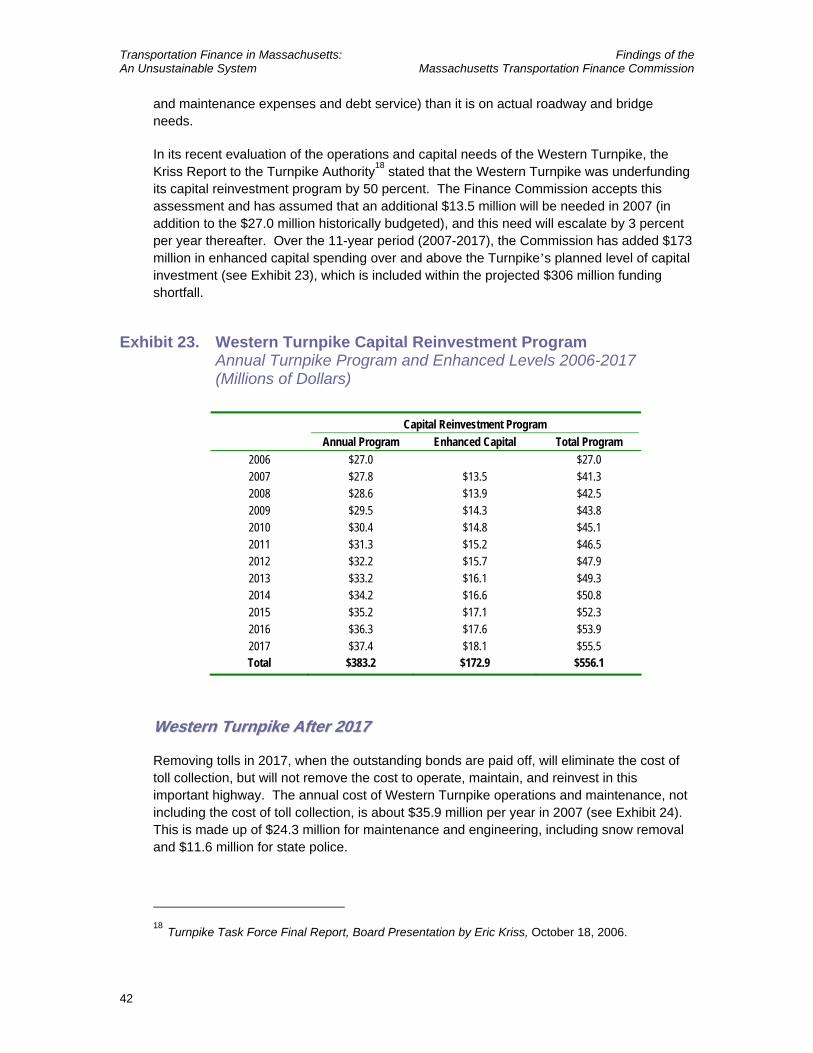
Transportation Finance in Massachusetts: Findings of the An Unsustainable System Massachusetts Transportation Finance Commission
42
and maintenance expenses and debt service) than it is on actual roadway and bridge needs.
In its recent evaluation of the operations and capital needs of the Western Turnpike, the Kriss Report to the Turnpike Authority18 stated that the Western Turnpike was underfunding its capital reinvestment program by 50 percent. The Finance Commission accepts this assessment and has assumed that an additional $13.5 million will be needed in 2007 (in addition to the $27.0 million historically budgeted), and this need will escalate by 3 percent per year thereafter. Over the 11-year period (2007-2017), the Commission has added $173 million in enhanced capital spending over and above the Turnpike’s planned level of capital investment (see Exhibit 23), which is included within the projected $306 million funding shortfall.
Exhibit 23. Western Turnpike Capital Reinvestment Program Annual Turnpike Program and Enhanced Levels 2006-2017 (Millions of Dollars)
Capital Reinvestment Program Annual Program Enhanced Capital Total Program
2006 $27.0 $27.0 2007 $27.8 $13.5 $41.3 2008 $28.6 $13.9 $42.5 2009 $29.5 $14.3 $43.8 2010 $30.4 $14.8 $45.1 2011 $31.3 $15.2 $46.5 2012 $32.2 $15.7 $47.9 2013 $33.2 $16.1 $49.3 2014 $34.2 $16.6 $50.8 2015 $35.2 $17.1 $52.3 2016 $36.3 $17.6 $53.9 2017 $37.4 $18.1 $55.5 Total $383.2 $172.9 $556.1
WWeesstteerrnn TTuurrnnppiikkee AAfftteerr 22001177
Removing tolls in 2017, when the outstanding bonds are paid off, will eliminate the cost of toll collection, but will not remove the cost to operate, maintain, and reinvest in this important highway. The annual cost of Western Turnpike operations and maintenance, not including the cost of toll collection, is about $35.9 million per year in 2007 (see Exhibit 24). This is made up of $24.3 million for maintenance and engineering, including snow removal and $11.6 million for state police.
18
Turnpike Task Force Final Report, Board Presentation by Eric Kriss, October 18, 2006.
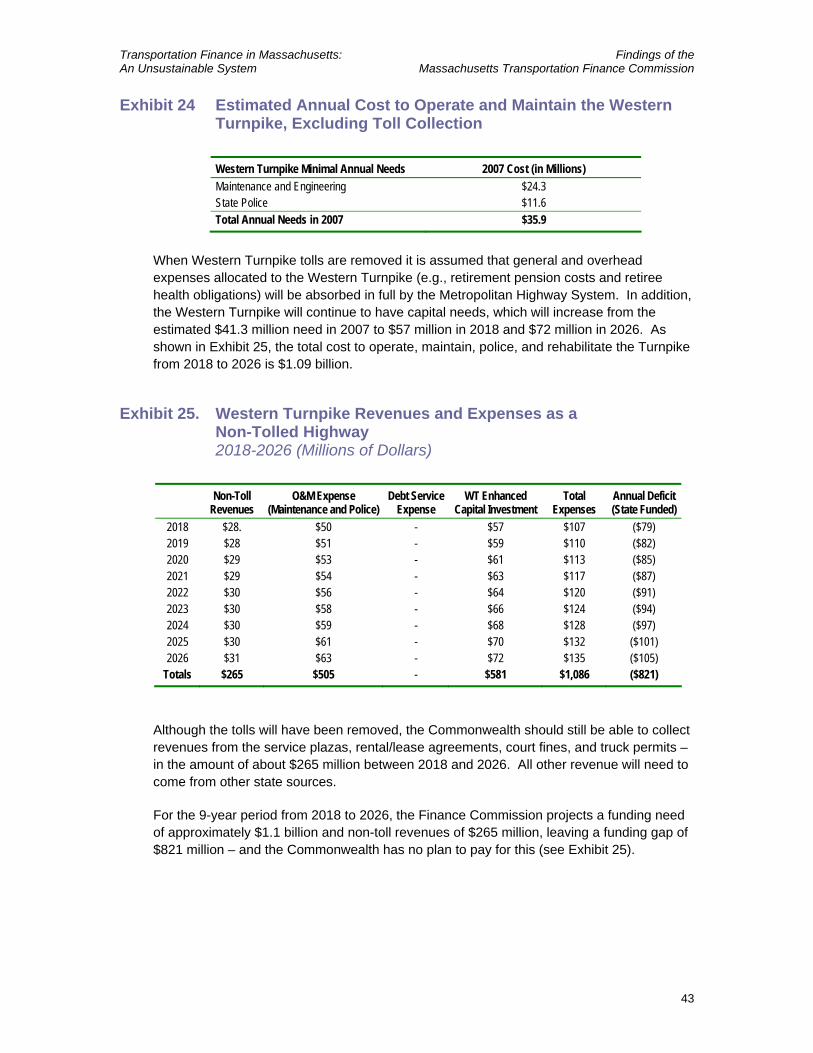
Transportation Finance in Massachusetts: Findings of the An Unsustainable System Massachusetts Transportation Finance Commission
43
Exhibit 24 Estimated Annual Cost to Operate and Maintain the Western Turnpike, Excluding Toll Collection
Western Turnpike Minimal Annual Needs 2007 Cost (in Millions) Maintenance and Engineering $24.3 State Police $11.6 Total Annual Needs in 2007 $35.9
When Western Turnpike tolls are removed it is assumed that general and overhead expenses allocated to the Western Turnpike (e.g., retirement pension costs and retiree health obligations) will be absorbed in full by the Metropolitan Highway System. In addition, the Western Turnpike will continue to have capital needs, which will increase from the estimated $41.3 million need in 2007 to $57 million in 2018 and $72 million in 2026. As shown in Exhibit 25, the total cost to operate, maintain, police, and rehabilitate the Turnpike from 2018 to 2026 is $1.09 billion.
Exhibit 25. Western Turnpike Revenues and Expenses as a Non-Tolled Highway 2018-2026 (Millions of Dollars)
Non-Toll
Revenues O&M Expense
(Maintenance and Police) Debt Service
Expense WT Enhanced
Capital Investment Total
Expenses Annual Deficit (State Funded)
2018 $28. $50 - $57 $107 ($79) 2019 $28 $51 - $59 $110 ($82) 2020 $29 $53 - $61 $113 ($85) 2021 $29 $54 - $63 $117 ($87) 2022 $30 $56 - $64 $120 ($91) 2023 $30 $58 - $66 $124 ($94) 2024 $30 $59 - $68 $128 ($97) 2025 $30 $61 - $70 $132 ($101) 2026 $31 $63 - $72 $135 ($105)
Totals $265 $505 - $581 $1,086 ($821)
Although the tolls will have been removed, the Commonwealth should still be able to collect revenues from the service plazas, rental/lease agreements, court fines, and truck permits – in the amount of about $265 million between 2018 and 2026. All other revenue will need to come from other state sources.
For the 9-year period from 2018 to 2026, the Finance Commission projects a funding need of approximately $1.1 billion and non-toll revenues of $265 million, leaving a funding gap of $821 million – and the Commonwealth has no plan to pay for this (see Exhibit 25).
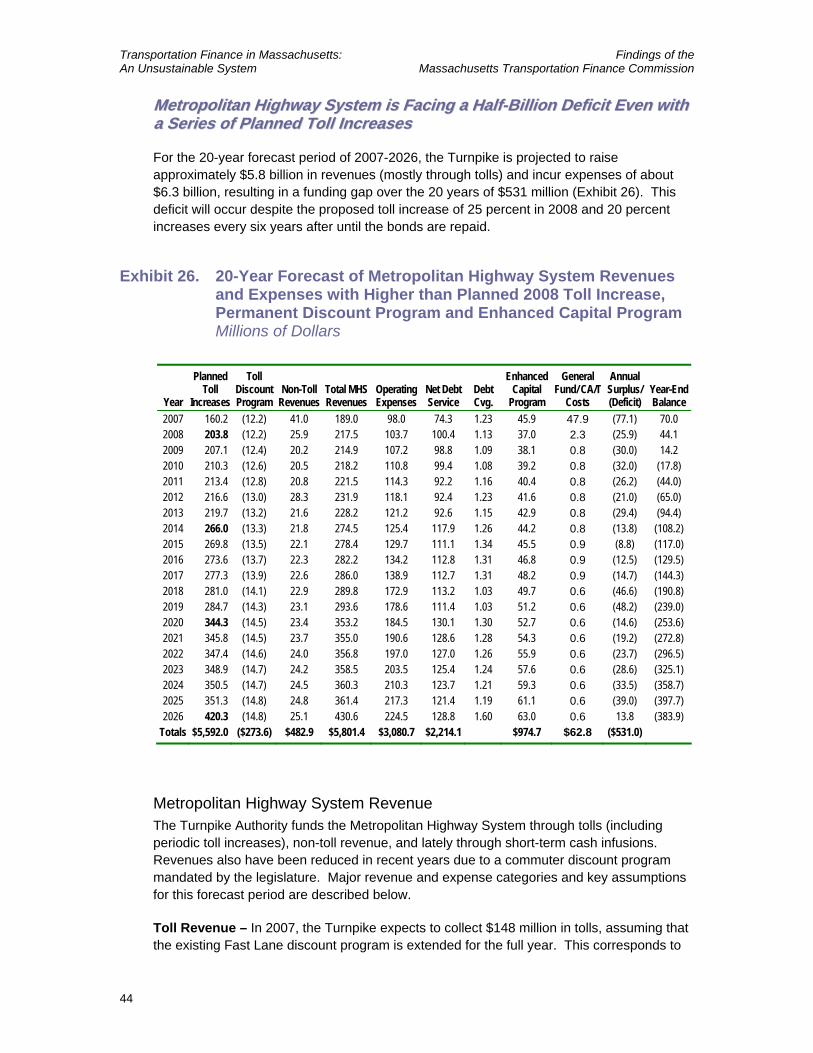
Transportation Finance in Massachusetts: Findings of the An Unsustainable System Massachusetts Transportation Finance Commission
44
MMeettrrooppoolliittaann HHiigghhwwaayy SSyysstteemm iiss FFaacciinngg aa HHaallff--BBiilllliioonn DDeeffiicciitt EEvveenn wwiitthh aa SSeerriieess ooff PPllaannnneedd TToollll IInnccrreeaasseess
For the 20-year forecast period of 2007-2026, the Turnpike is projected to raise approximately $5.8 billion in revenues (mostly through tolls) and incur expenses of about $6.3 billion, resulting in a funding gap over the 20 years of $531 million (Exhibit 26). This deficit will occur despite the proposed toll increase of 25 percent in 2008 and 20 percent increases every six years after until the bonds are repaid.
Exhibit 26. 20-Year Forecast of Metropolitan Highway System Revenues and Expenses with Higher than Planned 2008 Toll Increase, Permanent Discount Program and Enhanced Capital Program Millions of Dollars
Year
Planned Toll
Increases
Toll Discount Program
Non-Toll Revenues
Total MHS Revenues
Operating Expenses
Net Debt Service
Debt Cvg.
Enhanced Capital
Program
General Fund/ CA/T
Costs
Annual Surplus/ (Deficit)
Year-End Balance
2007 160.2 (12.2) 41.0 189.0 98.0 74.3 1.23 45.9 47.9 (77.1) 70.0 2008 203.8 (12.2) 25.9 217.5 103.7 100.4 1.13 37.0 2.3 (25.9) 44.1 2009 207.1 (12.4) 20.2 214.9 107.2 98.8 1.09 38.1 0.8 (30.0) 14.2 2010 210.3 (12.6) 20.5 218.2 110.8 99.4 1.08 39.2 0.8 (32.0) (17.8) 2011 213.4 (12.8) 20.8 221.5 114.3 92.2 1.16 40.4 0.8 (26.2) (44.0) 2012 216.6 (13.0) 28.3 231.9 118.1 92.4 1.23 41.6 0.8 (21.0) (65.0) 2013 219.7 (13.2) 21.6 228.2 121.2 92.6 1.15 42.9 0.8 (29.4) (94.4) 2014 266.0 (13.3) 21.8 274.5 125.4 117.9 1.26 44.2 0.8 (13.8) (108.2) 2015 269.8 (13.5) 22.1 278.4 129.7 111.1 1.34 45.5 0.9 (8.8) (117.0) 2016 273.6 (13.7) 22.3 282.2 134.2 112.8 1.31 46.8 0.9 (12.5) (129.5) 2017 277.3 (13.9) 22.6 286.0 138.9 112.7 1.31 48.2 0.9 (14.7) (144.3) 2018 281.0 (14.1) 22.9 289.8 172.9 113.2 1.03 49.7 0.6 (46.6) (190.8) 2019 284.7 (14.3) 23.1 293.6 178.6 111.4 1.03 51.2 0.6 (48.2) (239.0) 2020 344.3 (14.5) 23.4 353.2 184.5 130.1 1.30 52.7 0.6 (14.6) (253.6) 2021 345.8 (14.5) 23.7 355.0 190.6 128.6 1.28 54.3 0.6 (19.2) (272.8) 2022 347.4 (14.6) 24.0 356.8 197.0 127.0 1.26 55.9 0.6 (23.7) (296.5) 2023 348.9 (14.7) 24.2 358.5 203.5 125.4 1.24 57.6 0.6 (28.6) (325.1) 2024 350.5 (14.7) 24.5 360.3 210.3 123.7 1.21 59.3 0.6 (33.5) (358.7) 2025 351.3 (14.8) 24.8 361.4 217.3 121.4 1.19 61.1 0.6 (39.0) (397.7) 2026 420.3 (14.8) 25.1 430.6 224.5 128.8 1.60 63.0 0.6 13.8 (383.9)
Totals $5,592.0 ($273.6) $482.9 $5,801.4 $3,080.7 $2,214.1 $974.7 $62.8 ($531.0)
Metropolitan Highway System Revenue The Turnpike Authority funds the Metropolitan Highway System through tolls (including periodic toll increases), non-toll revenue, and lately through short-term cash infusions. Revenues also have been reduced in recent years due to a commuter discount program mandated by the legislature. Major revenue and expense categories and key assumptions for this forecast period are described below.
Toll Revenue – In 2007, the Turnpike expects to collect $148 million in tolls, assuming that the existing Fast Lane discount program is extended for the full year. This corresponds to
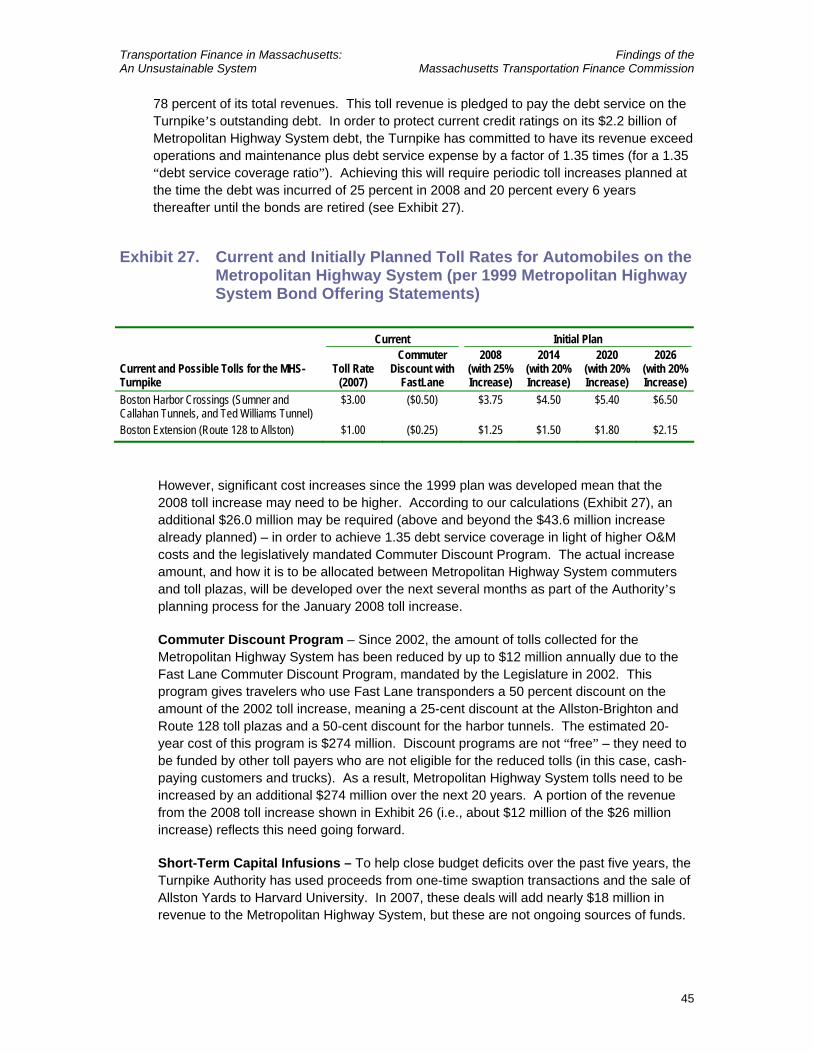
Transportation Finance in Massachusetts: Findings of the An Unsustainable System Massachusetts Transportation Finance Commission
45
78 percent of its total revenues. This toll revenue is pledged to pay the debt service on the Turnpike’s outstanding debt. In order to protect current credit ratings on its $2.2 billion of Metropolitan Highway System debt, the Turnpike has committed to have its revenue exceed operations and maintenance plus debt service expense by a factor of 1.35 times (for a 1.35 “debt service coverage ratio”). Achieving this will require periodic toll increases planned at the time the debt was incurred of 25 percent in 2008 and 20 percent every 6 years thereafter until the bonds are retired (see Exhibit 27).
Exhibit 27. Current and Initially Planned Toll Rates for Automobiles on the Metropolitan Highway System (per 1999 Metropolitan Highway System Bond Offering Statements)
Current Initial Plan
Current and Possible Tolls for the MHS- Turnpike
Toll Rate (2007)
Commuter Discount with
FastLane
2008 (with 25% Increase)
2014 (with 20% Increase)
2020 (with 20% Increase)
2026 (with 20% Increase)
Boston Harbor Crossings (Sumner and Callahan Tunnels, and Ted Williams Tunnel)
$3.00 ($0.50) $3.75 $4.50 $5.40 $6.50
Boston Extension (Route 128 to Allston) $1.00 ($0.25) $1.25 $1.50 $1.80 $2.15
However, significant cost increases since the 1999 plan was developed mean that the 2008 toll increase may need to be higher. According to our calculations (Exhibit 27), an additional $26.0 million may be required (above and beyond the $43.6 million increase already planned) – in order to achieve 1.35 debt service coverage in light of higher O&M costs and the legislatively mandated Commuter Discount Program. The actual increase amount, and how it is to be allocated between Metropolitan Highway System commuters and toll plazas, will be developed over the next several months as part of the Authority’s planning process for the January 2008 toll increase.
Commuter Discount Program – Since 2002, the amount of tolls collected for the Metropolitan Highway System has been reduced by up to $12 million annually due to the Fast Lane Commuter Discount Program, mandated by the Legislature in 2002. This program gives travelers who use Fast Lane transponders a 50 percent discount on the amount of the 2002 toll increase, meaning a 25-cent discount at the Allston-Brighton and Route 128 toll plazas and a 50-cent discount for the harbor tunnels. The estimated 20-year cost of this program is $274 million. Discount programs are not “free” – they need to be funded by other toll payers who are not eligible for the reduced tolls (in this case, cash-paying customers and trucks). As a result, Metropolitan Highway System tolls need to be increased by an additional $274 million over the next 20 years. A portion of the revenue from the 2008 toll increase shown in Exhibit 26 (i.e., about $12 million of the $26 million increase) reflects this need going forward.
Short-Term Capital Infusions – To help close budget deficits over the past five years, the Turnpike Authority has used proceeds from one-time swaption transactions and the sale of Allston Yards to Harvard University. In 2007, these deals will add nearly $18 million in revenue to the Metropolitan Highway System, but these are not ongoing sources of funds.
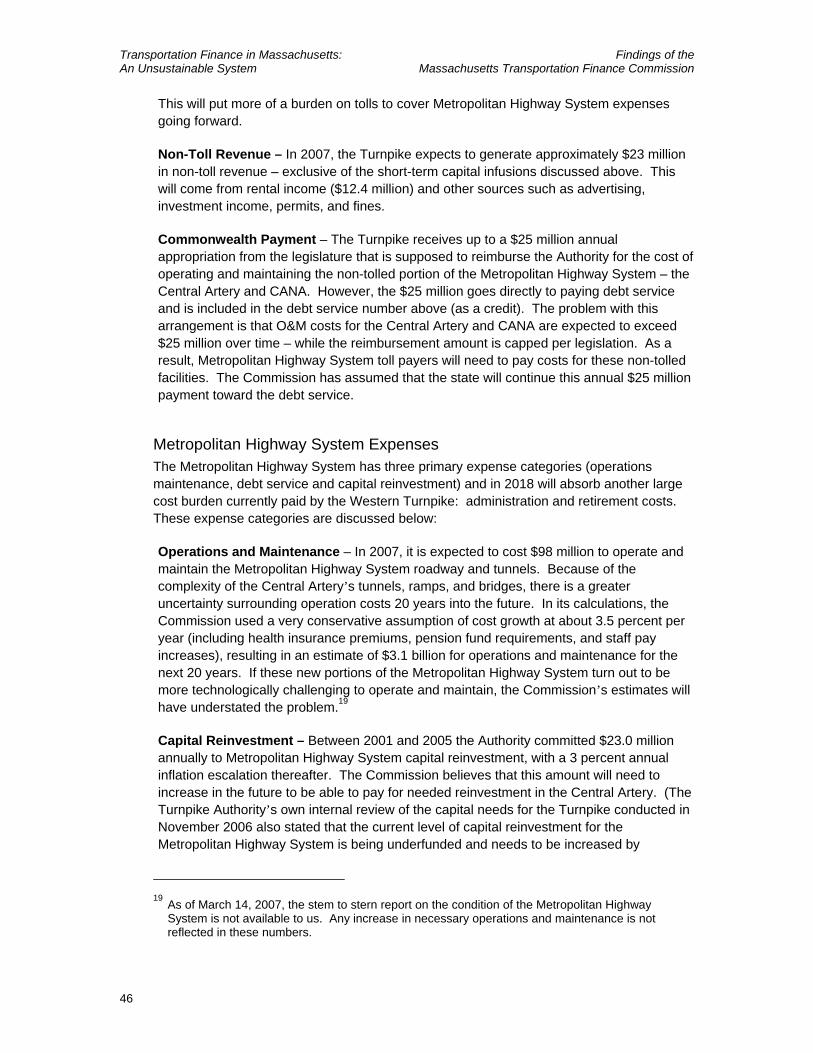
Transportation Finance in Massachusetts: Findings of the An Unsustainable System Massachusetts Transportation Finance Commission
46
This will put more of a burden on tolls to cover Metropolitan Highway System expenses going forward.
Non-Toll Revenue – In 2007, the Turnpike expects to generate approximately $23 million in non-toll revenue – exclusive of the short-term capital infusions discussed above. This will come from rental income ($12.4 million) and other sources such as advertising, investment income, permits, and fines.
Commonwealth Payment – The Turnpike receives up to a $25 million annual appropriation from the legislature that is supposed to reimburse the Authority for the cost of operating and maintaining the non-tolled portion of the Metropolitan Highway System – the Central Artery and CANA. However, the $25 million goes directly to paying debt service and is included in the debt service number above (as a credit). The problem with this arrangement is that O&M costs for the Central Artery and CANA are expected to exceed $25 million over time – while the reimbursement amount is capped per legislation. As a result, Metropolitan Highway System toll payers will need to pay costs for these non-tolled facilities. The Commission has assumed that the state will continue this annual $25 million payment toward the debt service.
Metropolitan Highway System Expenses The Metropolitan Highway System has three primary expense categories (operationsmaintenance, debt service and capital reinvestment) and in 2018 will absorb another large cost burden currently paid by the Western Turnpike: administration and retirement costs. These expense categories are discussed below:
Operations and Maintenance – In 2007, it is expected to cost $98 million to operate and maintain the Metropolitan Highway System roadway and tunnels. Because of the complexity of the Central Artery’s tunnels, ramps, and bridges, there is a greater uncertainty surrounding operation costs 20 years into the future. In its calculations, the Commission used a very conservative assumption of cost growth at about 3.5 percent per year (including health insurance premiums, pension fund requirements, and staff pay increases), resulting in an estimate of $3.1 billion for operations and maintenance for the next 20 years. If these new portions of the Metropolitan Highway System turn out to be more technologically challenging to operate and maintain, the Commission’s estimates will have understated the problem.19
Capital Reinvestment – Between 2001 and 2005 the Authority committed $23.0 million annually to Metropolitan Highway System capital reinvestment, with a 3 percent annual inflation escalation thereafter. The Commission believes that this amount will need to increase in the future to be able to pay for needed reinvestment in the Central Artery. (The Turnpike Authority’s own internal review of the capital needs for the Turnpike conducted in November 2006 also stated that the current level of capital reinvestment for the Metropolitan Highway System is being underfunded and needs to be increased by
19
As of March 14, 2007, the stem to stern report on the condition of the Metropolitan Highway System is not available to us. Any increase in necessary operations and maintenance is not reflected in these numbers.
Transportation Finance in Massachusetts: Findings of the An Unsustainable System Massachusetts Transportation Finance Commission
47
50 percent.) To fund this shortfall, the Finance Commission has assumed an additional $11.5 million for 2007, escalating by 3 percent per year thereafter. Over the next 20 years, this corresponds to $309 million in additional Metropolitan Highway System capital needs (see Exhibit 28) – not currently part of the Turnpike’s capital program but included in the Commission’s estimate of the funding gap. It is unclear if this will be sufficient in the future to pay for Ted Williams Tunnel, Central Artery and CANA capital repairs.
Exhibit 28. Metropolitan Highway System Capital Reinvestment Program Annual Turnpike Program and Enhanced Levels, 2007-2026 (Millions of Dollars)
Capital Reinvestment Program Annual Program Enhanced Capital Total Program
2007 $24.4 $11.5 $35.9 2008 $25.1 $11.8 $37.0 2009 $25.9 $12.2 $38.1 2010 $26.7 $12.6 $39.2 2011 $27.5 $12.9 $40.4 2012 $28.3 $13.3 $41.6 2013 $29.1 $13.7 $42.9 2014 $30.0 $14.1 $44.2 2015 $30.9 $14.6 $45.5 2016 $31.8 $15.0 $46.8 2017 $32.8 $15.5 $48.2 2018 $33.8 $15.9 $49.7 2019 $34.8 $16.4 $51.2 2020 $35.8 $16.9 $52.7 2021 $36.9 $17.4 $54.3 2022 $38.0 $17.9 $55.9 2023 $39.2 $18.5 $57.6 2024 $40.3 $19.0 $59.3 2025 $41.5 $19.6 $61.1 2026 $42.8 $20.2 $63.0 Total $655.7 $309.0 $964.7
Western Turnpike Administration and Retirement Expenses – When the tolls are removed from the Western Turnpike in 2017, administrative costs for the entire agency that had been shared between the two cost centers of the Turnpike will shift totally to the Metropolitan Highway System. For many of the Turnpike’s administrative functions, the costs had been allocated for several years based on the length of each of the two sections. The Western Turnpike comprises 90 percent of the total length of the Turnpike and therefore had paid 90 percent of those shared costs. However, the allocation methodology was modified in 2007 and today the costs are more appropriately allocated between the Western Turnpike and Metropolitan Highway System. Still, there are millions of dollars in pension fund costs, retiree health benefits, and administrative overhead expenses that will need to be absorbed by the Metropolitan Highway System starting in 2018. According to our projections, the Metropolitan Highway System will need to absorb approximately
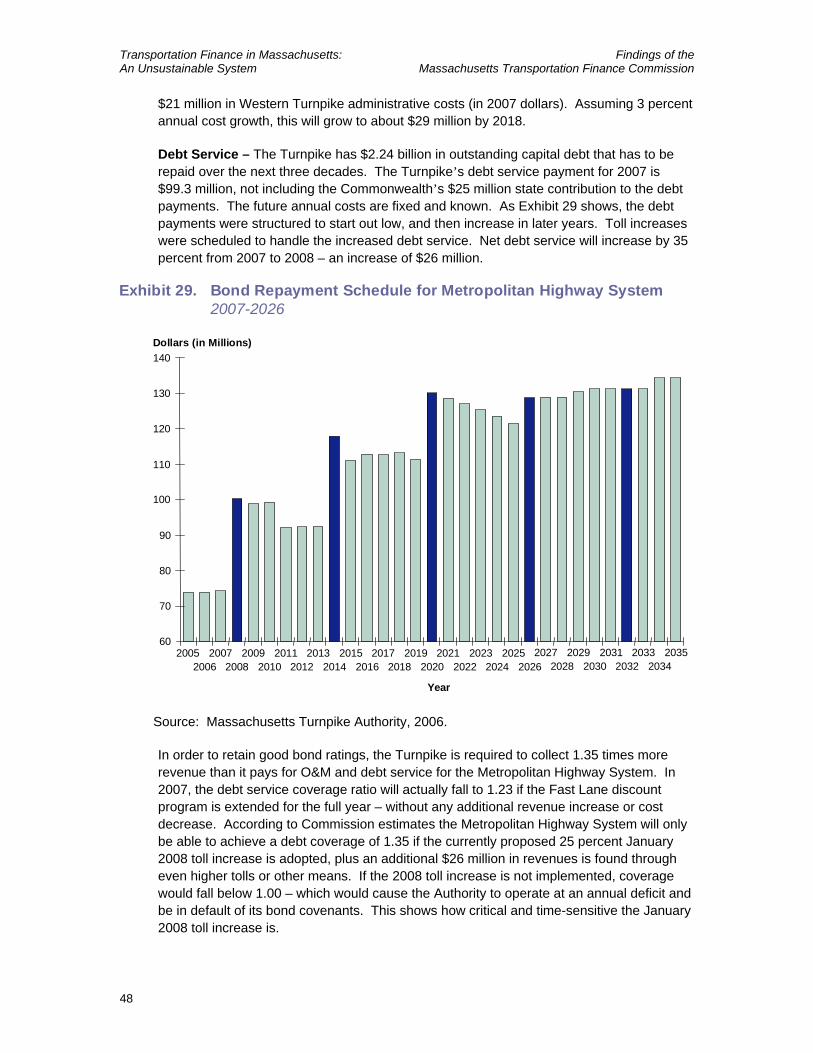
Transportation Finance in Massachusetts: Findings of the An Unsustainable System Massachusetts Transportation Finance Commission
48
$21 million in Western Turnpike administrative costs (in 2007 dollars). Assuming 3 percent annual cost growth, this will grow to about $29 million by 2018.
Debt Service – The Turnpike has $2.24 billion in outstanding capital debt that has to be repaid over the next three decades. The Turnpike’s debt service payment for 2007 is $99.3 million, not including the Commonwealth’s $25 million state contribution to the debt payments. The future annual costs are fixed and known. As Exhibit 29 shows, the debt payments were structured to start out low, and then increase in later years. Toll increases were scheduled to handle the increased debt service. Net debt service will increase by 35 percent from 2007 to 2008 – an increase of $26 million.
Exhibit 29. Bond Repayment Schedule for Metropolitan Highway System2007-2026
60
70
80
90
100
110
120
130
140
20052006
20072008
20092010
20112012
20132014
20152016
20172018
20192020
20212022
20232024
20252026
20272028
20292030
20312032
20332034
2035
Dollars (in Millions)
Year
Source: Massachusetts Turnpike Authority, 2006.
In order to retain good bond ratings, the Turnpike is required to collect 1.35 times more revenue than it pays for O&M and debt service for the Metropolitan Highway System. In 2007, the debt service coverage ratio will actually fall to 1.23 if the Fast Lane discount program is extended for the full year – without any additional revenue increase or cost decrease. According to Commission estimates the Metropolitan Highway System will only be able to achieve a debt coverage of 1.35 if the currently proposed 25 percent January 2008 toll increase is adopted, plus an additional $26 million in revenues is found through even higher tolls or other means. If the 2008 toll increase is not implemented, coverage would fall below 1.00 – which would cause the Authority to operate at an annual deficit and be in default of its bond covenants. This shows how critical and time-sensitive the January 2008 toll increase is.
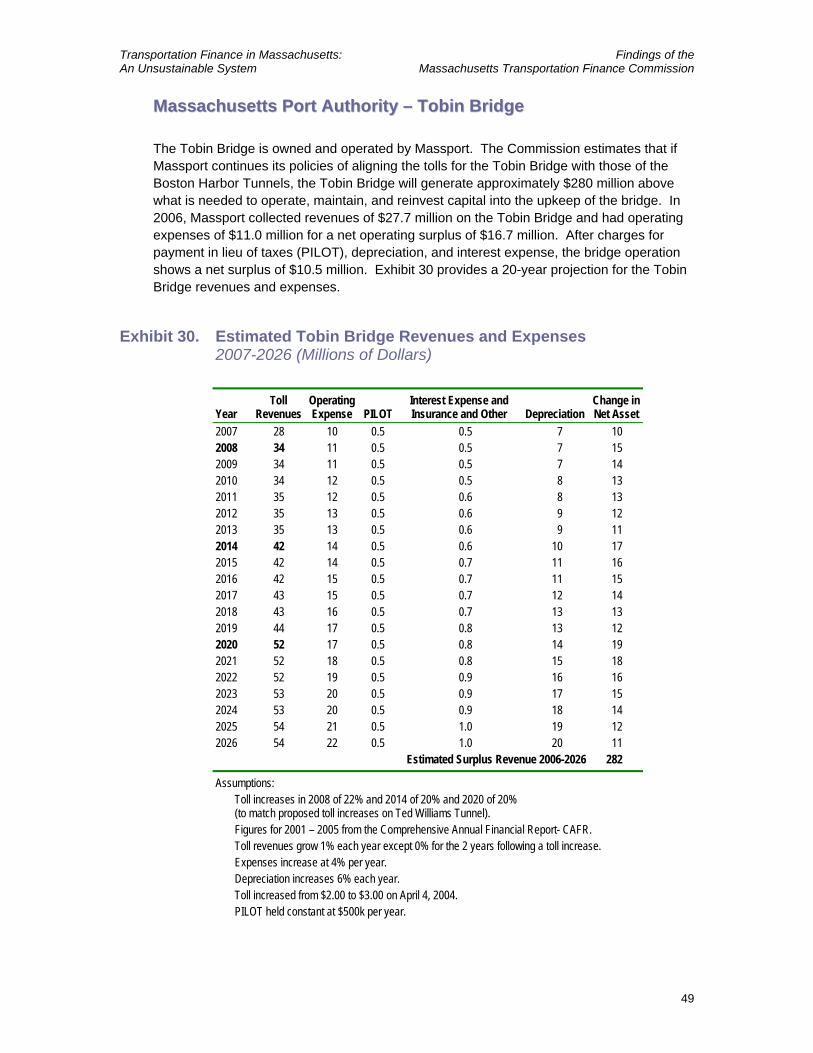
Transportation Finance in Massachusetts: Findings of the An Unsustainable System Massachusetts Transportation Finance Commission
49
MMaassssaacchhuusseettttss PPoorrtt AAuutthhoorriittyy –– TToobbiinn BBrriiddggee
The Tobin Bridge is owned and operated by Massport. The Commission estimates that if Massport continues its policies of aligning the tolls for the Tobin Bridge with those of the Boston Harbor Tunnels, the Tobin Bridge will generate approximately $280 million above what is needed to operate, maintain, and reinvest capital into the upkeep of the bridge. In 2006, Massport collected revenues of $27.7 million on the Tobin Bridge and had operating expenses of $11.0 million for a net operating surplus of $16.7 million. After charges for payment in lieu of taxes (PILOT), depreciation, and interest expense, the bridge operation shows a net surplus of $10.5 million. Exhibit 30 provides a 20-year projection for the Tobin Bridge revenues and expenses.
Exhibit 30. Estimated Tobin Bridge Revenues and Expenses 2007-2026 (Millions of Dollars)
Year Toll
Revenues Operating Expense PILOT
Interest Expense and Insurance and Other Depreciation
Change in Net Asset
2007 28 10 0.5 0.5 7 10 2008 34 11 0.5 0.5 7 15 2009 34 11 0.5 0.5 7 14 2010 34 12 0.5 0.5 8 13 2011 35 12 0.5 0.6 8 13 2012 35 13 0.5 0.6 9 12 2013 35 13 0.5 0.6 9 11 2014 42 14 0.5 0.6 10 17 2015 42 14 0.5 0.7 11 16 2016 42 15 0.5 0.7 11 15 2017 43 15 0.5 0.7 12 14 2018 43 16 0.5 0.7 13 13 2019 44 17 0.5 0.8 13 12 2020 52 17 0.5 0.8 14 19 2021 52 18 0.5 0.8 15 18 2022 52 19 0.5 0.9 16 16 2023 53 20 0.5 0.9 17 15 2024 53 20 0.5 0.9 18 14 2025 54 21 0.5 1.0 19 12 2026 54 22 0.5 1.0 20 11 Estimated Surplus Revenue 2006-2026 282
Assumptions: Toll increases in 2008 of 22% and 2014 of 20% and 2020 of 20% (to match proposed toll increases on Ted Williams Tunnel). Figures for 2001 – 2005 from the Comprehensive Annual Financial Report- CAFR. Toll revenues grow 1% each year except 0% for the 2 years following a toll increase. Expenses increase at 4% per year. Depreciation increases 6% each year. Toll increased from $2.00 to $3.00 on April 4, 2004. PILOT held constant at $500k per year.
Transportation Finance in Massachusetts: Findings of the An Unsustainable System Massachusetts Transportation Finance Commission
50
This income currently is used to help subsidize other Massport operations such as elements of the Seaport. In addition, Massport has been mandated by the legislature to pay for those segments of the Central Artery project that are located on Massport property in East Boston such as the ramps that lead to and from the Ted Williams Tunnel.
TTrraannssiitt
The Massachusetts Bay Transportation Authority (MBTA) and the 15 Regional Transit Authorities (RTA) in Massachusetts carry over 1.2 million riders on an average workday. The MBTA carries over 90 percent of these riders. While the public transit system is heavily capital intensive, transit also costs a lot to operate once the initial capital investment is made. Like all transit properties in the nation, both the RTAs and the MBTA require significant state subsidies for operations. In addition to fares, the RTAs receive state contract assistance as well as local assessments to help pay for their operations. The MBTA also receives local assessments and a portion of the state sales tax.
RReeggiioonnaall TTrraannssiitt AAuutthhoorriittiieess ((RRTTAA))
Due to the complexities in evaluating the operations and capital needs of the 15 separate Regional Transit Authorities, the Commission did not conduct a gap analysis for these agencies. It should be emphasized, however, that these agencies serve a valuable transportation function, and will undoubtedly need additional resources.
MMaassssaacchhuusseettttss BBaayy TTrraannssppoorrttaattiioonn AAuutthhoorriittyy ((MMBBTTAA))
The Finance Commission estimates that the MBTA is facing a likely funding gap of between $4 and $8 billion over the next 20 years to pay for its operating and capital needs. The Commission used ranges in estimating the MBTA’s funding gap because of the many revenue and cost factors at play.
For its analysis, the Commission used 15 years of historical data for MBTA revenues, expenses, and capital spending. To calculate the potential funding gap, the Commission used the MBTA’s budget structure to estimate revenues and then subtracted operating expenses, existing debt service, and debt service for ongoing capital needs. Exhibit 31 shows the simplified version of how the gap was calculated.
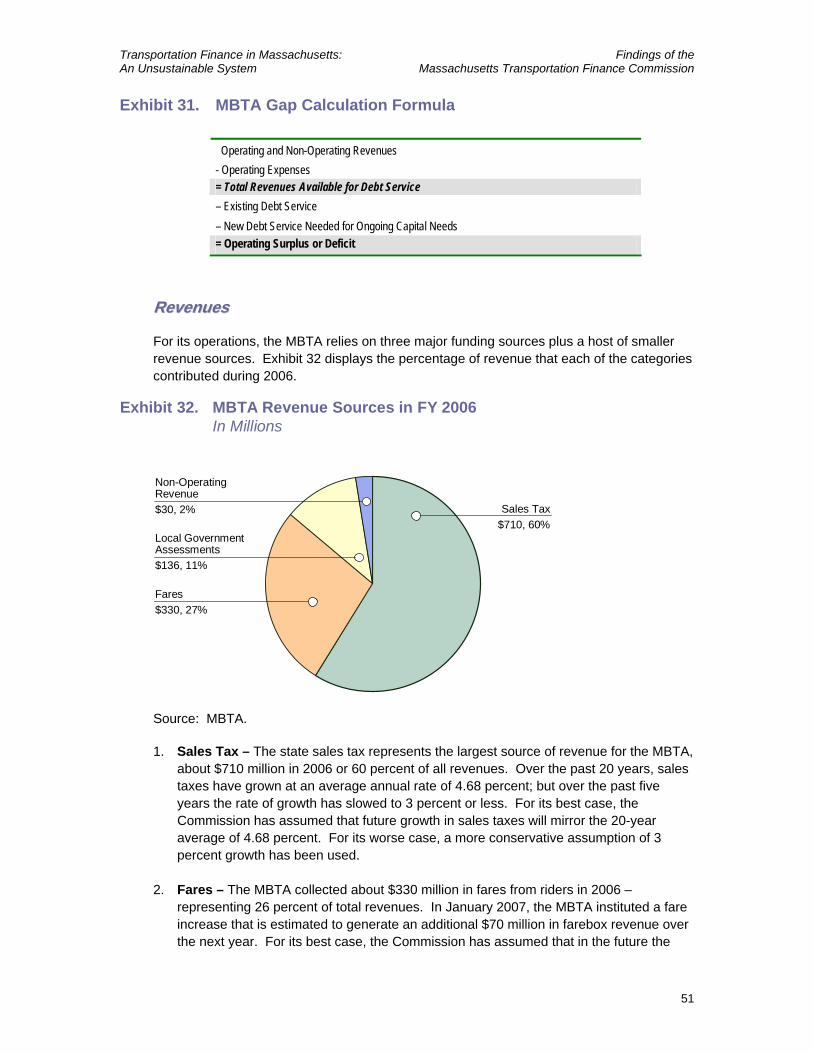
Transportation Finance in Massachusetts: Findings of the An Unsustainable System Massachusetts Transportation Finance Commission
51
Exhibit 31. MBTA Gap Calculation Formula
Operating and Non-Operating Revenues - Operating Expenses = Total Revenues Available for Debt Service – Existing Debt Service – New Debt Service Needed for Ongoing Capital Needs = Operating Surplus or Deficit
RReevveennuueess
For its operations, the MBTA relies on three major funding sources plus a host of smaller revenue sources. Exhibit 32 displays the percentage of revenue that each of the categories contributed during 2006.
Exhibit 32. MBTA Revenue Sources in FY 2006 In Millions
Sales Tax$710, 60%
Fares$330, 27%
Local Government Assessments$136, 11%
Non-Operating Revenue$30, 2%
Source: MBTA.
1. Sales Tax – The state sales tax represents the largest source of revenue for the MBTA, about $710 million in 2006 or 60 percent of all revenues. Over the past 20 years, sales taxes have grown at an average annual rate of 4.68 percent; but over the past five years the rate of growth has slowed to 3 percent or less. For its best case, the Commission has assumed that future growth in sales taxes will mirror the 20-year average of 4.68 percent. For its worse case, a more conservative assumption of 3 percent growth has been used.
2. Fares – The MBTA collected about $330 million in fares from riders in 2006 – representing 26 percent of total revenues. In January 2007, the MBTA instituted a fare increase that is estimated to generate an additional $70 million in farebox revenue over the next year. For its best case, the Commission has assumed that in the future the
Transportation Finance in Massachusetts: Findings of the An Unsustainable System Massachusetts Transportation Finance Commission
52
MBTA will increase fares in line with inflation, an average of a 10 percent increase every 3 years. For its worse case, a more conservative assumption of 5 percent increases every 3 years has been used.
3. Local Government Assessments – The MBTA received $136 million in assessments from its 175 municipal members in 2006, 11 percent of its total operating revenues. The growth in assessments is capped by legislation at 2.5 percent annually. This means that under our analysis the share of revenues from local assessments will decline in the future from about 11 percent in 2006 to about 8 percent in 2026. The Commission has increased the assessments at the 2.5 percent maximum rate in both the best revenue and worse revenue scenarios, because expenses are expected to grow by more than 2.5 percent per year.
4. Non-Operating Revenues – This category includes real estate operations, advertising, and other miscellaneous income. In 2006, the MBTA’s real estate operations contributed about $30 million and advertising about $10 million. While the MBTA has made great strides in increasing its non-operating revenues, these areas comprise only about 5 percent of MBTA revenues. The Commission assumed in both its best and worse revenue scenarios that real estate income will grow at 2.5 percent annually and advertising will increase at 5.5 percent. These rates are consistent with recently signed multiyear contracts by the MBTA.
The assumptions used to estimate future MBTA revenues are summarized in Exhibit 33.
Exhibit 33. MBTA Revenue Growth Assumptions
Revenue Growth Assumptions Revenue Drivers Best Worse
Sales Tax Growth In line with 20-year state average: 4.68% per year
In line with past 5 years: 3% per year
Fare Revenue Fare increases every 3 years of about 10% (in line with 20-year average rate of inflation)
Fare increases every 3 years of 5% (half the rate of inflation)
Local Government Assistance
Consistent with legislative actions: 2.5% per year
Consistent with legislative actions: 2.5% per year
Other Revenue (e.g., real estate and advertising)
Consistent with current conditions: real estate growth at 2.5 percent per year and advertising growth at 5.5 percent per year
Assumptions are the same as the best case scenario because they are based on recently signed contracts
OOppeerraattiinngg EExxppeennsseess
For the MBTA, just like all transit agencies, the major operating costs are wages and fringe benefits for personnel. In addition, the MBTA contracts out a portion of its operations for commuter rail and local services (both paratransit and certain local bus services). The major component of these contracted services are also personnel costs.
1. Wages – Wages made up 37 percent of the MBTA’s operations costs in 2006. For its best case assumption of costs (meaning the least amount of increase), the Commission
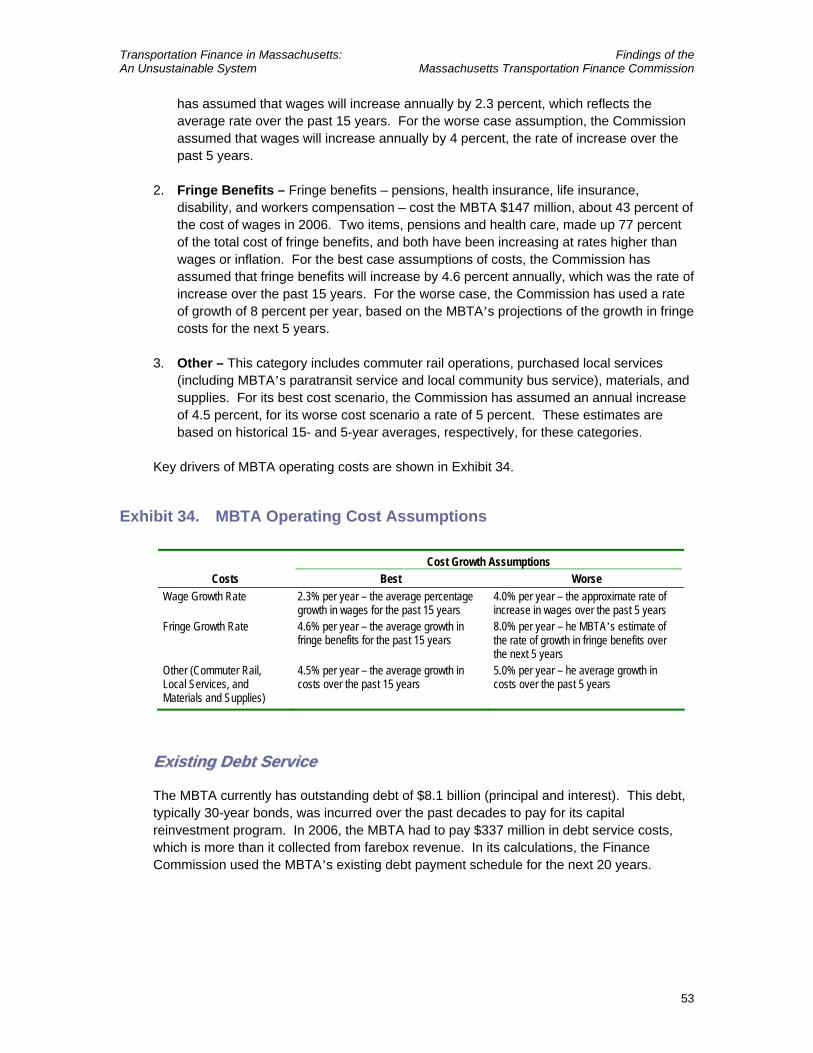
Transportation Finance in Massachusetts: Findings of the An Unsustainable System Massachusetts Transportation Finance Commission
53
has assumed that wages will increase annually by 2.3 percent, which reflects the average rate over the past 15 years. For the worse case assumption, the Commission assumed that wages will increase annually by 4 percent, the rate of increase over the past 5 years.
2. Fringe Benefits – Fringe benefits – pensions, health insurance, life insurance, disability, and workers compensation – cost the MBTA $147 million, about 43 percent of the cost of wages in 2006. Two items, pensions and health care, made up 77 percent of the total cost of fringe benefits, and both have been increasing at rates higher than wages or inflation. For the best case assumptions of costs, the Commission has assumed that fringe benefits will increase by 4.6 percent annually, which was the rate of increase over the past 15 years. For the worse case, the Commission has used a rate of growth of 8 percent per year, based on the MBTA’s projections of the growth in fringe costs for the next 5 years.
3. Other – This category includes commuter rail operations, purchased local services (including MBTA’s paratransit service and local community bus service), materials, and supplies. For its best cost scenario, the Commission has assumed an annual increase of 4.5 percent, for its worse cost scenario a rate of 5 percent. These estimates are based on historical 15- and 5-year averages, respectively, for these categories.
Key drivers of MBTA operating costs are shown in Exhibit 34.
Exhibit 34. MBTA Operating Cost Assumptions
Cost Growth Assumptions Costs Best Worse
Wage Growth Rate 2.3% per year – the average percentage growth in wages for the past 15 years
4.0% per year – the approximate rate of increase in wages over the past 5 years
Fringe Growth Rate 4.6% per year – the average growth in fringe benefits for the past 15 years
8.0% per year – he MBTA’s estimate of the rate of growth in fringe benefits over the next 5 years
Other (Commuter Rail, Local Services, and Materials and Supplies)
4.5% per year – the average growth in costs over the past 15 years
5.0% per year – he average growth in costs over the past 5 years
EExxiissttiinngg DDeebbtt SSeerrvviiccee
The MBTA currently has outstanding debt of $8.1 billion (principal and interest). This debt, typically 30-year bonds, was incurred over the past decades to pay for its capital reinvestment program. In 2006, the MBTA had to pay $337 million in debt service costs, which is more than it collected from farebox revenue. In its calculations, the Finance Commission used the MBTA’s existing debt payment schedule for the next 20 years.
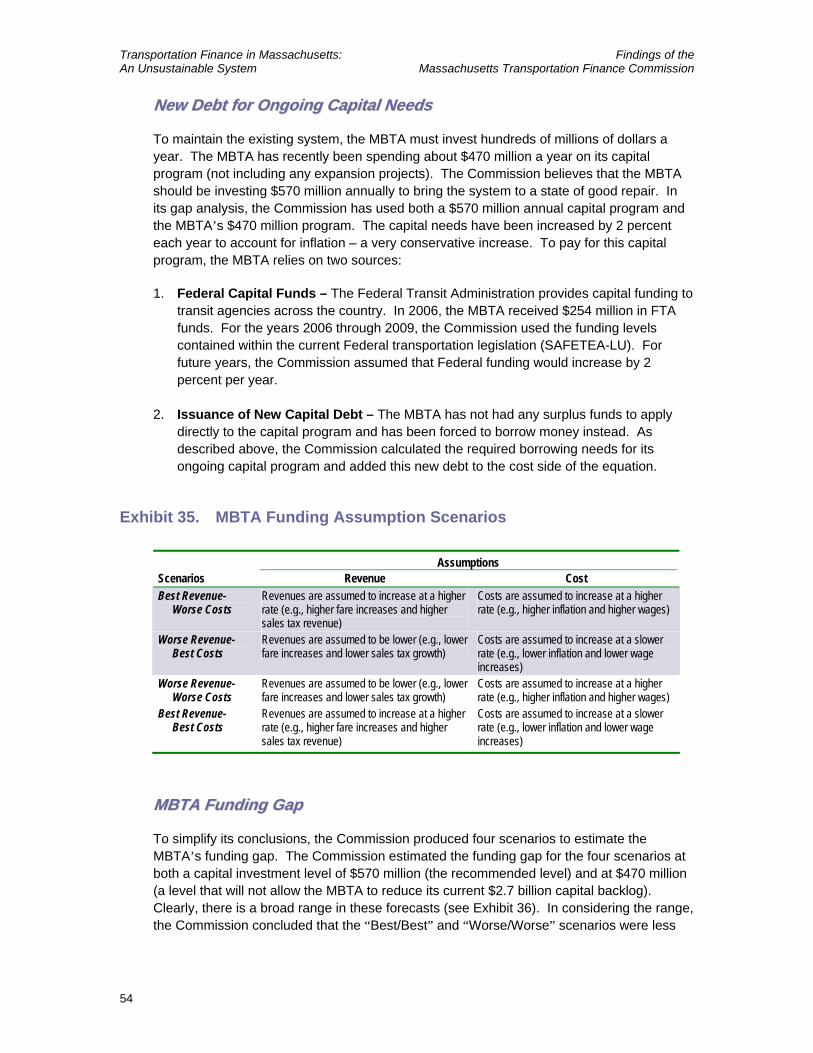
Transportation Finance in Massachusetts: Findings of the An Unsustainable System Massachusetts Transportation Finance Commission
54
NNeeww DDeebbtt ffoorr OOnnggooiinngg CCaappiittaall NNeeeeddss
To maintain the existing system, the MBTA must invest hundreds of millions of dollars a year. The MBTA has recently been spending about $470 million a year on its capital program (not including any expansion projects). The Commission believes that the MBTA should be investing $570 million annually to bring the system to a state of good repair. In its gap analysis, the Commission has used both a $570 million annual capital program and the MBTA’s $470 million program. The capital needs have been increased by 2 percent each year to account for inflation – a very conservative increase. To pay for this capital program, the MBTA relies on two sources:
1. Federal Capital Funds – The Federal Transit Administration provides capital funding to transit agencies across the country. In 2006, the MBTA received $254 million in FTA funds. For the years 2006 through 2009, the Commission used the funding levels contained within the current Federal transportation legislation (SAFETEA-LU). For future years, the Commission assumed that Federal funding would increase by 2 percent per year.
2. Issuance of New Capital Debt – The MBTA has not had any surplus funds to apply directly to the capital program and has been forced to borrow money instead. As described above, the Commission calculated the required borrowing needs for its ongoing capital program and added this new debt to the cost side of the equation.
Exhibit 35. MBTA Funding Assumption Scenarios
Assumptions Scenarios Revenue Cost Best Revenue-
Worse Costs Revenues are assumed to increase at a higher rate (e.g., higher fare increases and higher sales tax revenue)
Costs are assumed to increase at a higher rate (e.g., higher inflation and higher wages)
Worse Revenue- Best Costs
Revenues are assumed to be lower (e.g., lower fare increases and lower sales tax growth)
Costs are assumed to increase at a slower rate (e.g., lower inflation and lower wage increases)
Worse Revenue- Worse Costs
Revenues are assumed to be lower (e.g., lower fare increases and lower sales tax growth)
Costs are assumed to increase at a higher rate (e.g., higher inflation and higher wages)
Best Revenue- Best Costs
Revenues are assumed to increase at a higher rate (e.g., higher fare increases and higher sales tax revenue)
Costs are assumed to increase at a slower rate (e.g., lower inflation and lower wage increases)
MMBBTTAA FFuunnddiinngg GGaapp
To simplify its conclusions, the Commission produced four scenarios to estimate the MBTA’s funding gap. The Commission estimated the funding gap for the four scenarios at both a capital investment level of $570 million (the recommended level) and at $470 million (a level that will not allow the MBTA to reduce its current $2.7 billion capital backlog). Clearly, there is a broad range in these forecasts (see Exhibit 36). In considering the range, the Commission concluded that the “Best/Best” and “Worse/Worse” scenarios were less
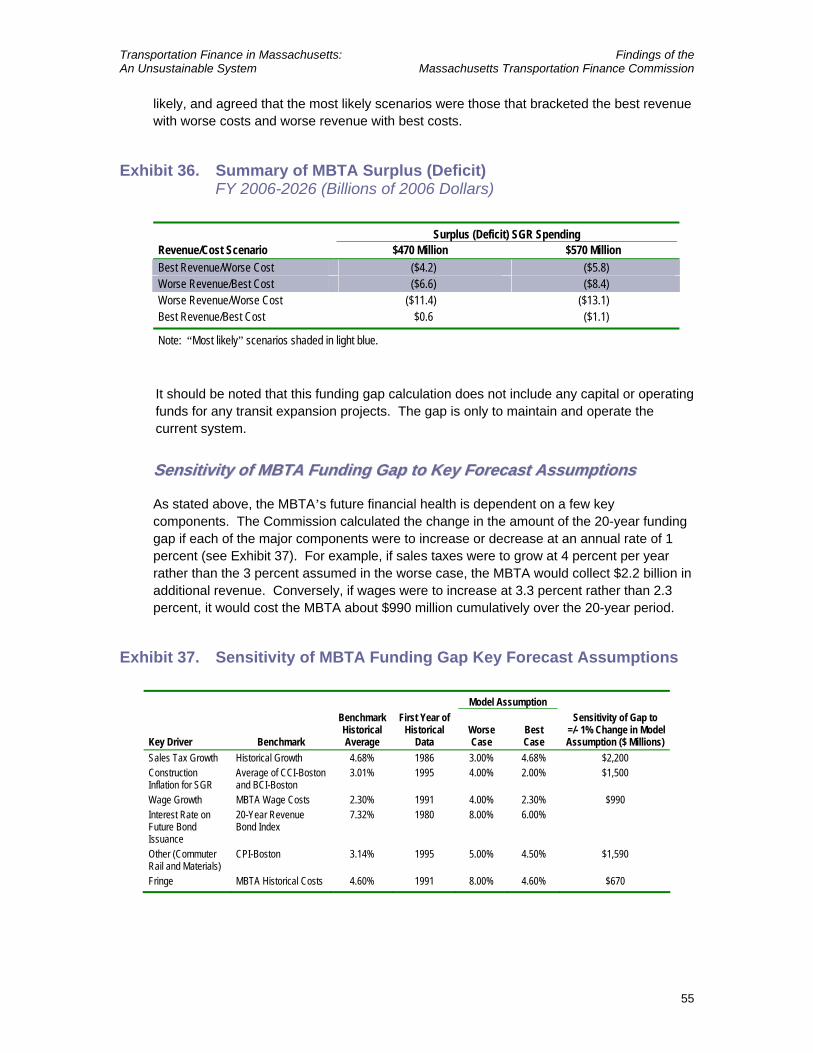
Transportation Finance in Massachusetts: Findings of the An Unsustainable System Massachusetts Transportation Finance Commission
55
likely, and agreed that the most likely scenarios were those that bracketed the best revenue with worse costs and worse revenue with best costs.
Exhibit 36. Summary of MBTA Surplus (Deficit) FY 2006-2026 (Billions of 2006 Dollars)
Surplus (Deficit) SGR Spending Revenue/Cost Scenario $470 Million $570 Million Best Revenue/Worse Cost ($4.2) ($5.8) Worse Revenue/Best Cost ($6.6) ($8.4) Worse Revenue/Worse Cost ($11.4) ($13.1) Best Revenue/Best Cost $0.6 ($1.1)
Note: “Most likely” scenarios shaded in light blue.
It should be noted that this funding gap calculation does not include any capital or operating funds for any transit expansion projects. The gap is only to maintain and operate the current system.
SSeennssiittiivviittyy ooff MMBBTTAA FFuunnddiinngg GGaapp ttoo KKeeyy FFoorreeccaasstt AAssssuummppttiioonnss
As stated above, the MBTA’s future financial health is dependent on a few key components. The Commission calculated the change in the amount of the 20-year funding gap if each of the major components were to increase or decrease at an annual rate of 1 percent (see Exhibit 37). For example, if sales taxes were to grow at 4 percent per year rather than the 3 percent assumed in the worse case, the MBTA would collect $2.2 billion in additional revenue. Conversely, if wages were to increase at 3.3 percent rather than 2.3 percent, it would cost the MBTA about $990 million cumulatively over the 20-year period.
Exhibit 37. Sensitivity of MBTA Funding Gap Key Forecast Assumptions
Model Assumption
Key Driver Benchmark
Benchmark Historical Average
First Year of Historical
Data Worse Case
Best Case
Sensitivity of Gap to =/- 1% Change in Model Assumption ($ Millions)
Sales Tax Growth Historical Growth 4.68% 1986 3.00% 4.68% $2,200 Construction Inflation for SGR
Average of CCI-Boston and BCI-Boston
3.01% 1995 4.00% 2.00% $1,500
Wage Growth MBTA Wage Costs 2.30% 1991 4.00% 2.30% $990 Interest Rate on Future Bond Issuance
20-Year Revenue Bond Index
7.32% 1980 8.00% 6.00%
Other (Commuter Rail and Materials)
CPI-Boston 3.14% 1995 5.00% 4.50% $1,590
Fringe MBTA Historical Costs 4.60% 1991 8.00% 4.60% $670
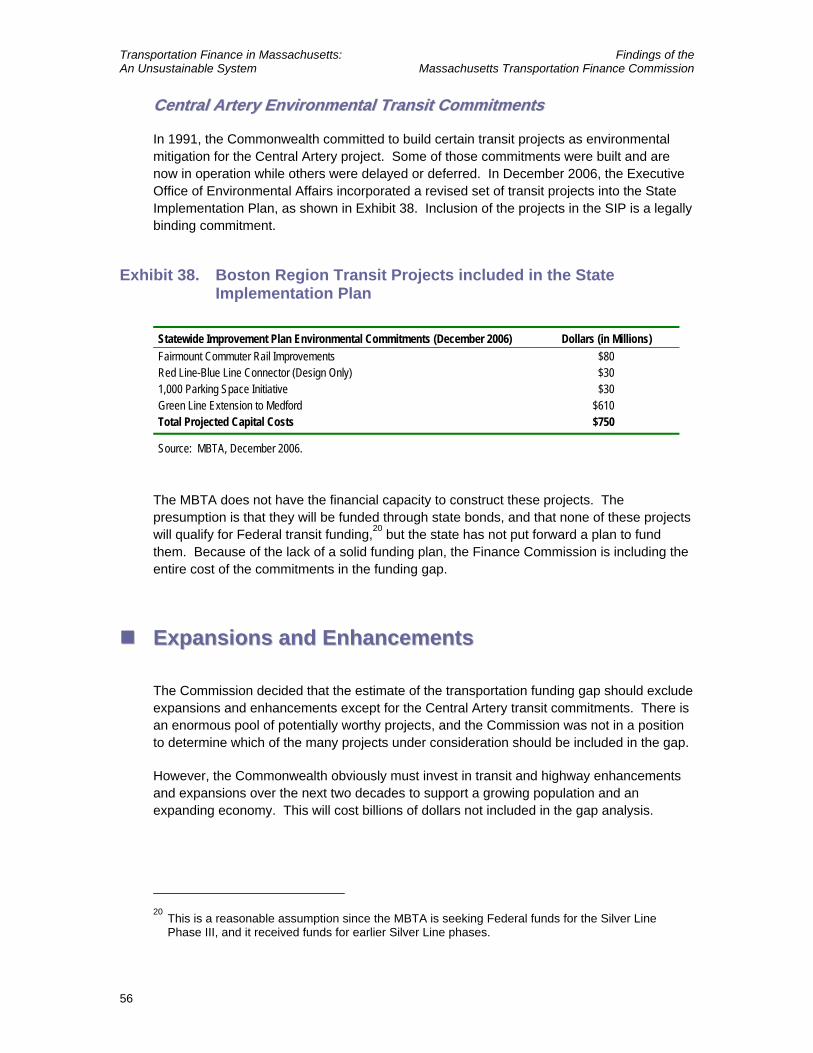
Transportation Finance in Massachusetts: Findings of the An Unsustainable System Massachusetts Transportation Finance Commission
56
CCeennttrraall AArrtteerryy EEnnvviirroonnmmeennttaall TTrraannssiitt CCoommmmiittmmeennttss
In 1991, the Commonwealth committed to build certain transit projects as environmental mitigation for the Central Artery project. Some of those commitments were built and are now in operation while others were delayed or deferred. In December 2006, the Executive Office of Environmental Affairs incorporated a revised set of transit projects into the State Implementation Plan, as shown in Exhibit 38. Inclusion of the projects in the SIP is a legally binding commitment.
Exhibit 38. Boston Region Transit Projects included in the State Implementation Plan
Statewide Improvement Plan Environmental Commitments (December 2006) Dollars (in Millions) Fairmount Commuter Rail Improvements $80 Red Line-Blue Line Connector (Design Only) $30 1,000 Parking Space Initiative $30 Green Line Extension to Medford $610 Total Projected Capital Costs $750
Source: MBTA, December 2006.
The MBTA does not have the financial capacity to construct these projects. The presumption is that they will be funded through state bonds, and that none of these projects will qualify for Federal transit funding,20 but the state has not put forward a plan to fund them. Because of the lack of a solid funding plan, the Finance Commission is including the entire cost of the commitments in the funding gap.
EExxppaannssiioonnss aanndd EEnnhhaanncceemmeennttss
The Commission decided that the estimate of the transportation funding gap should exclude expansions and enhancements except for the Central Artery transit commitments. There is an enormous pool of potentially worthy projects, and the Commission was not in a position to determine which of the many projects under consideration should be included in the gap.
However, the Commonwealth obviously must invest in transit and highway enhancements and expansions over the next two decades to support a growing population and an expanding economy. This will cost billions of dollars not included in the gap analysis.
20
This is a reasonable assumption since the MBTA is seeking Federal funds for the Silver Line Phase III, and it received funds for earlier Silver Line phases.
Transportation Finance in Massachusetts: Findings of the An Unsustainable System Massachusetts Transportation Finance Commission
57
SSuummmmaarryy
Our evaluation found a transportation funding gap in Massachusetts of $15 to $19 billion to bring our existing assets to a state of good repair. These estimates include operating as well as capital needs. These numbers do not include ANY expansions or enhancements.
The need for greater resources to maintain transportation assets is not unique to Massachusetts. Similar studies have been undertaken by Connecticut, New York, New Hampshire, Georgia, Pennsylvania, and Washington. All of these studies revealed severe underinvestment in their assets. This is a national problem, yet all indications are for a declining Federal involvement. We must develop solutions that rely on home-grown resources, leveraging available Federal money wherever possible.
As large as the gap is, the estimates are in fact conservative and should serve as a call to act quickly or the gap will get larger. If neglected, the billions we have spent over the last century on highways and transit systems will literally crumble.
The Commission is using this wake up call to draft specific recommendations to address both the revenue and cost sides of this problem. We invite the citizens of the Commonwealth and its leaders to do the same. The resulting actions will not be easy, but we must make progress to protect our investments, and ensure a more stable and reliable transportation network.

Transportation Finance in Massachusetts: Findings of the An Unsustainable System Massachusetts Transportation Finance Commission
59
AAcckknnoowwlleeddggmmeennttss
The Massachusetts Transportation Finance Commission wishes to acknowledge the hard work and dedication of several talented individuals who were instrumental in preparing this report. First, we want to recognize Terry Regan. Terry has steadfastly served the Commission over many months in our relentless push to obtain the most accurate information available. His knowledge and understanding of these numbers is unparalleled and we could not have produced this report without his tireless efforts. Second, we wish to acknowledge Jeff Buxbaum and his team of professionals at Cambridge Systematics, especially Dan Beagan, Marc Cutler, and Iris Ortiz. Jeff entered this process at a critical juncture and provided invaluable service in helping us to articulate the complexities of the transportation system.
Finally, we wish to recognize and thank all of the transportation professionals of the various agencies and authorities who took the time to make presentations and provide us with information. Each of the agencies was generous with its time and staff in helping us to wade through and understand both their missions and their financing. MHD Commissioner Luisa Paiewonsky was especially helpful in her earlier role at EOT in getting the Commission off the ground. Ken Miller at EOT provided continued assistance throughout the project. Adriel Edwards of EOT has dedicated innumerable hours to the work of the Commission. She was helpful in a variety of ways from carrying out administrative details to obtaining and interpreting information. EOT staffer Todd Fontanella was very helpful, most notably, by creating the meeting minutes of our many sessions. We are grateful to each of these individuals.


AAppppeennddiixx AA

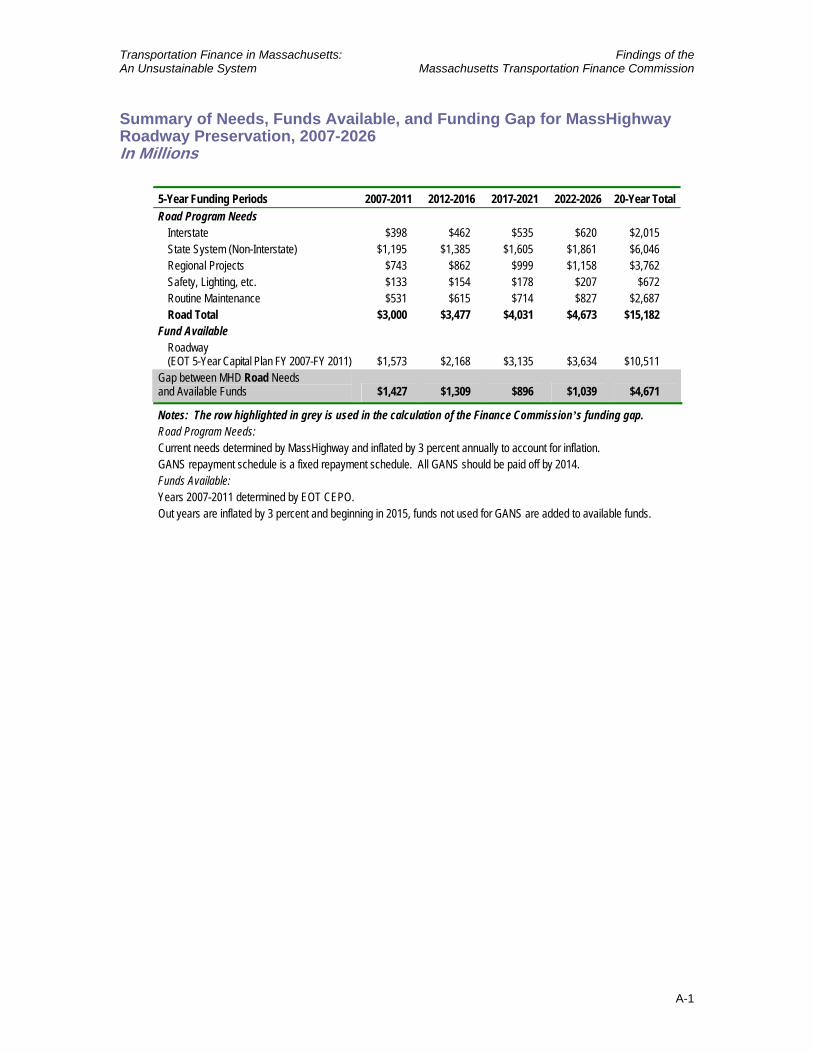
Transportation Finance in Massachusetts: Findings of the An Unsustainable System Massachusetts Transportation Finance Commission
A-1
Summary of Needs, Funds Available, and Funding Gap for MassHighway Roadway Preservation, 2007-2026 In Millions
5-Year Funding Periods 2007-2011 2012-2016 2017-2021 2022-2026 20-Year Total Road Program Needs
Interstate $398 $462 $535 $620 $2,015 State System (Non-Interstate) $1,195 $1,385 $1,605 $1,861 $6,046 Regional Projects $743 $862 $999 $1,158 $3,762 Safety, Lighting, etc. $133 $154 $178 $207 $672 Routine Maintenance $531 $615 $714 $827 $2,687 Road Total $3,000 $3,477 $4,031 $4,673 $15,182
Fund Available Roadway (EOT 5-Year Capital Plan FY 2007-FY 2011) $1,573 $2,168 $3,135 $3,634 $10,511
Gap between MHD Road Needs and Available Funds $1,427 $1,309 $896 $1,039 $4,671
Notes: The row highlighted in grey is used in the calculation of the Finance Commission’s funding gap. Road Program Needs: Current needs determined by MassHighway and inflated by 3 percent annually to account for inflation. GANS repayment schedule is a fixed repayment schedule. All GANS should be paid off by 2014. Funds Available: Years 2007-2011 determined by EOT CEPO. Out years are inflated by 3 percent and beginning in 2015, funds not used for GANS are added to available funds.


AAppppeennddiixx BB

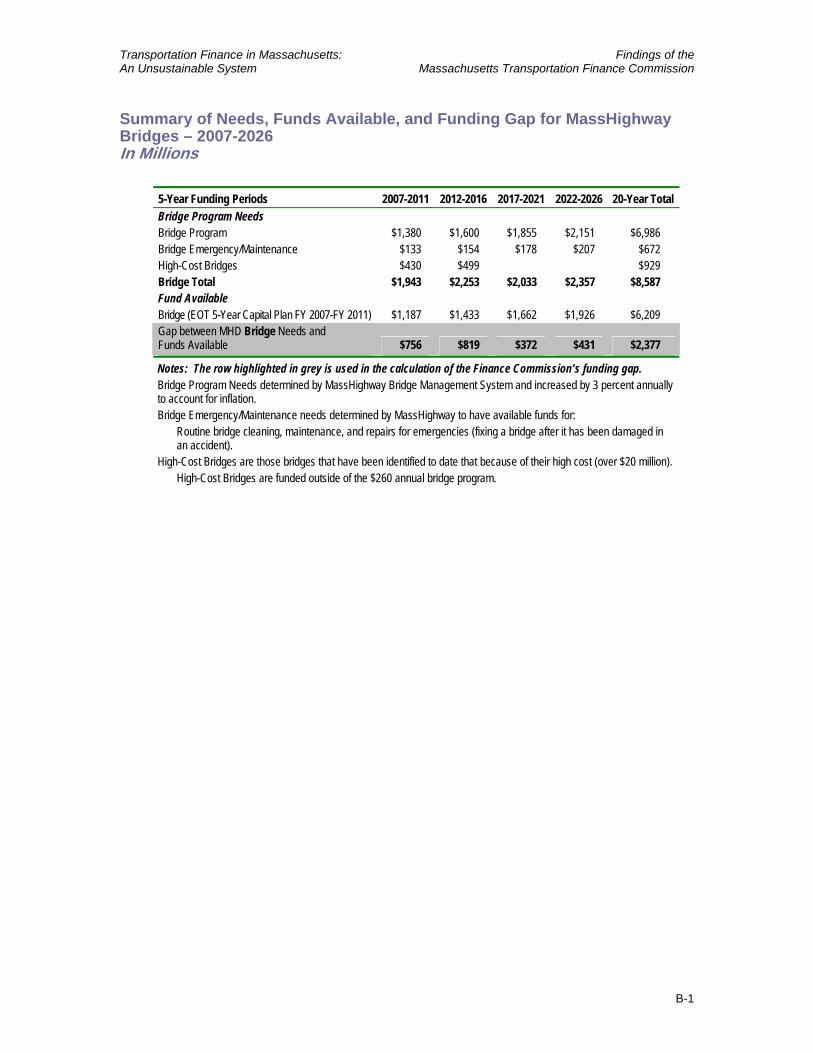
Transportation Finance in Massachusetts: Findings of the An Unsustainable System Massachusetts Transportation Finance Commission
B-1
Summary of Needs, Funds Available, and Funding Gap for MassHighway Bridges – 2007-2026 In Millions
5-Year Funding Periods 2007-2011 2012-2016 2017-2021 2022-2026 20-Year Total Bridge Program Needs Bridge Program $1,380 $1,600 $1,855 $2,151 $6,986 Bridge Emergency/Maintenance $133 $154 $178 $207 $672 High-Cost Bridges $430 $499 $929 Bridge Total $1,943 $2,253 $2,033 $2,357 $8,587 Fund Available Bridge (EOT 5-Year Capital Plan FY 2007-FY 2011) $1,187 $1,433 $1,662 $1,926 $6,209 Gap between MHD Bridge Needs and Funds Available $756 $819 $372 $431 $2,377
Notes: The row highlighted in grey is used in the calculation of the Finance Commission’s funding gap. Bridge Program Needs determined by MassHighway Bridge Management System and increased by 3 percent annually to account for inflation. Bridge Emergency/Maintenance needs determined by MassHighway to have available funds for:
Routine bridge cleaning, maintenance, and repairs for emergencies (fixing a bridge after it has been damaged in an accident).
High-Cost Bridges are those bridges that have been identified to date that because of their high cost (over $20 million). High-Cost Bridges are funded outside of the $260 annual bridge program.


AAppppeennddiixx CC

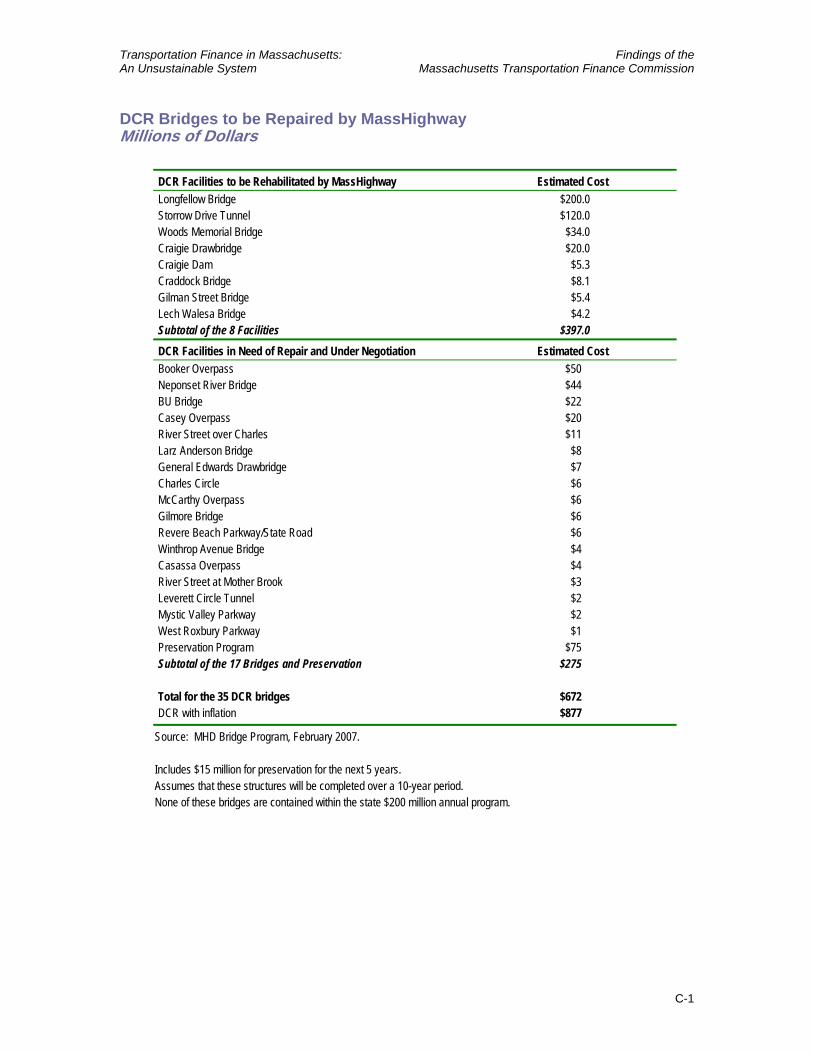
Transportation Finance in Massachusetts: Findings of the An Unsustainable System Massachusetts Transportation Finance Commission
C-1
DCR Bridges to be Repaired by MassHighway Millions of Dollars
DCR Facilities to be Rehabilitated by MassHighway Estimated Cost Longfellow Bridge $200.0 Storrow Drive Tunnel $120.0 Woods Memorial Bridge $34.0 Craigie Drawbridge $20.0 Craigie Dam $5.3 Craddock Bridge $8.1 Gilman Street Bridge $5.4 Lech Walesa Bridge $4.2 Subtotal of the 8 Facilities $397.0 DCR Facilities in Need of Repair and Under Negotiation Estimated Cost Booker Overpass $50 Neponset River Bridge $44 BU Bridge $22 Casey Overpass $20 River Street over Charles $11 Larz Anderson Bridge $8 General Edwards Drawbridge $7 Charles Circle $6 McCarthy Overpass $6 Gilmore Bridge $6 Revere Beach Parkway/State Road $6 Winthrop Avenue Bridge $4 Casassa Overpass $4 River Street at Mother Brook $3 Leverett Circle Tunnel $2 Mystic Valley Parkway $2 West Roxbury Parkway $1 Preservation Program $75 Subtotal of the 17 Bridges and Preservation $275
Total for the 35 DCR bridges $672 DCR with inflation $877
Source: MHD Bridge Program, February 2007. Includes $15 million for preservation for the next 5 years. Assumes that these structures will be completed over a 10-year period. None of these bridges are contained within the state $200 million annual program.