Embed Size (px)
Citation preview
©Acharya SR 2011, Institute for Transport Policy Studies, Tokyo 1
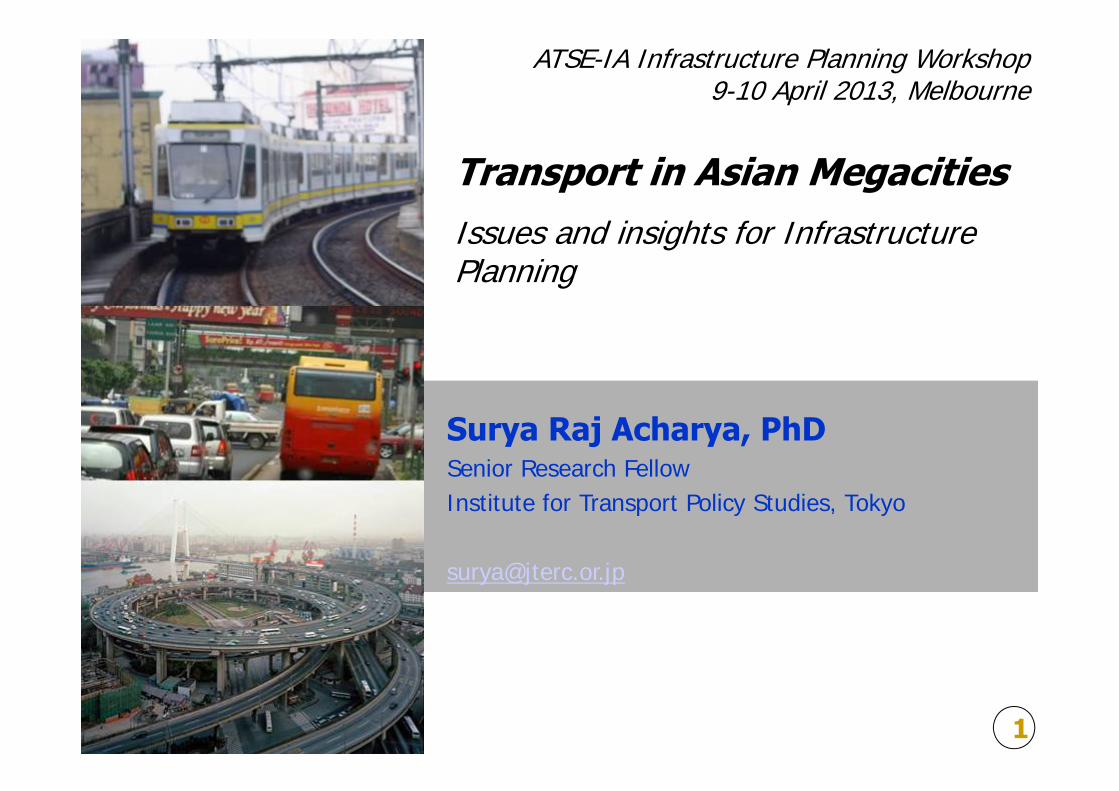
Transport in Asian MegacitiesIssues and insights for Infrastructure Planning
Surya Raj Acharya, PhDSenior Research FellowInstitute for Transport Policy Studies, Tokyo
ATSE-IA Infrastructure Planning Workshop9-10 April 2013, Melbourne

©Acharya SR 2011, Institute for Transport Policy Studies, Tokyo 2
Released on 31 July 2012

Contents
• Overview of transport in Asian megacities• Issues and insights for infrastructure planning
©Acharya SR 2012, Institute for Transport Policy Studies, Tokyo 3

©Acharya SR 2011, Institute for Transport Policy Studies, Tokyo 4
Population
2 mil5 mil
10 mil
Legend
Metropolitan Areas with Population >5 mil
Out of 55, 29 cities from Asia (2010)
1. Background: Why focus on megacity transport?
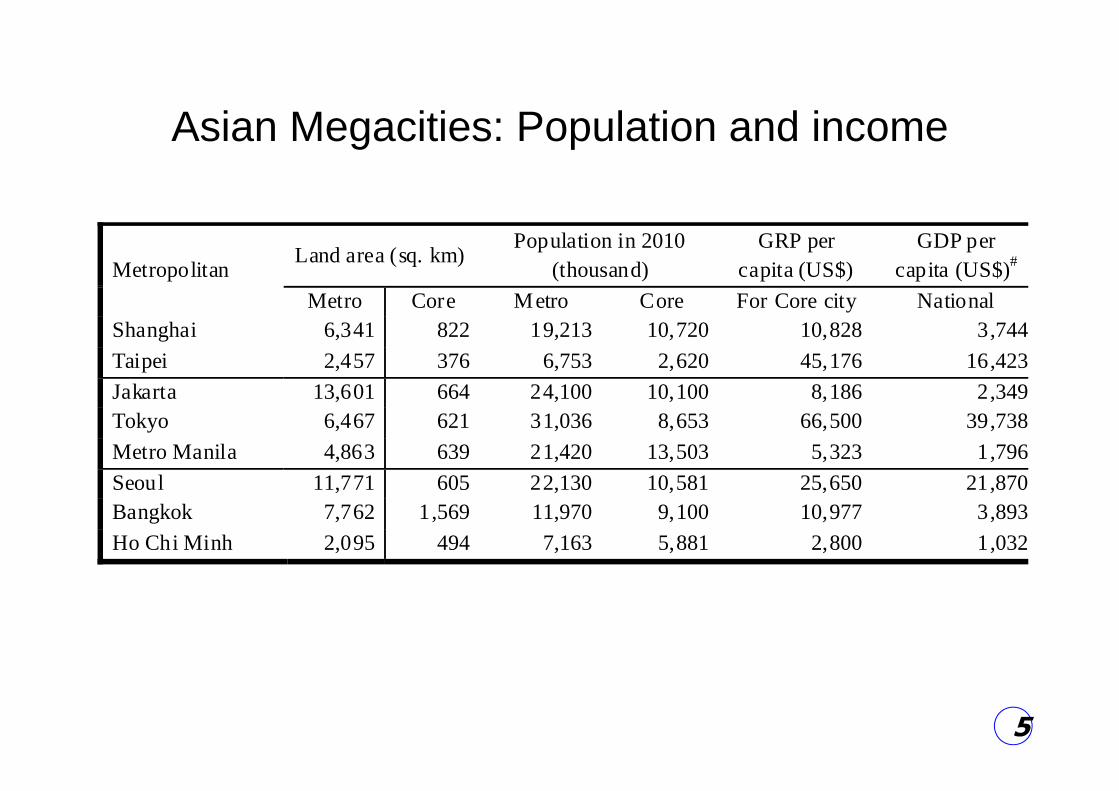
Asian Megacities: Population and income
5
Metropolitan Land area (sq. km)
Population in 2010 (thousand)
GRP per capita (US$)
GDP per capita (US$)#
Metro Core Metro Core For Core city National Shanghai 6,341 822 19,213 10,720 10,828 3,744Taipei 2,457 376 6,753 2,620 45,176 16,423Jakarta 13,601 664 24,100 10,100 8,186 2,349Tokyo 6,467 621 31,036 8,653 66,500 39,738Metro Manila 4,863 639 21,420 13,503 5,323 1,796Seoul 11,771 605 22,130 10,581 25,650 21,870Bangkok 7,762 1,569 11,970 9,100 10,977 3,893Ho Chi Minh 2,095 494 7,163 5,881 2,800 1,032

©Acharya SR 2011, Institute for Transport Policy Studies, Tokyo 6
Context of Asian Megacities
• Rapid growth of city population
Data source: New York City: United States Census Bureau (June 1998); Greater London: McCann (2006); Tokyo: Statistics Bureau (2007), Tokyo Metropolitan government (2007); rest of the cities United Nation (2005); some of the figures are estimated based on the figures from the sources.
Years taken to increase city population from 2 to 8 millions

©Acharya SR 2011, Institute for Transport Policy Studies, Tokyo 7
Road Space ratio in Selected Cities
• In adequate road• Inefficient road hierarchyAsian Megacities
City/AreaData year
Cityarea, Km2
Road area
Km2 % of city area
City of London 2005 3.2 0.8 25.0Inner London 2005 310 56.6 18.3Greater London 2005 1595 196.0 12.3New York City 2010 789 165.9 21.0Inner New York 2010 59 15.2 25.7City of Paris 1999 105 27.0 25.7Tokyo 23 ku 2010 622 101.2 16.3Inner Tokyo, 5 ku 2010 75 16.2 21.6Seoul City 2009 605 82.3 13.6Taipei City 2007 272 20.9 7.7Inner Shanghai 2008 108 13.0 12.0Jakarta City 2007 656 48.0 7.3Inner Bangkok 2006 225 16.0 7.1Data source: compile for STREAM Study from official data on land use or other publication

8
Trip Patterns: Tokyo and Jakarta
Source: JICA (2004)
Huge flow of passengers from suburban to city core
5 10 20 万トリップ

9Peak Hour Problems in Tokyo Urban Railway System
120
140
160
180
200
220
75 80 85 90 93 96 97 98 99 '00'01'02 '03'04
Cro
wde
dnes
s ra
tio
100
110
120
130
140
150
160
170
Cap
acity
and
Dem
and
Inde
x (1
975=
100)Crowdedness
ratio
100
110
120
130
140
150
160
170
100
120
140
160
180
200
220
75 80 85 90 93 96 97 98 99 '00 '01 '02 '03 '04 '05 '06 '07 '08 '09 '10
Cap
acity
and
Dem
and
Inde
x (1
975=
100)
Con
gest
ion
Rat
io
Congestion Ratio
Demand Index
Capacity Index
Congestion Ratio and riding condition
250 %200 %180 %150 %100 %
• Crowded trains
• Crowded terminal stations
• Congested tracks
Data source: MLIT/ITPS, Railway in number

Trips by hours of departure and travel mode, London and Tokyo
10
0200400600800
1,0001,2001,4001,6001,8002,000
1 3 5 7 9 11 13 15 17 19 21 23
Journey stages, thousands
Hour of departure
RailBus
Car
Others
0
1,000
2,000
3,000
4,000
5,000
6,000
7,000
1 3 5 7 9 11 13 15 17 19 21 23
Trips, thousands
Hour of departure
RailBusCar
Others
London 2006 Tokyo 2008
• In megacities, heavy concentration of trips into peak hours• Importance of transit system with high capacity with
significant degree of “elasticity”

11
• Terminal stations were connected by a circular line
• Suburban lines have direct operation through subway lines
• High speed intercity train terminal at the city center
Evolved into a hierarchical urban railway network
5 km
Railway network in Tokyo

Capacity problem of BRT in big cities
12
Passengers waiting for boarding (BRT, Jakarta)
• Bus capacity is lower • Elasticity of capacity for
train is higher (crush load could go up to 250 % of design capacity)
• Bus has lower elastic capacity (150%?)
• Not all waiting passenger can board the bus
• In Jakarta, the waiting time is as high as 20 minutes during rush hour

©Acharya SR 2011, Institute for Transport Policy Studies, Tokyo 13$2,500 car…impact sustainability??
TATA nano ($ 2,500-Indian car)Alternative to “family motorcycle” in Asia? Bypassing public transport?

©Acharya SR 2011, Institute for Transport Policy Studies, Tokyo 14
Why public Transport is important in Asian megacities?
• To serve large scale demand• Accessible and Efficient (Economically efficient)• Clean and healthy (Environmentally sound)• Safe, Affordable, Inclusive (Socially acceptable)

Modal share in selected developed metropolitan areas (trip based)
0% 20% 40% 60% 80% 100%
Tokyo MA (2008)
New York MA (2001)
London MA (2006)
Paris MA (2008)
Modal share
Car Bus Rail Bicycle Walk Others
0% 25% 50% 75% 100%
Tokyo MA (2008)
New York MA (2001)
London MA (2006)
Paris MA (2008)
Modal share
Private Public
0% 20% 40% 60% 80% 100%
Tokyo MA (2008)
New York MA (2001)
London MA (2006)
Paris MA (2008)
Modal share
Car Bus Rail Bicycle Walk Others
0% 25% 50% 75% 100%
Tokyo MA (2008)
New York MA (2001)
London MA (2006)
Paris MA (2008)
Modal share
Private Public
All purpose- all modes All purpose- motorized modes only
Commuting- all modes Commuting- motorized modes only
Data source: person trip survey from respective public agencies; Metropolitan Area definition‐ New York (10 counties of NY State), Paris (Ile‐de‐France), London (Greater London), Tokyo (Tokyo and 3 surrounding pref) Data year is indicated in the parenthesis after the name of each MA; For Paris, Rail also includes Bus

©Acharya SR 2011, Institute for Transport Policy Studies, Tokyo 16
0% 20% 40% 60% 80% 100%
HCMC
M. Manila
Jakarta
Bangkok
Shanghai
Seoul
Tokyo
Taipei
Asian megacities: Modal split (1998~2004)
Developing cities:Bus & Para-transit main modes for Public Trans.
出所: Compilation by STREAM Study (2006)
Car Motorcycle Bus Rail Others
Others(Jeepney)
Motorcycle
BusCar
Car Motorcycle Bus

Operating indicators for selected metro (subway etc) system
17
System/Agency
Rou
te-K
m
Ave
rage
dai
ly m
etro
ra
il pa
ssen
gers
per
ro
ute-
km
aver
age
rail
car
occu
panc
y (p
erso
ns p
er
rail
car)
2
Tota
l ope
ratin
g re
venu
e (m
illio
n U
S $)
3
Rat
io o
f ope
ratin
g re
venu
e an
d op
erat
ing
expe
nses
4
Fare
box
ratio
5
Dep
reci
atio
n an
d am
ortiz
atio
n (%
of
tota
l ope
ratin
g ex
pens
e)
Ave
rage
fare
reve
nue
per p
asse
nger
(US
$)
New York Subway6 337 12,844 28 2,246 0.58 0.58 15.1 1.42London Underground 402 7,544 2,999 0.95 0.86 12.2 2.45Paris Metro (RATP)7 214 18,935 36 3,117 0.60 0.52 14.1 1.03Tokyo Metro (Tokyo) 195 32,346 66 3,736 1.29 1.15 28.3 1.45Toei Subway (Tokyo) 109 21,331 36 1,484 1.15 1.08 37.6 1.63Seoul Metro (Seoul) 135 29,963 793 0.81 0.69 15.4 0.46SMRT Corp (Seoul) 152 11,007 455 0.71 0.62 25.5 0.65MTR Corp. (Hong Kong)8 218 16,321 60 2,082 1.80 1.39 14.4 1.23SMRT Singapore9 99 14,910 70 353 1.37 1.37 18.3 0.66TRT Corporation (Taipei) 101 13,739 399 1.01 0.88 4.2 0.69Sky Train (BTS, Bangkok) 26 15,300 122 1.43 1.29 35.9 0.76Bangkok Subway (BMPCL) 20 9,094 55 0.90 0.78 15.5 0.73Delhi Metro 161 8,789 220 0.95 0.88 54.0 0.40Santiago Metro 103 16,510 419 1.12 0.95 32.2 0.57
Data source: Annual report of respective agencies. Operating expenses includes all operating costs including depreciation.
Maintaining high ridership is important for sustainable operation of metro system

Asian megacities- overview• Large scale travel demand in megacities• Developed Asian megacities- Tokyo, Seoul, Hong Kong, Shanghai- Extensive
mass rapid transit (MRT) system • Due to higher ridership, profitable operation• Transit oriented development and value-capture• Developing megacities- heterogeneous demand simultaneous need
of various infrastructure resource constraint– Inefficient use of tax revenue, 2011 fuel subsidy in Indonesia c. 14 bil. US$
• Some cities are building MRT system- others looking for low-cost options such as BRT
• Notion of Low fare = Good fare!- public subsidy for operation rather than for capital investment
• Being late comers, advantage of – Knowing most facts about what works and what not– Using all technological options – Developing integrated transport system possible
18

©Acharya SR 2011, Institute for Transport Policy Studies, Tokyo 19
Car use
Congestion
Car ownership
Income Level
--
+
+
+
• Toll/pricing• Fuel tax• Vehicle tax• Parking fee -
-
Land-use control
+
Rail Transit
+
+
• Road building• Traffic system
-
• Bus lane• Subsidy
+
++
+
5 +++2
Public Transport Ridership
-
Service quality of public transport
-
-
1
++4
Urban Density
-
+
װ -++3
Issues and insight: Urban Transport Dynamics
Vehicle Emission
•Accessibility &
efficiency•
Social welfare &
equity
-
+
+
+
+
+
Emission technology
-
Source: Morichi and Acharya (2013)

Issues and insights for infrastructure planning
• Transport performance is determined interaction of urban-transport subsystem- important to understand the dynamics
20
Land-use• Structure• Institutions
Policy measures
Policy measures Policy measures
Transport• Structure• Institutions
Behavior• Needs• Attitudes
Transport Performance
Source: Morichi and Acharya (2013)

Typology of institutional approach for urban transport in developing Asia
©Acharya SR 2012, Institute for Transport Policy Studies, Tokyo 21Source: Morichi and Acharya (2013)

©Acharya SR 2011, Institute for Transport Policy Studies, Tokyo 22
Transit oriented development and value capture
Before development
After development
Railway and large scale high quality residential development (green field project)
• Value-capture (real estate development)
• Long-run profitability- TOD
• Land-use change led by railway investment

©Acharya SR 2011, Institute for Transport Policy Studies, Tokyo 23
Timing Indicator
Desirable path
Do-nothing-path
Feasible
Publ
ic T
rans
port
mod
e sh
are
Difficult
Unfeasible
AppropriateEarly Late
Feasible
Public transport mode share and timing of MRT investment
Choice of appropriate timing indicator
• GDP/capita
• Car-ownership rate
• Size of urbanized area
• Migration, demographic factors
Appropriate timing of policy measures- Example
Source: Morichi and Acharya (2013)

©Acharya SR 2011, Institute for Transport Policy Studies, Tokyo 24
0
20
40
60
80
1985 1990 1995 2000 2005年
MR
T R
oute
, Km
0
1
2
3
Rid
ersh
ip:
mill
pas
s/da
y
0
2
4
6
8
10
1925 1950 1975 2000年
Tran
sit
inve
stm
ent
(bil
2002
US$
)
0
5
10
15
20
25
Ride
rshi
p, b
il pa
ss/y
ear
Timing of transit investment and ridership trend: Examples
US:Late investment
only marginal gain in ridership
Taipei:Investment not too late Ridership regained
Taipei
Transit Investment
Ridership
US cities
Ridership
MRT Route, Km

Access/egress distance for High Speed Rail station and competition against car and air
©Acharya SR 2011, Institute for Transport Policy Studies, Tokyo 25
100
150
200
250
300
350
180 210 240 270 300 330 360
Critical distacne for com
petitive niche, Km
Average speed of railway, km/h
120 min
80 min
100 min
60 min
Car versus Rail
Access + Egress time for railway
200
400
600
800
1000
1200
1400
180 210 240 270 300 330 360Critical distacne for com
petitive niche, Km
Average speed of railway, km/h
120 min
80 min
100 min
60 min
Rail versus Air Access + Egress time for railway
Source: Surya and Morichi (2013)
Source: Morichi and Acharya (2013)

How to achieve higher modal split for public transit? Importance of integration and coordination
Integrated transport development • Make public transport more attractive- “pull”
– Higher service quality (urban rail, improved bus)• Make car use “less” attractive
– Impose real cost of driving (fuel tax, tolls, parking fees)• Tokyo, Singapore
– Road traffic congestion (self-regulation by system)• Developing megacities
Importance of public transport load-factorRisk of uncoordinated transport development
– Adequate roads/railways infrastructure– Lower cost of car use- traffic congestion– Lower transit ridership- operating subsidy
©Acharya SR 2012, Institute for Transport Policy Studies, Tokyo 26

Unfair cost advantage for car use
©Acharya SR 2011, Institute for Transport Policy Studies, Tokyo 27
1. Driving cost for a medium size car1.1 Operating cost (cents per miles)
Gasoline and Oil 10.5Maintenance 4.5Tires 0.9Operating cost (cents per miles) 15.9
1.2 Ownership cost @ 15000 miles per year ($ per year)Insurance 957 License, Registration, Taxes 572 Depreciation 3,401 Finance charge 786 Ownership cost per year 5,716
Total cost per mile, $ 0.54Operating cost per mile, $ 0.16
2. Cost of travel by public transit in New York City(1) Heavy Rail
Passenger miles (millions) 9,972,779 Operating expenses (mil $) 3,313,127 Average operating cost per pass-mile ($) 0.33
Funding of operationTotal fare revenue (mil $) 2,245,620 Average fare per passenger mile, $ 0.23Fare revenue as % of operating cost 67.8 %Public subsidies as % of operating cost 32.2 %
(2) Bus Passenger miles (millions) 1,838,396 Operating expenses (mil $) 2,289,448 Average operating cost per mile ($) 1.25
Funding of operationTotal fare revenue (mil $) 821,111 Average fare per passenger mile, $ 0.45Fare revenue as % of operating cost 35.9 % Public subsidies as % of operating cost 64.1 %
• Ownership bias• Indirect subsidies• (road investment and
maintenance , free parking)
• External costs (pollution, CO2, accident)
Travel cost in New York City, 2009
More tax on usages than on ownership !
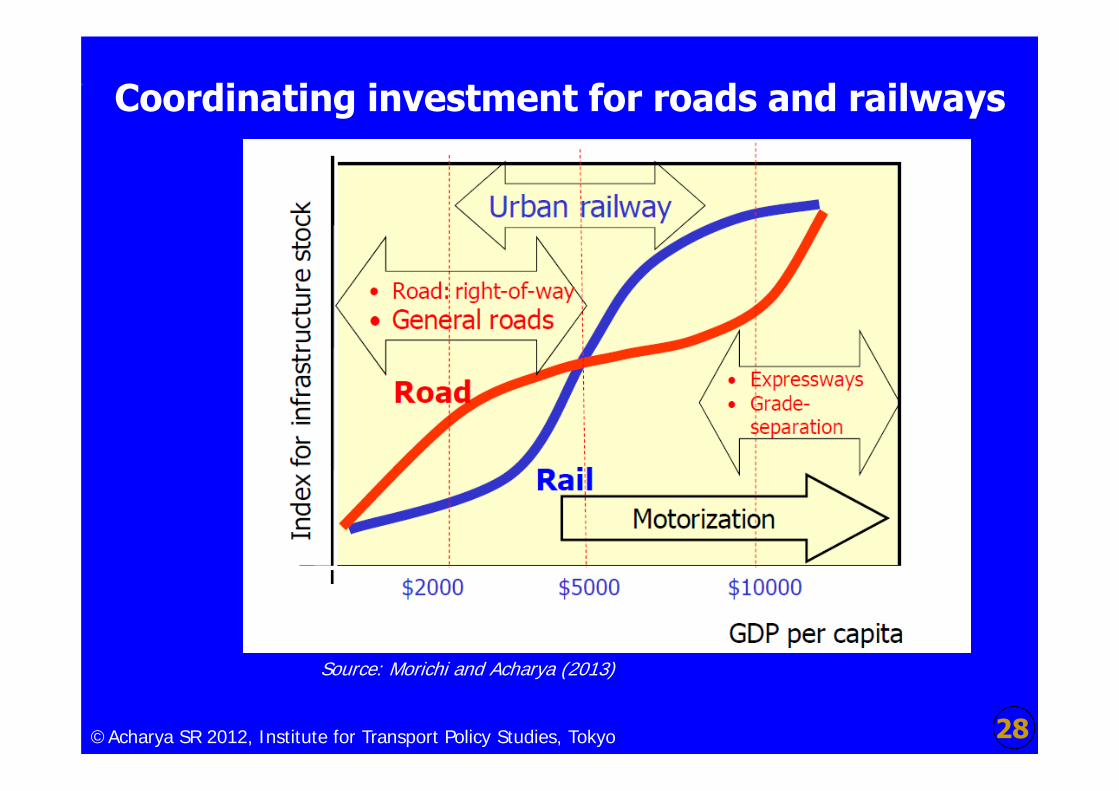
Coordinating investment for roads and railways
©Acharya SR 2012, Institute for Transport Policy Studies, Tokyo 28
Source: Morichi and Acharya (2013)

Framework to make distinction between funding and financing
©Acharya SR 2012, Institute for Transport Policy Studies, Tokyo 29Source: Morichi and Acharya (2013)