Embed Size (px)
Citation preview

Transport and retention of coarse woody debris in mountain
streams: An in situ field experiment of log transport and a field
survey of coarse woody debris distribution
Hirokazu Haga, Tomo’omi Kumagai, Kyoichi Otsuki, and Shigeru OgawaResearch Institute of Kyushu University Forests, Sasaguri, Kasuya, Fukuoka, Japan
Received 7 December 2001; revised 13 March 2002; accepted 28 March 2002; published 1 August 2002.
[1] Although coarse woody debris (CWD) is an important component of streamecosystems in forested areas, the processes of CWD distribution, transport, and retentionhave not been clarified. In this study the distribution process of CWD pieces shorter thanthe bankfull width (S-CWD) is discussed using an in situ field experiment of logtransport and a field survey of CWD distribution in mountain streams. The transportexperiment showed that transport distance has a close relation to flow depth and alsoimplied that the magnitude and sequence of a series of flows were important factors forS-CWD transport and retention in streams. The survey of CWD distribution indicatedthat in-stream obstructions played an important role in the S-CWD retention in deeperchannels where S-CWD pieces were potentially transported distances more than spacingbetween trapping sites of CWD. Overall, the in situ field experiment and the segment- toreach-scaled analysis using h* (=depth/diameter) helped us understand the actualmovement and distribution of CWD. INDEX TERMS: 1815 Hydrology: Erosion and
sedimentation; 1821 Hydrology: Floods; 1824 Hydrology: Geomorphology (1625); KEYWORDS: coarse
woody debris, in situ field experiment, mountain stream, transport and retention, critical floating depth,
sequence of high flow events
1. Introduction
[2] Coarse woody debris (CWD) is an important compo-nent of most stream ecosystems in forested areas becauseCWD can influence the morphology and ecology ofstreams. For example, CWD influences the abundance andthe relative proportions of fish and invertebrates in streams[Elliott, 1986; Smock et al., 1989; Fausch and Northcote,1992] by retaining food, such as leaf and twig litter [Bilbyand Likens, 1980; Jones and Smock, 1991; Webster et al.,1994], and forming habitats, such as refuges and spawningsites [House and Boehne, 1986; Everett and Ruiz, 1993;Inoue and Nakano, 1998]. However, CWD can be movedby high flow events, thus possibly altering the functions ofindividual CWD pieces. Therefore, to fully understand theroles of CWD in streams, it is important to understandtransport and retention of CWD.[3] Most studies on CWD distribution have focused on
the relations between the geomorphic features in streamsand the amount and depositional form of CWD withoutconsidering the transport mechanisms [Keller and Swanson,1979; Lienkaemper and Swanson, 1987; Bilby and Ward,1991; Nakamura and Swanson, 1994]. These studiesshowed that CWD pieces longer than the bank-full width(L-CWD) were stable and influenced channel morphologyand stream ecosystems over the long term. CWD piecesshorter than the bank-full width (S-CWD) also play impor-tant ecological roles in streams [Jones and Smock, 1991;Ehrman and Lamberti, 1992]. However, S-CWD is usually
unstable and more easily transported than L-CWD; that is,the effects of S-CWD on stream ecosystems change dynam-ically. Therefore, in order to understand distribution patternsand geomorphic and ecological roles of CWD, not only thedistribution of L-CWD but also the transport mechanismsfor S-CWD should be examined. Especially, in regionswhere S-CWD is dominant in streams, such as afforestationareas in southwestern Japan, S-CWD dynamics is a seriousproblem to be solved.[4] Although a few studies have been made on S-CWD
transport using flume experiments and numerical simula-tions [Ishikawa et al., 1989; Fujita and Kurokawa, 1993;Braudrick et al., 1997; Braudrick and Grant, 2000], actualtransport of S-CWD in mountain streams remains poorlyunderstood because field measurements on the transport ofS-CWD are difficult to carry out during floods. Flowconditions during debris flows and large floods, whoserecurrence intervals are several years to many decades, aretoo complicated for investigating S-CWD movement.However, in the case of moderate floods, which onlyslightly alter channel morphology, there is a possibilitythat S-CWD movement can be monitored. Furthermore, toassess the ecological roles of S-CWD, we need to discussnot only the impact of a long-term structure of S-CWD onthe stream ecosystems, but also S-CWD transport with atimescale equivalent to the life histories of fish andinvertebrates, i.e., with recurrence intervals of a fewmonths to several years.[5] There is a growing awareness that it is essential to
conduct in situ field experiments on S-CWD dynamics andto consider S-CWD movement when trying to understandCWD distribution. The objective of this study is to explain
Copyright 2002 by the American Geophysical Union.0043-1397/02/2001WR001123$09.00
1 - 1
WATER RESOURCES RESEARCH, VOL. 38, NO. 8, 10.1029/2001WR001123, 2002

the process of CWD distribution in mountain streams usinga field survey of CWD distribution and an in situ fieldexperiment of S-CWD transport. First, we conducted an insitu field experiment to analyze S-CWD transport mecha-nisms and examined the actual movement, i.e., transportdistance of logs, for about 1 year. Then, we made a fieldsurvey of CWD distribution to document the actual situa-tions of S-CWD and L-CWD retained in a channel. Finally,we compared the results of the experiment and the survey,and here we discuss the pattern and formation process ofCWD distribution in streams.
2. Viewpoints on Analysis of Log TransportDistance
[6] Ishikawa et al. [1989], Braudrick et al. [1997], andBraudrick and Grant [2000] developed theoretical modelsfor S-CWD entrainment based on the balance of forces onindividual S-CWD pieces by flowing water. Using thesemodels, we focused on several important points to discussthe results produced in our field experiment of log transportand the survey of CWD distribution.[7] The forces acting on S-CWD in streams are hydro-
dynamic (F ) and resistance (R). The hydrodynamic forcecomprises the drag force and the lifting force. However, thelifting force is negligible because most S-CWD pieces arenot submerged [Braudrick and Grant, 2000]. We assumethat the shape of the S-CWD is a cylindrical log of which
the diameter and the length are d and l, respectively.According to Braudrick and Grant [2000], F is
F ¼ 1
2Cdr l h sinqþ Asub cosqð ÞU2; ð1Þ
and R is
R ¼ g sp l d2
4� g rAsub l
� �m cosa� sinað Þ; ð2Þ
where Cd is the drag coefficient of the log in water, r is thedensity of water, h is the water depth, q is the angle of logrelative to flow, U is the flow velocity, g is the gravity, s isthe density of the log, m is the coefficient of friction betweenthe log and the channel bed, a is the channel bed slopeangle, and Asub is the submerged area of the logperpendicular to length:
Asub ¼ d21
4cos�1 1� 2h
d
� �� 1
8sin 2cos�1 1� 2h
d
� �� �� �: ð3Þ
[8] In addition, we use the following relations:
U ¼ CH
ffiffiffiffiffiffiffiffiffiffiffiffih sina
p; ð4Þ
l ¼ kd; ð5Þ
h* ¼ h
d; ð6Þ
Figure 1. An example of the relationship between the nondimensional water depth (h*) and thenondimensional force (C) and transport regimes. The threshold for movement of logs is C = 1, and thethreshold for transport by floating is hc*. Assuming that the density of log is equivalent to the water, hc* is1. Parameters were r = 1000 kg m�3, s = 1000 kg m�3, k = 15, m = 1.0, Cd = 0.8, CH = 70, a = 0.040 rad,and q = 0.785 rad.
1 - 2 HAGA ET AL.: COARSE WOODY DEBRIS IN MOUNTAIN STREAMS

where CH is Chezy’s coefficient, k is the constant whichvaries depending on the log, and h* is the nondimensionalwater depth.[9] Then, the combination of equations (1)–(6) gives the
nondimensional force (C = F/R):
C ¼ F
R¼ 2CdrC2
Hh*sina kh* sinqþ b h*ð Þ cosqð Þgk ps� 4b h*ð Þrð Þ m cosa� sinað Þ ; ð7Þ
where b(h*) is a function of nondimensional water depth:
b h*ð Þ ¼ 1
4cos�1 1� 2h*ð Þ � 1
8sin 2 cos�1 1� 2h*ð Þ
� : ð8Þ
[10] Equation (7) indicates that the nondimensional force(C) is a function of the nondimensional water depth (h*). Inother words, log transport regimes (resting, rolling/sliding,
Figure 2. Location of study sites in Oyabu basin, the Miyazaki Experimental Forests of KyushuUniversity, southwestern Japan. Oyabu Creek was the main stream for the log transport experiment, andKochino-tani Creek was the branch stream for the coarse woody debris (CWD) distribution survey. Threestream gauges (GU, GM, and GL) were placed along the stream.
Table 1. Characteristics of Study Streams
Log Transport Experiment,Oyabu Creek
CWD Distribution Investigation,Kochino-tani Creek
Watershed area, km2 5.30 0.86Length of study section, m 5500 1080Stream ordera 1–4 3Bank-full width, m average (range) 9.0 (2.0–20.0) 6.6 (3.2–16.5)Gradient, % average (range) 4.0 (0.4–25.0) 5.3 (1.5–16.1)Channel morphologyb 1,c cascade/step pool step pool/plane bed
2, step pool/plane bed3, step pool4, plane bed/pool riffle
aFrom map 1:5000.bClassifications according to Montgomery and Buffington [1997].cStream order.
HAGA ET AL.: COARSE WOODY DEBRIS IN MOUNTAIN STREAMS 1 - 3
floating) are interpreted by h*. Figure 1 shows an exampleof the relationships between C and h*. First, if the hydro-dynamic force (F ) is less than the resisting force (R), C < 1,the log remains stationary. Then, if F is greater than R withthe result that h* increases, C > 1, the log begins to moveby sliding or rolling. Finally, if h* is beyond the thresholdfor floating (hc*), R = 0 and C =1, the log is transported byfloating. The hc* depends on s, for example, hc* = 1.0 whens = r or hc* = 0.5 when s = 0.5r.[11] This study focuses on S-CWD transport distance in a
stream. A physically based model for transport distance,which linked the above entrainment model with a model forS-CWD velocity and transport duration, would be a goodanalysis tool. However, it is very difficult to develop andverify such a model for transport distance because S-CWDvelocity is affected by complex flow patterns, which quicklyfluctuate spatially and temporally in a stream, and transportduration is influenced by the duration of flood flow above acritical depth and the S-CWD stopping mechanism, includ-ing accidental factors. Here we emphasize that h* is a usefulindex in analyzing the effects of flows on the transportdistance of S-CWD. The hc*, especially, is an importantvalue for the floating threshold that largely determineswhether S-CWD is transported long distances.[12] In the field experiments of log transport it is difficult
to accurately measure the water depth at the log depositionsite during high flows and to know the log density (s) at themoment of floating, which greatly controls hc*. Therefore we
have chosen to estimate the representative water depth atdeposition for each segment and to focus on results at thereach to segment scale.[13] We note that the above mentioned concept cannot be
applied to resting logs trapped by in-stream obstructions,such as large boulders and other logs, because obstructionsalter the resisting force and violate assumptions in theentrainment model. Therefore comparing the results of theexperiment of log transport in a stream with few obstruc-tions and the results of the survey of CWD distribution in astream with obstructions is necessary in order to understandthe transport and retention of CWD.
3. Methods
3.1. Study Sites
[14] The study was conducted in two mountain streams,Oyabu Creek and Kochino-tani Creek, in the Oyabu basinin the central Kyushu Range, Japan (Figure 2). Both creeksflow through the Miyazaki Experimental Forests of KyushuUniversity (32�220N, 131�090E, 990–1479 m high).[15] The 5.30-km2 Oyabu basin is underlain by sedimen-
tary rocks, shale, phyllite, and green-stone from the Creta-ceous Period [Tanaka and Iwamatsu, 1993]. The slope ofthe basin is very steep: 30% of the area has a gradient ofmore than 30�. The channels in Oyabu and Kochino-taniCreeks are constrained by streamside hillslopes. Thestreambeds are composed mostly of gravel, cobble, andbedrock. Bars and large boulders occur in several places.[16] The forest is composed largely of mixed stands of
deciduous broad-leaved trees; beech (Fagus crenata Bl.),oak (Quercus mongolica var. grosseserrata Rehd. et Wils.)and Japanese cherry birch (Betura grossa Sieb. et Z.), andevergreen coniferous trees; and fir (Abies firma Sieb. et Z.)and hemlock (Tsuga sieboldii Carr.). These trees, occupyingthe forest overstory, are 20–30 m tall.[17] The climate of the basin is classified as a cool
temperate zone; the annual mean temperature is 13.6�C.The basin receives 3500 mm of precipitation annually,mostly as frontal rain from June to October. It also receivesheavy rain brought by typhoons several times a year.
Table 2. Wood Density and Porosity of Logs Used in the
Transport Experiment
Porosity, %
Wood Density, kg m�3
Air-Dried Saturateda Transported by Floodb
67–71 440–630 1150–1170 more than 860
aThe value was calculated using the porosity data and the specificdensity of wood substance (1500 kg m�3).
bReference data for the density of logs transported by flood, measuredimmediately after a flood in a forested stream, western Japan [Nakashimaand Yamanaka, 1999].
Figure 3. Relative daily maximum water level (RWL) in Oyabu Creek from 1 October 1997 through30 October 1998. The values were calculated using the data of the stream gauges (maximum = 1,minimum = 0).
1 - 4 HAGA ET AL.: COARSE WOODY DEBRIS IN MOUNTAIN STREAMS

[18] As the basin is steep in the mountainous areas andsoil is thin, the water level of the channel immediatelyrises after rain starts and rapidly declines after rain stops.Thus the difference of discharge between low flow andpeak flow is large. This is a typical pattern of rainfall-runoff in the mountain regions of southwestern Japan.3.1.1. Log Transport Experiment: Oyabu Creek[19] A field experiment of log transport was conducted in
Oyabu Creek (Figure 2). As many riparian trees along thestream had been cleared, CWD was scarce in the stream.Neither CWD nor boulders blocked the stream. The exper-imental section of the stream was 5500 m long and it was afirst- through fourth-order stream. Mean bank-full widthand mean gradient of the experimental section were 9.0 mand 4.0%, respectively (Table 1). The water levels of OyabuCreek were observed using three stream gauges (GU, GM,GL, for upper, middle, and lower, respectively) distributedalong the stream (Figure 2).3.1.2. CWD Distribution Investigation:Kochino-tani Creek[20] CWD distribution was investigated in Kochino-tani
Creek, a branch stream of Oyabu Creek (Figure 2).Kochino-tani Creek drains a 0.86-km2 watershed and isthe only creek in the Oyabu basin that has been excludedfrom forest operations for more than 60 years. It is coveredwith 100- to 200-year-old natural forests [Aragami, 1987].As the structure of the stand supplying CWD to thechannel is similar all along the stream, the size andamount of CWD entering the stream is similar along theresearch section. The research section in the Kochino-taniCreek was 1080 m long and was a third-order stream.Mean bank-full width and mean gradient of the researchsection were 6.6 m and 5.3%, respectively (Table 1). Theresearch section was divided into the 54 twenty-meter-longsample units.
3.2 Field Experiment on Log Transport
[21] We used 63 similar sized logs in this experiment.Branches and other irregularities on the log surfaceswere removed. About 10 vinyl plastic number tags foridentification were attached on each log using a staplegun. The mean diameter of the logs was 14 cm (±4 cm
standard deviation), and the length was 1.7 m (±0.4 mstandard deviation). The length was decided based onthe minimum bank-full width in the experimental sec-tion, lest logs should span the channel and trap otherlogs. Wood density and porosity of logs are shown inTable 2.[22] Before the experiment, we made a topographic
survey of the channel and set bench marks at 10- to 50-mintervals to document the positions of logs in the channel.We placed the logs at 38 points from 2260 to 5260 m in theexperimental section on 1 October 1997 when the waterlevel was low. The logs were installed perpendicular to theflow at the center of shallower sites such as riffles, wherethe streambed was relatively flat and the water depth wasless than 5 cm. Each log was in contact with the streambedand was not moving.[23] We identified the locations and depositional form of
logs four times over the following year: 9 December 1997, 3June 1998, 8 July 1998, and 30 October 1998. The transportdistances of logs during each period were measured basedon the distance from each log to the nearest bench mark.The depositional form was classified into two types depend-ing on deposition condition. The first type, grounded, is that
Table 3. Features of the High-Flow Events Relating Log to Transporta
Period Date
Discharge Time, hour
Peak,m3 s�1
Specific,b
m3 s�1 km�2After
Beginningto Peakc
After Peak toInflectionPointd
In Excess ofAntecedentPeak to Peak
First 26 Nov. 1997 7.2 3.5 24 3 N/ASecond 2 June 1998 10.8 5.3 14 4 4e
Third 13 June 1998 10.5 5.1 9 3 0f
Fourth 17 Oct. 1998 14.4 7.0 6 4 2g
aThese were estimated using data at the 3000-m point in Oyabu Creek.bSpecific discharge is defined as peak discharge divided by catchment area.cTime after beginning of runoff to peak of each high-flow event (Si – Pi in Figure 4).dTime after peak to inflection point on recession curve (Pi – Ii in Figure 4).eTime interval between the point at which the discharge of the second event surpasses the peak of the first event and the peak of
the second event (An2 – P2 in Figure 4).fPeak of the third event was below the peak of the second event.gTime interval between the point at which the discharge of the fourth event surpasses the peak of the second event and the peak of
the fourth event (An4 – P4 in Figure 4).
Figure 4. A definition sketch related to Table 3. Si, Pi, andIi are the times of beginning, peak, and inflection point onthe recession curve of the ith runoff event, respectively. Aniis the time when the discharge of the ith runoff eventsurpasses the peak of the highest previous event.
HAGA ET AL.: COARSE WOODY DEBRIS IN MOUNTAIN STREAMS 1 - 5

Figure 5. Transport distances of logs in the periods: (a) first period, (b) second period, (c) third period,and (d) fourth period. Open circles indicate logs remaining within the experimental section, and solidcircles indicate logs transported out of the experimental section. Oblique lines show the distances the logswere transported to the lowest point of the experimental section. Note that the data of the transportdistances of the logs located above 2200 m on the first day of the period were used in the log transportanalysis (Figures 6, 8, and 12).
1 - 6 HAGA ET AL.: COARSE WOODY DEBRIS IN MOUNTAIN STREAMS
of logs grounded individually on gravel, bars, and bedrock;the second type, trapped, is that of logs trapped individuallyby cobble, streamside and eroded roots of riparian trees, andpartially buried sediments.[24] We did not touch the logs throughout these surveys
because changes in depositing conditions might influencethe retransport of logs. Some logs were transported out ofthe experimental section and the locations of these logswere recorded as the lowest point of the experimentalsection.
[25] To compare the results with equation (7), a site-specific log movement model, we needed to know the actualwater depth at the site the log was deposited. Because it isimpossible to do this with sufficient accuracy, we attempteda macroscopic analysis using the representative waterdepths of the segments at peak flows to discuss the transportdistances of logs at segment to reach scale. The representa-tive water depths of the segments were estimated by thefollowing procedure:1. A point 3000 m above the bottom of the experimental
section was selected as the reference point to determine themaximum discharge during each period. This point waslocated at the center of a 200-m straight reach (Figure 2).According to channel types described by Montgomery andBuffington [1997], the channel morphology around thispoint was classified as a plane bed type, and the gradientand cross section were almost uniform. According to theintensive measurement at 2-m intervals, the mean (±stan-dard deviation), maximum, and minimum bank-full widtharound this point were 9.5 (±0.5) m, 10.7 m and 8.8 m,respectively.2. The maximum water level of each period at 3000 m
was measured using the stream gauge GM (Figure 2) andflow markers, such as leaf litter deposition.3. The maximum discharge at 3000 m was calculated by
multiplying the cross-sectional area of flow and the velocityestimated from Manning’s equation. The Manning’s rough-ness coefficient of this reach was calculated from dischargemeasurements to be 0.061.4. The specific discharge at 3000 m was calculated by
dividing the maximum discharge by the catchment area.5. The experimental section was divided into 24
segments. The segments were defined as the channelbetween confluences of tributaries into the main channel.We assumed that the discharge was constant throughout
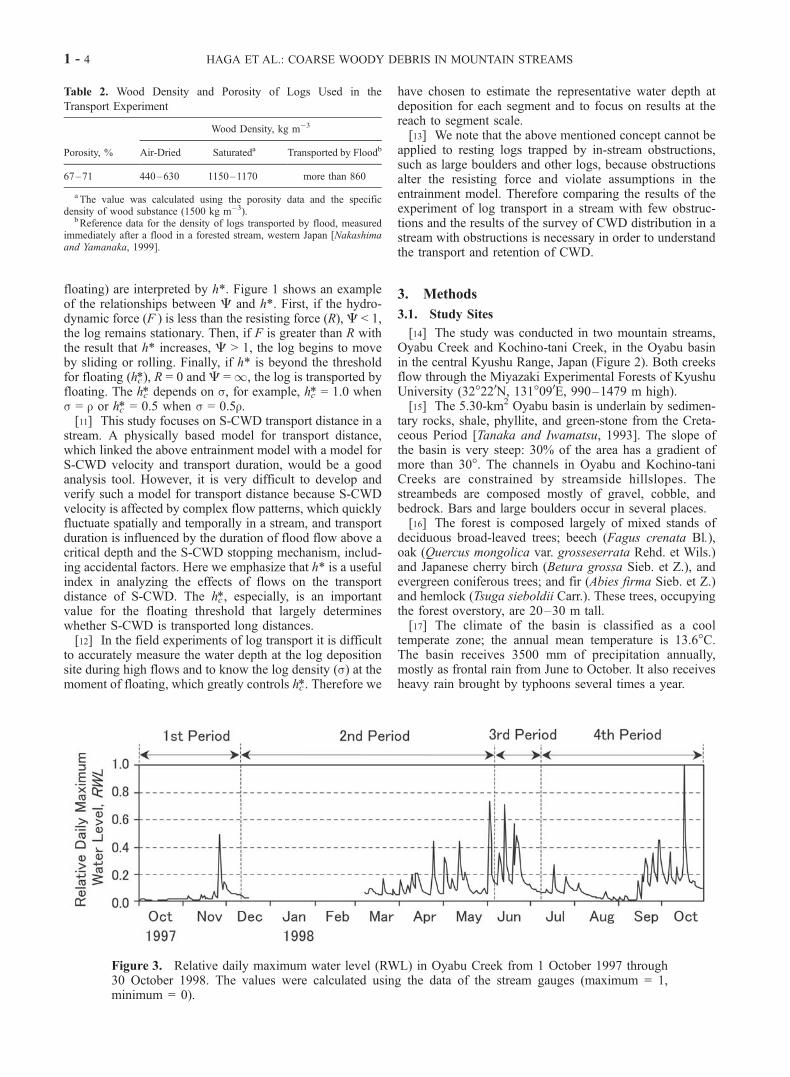
Figure 6. Relationship between the maximum RWL andthe mean transport distance in each period.
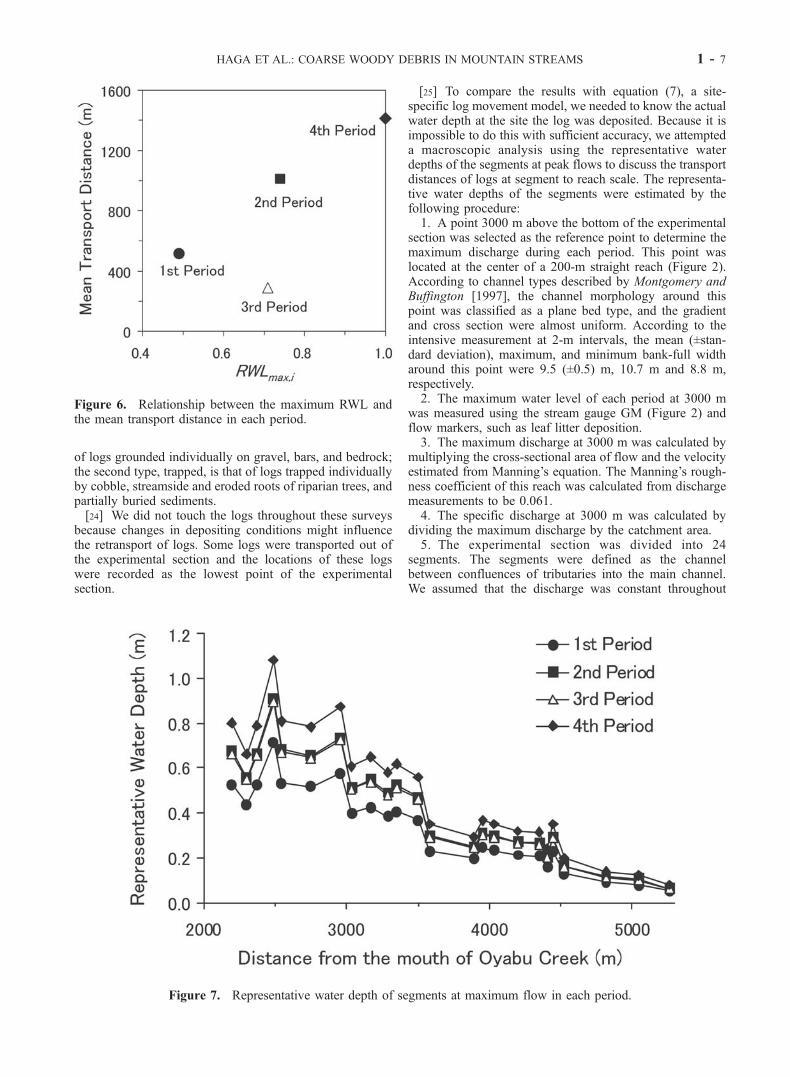
Figure 7. Representative water depth of segments at maximum flow in each period.
HAGA ET AL.: COARSE WOODY DEBRIS IN MOUNTAIN STREAMS 1 - 7

each segment because tributaries are the major watersources for the main channel.6. The maximum discharge of each segment was
calculated by multiplying the specific discharge and thecatchment area of the segment.7. The representative water depth of each segment was
calculated using the mean bank-full width, mean gradient,and maximum discharge of the segment by assuming thesegment as a rectangular channel. Manning’s equation wasused in the calculation and the calculated values werechecked against stream gauge data.
3.3. Field Survey of CWD Distribution
[26] Field surveys of CWD distribution in the researchsection of Kochino-tani Creek were made at low flowduring 3–9 March 1998. We measured the lengths ofCWD pieces in their entirety and diameter at the midpoint(at least 1 m in length and 10 cm in diameter) and surveyedlocations of CWD pieces in the research section. Thevolume of CWD was calculated assuming a cylindricalshape.[27] The depositional form of CWD was divided into
three classes: (1) individual, in which CWD is depositedindividually on the streambed; (2) jam associated, in whichtwo or more pieces of CWD touch each other; and (3) fallentree, in which CWD has one end in contact with thestreambed and the other extending onto the hillslope.[28] Additionally, the class of jam-associated CWD was
classified into three types depending on in-stream obstruc-tions related to jam formation: channel constriction, largeboulder, or standing tree.
4. Results
4.1. Log Transport in Oyabu Creek
4.1.1. Fluctuation of Water Level During theExperiment[29] Figure 3 shows the relative daily maximum water
level (RWL) at 3000 m in Oyabu Creek. The values were
Figure 8. (opposite) Relationships between the represen-tative water depth of segments and the transport distances oflogs in each period: (a) first period, (b) second period, (c)third period, and (d) fourth period. Circles show ‘‘grounded’’logs on the first day of the period: open circles, logs retainedwithin the experimental section during the period; solidcircles, logs transported out of the experimental section.Triangles show ‘‘trapped’’ logs on the first day of the period:open triangles, logs retained within the experimental sectionduring the period; solid triangles, logs transported out of theexperimental section. The regression lines are fitted exclud-ing unmoved grounded logs (transport distance = 0 m) andall trapped logs: (a) y = 0.52e12.75x, r2 = 0.58, N = 60; (b) y =0.45e13.01x, r2 = 0.65, N = 37; (c) y = 0.26e13.97x, r2 = 0.71,N = 9; (d) y = 3.84e8.32x, r2 = 0.61, N = 15. These equationsshow that the relationship between the transport distance andthe water depth is exponential. However, they are not veryuseful for prediction because of the poor fit (low r2). Thisimplies that the complexity of flow can be closely related tothe log transport.
1 - 8 HAGA ET AL.: COARSE WOODY DEBRIS IN MOUNTAIN STREAMS

calculated based on the data at the GM stream gauge andwere checked using the data of the other gauges. Thewater level on the missing days in the second period wasinferred to be less than the peak water levels in April andMay of the second period, based on precipitation data[Miyazaki Experimental Forests of Kyushu University,2000]. The largest RWL occurred on 17 October 1998in the fourth period. The smallest RWL occurred on 26November 1997 in the first period. The maximum RWL ofthe third period was slightly less than that of the secondperiod. The order of the maximum RWL of the periods was
RWLmax;1 < RWLmax;3 < RWLmax;2 < RWLmax;4;
where RWLmax,i was the maximum RWL of measurementperiod i.[30] Some features of these high flow events are shown in
Table 3. The time after the water level began to increase
until it peaks ranged from 6 to 24 hours. It took 3–4 hoursfor the discharge to decrease by half after peak. To helpunderstand Table 3, the definitions of time intervals arevisually shown in Figure 4.4.1.2. Transport Distances of Logs[31] Figure 5 shows the transport distances of the logs in
each period. The transport distances of the logs variedgreatly. Logs below 3500 m tended to move long distances,but most logs above 3500 m were not transported far.[32] In the analysis of the log transport hereinafter, only
the transport distances of the logs above 2200 m on thefirst day of the period were considered, in order tominimize the bias of logs moving out of the experimentalsection.[33] Figure 6 shows the relationship between the
RWLmax,i and the mean transport distance. The mean trans-port distance increased with the RWLmax,i, except for thethird period. Incidentally, most logs below 2200 m were
Figure 9. Location and depositional form of the logs after maximum flow in each period. Thedepositional form is classified into two types: G, grounded; T, trapped.
HAGA ET AL.: COARSE WOODY DEBRIS IN MOUNTAIN STREAMS 1 - 9

transported out of the experimental section except forduring the third period.4.1.3. Peak Water Depth of Segment andTransport Distances of Logs[34] Figure 7 shows the representative water depth of the
segments at maximum flows. The water depth at maximumflows tended to increase downstream.[35] Figure 8 shows the relationship between the represen-
tative water depth of the segments where the logs werelocated on the first day of the period and the transport distanceof logs above 2200m. In the first period the transport distancetended to increase exponentially with the representative waterdepth of the segment. In the other periods the relationsbetween the transport distance and the representative waterdepth of the segment were also exponential, excludingunmoved grounded logs and all trapped logs (Figure 8).The number of unmoved logs in the third period was thegreatest among all periods despite the fact that RWLmax, 3 wasobviously greater than the RWLmax, 1 (Figure 3).4.1.4. Depositional Forms and Responses of Logs toPeak Flows[36] All the logs in each period were deposited individ-
ually; that is, no logs were touching others in their final
resting places at each measurement period. Figure 9 showsthe location and depositional form of the logs aftermaximum flow in each period. Most logs (85%) weregrounded on the gravel, bars, and bedrock by transport ofthe first period. After that, the percentage of grounded logsdecreased gradually and was equivalent to trapped logs inthe fourth period. This pattern was remarkable in the lowersection, below about 3500 m. Figure 10 shows response ofthe logs to maximum flow in all periods. In the first,second, and fourth periods the percentage of logs nottransported (transport distance <1 m) was at most 19%for the grounded type and 57% for the trapped type. Incontrast, in the third period, the percentage of the logstransported <1 m was over 60% for the grounded type and100% for the trapped type.
4.2. Distribution of CWD in Kochino-tani Creek
[37] The research section of Kochino-tani Creek con-tained 176 CWD pieces. Almost all CWD pieces were S-CWD (83% of the total). The mean and maximum valuesfor CWD length in the research section were 3.5 and 14 m,respectively. The mean and maximum values for CWDdiameter were 27 and 80 cm, respectively.[38] Figure 11 shows the numbers, volumes, and deposi-
tional forms of CWD in the sample units in the researchsection. The number pattern was similar to the volumepattern, except for several units with a few large CWDpieces. For example, the size of the piece at 820 m was 14 min length and 70 cm in diameter. The upper reach had moresample units where S-CWD pieces were deposited than thelower reach: 15 units in the upper and eight units in thelower. However, the number of S-CWD pieces in the upperreach was less than the number in the lower reach: 60 in theupper and 86 in the lower. The volumes of S-CWD in theupper and lower reach were 11.9 and 16.8 m3, respectively.The dominant depositional forms in the upper and lowerreaches were distinctly different. The dominant form in theupper reach was the ‘‘individual,’’ 46 pieces in 15 units, butin the lower reach the majority was ‘‘jam-associated,’’ 78pieces in only four units. CWD jams were located at onlyfive units in the whole research section. The CWD jams ofthe ‘‘channel constriction’’ type, which were made by someL-CWD pieces, trapped a large number of S-CWD: 49pieces (34% of all S-CWD).[39] In the research section the dominant feature of the S-
CWD distribution was that S-CWD was individually depos-ited at frequent intervals in the upper reach and they locallyaccumulated in CWD jams in the lower reach. L-CWD alsoshowed a similar tendency.
5. Discussion
5.1. Effect of Peak Flow and Flow Sequence onLog Transport
[40] In this study, we regarded the RWLmax,i as an indexof the magnitude of the peak flow during individual timeperiods in the experiment. The magnitude of the thirdperiod was nearly equal to the second period (Figure 3,Table 3), but many grounded logs, which were easy totransport compared with trapped logs, were unmoved inthe third period (Figures 8c and 10). This result has twopossible interpretations. One is that the hydrodynamic
Figure 10. Response of the logs to maximum flow in eachperiod: (a) grounded logs; (b) trapped logs. The numbersinside the bars are the numbers of the logs. NA means notapplicable.
1 - 10 HAGA ET AL.: COARSE WOODY DEBRIS IN MOUNTAIN STREAMS

force (F ) acting on logs at the peak in the third periodwas less than the resisting force (R) when the logsstopped in the second period. The alternative interpreta-tion is that the logs transported in the second period werelocated above the water surface at the peak in the thirdperiod. Either of these interpretations could explain themarked decrease in transport distance in the third period(Figure 6). Strictly speaking, this analysis should alsoaccount for log orientation to flow or drag coefficient (Cd)in comparing the log movement in the first and thirdperiods.[41] We conclude that the sequence of high-flow events
can be very important for log transport. Moreover, judg-
ing from the slight difference between RWLmax,2 andRWLmax,3, the response of logs to flows may be quitesensitive to stage. In a related example, Bilby [1984]observed a similar relationship between flow magnitudeand log movement in a headwater stream with loggingdebris. In previous studies, however, the effects of aseries of flows on log movement were not examinedbecause most flume experiments were usually made understeady flow conditions [Ishikawa et al., 1989; Braudricket al., 1997; Braudrick and Grant, 2000] and becausedirect observations and field measurements of log trans-port were difficult in streams. Our results imply thatanalyzing the magnitude and the sequence of a series
Figure 11. Number, volume, and depositional forms of S-CWD and L-CWD in the Kochino-tani Creek.The dashed line shows the middle of the research section. The depositional form of CWD is divided intothree classes: jam-associated, individual, and fallen tree. Furthermore, jam-associated is classified intothree types: CC, channel constriction; LB, large boulder; ST, standing tree.
HAGA ET AL.: COARSE WOODY DEBRIS IN MOUNTAIN STREAMS 1 - 11

of flows is important to clarify the S-CWD dynamics instreams.
5.2. Effect of Critical Floating Depth onLog Movement
[42] In the analysis of log transport distance, the non-dimensional water depth for each log (equation (6)) ismacroscopically expressed as
h* ¼ hs
d; ð9Þ
where hs is the representative water depth of the segment atthe maximum flow of the period. In addition, the thresholdfor floating is
hc* ¼ hc
d; ð10Þ
where hc is the critical floating depth of each log. It isdifficult to determine hc precisely because the density ofthe log varies with the moisture condition of the logdeposition sites, for example, on gravel above the watersurface or under flowing water. Here we tried evaluatingrobustly the effects of the critical floating depth on logmovement at the segment scale. Judging from the densityof CWD pieces transported by floods [Nakashima andYamanaka, 1999] (Table 2), CWD pieces deposited in achannel typically contain high percentages of water. If weassume that the average density is equivalent to the water,then hc is equal to the diameter of the logs; that is, thethreshold for floating is
hc* ¼ 1: ð11Þ
[43] Figure 12 shows the relationship between h* (equa-tion (9)) and the transport distances of the logs in allperiods, excluding the unmoved logs and trapped logs inFigure 8. The logs moved at most 10 m downstream andwere retained in the segments when h* < 1. On the otherhand, the logs were potentially transported over 1000 mand were transported out of the segments when h* > 1. Itis implied that the water depth relative to log diameter isan important factor for log transport in actual streams.However, to analyze the log transport distance in moredetail, it is necessary to consider the site-specific waterdepth, the log orientation to flow as Ishikawa et al. [1989]and Braudrick and Grant [2000] pointed out, and the logtransport duration.[44] Here we tried a preliminary study on the log
transport duration and the log velocity. In Figures 6, 8,and 10, it is noted that the discharge in excess of theantecedent flow peak is closely related to the mean trans-port distance of the measurement period. Therefore weassume that on the average the transport duration in a runoffevent is equivalent to the time interval between the point atwhich the discharge level of the event surpasses the peak ofthe highest previous event and the peak of the runoff event.In the second period, for example, the tentative maximumlog velocity is 0.26 m s�1 in a calculation using themaximum log transport distance (3766 m) and the duration(4 hours, An2 – P2 in Figure 4). This estimated value issubstantially smaller than the representative water velocityof each segment at the beginning point of the duration (An2in Figure 4), which ranges from 0.96 to 1.67 m s�1. Thediscrepancy implies that log transport is strongly affectedby other factors such as complexity of flow related tochannel morphology. In addition, the discrepancy may arisein part from difficulty in analyzing the critical floatingdepth and in understanding log stopping mechanisms.
5.3. Log Retention in the Channel at the Reach Scale
[45] The above discussion suggests that the channel’sability to retain logs is primarily a function of the waterdepth at the maximum flow in a channel. According to thedepth of maximum flow in each measurement period(Figure 7), the experimental section above the 2200-m pointwas divided into four reaches, 2200–3200 m, 3200–3500 m,3500–4600 m, and 4600–5500 m from the lowest point.Figure 13 shows the proportion of retained logs and therange of the maximum water level of each reach. In the4600–5500 m reach, all logs remained and the proportion ofretained logs was 100% during the experiment because thewater depth in the reach was less than the mean diameterof the logs, which indicated the critical floating depth oflogs, at all flow peaks. In contrast, in the 2200–3200 and3200–3500 m reaches, most logs were rapidly transportedout of the reaches and the proportion remaining finallydropped to 4% because the water depth was much greaterthan the mean diameter. In the 3500–4600 m reach,where the depth was approximately twice as large as themean diameter, the proportion remaining in the reachdecreased more gradually compared with the lower rea-ches (2200–3200 and 3200–3500 m) and reached only43%. The results imply that the logs tend to be retainedfor a long time in a reach shallower than the criticalfloating depth and are immediately transported out of a
Figure 12. Relationship between the nondimensionalwater depth at segment scale and the transport distancesof logs. In this analysis the density of the logs is equivalentto water; that is, the threshold value for floating (hc*) is 1.Open circles indicate logs retained within the experimentalsection; solid circles indicate logs transported out of theexperimental section.
1 - 12 HAGA ET AL.: COARSE WOODY DEBRIS IN MOUNTAIN STREAMS

reach deeper than the critical floating depth. However,even if the logs are deposited in the deeper reach, trappingby in-stream obstructions would make the logs residelonger in the reach (Figure 9).
5.4. Verification of S-CWD Distribution Pattern inKochino-tani Creek
[46] Most CWD were S-CWD (83%) in Kochino-taniCreek. Therefore the results of the log transport experimentare useful to discuss the distribution of CWD pieces alongthe stream.
[47] We examined the effects of the water depth on theS-CWD distribution pattern. To understand the variationsof water depth at flow peaks along Kochino-tani Creek,the water depths of three peak flows (the specific dis-charges 5.0, 7.0, and 10.0 m3 s�1 km�2) were estimatedby the procedure used to calculate the representative waterdepth of the segment in the experimental section. Theseflow discharges were not particularly high (the recurrenceinterval is less than about 5 years) and the value of 7.0 m3
s�1 km�2 is equal to the specific discharge of themaximum flow (17 October 1998) during the experiment
Figure 13. Log retention in the channel at the reach scale: (a) proportion of retained logs and (b) therange of representative water depths of the segments in each reach. Note that in the reach 4600–5500 m,the representative water depths were below the mean diameter of logs (14 cm) during the experiment, andall logs were retained in the reach.
HAGA ET AL.: COARSE WOODY DEBRIS IN MOUNTAIN STREAMS 1 - 13

in Oyabu Creek. Figure 14 shows the water depth of thepeak flow and the diameter of CWD pieces alongKochino-tani Creek. The water depth increased down-stream, and the diameters of most CWD pieces weresmaller than the water depth at the peak flow (recurrenceinterval is about 1.0 year) in the lower reach. In contrast,the diameters of many CWD pieces were greater than thewater depth in the upper reach. Therefore the upperreach’s ability to retain S-CWD pieces was greater thanthe lower reach’s ability in Kochino-tani Creek. From thisestimation we would predict that the number of unitsretaining S-CWD and the amount of S-CWD in the upperreach are greater than in the lower reach. However, theresults of the survey of S-CWD distribution (Figure 11)show that although a great number of units have S-CWDin the upper reach, the amount of S-CWD is not greater.The direct cause of this was the existence of CWD jams inthe lower reach, which were not formed in the exper-imental section.[48] In the upper reach, relatively shallower depths were
insufficient for the transport of S-CWD entering the chan-nel. In other words, the transport distances were shortrelative to space at trapping sites, channel constrictions,large boulders, or standing trees. Therefore S-CWD pieceswere individually deposited at frequent intervals in theupper reach (Figure 11).[49] In the lower reach, S-CWD pieces were easily trans-
ported because of the greater depth. Therefore very fewindividual S-CWD pieces were retained in the channel.
Judging from the results shown in Figure 9, to retain S-CWD in the outflow dominant reach, flow-resistance factorsother than the friction of the channel bed are necessary.Channel constrictions, larger boulders, and standing treeshave important roles in impeding flow and acted to traptransported S-CWD and form CWD jams in the lowerreach. CWD jams themselves can also be effective trappingsites [Keim et al., 2000]. CWD jams at channel constrictionpoints, some of which were composed of L-CWD, trapped agreat number of S-CWD by blocking the channel. For thisreason, S-CWD pieces were locally accumulated in CWDjams in the lower reach (Figure 11).[50] Consequently, the distribution of S-CWD pieces is
primarily determined by a combination of water depth atflow peaks and in-stream obstructions. In-stream obstruc-tions related to CWD jam formation have an importantrole in the distribution of S-CWD in deeper channelswhere S-CWD is potentially transported significant dis-tances, i.e., more than the spacing between trapping sites.In steep mountain regions like Japan, where the differenceof discharge between low flow and peak flow is large andthe response of discharge to rainfall is so quick, thesetrapping mechanisms may be critical to CWD distributionin streams.
6. Conclusions
[51] Although CWD distributed in steams has been rec-ognized by ecologists and stream managers to be an
Figure 14. Variations of representative water depth at flow peaks and diameters of CWD pieces alongKochino-tani Creek. The water depths were estimated using high flows with different specific discharges:5.0 m3 s�1 km�2 (curve with triangles), 7.0 m3 s�1 km�2 (curve with diamonds), and 10.0 m3 s�1 km�2
(curve with circles), which recurrence intervals were equal to about 0.5, 1.0 and 5.0 years, respectively.The diameters of CWD pieces are plotted according to S-CWD (circles) and L-CWD (plus signs).
1 - 14 HAGA ET AL.: COARSE WOODY DEBRIS IN MOUNTAIN STREAMS

important factor for fish and aquatic invertebrates [Bilby,1981; Molles, 1982; Murphy and Koski, 1989; Fausch andNorthcote, 1992], controls on the spatial pattern of CWDhave been poorly understood. To understand the interactionbetween the activity of aquatic organisms and the abioticenvironment created by CWD, it is essential to clarify themechanisms of transport and retention of CWD. In this studywe focused on the dynamics of S-CWD, which has receivedlittle study so far [Braudrick and Grant, 2000; Keim et al.,2000], and investigated the transport and retention of S-CWDusing an in situ field experiment of log transport and a surveyof CWD distribution in a relatively undisturbed stream. Thisstudy led to the following results:1. The transport distance of log exponentially increases
with the representative water depth of the segments at peakflows.2. The sequence of a series of flows influences log
transport, and flow magnitude greater than the previousflows is necessary for retransport of most logs.3. Logs are not transported far (at most 10 m) and are
retained individually as long as the water depth of thesegment at peak flows is less than the diameters of the logs.4. Logs are easily transported out of a reach of which the
water depth at peak flows is greater than the log diameter. Alarge amount of S-CWD, however, is locally accumulated inCWD jams by obstructions, such as channel constrictions,large boulders, and standing trees in the stream.[52] We conclude that the critical floating depth of
S-CWD and the magnitude and sequence of a series offlows are key factors for S-CWD movement. Also, werecognize in-stream obstructions as important trappingmechanisms for CWD distribution in steep mountainousareas like Japan because they serve to accumulate S-CWDin reaches where S-CWD potentially would be transporteddistances greater than the spacing between the trappingsites. While the stability of S-CWD is lower than that ofL-CWD in streams [Lienkaemper and Swanson, 1987],the retention time of S-CWD in reaches increases whenS-CWD is deposited within a reach shallower than itscritical floating depth and when S-CWD is trapped by in-stream obstructions.[53] Our results based on the in situ field experiment and
field survey of transport and retention of S-CWD should beuseful information for riparian management and investiga-tion of ecological processes related to S-CWD in streamecosystems. In addition, these results indicate that improve-ments in understanding S-CWD transport will probablyrequire approaches that consider the more actual shape ofCWD (e.g., CWD with rootwad) or CWD orientationrelative to flow [Ishikawa et al., 1989; Braudrick andGrant, 2000]. CWD transport models linked with moreprecise hydrological and hydraulic models are needed toclarify the long-term dynamics of CWD.
[54] Acknowledgments. We are extremely grateful to Takami Shiiba,the late Kazuaki Nakatake, Tetsuya Mabuchi, Youji Inokura, and TomomiMarutani for help in the field and in conducting the experiment. We thankTakashi Kagaya and Futoshi Nakamura for helpful information andsuggestions. We thank Shigeki Hirose for digital image analysis andcomputer system maintenance. We also thank the staff and colleagues ofthe Fukuoka and Miyazaki Experimental Forests of Kyushu University fortroubleshooting support. The study was partially supported by a grant-in-aid for scientific research from the Ministry of Education, Science, Sportsand Culture, Japan (grants 09460071 and 10306009).
ReferencesAragami, K., Studies on the process of formation of Abies and Tsuganatural forest in the central mountain district of Kyushu, Bull. KyushuUniv. For., 57, 17–108, 1987.
Bilby, R. E., Role of organic debris dams in regulating the export of dis-solved and particulate matter from a forested watershed, Ecology, 62,1234–1243, 1981.
Bilby, R. E., Removal of woody debris may affect stream channel stability,J. For., 82, 609–613, 1984.
Bilby, R. E., and G. E. Likens, Importance of organic debris dams in thestructure and function of stream ecosystems, Ecology, 61, 1107–1113,1980.
Bilby, R. E., and J. W. Ward, Characteristics and function of large woodydebris in streams draining old-growth, clear-cut, and second-growth for-ests in southwestern Washington, Can. J. Fish. Aquat. Sci., 48, 2499–2508, 1991.
Braudrick, C. A., and G. E. Grant, When do logs move in rivers?, WaterResour. Res., 36, 571–583, 2000.
Braudrick, C. A., G. E. Grant, Y. Ishikawa, and H. Ikeda, Dynamics ofwood transport in streams: A flume experiment, Earth Surf. ProcessesLandforms, 22, 669–683, 1997.
Ehrman, T. P., and G. A. Lamberti, Hydraulic and particulate matter reten-tion in a 3rd-order Indiana stream, J. N. Am. Benthol. Soc., 11, 341–349,1992.
Elliott, S. T., Reduction of a Dolly Varden population and macrobenthosafter removal of logging debris, Trans. Am. Fish. Soc., 115, 392–400,1986.
Everett, R. A., and G. M. Ruiz, Coarse woody debris as a refuge frompredation in aquatic communities: An experimental test, Oecologia, 93,475–486, 1993.
Fausch, K. D., and T. G. Northcote, Large woody debris and salmonidhabitat in a small coastal British Columbia stream, Can. J. Fish. Aquat.Sci., 49, 682–693, 1992.
Fujita, Y., and Y. Kurokawa, Experimental considerations on behaviors ofdriftwood in mountain river channels, Annu. Disaster Prev. Res. Inst.Kyoto Univ., 36, 465–485, 1993.
House, R. A., and P. L. Boehne, Effects of instream structures on salmonidhabitat and populations in Tobe Creek, Oregon, N. Am. J. Fish. Manage.,6, 38–46, 1986.
Inoue, M., and S. Nakano, Effects of woody debris on the habitat of juve-nile masu salmon (Oncorhyndhus masou) in northern Japanese streams,Freshwater Biol., 40, 1–16, 1998.
Ishikawa, Y., T. Mizuyama, and M. Fukuzawa, Generation and flow me-chanisms of floating logs associated with debris flow, J. Jpn. Soc. Ero-sion Control Eng., 42, 4–10, 1989.
Jones, J. B., Jr., and L. A. Smock, Transport and retention of particulateorganic matter in two low-gradient headwater streams, J. N. Am. Benthol.Soc., 10, 115–126, 1991.
Keim, R. F., A. E. Skaugset, and D. S. Bateman, Dynamics of coarsewoody debris placed in three Oregon streams, For. Sci., 46, 13–22,2000.
Keller, E. A., and F. J. Swanson, Effects of large organic material onchannel form and fluvial processes, Earth Surf. Processes, 4, 361–380, 1979.
Lienkaemper, G. W., and F. J. Swanson, Dynamics of large woody debris instreams in old-growth Douglas-fir forests, Can. J. For. Res., 17, 150–156, 1987.
Miyazaki Experimental Forest of Kyushu University, The climate of theMiyazaki Experimental Forests of Kyushu University, 1989–1998, Res.Mater., 3, 111–117, 2000.
Molles, M. C., Jr., Trichopteran communities of streams associated withaspen and conifer forests: Long-term structural changes, Ecology, 63, 1–6, 1982.
Montgomery, D. R., and J. M. Buffington, Channel-reach morphologyin mountain drainage basins, Geol. Soc. Am. Bull., 109, 596–611,1997.
Murphy, M. L., and K. V. Koski, Input and depletion of woody debris inAlaska streams and implication for streamside management, N. Am. J.Fish. Manage., 9, 427–436, 1989.
Nakamura, F., and F. J. Swanson, Distribution of coarse woody debris in amountain stream, western Cascade Range, Oregon, Can. J. For. Res., 24,2395–2403, 1994.
Nakashima, T., and N. Yamanaka, Transported debris in a torrent of anatural forest watershed caused by heavy rain with the typhoon No.7in 1998, Publ. 27, pp. 76–77, Jpn. Soc. of Erosion Control Eng., Tokyo,1999.
HAGA ET AL.: COARSE WOODY DEBRIS IN MOUNTAIN STREAMS 1 - 15

Smock, L. A., G. M. Metzler, and J. E. Gladden, Role of debris dams in thestructure and functioning of low-gradient headwater streams, Ecology,70, 764–775, 1989.
Tanaka, K., and A. Iwamatsu, Geology of the Hyuga-Okawachi area, Miya-zaki Prefecture, Kyushu, Japan, Bull. Kyushu Univ. For., 69, 31–53,1993.
Webster, J. R., A. P. Covich, J. L. Tank, and T. V. Crockett, Retention of
coarse organic particles in streams in the southern Appalachian Moun-tains, J. N. Am. Benthol. Soc., 13, 140 –150, 1994.
����������������������������H. Haga, T. Kumagai, S. Ogawa, and K. Otsuki, Research Institute of
Kyushu University Forests, 394 Tsubakuro, Sasaguri, Kasuya, Fukuoka811-2415, Japan. ([email protected])
1 - 16 HAGA ET AL.: COARSE WOODY DEBRIS IN MOUNTAIN STREAMS


![References - Hiroshima UniversityReferences [1] S. Otsuki and R. Tamagaki, Prog.Theor. Phys. 12 (1954), 806.[2] J. Iwadare, S. Otsuki, R. Tamagaki and W. Watari, Suppl. Prog.Theor](https://img.dokumen.tips/doc/110x75/5fadb9c2c15089507a38fb4c/references-hiroshima-university-references-1-s-otsuki-and-r-tamagaki-progtheor.jpg)


![2014 2nd geosci 3 [互換モード] - Coocantomo-kumagai.eco.coocan.jp/2014_2nd_geosci_3.pdfMicrosoft PowerPoint - 2014_2nd_geosci_3 [互換モード] Author user01 Created Date 12/7/2014](https://img.dokumen.tips/doc/110x75/5f7a9d8414535658bf73f682/2014-2nd-geosci-3-fff-coocantomo-microsoft-powerpoint-20142ndgeosci3.jpg)