Embed Size (px)
Citation preview

INORGANIC CHEMISTRYFRONTIERS
RESEARCH ARTICLE
Cite this: Inorg. Chem. Front., 2018,5, 2836
Received 3rd August 2018,Accepted 21st September 2018
DOI: 10.1039/c8qi00806j
rsc.li/frontiers-inorganic
Transmission electron microscopy as an importanttool for characterization of zeolite structures
W. Wan, J. Su, X. D. Zou and T. Willhammar *
Transmission electron microscopy (TEM) is an important tool for structure characterization of zeolite
materials. Structural information can be obtained by different TEM techniques, for example electron
diffraction (ED), high-resolution transmission electron microscopy (HRTEM), scanning transmission
electron microscopy (STEM) and electron tomography (ET), each with its own advantages and limitations.
These techniques are briefly introduced. Examples are given to show how these techniques can be used
to solve various structure-related problems in zeolites. With this review we will describe the basic prin-
ciples of transmission electron microscopy techniques for structural characterization, including recent
methodological advancements. Advantages as well as challenges of using TEM for structural characteriz-
ation will be described in relation to other methods. Examples of structural characterization of zeolites
will be given for each of the methods.
1. Introduction
Zeolites are crystalline materials built from corner-sharing TO4
(T = Si, Al, P, Ge, etc.) tetrahedra, which form three-dimen-sional (3D) 4-connected frameworks with uniformly sizedpores of molecular dimensions.1 They have wide industrialapplications in heterogeneous catalysis, sorption, separationand ion-exchange.2 The interesting properties of zeolites arelargely due to their unique pore structures with well-definedpore sizes, shape and dimensionality. The continuouslyincreasing demands on porous materials with highly specificproperties have pushed scientists to synthesize zeolites withunique structures and functionalities. Structure information isthus crucial for understanding the properties, exploiting appli-cations and developing new zeolite materials with desirableproperties and functionalities.
Transmission electron microscopy (TEM) has been widelyapplied for characterization of zeolite structures, for instance,structure determination of new zeolites, study of growthmechanisms of nano-sized zeolites and pore structures of hier-achical micro- and meso-porous zeolites, and analysis of metalsites in zeolites. While single crystal X-ray diffraction (SXRD)and powder X-ray diffraction (PXRD) are the main techniquesfor characterization of zeolite structures, TEM are used forstudying crystals too small or too complicated to be studied byX-ray diffraction.3 In addition to diffraction, there are different
imaging techniques in TEM since electrons can be easilyfocused by electromagnetic lenses. For direct imaging ofatomic structures of a sample, high-resolution transmissionelectron microscopy (HRTEM) and scanning transmission elec-tron microscopy (STEM) can be used. In addition, energy dis-persive X-ray spectroscopy (EDX) and electron energy loss spec-troscopy (EELS) devices attached to a transmission electronmicroscope can provide chemical information of the sample.An overview of the different techniques described in thisreview is given in Fig. 1. TEM is feasible for studying individ-ual nano- or submicron-sized particles in the sample, whileX-ray diffraction gives information about the entire sample.
Amongst various TEM techniques, electron diffraction (ED)is widely used for phase identification and structure determi-nation of zeolite crystals. Recently developed 3D electron diffr-action methods have shown to be more powerful than conven-tional diffraction techniques. Almost complete 3D electrondiffraction data can be obtained from an arbitrarily orientedcrystal within a matter of minutes. A rapidly growing numberof zeolite structures have been solved using the 3D electrondiffraction techniques.
Different from diffraction techniques that provide averageinformation of a material in reciprocal space, HRTEM andSTEM give information in real space, which facilitate directvisualization of pores and local structure (surfaces, disordersand defects) in zeolite materials. HRTEM and STEM imagesare related to the structure projection of zeolite materials. Bothamplitude and phase information of crystal structure factorscan be extracted from the images and used for solvingcomplex zeolite structures, especially those containing defectsand disorders.
Inorganic and Structural Chemistry, Department of Materials and Environmental
Chemistry, Stockholm University, SE-106 91 Stockholm, Sweden.
E-mail: [email protected]
2836 | Inorg. Chem. Front., 2018, 5, 2836–2855 This journal is © the Partner Organisations 2018
Ope
n A
cces
s A
rtic
le. P
ublis
hed
on 2
6 Se
ptem
ber
2018
. Dow
nloa
ded
on 1
2/1/
2021
5:0
8:41
AM
. T
his
artic
le is
lice
nsed
und
er a
Cre
ativ
e C
omm
ons
Attr
ibut
ion-
Non
Com
mer
cial
3.0
Unp
orte
d L
icen
ce.
View Article OnlineView Journal | View Issue

Recently, TEM techniques have been employed in studies ofhierarchical micro- and meso-porous zeolites. The incorpor-ation of mesopores into microporous zeolites offers fast masstransfer and overcomes the diffusion limitation imposed bythe small pore sizes of zeolites, making them applicable forcatalysis involving large molecules. Because the mesopores inmost hierarchical micro- and meso-porous zeolites are dis-ordered, it is necessary to combine different techniques tocharacterize the complex pore structures of such zeolitematerials. Electron crystallographic (EC) methods can be usedto study the microporous structures, while electron tomogra-phy (ET) is commonly used to characterize the mesopores. Thedevelopment of new TEM techniques has greatly facilitated thediscovery of new complex zeolite materials and improvementof the properties and functionalities of existing zeolitematerials.
In this review, we present different electron microscopictechniques and their applications for structure characteriz-ation of zeolites and mesoporous zeolite materials. We focuson transmission electron microscopic techniques, includingelectron diffraction, HRTEM/STEM imaging and electron tom-ography. Both the basics and new developments for each tech-nique will be described. We will demonstrate how various elec-tron microscopic methods are chosen and used for solvingdifferent structural problems in zeolite materials.
2. Transmission electron microscopymethods2.1 High-resolution transmission electron microscopy(HRTEM)
High-resolution transmission electron microscopy (HRTEM) isone of the most common imaging techniques used for study-ing microporous materials at atomic scale. HRTEM imagescould be obtained in a TEM with a highly coherent electronbeam source, stable optics and lenses with low aberrations.HRTEM images provide a direct, intuitive representation of theobject in real space. Comparing to diffraction methods whichaverage many, similar unit cells in an area about a fewhundred of nanometers or more, information from HRTEM islocal and reveals the local structure projection of the object.HRTEM is therefore very useful for studying non-crystallinematerials or crystals with defects.
It is important to note that HRTEM images are usually notdirectly interpretable in terms of structure projection due tovarious reasons, including dynamical effects and non-lineareffects when the electron waves are combined to form animage.3 These effects are more dominant for thick samples(>50 nm). To facilitate image interpretation, it is always rec-ommended to use as thin samples as possible for HRTEM.More significantly, the contrast of HRTEM images changeswith the imaging conditions, especially the focus of the objec-tive lens (Fig. 2). At different defocus values, the objective lensof a TEM transfers the structure to an HRTEM image differ-ently, changing the contrast of the image dramatically. Theeffects of defocus and other optical parameters on an HRTEMimage can be represented by a contrast transfer function (CTF)T (u):
TðuÞ ¼ DðuÞ sin χðuÞ ¼ DðuÞ sinðπελu 2 þ 12πCsλ
3u4Þ ð2:1Þ
where u is the length of the reciprocal vector u = ha* + kb* +lc*, λ the electron wavelength, ε the defocus value and Cs thespherical-aberration coefficient of the objective lens. D(u) is anenvelope function caused by the partial coherence of the elec-tron beam. For thin crystals, the Fourier transform of anHRTEM image I(u) and the structure factors of the crystal F(u)are related in a simple way:
IðuÞ ¼ TðuÞFðuÞ ð2:2ÞEqn (2.2) shows that the phases of F(u) and I(u) are the
same if T (u) > 0, and differ by 180° if T (u) < 0. An HRTEMimage can be interpreted directly in terms of the structure pro-jection only if it is taken under the optimum defocus con-ditions (i.e. near the Scherzer defocus) where T (u) ≈ −1. ForHRTEM images taken under other conditions, the crystallo-graphic structure factors F(u) can be obtained from theHRTEM image by CTF compensation according to eqn (2.2),where the CTF is calculated according to eqn (2.1) and itseffects are removed from the Fourier transform of the image.The defocus and astigmatism values required to calculate T (u)
Fig. 1 A schematic illustration of the different methods introduced andtheir use. Atomic structures can be determined from electron diffractionas well as 3D reconstruction based on either HRTEM or STEM images.HRTEM and STEM images can be used to obtain nanoscale structuralinformation in projection, while electron tomography is useful to getstructural information in 3D. Spectroscopic tools such as energy disper-sive X-ray spectroscopy (EDX) and electron energy loss spectroscopy(EELS) can be used to obtain chemical information, e.g. elementaldistribution.
Inorganic Chemistry Frontiers Research Article
This journal is © the Partner Organisations 2018 Inorg. Chem. Front., 2018, 5, 2836–2855 | 2837
Ope
n A
cces
s A
rtic
le. P
ublis
hed
on 2
6 Se
ptem
ber
2018
. Dow
nloa
ded
on 1
2/1/
2021
5:0
8:41
AM
. T
his
artic
le is
lice
nsed
und
er a
Cre
ativ
e C
omm
ons
Attr
ibut
ion-
Non
Com
mer
cial
3.0
Unp
orte
d L
icen
ce.
View Article Online

can be determined from the Fourier transform of the HRTEMimage, if there exists an amorphous region on the crystal.3
The CTF compensated image can be further improved byimposing the symmetry by crystallographic image processing,which is especially helpful for HRTEM images of periodicobjects with low signal to noise ratios, where the image qualitycan be improved by averaging the unit cells and imposing thesymmetry.3
In recent years, the development of aberration correctorspushed the resolution limit of TEM to the sub-Ångströmlevel.4 Aberration correctors allow in principle easier HRTEMimaging of zeolites due to the improved resolution limit.However, a major limitation of the image resolution for zeolitematerials is electron beam damage, not the TEM itself.Nevertheless, the negative spherical-aberration imaging mode,which is made available by the aberration correctors, couldprovide structural images of zeolites with improved resolution.5
HRTEM images of zeolites are usually recorded at low elec-tron dose in order to reduce electron beam damage, resultingin low signal-to-noise ratio and low resolution. To improveimage quality, multiple exposures of the same crystal area canbe made at the Scherzer defocus condition and later averagedafter sample drift correction.6 It is however difficult to reliablyfind the Scherzer defocus conditions experimentally. Instead,through-focus images consisting around 5–20 images can becollected starting from a random focus. These images are post-processed to correct for the sample drift during the exposures,compensate for the aberrations, and reconstruct a structureprojection image with much higher resolution and signal-to-noise ratio.7,8
One limiting factor for imaging beam sensitive materials isthe low detective quantum efficiency (DQE) of the detector.Recent developments of direct-detection cameras provide newpossibilities to image samples using extremely low electrondose.9 This has led to several important breakthroughs instructural biology.10 Recently the use of direct detectioncameras has made it possible to image beam sensitivematerials such as zeolites and metal organic frameworks(MOFs) with a remarkably high quality.11,12
2.2 Scanning transmission electron microscopy (STEM)
In a TEM, imaging can also be achieved by focusing the elec-tron beam into a spot and scanning it across a specimen in araster pattern.13 At each probe position, bright-field andannular dark-field (ADF) detectors positioned below the speci-men can record integrated intensities from the transmittedun-scattered and scattered electrons, respectively. The dark-field detectors are usually ring detectors with large aperturesthat collect electrons at high scattering angles (≫10 mrad). Byusing a short camera length of the microscope, it can beensured that only electrons scattered to angles much higherthan those of the Bragg diffractions are collected. The resultingimages are called high-angle annular dark-field (HAADF)-STEM images.
For HAADF-STEM imaging, the resolution (d ) of the imagesunder optimum imaging conditions is limited by the aberra-tions of the objective lens that focuses the electrons onto thespecimen:
d ¼ 0:43λ 3=4Cs1=4 ð2:3Þ
Significant progress in developing aberration correctors forTEM has been made in recent years and commercial TEMswith probe correctors are now available. The resolution ofHAADF-STEM images has been pushed down to the sub-Ångström level and makes it easier to image atomic columnsusing STEM imaging.
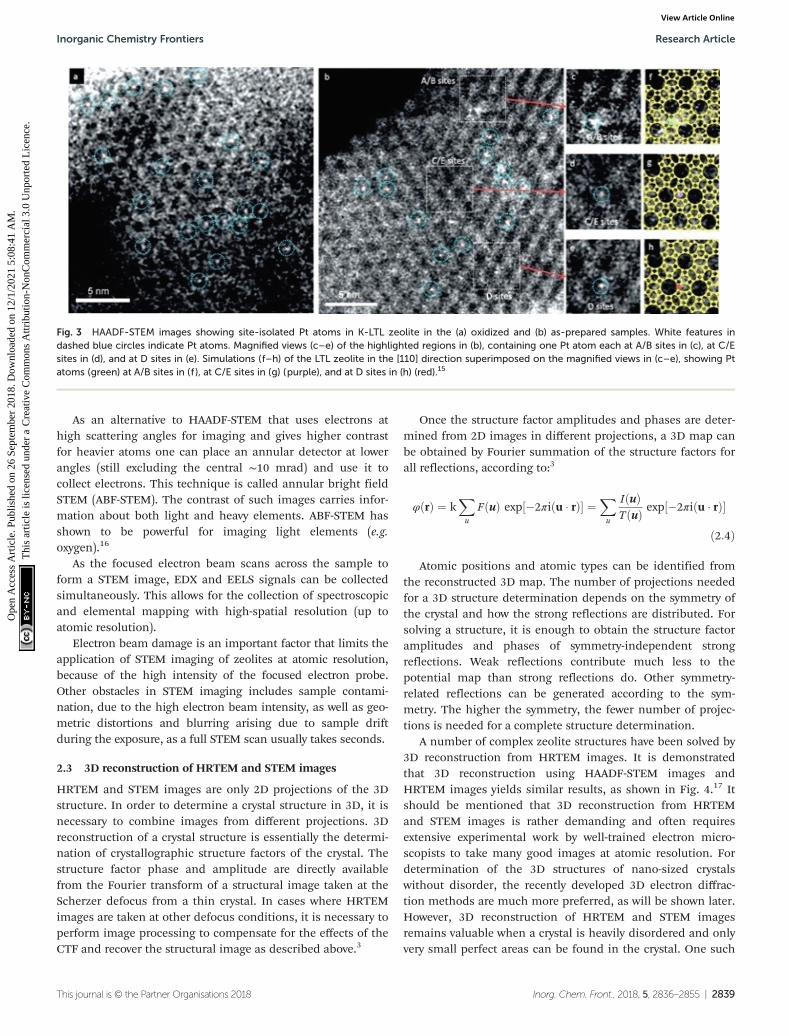
HAADF-STEM images are formed by Rutherford-scatteredelectrons and the theoretical contrast of the images is pro-portional to Z2, where Z is the atomic number. Compared toHRTEM images, the contrast of HAADF-STEM images is stron-ger and much easier to interpret. The sensitivity of theHAADF-STEM images to the atomic numbers makesHAADF-STEM very useful for visualizing metal nanocatalystsin zeolites which would be otherwise very difficult by HRTEM.With aberration correctors, HAADF-STEM is demonstrated tobe capable of imaging small Ag clusters in a zeolite-A matrix.14
and even single site-isolated Pt atoms in K-LTL zeolites15 asshown in Fig. 3.
Fig. 2 HRTEM images of ITQ-39 taken along the [100] axis at defocus 282 Å (a) and −358 Å (b). Image (b) was taken close to the Scherzer defocus,therefore atomic columns are shown as black dots. The contrast transfer functions of (a) and (b) are shown in (c).
Research Article Inorganic Chemistry Frontiers
2838 | Inorg. Chem. Front., 2018, 5, 2836–2855 This journal is © the Partner Organisations 2018
Ope
n A
cces
s A
rtic
le. P
ublis
hed
on 2
6 Se
ptem
ber
2018
. Dow
nloa
ded
on 1
2/1/
2021
5:0
8:41
AM
. T
his
artic
le is
lice
nsed
und
er a
Cre
ativ
e C
omm
ons
Attr
ibut
ion-
Non
Com
mer
cial
3.0
Unp
orte
d L
icen
ce.
View Article Online
As an alternative to HAADF-STEM that uses electrons athigh scattering angles for imaging and gives higher contrastfor heavier atoms one can place an annular detector at lowerangles (still excluding the central ∼10 mrad) and use it tocollect electrons. This technique is called annular bright fieldSTEM (ABF-STEM). The contrast of such images carries infor-mation about both light and heavy elements. ABF-STEM hasshown to be powerful for imaging light elements (e.g.oxygen).16
As the focused electron beam scans across the sample toform a STEM image, EDX and EELS signals can be collectedsimultaneously. This allows for the collection of spectroscopicand elemental mapping with high-spatial resolution (up toatomic resolution).
Electron beam damage is an important factor that limits theapplication of STEM imaging of zeolites at atomic resolution,because of the high intensity of the focused electron probe.Other obstacles in STEM imaging includes sample contami-nation, due to the high electron beam intensity, as well as geo-metric distortions and blurring arising due to sample driftduring the exposure, as a full STEM scan usually takes seconds.
2.3 3D reconstruction of HRTEM and STEM images
HRTEM and STEM images are only 2D projections of the 3Dstructure. In order to determine a crystal structure in 3D, it isnecessary to combine images from different projections. 3Dreconstruction of a crystal structure is essentially the determi-nation of crystallographic structure factors of the crystal. Thestructure factor phase and amplitude are directly availablefrom the Fourier transform of a structural image taken at theScherzer defocus from a thin crystal. In cases where HRTEMimages are taken at other defocus conditions, it is necessary toperform image processing to compensate for the effects of theCTF and recover the structural image as described above.3
Once the structure factor amplitudes and phases are deter-mined from 2D images in different projections, a 3D map canbe obtained by Fourier summation of the structure factors forall reflections, according to:3
φðrÞ ¼ kX
u
FðuÞ exp½�2πiðu � rÞ� ¼X
u
IðuÞTðuÞ exp½�2πiðu � rÞ�
ð2:4Þ
Atomic positions and atomic types can be identified fromthe reconstructed 3D map. The number of projections neededfor a 3D structure determination depends on the symmetry ofthe crystal and how the strong reflections are distributed. Forsolving a structure, it is enough to obtain the structure factoramplitudes and phases of symmetry-independent strongreflections. Weak reflections contribute much less to thepotential map than strong reflections do. Other symmetry-related reflections can be generated according to the sym-metry. The higher the symmetry, the fewer number of projec-tions is needed for a complete structure determination.
A number of complex zeolite structures have been solved by3D reconstruction from HRTEM images. It is demonstratedthat 3D reconstruction using HAADF-STEM images andHRTEM images yields similar results, as shown in Fig. 4.17 Itshould be mentioned that 3D reconstruction from HRTEMand STEM images is rather demanding and often requiresextensive experimental work by well-trained electron micro-scopists to take many good images at atomic resolution. Fordetermination of the 3D structures of nano-sized crystalswithout disorder, the recently developed 3D electron diffrac-tion methods are much more preferred, as will be shown later.However, 3D reconstruction of HRTEM and STEM imagesremains valuable when a crystal is heavily disordered and onlyvery small perfect areas can be found in the crystal. One such
Fig. 3 HAADF-STEM images showing site-isolated Pt atoms in K-LTL zeolite in the (a) oxidized and (b) as-prepared samples. White features indashed blue circles indicate Pt atoms. Magnified views (c–e) of the highlighted regions in (b), containing one Pt atom each at A/B sites in (c), at C/Esites in (d), and at D sites in (e). Simulations (f–h) of the LTL zeolite in the [110] direction superimposed on the magnified views in (c–e), showing Ptatoms (green) at A/B sites in (f ), at C/E sites in (g) (purple), and at D sites in (h) (red).15
Inorganic Chemistry Frontiers Research Article
This journal is © the Partner Organisations 2018 Inorg. Chem. Front., 2018, 5, 2836–2855 | 2839
Ope
n A
cces
s A
rtic
le. P
ublis
hed
on 2
6 Se
ptem
ber
2018
. Dow
nloa
ded
on 1
2/1/
2021
5:0
8:41
AM
. T
his
artic
le is
lice
nsed
und
er a
Cre
ativ
e C
omm
ons
Attr
ibut
ion-
Non
Com
mer
cial
3.0
Unp
orte
d L
icen
ce.
View Article Online

an example is the structure of zeolite ITQ-39, as determinedfrom two projections of HRTEM images extracted from perfectareas of only a few unit cells in size in heavily disorderedcrystals.18
2.4 Electron diffraction (ED)
Electron diffraction is an important technique for phaseidentification, determination of orientation relationship ofcrystals down to a few nanometers in size as well as determi-nation of unknown crystal structures.3 In an electron diffrac-tion pattern, the positions of diffraction spots depend on theunit cell parameters, lattice type and crystal orientation. Thus,electron diffraction can be used for the determination of unitcell parameters and lattice type, from which the possiblephases can be identified.3 If the crystal structure is known,electron diffraction can be used for determination of thecrystal orientation.19 For intergrown crystals, electron diffrac-tion can be used for determination of the orientation relation-
ship of two crystals. The intensities of the diffraction spots arerelated to the arrangements of the atoms within the unit cell –the atomic positions. If ED patterns are taken from thinenough crystals (typically <500 nm for zeolites) – so that dyna-mical effects are not very severe, atomic positions of betterthan 0.10 Å in accuracy can be achieved.20 The symmetry ofthe diffraction pattern is related to the crystal symmetry. It ispossible to determine the crystal symmetry and in most casesthe space group from the intensity distribution of the diffrac-tion spots.3 Conventionally, single zonal 2D ED patterns wereused for structural characterization. Significant developmentsand applications in 3D electron diffraction methods have beenmade in recent years and proved superior in structure charac-terization compared to the conventional 2D electrondiffraction.
2.4.1 Zonal electron diffraction. Single ED patterns areusually taken along crystallographic zone axes. Reflections thatare shown as diffraction spots in an ED pattern are those ful-
Fig. 4 (a) Aberration-corrected HAADF-STEM images (left) and HRTEM images (right) of zeolite silicalite-1 taken along the three main zone axes[010], [001] and [100]. The scale bars are 2 nm. Note that the contrast is reversed between the HAADF-STEM and the HRTEM images. The pores areblack in the HAADF-STEM images and white in the HRTEM images. (b) Reconstructed 3D map from the HAADF-STEM images (top) and the HRTEMimages (bottom), with the structure model inserted.17
Research Article Inorganic Chemistry Frontiers
2840 | Inorg. Chem. Front., 2018, 5, 2836–2855 This journal is © the Partner Organisations 2018
Ope
n A
cces
s A
rtic
le. P
ublis
hed
on 2
6 Se
ptem
ber
2018
. Dow
nloa
ded
on 1
2/1/
2021
5:0
8:41
AM
. T
his
artic
le is
lice
nsed
und
er a
Cre
ativ
e C
omm
ons
Attr
ibut
ion-
Non
Com
mer
cial
3.0
Unp
orte
d L
icen
ce.
View Article Online

filling the Bragg’s law. These reflections are located on theEwald sphere of 1/λ in radius (Fig. 5). The Ewald sphere isalmost flat for electrons due to the short wavelength (λ =0.02508 Å at 200 keV). Therefore, an ED pattern taken along azone axis represents an almost undistorted view of the recipro-cal lattice plane, or zone. The d-value of a diffraction spot hkl(dhkl) can be determined from the ED pattern according to thediffraction geometry:
dhkl ¼ Lλ=rhkl ð2:5Þ
where rhkl is the distance between the central spot 000 and thediffraction spot hkl on the recording media and L the cameralength. If the unit cell parameters of a structure are known,the indices and also the zone axis along which the diffractionpattern is taken can be found from the d-values and the anglesbetween the reciprocal vectors by matching the observedvalues with the calculated ones. An ED pattern is thus indexed.Zonal ED patterns can be used for determination of the orien-tation and crystallinity of zeolite materials, and identificationof zeolites in a sample. For an unknown zeolite, the unit cellparameters and lattice type can be determined from a series ofED patterns tilted around a common axis.3
Information about the atomic arrangements in a structureis embedded in the ED intensities. It is possible to solveunknown zeolite structures from the ED intensities extractedfrom a few zonal ED patterns of the zeolites. For example, thestructure of a large-pore, high-silica zeolite SSZ-48 was solvedand refined using intensities extracted from 11 zonal ED pat-terns.21 However, the quality of intensities from zonal ED pat-terns is rather low for structure characterization due to the
dynamical effects and excitation errors (Fig. 5). Therefore,structure solution of novel zeolites based on intensities fromzonal ED patterns is rare.
In order to obtain ED patterns with more kinematical inten-sities and higher resolution, the electron beam can be tiltedaway from the zone axis. This is the idea behind precessionelectron diffraction (PED), in which the electron beam is pre-cessed in a hollow cone around the optical axis,22 by usingeither dedicated hardware or software. The angle between theelectron beam and the optical axis is usually 1–4°. The resul-tant ED pattern is an average of the ED patterns from alldifferent beam directions. Compared to conventional zonal EDpatterns, PED patterns are less dynamical because fewer reflec-tions are excited at the same time. Tilting the beam away fromthe zone axis allows reflections to be integrated through Braggconditions and higher resolution reflections to be recorded.Although intensities from zonal PED patterns alone have beendemonstrated to be feasible for structure solution of zeolites,23
additional information from PXRD is often required. PEDintensities can be used to either solve structure projections orrepartition overlapping peak intensities for PXRD data.24
2.4.2 Three-dimensional electron diffraction. Geometry ofthe diffraction spots in electron diffraction patterns can be usedfor unit cell and space group determination. Diffraction intensi-ties can also be extracted for ab initio 3D atomic structure deter-mination. Until recently, for 3D structure determination, it wasnecessary to collect electron diffraction patterns from differentzone axes, each one very accurately and manually aligned alonga zone axis. This was very time consuming and could only becarried out by highly trained and skilled persons.
Over the last decade, there have been several importantbreakthroughs in the development of new methods to facili-tates 3D electron diffraction data collection. Early approachesfor 3D electron diffraction data collection are the automateddiffraction tomography (ADT)25 and rotation electron diffrac-tion (RED).26,27 Both methods can be used to collect almostcomplete 3D ED data using a combination of crystal tilt in dis-crete steps and fine control of the electron beam. ADT usuallyuses discrete goniometer tilts in small steps (∼1.0°) combinedwith continuous PED to cover the reciprocal space. RED com-bines discrete goniometer tilt steps (typically 2–3°) with veryfine steps of beam tilt, typically 0.05–0.20°. Both methods haveshown to be successful in structure determination of newzeolite materials, see Table 1. The collection of one 3D data setusing this stepwise approach takes around one hour.
Over the recent years a new approach for collection of 3DED data has been developed by several groups in parallel. Inall cases, the goniometer is continuously rotated around a tiltaxis during the acquisition of ED frames. Each ED framecovers an angular range that is determined by the rotationspeed of the goniometer and the exposure time. Different fromthe stepwise rotation in ADT and RED, continuous rotationelectron diffraction records integrated intensities of reflec-tions. The method is developed under different names;MicroED,28–31 fast EDT32 and continuous rotation electrondiffraction, cRED.33 An important advantage of continuous
Fig. 5 Schematic drawing illustrating the geometry of electron diffrac-tion. An electron diffraction pattern recorded on a CCD camera isapproximately an enlarged reciprocal lattice plane. The magnification ofthe microscope is represented by the camera length (L), which is typi-cally 200–2000 mm. The reciprocal lattice vector for reflection hkl hasa length of 1/dhkl, which is magnified to become rhkl on the CCD. λ is thewavelength. Due to the curvature of the Ewald sphere, most reflectionsin an electron diffraction pattern are not in the exact Bragg condition.The deviation of the reciprocal lattice point from the Ewald sphere isdescribed as the excitation error, s (see the insert).
Inorganic Chemistry Frontiers Research Article
This journal is © the Partner Organisations 2018 Inorg. Chem. Front., 2018, 5, 2836–2855 | 2841
Ope
n A
cces
s A
rtic
le. P
ublis
hed
on 2
6 Se
ptem
ber
2018
. Dow
nloa
ded
on 1
2/1/
2021
5:0
8:41
AM
. T
his
artic
le is
lice
nsed
und
er a
Cre
ativ
e C
omm
ons
Attr
ibut
ion-
Non
Com
mer
cial
3.0
Unp
orte
d L
icen
ce.
View Article Online

rotation approach is that the data collection time can be greatlyreduced (0.5–5 min). This is reflected by the fact that themethods were developed in labs working with electron beamsensitive materials and proteins. The continuous rotation datacollection can be adapted to conventional TEM setups. The dataquality and data collection speed are further increased by usinga sensitive hybrid ED detector with a fast readout speed.
ED frames collected by above mentioned 3D approachescan be processed and used to reconstruct the 3D reciprocallattice of a crystal, from which the unit cell parameters canbe easily determined. Slices perpendicular to main zone axescan be cut from the 3D reciprocal lattice and used for identifi-cation of the reflection conditions, which in turn are used todeduce the space group. Intensities of the reflections areextracted and output together with the indices for structuresolution and refinement using crystallographic software.Existing data processing software developed for single crystalX-ray diffraction, such as XDS34 and Dials35 have been adaptedto electron diffraction data and used for unit cell and spacegroup determination, as well as for generating the intensitydata input files for structure determination. A schematic repre-sentation of structure determination by RED is given in Fig. 6.
Recently a new and fully automated ED method, called serialelectron diffraction (SerialED), was developed.36 In SerialED,
individual crystals of arbitrary orientations are located automati-cally by software, and single 2D ED pattern is taken from eachof the crystals. In such a way, a large number of crystals, up to3500 per hour, can be screened. After orientation finding theED patterns are merged to a 3D data set. This method hasshown to be powerful for structure determination and phaseanalysis of beam sensitive materials, such as zeolites.36
The 3D ED methods have shown to be very powerful forstructure determination of polycrystalline zeolite crystals thatare too small to be studied by single crystal X-ray diffraction,37
including both new zeolites and zeolites that were previouslydiscovered but remained unsolved.38,39 Among the over 50 newzeolite structures that have been published since 2010, morethan 27 were solved by 3D ED alone or in combination withother techniques, see section 3.2.2 for more details. Todaycollection and processing of cRED data can be performed on aroutine basis in several groups. Despite the relatively highR-values due to dynamical scattering and other effects, 3D EDdata behave like single crystal X-ray diffraction data and can beused in a similar way for structure solution and refinementusing existing software developed for SXRD. The main differ-ence is that atomic scattering factors for electrons are usedinstead for those for X-rays. The resolution and accuracy ofthe 3D ED data are nearly comparable to those of X-ray diffrac-
Table 1 New zeolite structures solved by electron crystallography since 2006
Name Code Channel system Max ring Method(s) for structure solution Year
ITQ-38 55 ITG 3D 12 HRTEM + modelling 2012SSZ-52 6 SFW 3D 8 HRTEM + modelling 2013SSZ-61 56 -SSO 1D 18 HRTEM + modelling 2014IM-5 58,59 IMF 3D 10 HRTEM + PRXD or 3D reconstruction of HRTEM 2007ITQ-39 18 -ITN 3D 12 3D reconstruction of HRTEM 2012ECNU-5 60/SSZ-70 61 *-SVY 2D 14 3D reconstruction of HRTEM/HRTEM + PXRD + NMR 2015/2017TNU-9 62 TUN 3D 10 HRTEM + PXRD 2006SSZ-74 63 -SVR 3D 10 HRTEM + PXRD 2008SU-78 64 3D 12 HRTEM + SXRD 2012ITQ-40 65 -IRY 3D 16 ED 2010ITQ-26 66 IWS 3D 12 ED + PRXD 2008ITQ-37 67 -ITV 3D 30 ED + PRXD 2009ITQ-43 68 3D 28 ADT 2011ITQ-51 69 IFO 1D 16 RED 2013IM-17 70 UOV 3D 12 ADT 2014EMM-23 71 *-EWT 3D 24 RED 2014PKU-16 72 POS 3D 12 RED 2014PKU-14 73 3D 12 RED + PXRD 2014PST-6 74 PSI 1D 10 RED 2014ERS-18 75 EEI 2D 8 RED + PXRD 2014ITQ-53 76 -IFT 3D 14 RED 2015ITQ-54 77 -IFU 3D 20 RED 2015CIT-7 78 CSV 2D 10 RED + PXRD 2015SSZ-87 79 IFW 3D 10 RED + PXRD 2015ZSM-25 38 MWF 3D 8 RED 2015PST-20/25/26/28 38,80 3D 8 RED 2015/2016CIT-13 81 *CTH 2D 14 RED 2016ITQ-58 82 2D 8 Fast-EDT 2016EMM-26 83 EWS 2D 10 RED 2016ZSM-43 39 MRT 2D 8 RED + HRTEM 2017SCM-14 84/ITQ-62 85 SOR 3D 12 RED/Fast-EDT 2017/2018STA-20 86 SWY 3D 8 ED + PXRD + STEM 2017IM-18 50 *UOE 3D 10 RED + HRTEM 2018SYSU-3 87 3D 24 cRED 2018PST-13/14 88 POR 3D 8 cRED 2018AlPO-78 89 2D 8 HRTEM + modelling 2018
Research Article Inorganic Chemistry Frontiers
2842 | Inorg. Chem. Front., 2018, 5, 2836–2855 This journal is © the Partner Organisations 2018
Ope
n A
cces
s A
rtic
le. P
ublis
hed
on 2
6 Se
ptem
ber
2018
. Dow
nloa
ded
on 1
2/1/
2021
5:0
8:41
AM
. T
his
artic
le is
lice
nsed
und
er a
Cre
ativ
e C
omm
ons
Attr
ibut
ion-
Non
Com
mer
cial
3.0
Unp
orte
d L
icen
ce.
View Article Online

tion.38 The 3D ED method has become one of the most impor-tant method for structure determination of polycrystallinezeolite materials.
2.5 Electron tomography (ET)
Although HRTEM and HAADF-STEM images can reach atomicresolution, they are only 2D projections. To obtain 3D infor-mation it is necessary to combine images from different pro-jections, as described earlier. For non-periodic objects, such ashierarchical zeolites and zeolites containing defects, it is notpossible to obtain a complete 3D structure using images fromonly a few projections or combining images from different par-ticles. Instead, electron tomography (ET) should be applied.Electron tomography is a method for reconstructing theinterior of an object from TEM images (TEM images andSTEM images, etc.) taken along different directions. It is nor-mally collected by tilting the particle along a tilt axis with asmall angle increment and recording an image at each angle.These images can be used for tomographic reconstruction torecover a 3D volume, called tomogram, from which the 3Dstructure of the particle can be determined, as illustrated inFig. 7.40,41 Common reconstruction methods include the realspace back-projection and iterative methods. Electron tom-ography has become a powerful tool for studying zeolite crys-tals, especially zeolites containing mesoporosity and metalnanocatalysts.42 Here we will give a brief introduction aboutthe principles of electron tomography, followed by the practi-cal considerations of applying ET in characterization of porousmaterials. Later, we will present a few recent examples of theapplications of electron tomography on mesoporous zeolites.
The resolution of tomography is different in different direc-tions and is affected by various parameters. For a single-axis tiltseries, the resolution along the tilt axis is the same as theoriginal image. The resolution perpendicular to the tilt axis andelectron beam is limited by the diameter (D) of the reconstructedvolume and the number of projections (N) used. Assuming theprojections are taken over an angular range of ±90° with fixedangle increments, the theoretical resolution d is expressed as:
d ¼ πD=N ð2:6ÞIn practice, data collection is usually limited to about ±75°
around a single tilt axis because the tilt of the sample holder
Fig. 7 (a) A tilt series of images of a 3D object are recorded as projec-tions and (b) then back-projected to retrieve the 3D volume. (c) Stepsinvolved in an ET experiment from sample preparation to 3D visualiza-tion and quantification.41
Fig. 6 Schematic representation of ab initio structure determination by the rotation electron diffraction (RED) method. (a) RED data (individual EDframes) are collected by combining beam tilt and goniometer tilt. (b) Reconstructed 3D reciprocal lattice and (c–e) main zone axes cuts. Afterfurther data processing the unit cell is determined and the reflections are indexed. A resultant hkl list is then used for determination of the atomicstructure (f and g) of the crystals (here zeolite silicalite-1).37
Inorganic Chemistry Frontiers Research Article
This journal is © the Partner Organisations 2018 Inorg. Chem. Front., 2018, 5, 2836–2855 | 2843
Ope
n A
cces
s A
rtic
le. P
ublis
hed
on 2
6 Se
ptem
ber
2018
. Dow
nloa
ded
on 1
2/1/
2021
5:0
8:41
AM
. T
his
artic
le is
lice
nsed
und
er a
Cre
ativ
e C
omm
ons
Attr
ibut
ion-
Non
Com
mer
cial
3.0
Unp
orte
d L
icen
ce.
View Article Online

is restricted by the limited space between the objective polepieces of the microscope. In addition, the object may beblocked at high tilt angles by the holder itself or by othernearby objects. The missing data due to the limited tilt rangeis called the missing wedge in electron tomography. It causeselongation in the reconstructed tomogram and reduction ofthe resolution along the electron beam direction.
Tomographic reconstruction is based on the assumptionthat the images are the Radon transforms of the 3D object. Inother words, the contrast of the images is linear to the pro-jected thickness and mass of the 3D object, this is referred toas the projection requirement. Bright-field TEM images fromnon-crystalline samples have more or less mass-thickness con-trast. Therefore, applications of tomographic reconstructionon TEM images have proven successful. For crystallinematerials, however, the contrast of the images may have contri-bution from diffraction if some reflections happen to be inBragg conditions. The presence of this diffraction contrast canreduce the resolution and quality of the tomographic recon-struction. STEM images can also be used for electron tomo-graphy. The contrast of a HAADF-STEM image is directlyrelated to the atomic number Z and not affected by diffractioncontrast caused by crystal orientation compared to that of thebright-field TEM images. In principle, higher quality tomo-graphic reconstruction could be achieved using HAADF-STEMimages than using bright-field TEM. Such advantage has ledthe STEM tomography to atomic resolution in recentdevelopments.43–48
As shown in Fig. 7, the reconstructed ET tomogram can beboth visualized to examine the structure and used for quantifi-cation. In the applications of ET on zeolites, not only can the3D distribution of metal nanocatalysts and mesopores in azeolite particle be determined, but also their sizes can bequantified. For quantification, however, care should be takenwhen interpreting the results. The contrast of both bright-fieldTEM images and HAADF-STEM images changes with the focusconditions and it is important to use consistent focus settingsthroughout data collection. It is often difficult to find the rightthreshold for the segmentation of the tomograms andmeasurements from other techniques may help to achieve areliable quantification.
An alternative approach for studies of the 3D structure of amaterials is in-line holography. This approach is based on athrough-focus series of HRTEM images acquired and the exitwave reconstruction, which enables reconstruction of theatomic structure in 3D.49
3. Structural study of new zeolites byelectron crystallography
Electron crystallography has been gradually established as anessential alternative for studying the structures of porousmaterials, notably, zeolites. Since 2006, at least 40 new zeolitestructures have been reported as solved by electron crystallo-graphy alone or in combination with other techniques, as sum-
marized in Table 1. Nowadays, high resolution transmissionelectron microscopy and electron diffraction are the two maintechniques of electron crystallography for determination ofzeolite structures.
With HRTEM images, the atomic arrangements in a crystaland possible disorders can be directly visualized. Thus,HRTEM could both serve as a primary tool for structure deter-mination, and assist with useful information. HRTEM isespecially useful for studying zeolite crystals that contain dis-orders such as stacking faults, twinning and intergrowth.18,50
ED is an important technique for phase identification anddetermination of crystal orientation, for crystals down to a fewnanometers in size. Unit cell and space group information, aswell as intensities of reflections can also be obtained from EDpatterns, which can be used for structure solution of novel zeo-lites. Because ED requires a much lower electron dosage onthe sample than HRTEM does, it causes less structuraldamage of the sample. Thus ED is more suitable than HRTEMand STEM for investigating beam sensitive zeolites.
Here, we present several examples to demonstrate the appli-cations of these two methods in zeolite structural study.
3.1 Structure determination of zeolites by high resolutiontransmission electron microscopy (HRTEM)
3.1.1 Structure determination of zeolites by combiningHRTEM and model building. HRTEM images provide infor-mation about atomic arrangements in a zeolite crystal along acertain projection. Based on HRTEM images from one orseveral projections and other prior information of zeolites, itmay be possible to build a structural model of the zeolite.Many zeolite structures were solved by combining HRTEM andmodel building, especially when a zeolite contains stackingdisorders (Table 1). An early example is the structure determi-nation of zeolite beta (*BEA) reported by Newsam and co-workers in 1988.51,52 Two different stacking sequences of thepores were identified from the HRTEM images, and a struc-tural model was proposed based on the pore stacking. Othernotable early examples are the structure determination ofMCM-22 53 and SSZ-31.54 Here we present examples of recentstructure determination of three new zeolites ITQ-38 55
SSZ-61 56 and IZE-FER57 by combining HRTEM and modelbuilding.
ITQ-38 is a germanosilicate zeolite synthesized using thedicationic piperidine-derivatives as the organic structuredirecting agents (OSDAs).55 The unit cell and space group werefirst obtained from high-resolution PXRD data. However, peakoverlapping and the presence of stacking faults in the crystalsprecluded the structure solution solely from the PXRD data.HRTEM images taken along the [010] and [101] directions werethen used for the structure solution of the ITQ-38 framework.The structure projection image was reconstructed from 20through-focus HRTEM images of ITQ-38 along [010] using thesoftware QFOCUS,8 which indicated 10- and 12-ring channelsalong this direction. In addition, regions with 8- and 12-ringchannels were also found in the HRTEM images along [010],which were identified as the zeolite ITQ-22. The perfect inter-
Research Article Inorganic Chemistry Frontiers
2844 | Inorg. Chem. Front., 2018, 5, 2836–2855 This journal is © the Partner Organisations 2018
Ope
n A
cces
s A
rtic
le. P
ublis
hed
on 2
6 Se
ptem
ber
2018
. Dow
nloa
ded
on 1
2/1/
2021
5:0
8:41
AM
. T
his
artic
le is
lice
nsed
und
er a
Cre
ativ
e C
omm
ons
Attr
ibut
ion-
Non
Com
mer
cial
3.0
Unp
orte
d L
icen
ce.
View Article Online
growth of ITQ-22 and ITQ-38 indicates that the two zeolitescontain the same building layer, but with different stackings.Based on such information, a structural model of ITQ-38 wasbuilt, which was later confirmed by HRTEM images from[101], electron diffraction and Rietveld refinement from PXRDdata. ITQ-38 contains inter-connected 10- and 12-ring chan-nels along three directions. While the building layers in theITQ-38 framework are related by an inversion center, those inITQ-22 are related by a glide plane.
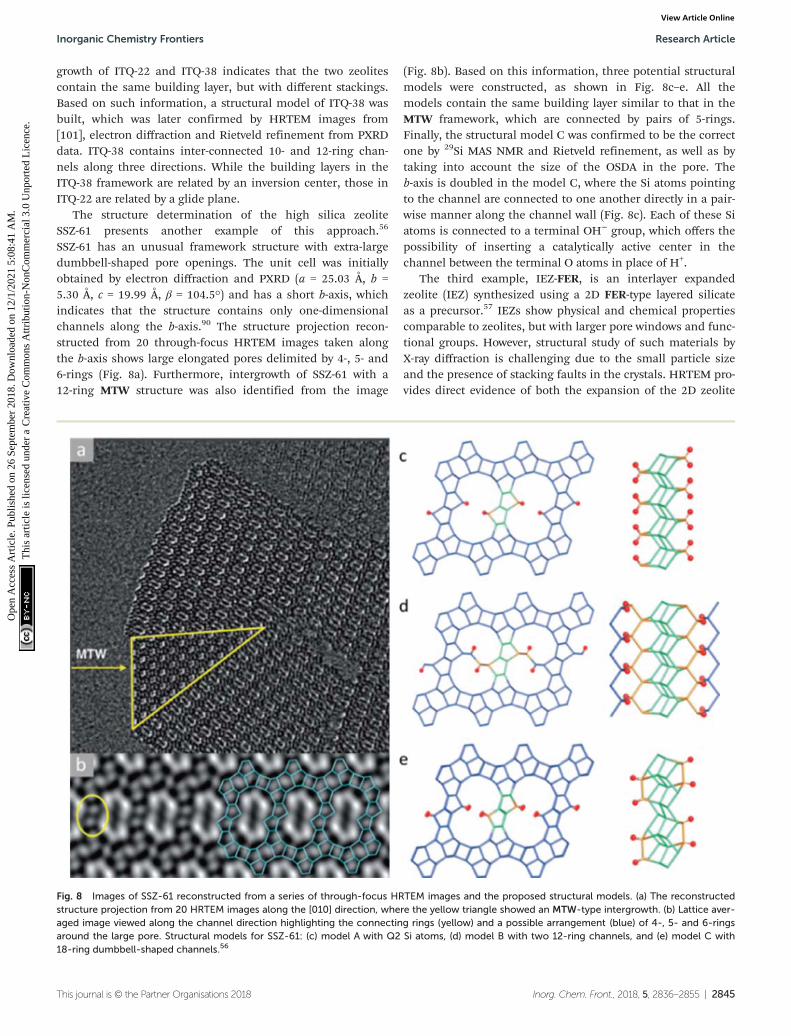
The structure determination of the high silica zeoliteSSZ-61 presents another example of this approach.56
SSZ-61 has an unusual framework structure with extra-largedumbbell-shaped pore openings. The unit cell was initiallyobtained by electron diffraction and PXRD (a = 25.03 Å, b =5.30 Å, c = 19.99 Å, β = 104.5°) and has a short b-axis, whichindicates that the structure contains only one-dimensionalchannels along the b-axis.90 The structure projection recon-structed from 20 through-focus HRTEM images taken alongthe b-axis shows large elongated pores delimited by 4-, 5- and6-rings (Fig. 8a). Furthermore, intergrowth of SSZ-61 with a12-ring MTW structure was also identified from the image
(Fig. 8b). Based on this information, three potential structuralmodels were constructed, as shown in Fig. 8c–e. All themodels contain the same building layer similar to that in theMTW framework, which are connected by pairs of 5-rings.Finally, the structural model C was confirmed to be the correctone by 29Si MAS NMR and Rietveld refinement, as well as bytaking into account the size of the OSDA in the pore. Theb-axis is doubled in the model C, where the Si atoms pointingto the channel are connected to one another directly in a pair-wise manner along the channel wall (Fig. 8c). Each of these Siatoms is connected to a terminal OH− group, which offers thepossibility of inserting a catalytically active center in thechannel between the terminal O atoms in place of H+.
The third example, IEZ-FER, is an interlayer expandedzeolite (IEZ) synthesized using a 2D FER-type layered silicateas a precursor.57 IEZs show physical and chemical propertiescomparable to zeolites, but with larger pore windows and func-tional groups. However, structural study of such materials byX-ray diffraction is challenging due to the small particle sizeand the presence of stacking faults in the crystals. HRTEM pro-vides direct evidence of both the expansion of the 2D zeolite
Fig. 8 Images of SSZ-61 reconstructed from a series of through-focus HRTEM images and the proposed structural models. (a) The reconstructedstructure projection from 20 HRTEM images along the [010] direction, where the yellow triangle showed an MTW-type intergrowth. (b) Lattice aver-aged image viewed along the channel direction highlighting the connecting rings (yellow) and a possible arrangement (blue) of 4-, 5- and 6-ringsaround the large pore. Structural models for SSZ-61: (c) model A with Q2 Si atoms, (d) model B with two 12-ring channels, and (e) model C with18-ring dumbbell-shaped channels.56
Inorganic Chemistry Frontiers Research Article
This journal is © the Partner Organisations 2018 Inorg. Chem. Front., 2018, 5, 2836–2855 | 2845
Ope
n A
cces
s A
rtic
le. P
ublis
hed
on 2
6 Se
ptem
ber
2018
. Dow
nloa
ded
on 1
2/1/
2021
5:0
8:41
AM
. T
his
artic
le is
lice
nsed
und
er a
Cre
ativ
e C
omm
ons
Attr
ibut
ion-
Non
Com
mer
cial
3.0
Unp
orte
d L
icen
ce.
View Article Online

interlayers and the presence of stacking faults, and is powerfulfor investigation of such materials. Because IEZ-FER was pre-pared by treating an FER-type precursor with diethoxydi-methylsilane, the structural model was assumed containingthe FER layers, while how these layers are connected was yet tobe confirmed. HRTEM images of the calcined IEZ-FER weretaken, which showed that the pillaring of the T sites in theinterlayer space leads to a 3D framework with 12- and 10-ringchannels along the [001] and [010] directions, respectively. Thepentasil layer, which is identical to the layer of FER, could beclearly seen from the HRTEM images. Besides, some defectswere also observed in HRTEM images which are formed by a1/2b shift of the FER layer.
3.1.2 Structure determination of zeolites by 3D reconstruc-tion of HRTEM images. As described in section 2.3, HRTEMand STEM images from different projections of a crystal can beused to reconstruct the 3D map for structure determination.Silicalite-1 with the MFI-type framework was used as anexample to demonstrate the 3D reconstruction method fromHRTEM and STEM images. This technique was also appliedfor the structure solution of ITQ-39 18 and IM-5 59 and zeolitebeta polytype B.91
The complex intergrown zeolite ITQ-39 with a three-dimen-sional intersecting pairwise 12-ring and 10-ring pore system18
was solved by 3D reconstruction of HRTEM images. ITQ-39exhibited very promising results in alkylation of aromaticswith olefins. Its PXRD pattern shows peak broadening causedby stacking faults and intergrowth of nano-sized domains.Structure projection images of ITQ-39 along [010] and [100]were reconstructed from the through-focus series of 20HRTEM images (Fig. 9a and b), which show that the crystaldomains are only a few unit cells in size. Large pairwise12-ring channels and small twin domains could be clearlyobserved along [010] (Fig. 9a). The 10-ring channels stacked inthe c*-direction and stacking faults could be observed fromthe images along [100] (Fig. 9b). The structure factor ampli-tudes and phases were extracted from the Fourier transformsof the small domains marked in Fig. 9a and b. A 3D electro-static potential map was reconstructed from the 53 strongestreflections (Fig. 9c), from which all 28 unique Si atoms couldbe located. The structures of two other polytypes ITQ-39A andITQ-39C were deduced from ITQ-39B based on the stackingsequences observed in Fig. 9b.
3.1.3 Structure determination of zeolites by combiningHRTEM and powder X-ray diffraction. HRTEM images provideessential information for structure determination. However,acquisition of high quality images is a challenging task, andrequires great experimental skills and patience because zeo-lites are often electron beam sensitive. PXRD data is mucheasier to obtain. In cases where it is difficult to obtainsufficient information by HRTEM alone, it is possible to solvethe structure by combining HRTEM with PXRD.
The first example that PXRD and HRTEM data were com-bined for structure determination is the high-silica zeoliteTNU-9 with 3D 10-ring channels.62 High quality HRTEMimages of TNU-9 were recorded along the [010], [001] and
[−110] directions. Although the projection along [010] issimilar to that of MFI, attempts to solve the structure by modelbuilding based on these images failed. The zeolite-specificstructure solution program FOCUS92 was applied on the PXRDdata, however, no reasonable solution was obtained. By usingthe structure factor phases (in total 258) obtained from theHRTEM images taken along the three projections as the start-ing phases to the program FOCUS, the structure solution wasfound. The framework of TNU-9 contains 24 symmetry-inde-pendent Si atoms, which was then the most complex zeolitestructure solved.
The high-silica zeolite IM-5 with 2D 10-ring channels58 isan important catalyst for hydrocarbon cracking and NOreduction. Its properties could not be fully understood withoutthe detailed crystal structure information. The large unit cell(a = 14.299 Å, b = 57.413 Å, and c = 20.143 Å) makes it difficultto solve the structure by PXRD alone using standard ab initiostructure solution methods. HRTEM images were taken alongthe three main zone axes of IM-5 (Fig. 10a–c), from which arough structural model was built. 95 structure factor phasescalculated from the model these were input in the powdercharge-flipping (pCF) algorithm implemented in the programSuperflip93 and a structural model with improved bond geome-tries could be obtained and finally refined against the PXRDdata. SSZ-74 is a high silica zeolite with 3D 10-ring channels63
and shows good catalytic properties for a wide variety of reac-tions. Only one HRTEM image of relatively low resolution
Fig. 9 Structure projection images reconstructed from 20 HRTEMimages along (a) [010] and (b) [100] of ITQ-39. 10-ring channels areobserved in (b), and the channel stacking is traced by a line in (b). Thedomains used for structure factor determination are outlined by the rec-tangles. (c) The 3D electrostatic potential map reconstructed from thestructure factor amplitudes and phases extracted from the marked nanodomains in (a) and (b).18
Research Article Inorganic Chemistry Frontiers
2846 | Inorg. Chem. Front., 2018, 5, 2836–2855 This journal is © the Partner Organisations 2018
Ope
n A
cces
s A
rtic
le. P
ublis
hed
on 2
6 Se
ptem
ber
2018
. Dow
nloa
ded
on 1
2/1/
2021
5:0
8:41
AM
. T
his
artic
le is
lice
nsed
und
er a
Cre
ativ
e C
omm
ons
Attr
ibut
ion-
Non
Com
mer
cial
3.0
Unp
orte
d L
icen
ce.
View Article Online

taken along [110] was obtained, from which 29 structure factoramplitudes and phases could be derived. Such informationwas used to construct a structure envelope that defines the full3D channel system, within which no framework atoms areexpected. The structure envelope was imposed in real space inthe pCF algorithm to eliminate any electron density in thepores. Finally, the structural model was obtained from thePXRD data using the pCF algorithm implemented in Superflip.Subsequent Rietveld refinement showed that the structure ofSSZ-74 has ordered vacancies which were not observed beforein zeolites.
3.2 Structure determination of zeolites by electron diffraction
3.2.1 Structure determination using zonal electron diffrac-tion. Electron diffraction is often combined with PXRD forstructure determination of zeolites, as these two techniquesare remarkably complementary. PXRD suffers from peak over-lapping, while the strong interaction between electrons andmatter results in complicated dynamical effects in ED, whichcause the ED intensities deviating from the kinematicalassumption. Therefore, ED intensities are often used to assiststructure solution by PXRD, for example for identification ofthe weak reflections and pre-repartitioning of overlappingreflections in PXRD data.
Such a strategy was applied for solving the structure of agermanosilicate, ITQ-37 (space group P4132/P4332, a = 26.5126(3)Å).67 The high degree of overlapping reflections (>94%) andpeak broadening due to the small crystal sizes posed greatchallenges for the structure determination by PXRD alone.
Because ITQ-37 is too electron beam sensitive to obtain highquality HRTEM images, selected area zonal electron diffractionpatterns along the [100], [110], [111] and [120] directions wererecorded and used for the pre-repartitioning of the overlappingreflections in PXRD. The pCF algorithm implemented inSuperflip was applied for the structure solution based on theimproved PXRD intensities after pre-repartitioning. Tenunique T atoms and 18 out of the 19 unique oxygen atomswere automatically located from the electron density map. Themissing oxygen atom was identified and thus added manuallybetween two T-sites. The final framework structure was con-firmed by Rietveld refinement. ITQ-37 is the first chiral zeolitewith a gyroidal channel system and extra-large 30-ring poreopenings.
For three-dimensional structures, a single projection isusually not sufficient for a complete structure determination.Phases for certain projections could be determined from EDdata and then used in combination with PXRD data in thesame way as those derived from HRTEM images. Forinstance, structure factor phases of ITQ-26 were deducedfrom the integrated ED intensities of 41 hk0 and 17 0kl reflec-tions by maximum entropy and likelihood.66 These phaseswere used as the constraint for subsequent phasing trials ofthe PXRD data using the program FOCUS. A structural modelof ITQ-26 was found and later refined by Rietveld methods.The structure comprises 7 unique T-sites forming a 3Dframework with one straight 12-ring channel along [001] andtwo 12-ring channels tilted with respect to the straight12-ring channel.
Fig. 10 HRTEM images of IM-5 taken along (a) [100], (b) [001] and (c) [010]. (d) Electron density map from pCF that was used to derive the structureof IM-5. A stick model of the final refined structure of IM-5 has been superimposed for comparison.58
Inorganic Chemistry Frontiers Research Article
This journal is © the Partner Organisations 2018 Inorg. Chem. Front., 2018, 5, 2836–2855 | 2847
Ope
n A
cces
s A
rtic
le. P
ublis
hed
on 2
6 Se
ptem
ber
2018
. Dow
nloa
ded
on 1
2/1/
2021
5:0
8:41
AM
. T
his
artic
le is
lice
nsed
und
er a
Cre
ativ
e C
omm
ons
Attr
ibut
ion-
Non
Com
mer
cial
3.0
Unp
orte
d L
icen
ce.
View Article Online

3.2.2 Structure determination using 3D rotation electrondiffraction. The methods for collection of 3D electron diffrac-tion data, using both the stepwise and continuous techniques,have been introduced in section 2.4.2. Similar to SXRD data,3D ED data can be used for structure solution by directmethods, charge-flipping and real-space methods. The 3D EDtechniques are advantageous in applications to sub-micronand nano-sized crystals. Structure solutions of at least 27 newzeolite structures using 3D ED data have been reported since2010, see Table 1. Here, we present two examples of structuredetermination of new zeolites, ITQ-58 82 and PST-13/14 88 byusing the continuous rotation technique.
The new borosilicate zeolite ITQ-58 has a 2D 8-ringchannel system.82 The material crystallizes in the triclinicspace group P1̄. The low symmetry prevented structure solu-tion from other methods. In order to solve the structure, fast-EDT32 data were collected by using a continuous mechanicaltilt of the crystal during acquisition of diffraction patterns.The integration of the continuous tilting of the crystal wascomplemented by precession electron diffraction. Each dataset covered a tilt range of 50° and were collected in ∼30 s. Theshort acquisition time was important to minimize the elec-tron beam damage. Five data sets from five different crystalswere collected and analyzed independently. One of the datasets was identified to be an impurity phase, zeolite STF. Fromeach of the remaining data sets the same triclinic unit cellcould be obtained. Due to the low data completeness, it wasnot possible to obtain a structural model from the individualdata sets. After combining the four data sets a merged dataset with 41% completeness and 0.88 Å resolution could beobtained. Using direct methods implemented in the softwareSIR2014,94 a structure solution could be obtained where all16 Si and 18 out of 32 O atom positions could be obtained.The remaining 14 O atoms could be found after successivedifference Fourier map analysis. A least squares refinementresulted in a refinement R1 of 31.9% using 64 restrains on Si–O distances. The final structural model was confirmed by per-forming a Rietveld refinement resulting in residuals of Rwp =0.086 and Rexp = 0.027.
The two related aluminophosphate molecular sieves,PST-13/14, were synthesized using diethylamine as organicstructure-directing agent and has a 3D 8-ring channelsystem.88 The structure of PST-13 contains five coordinatedframework Al atoms with bridged hydroxyl groups. Upon calci-nation, PST-13 undergoes a transformation to PST-14 with lossof these bridging hydroxyl groups creating a tetrahedral frame-work. The transition of 5-coordinated to tetrahedral Al specieswas also confirmed by 27Al NMR. In order to determine thestructures of PST-13/14. cRED data was collected using a sensi-tive Timepix hybrid detector with a read out time of just 8 ms.This minimized the loss of data during the continuous tilt.The cRED data was collected with a tilt speed of 0.45° s−1 anda very low beam dose of ∼0.1 e− Å−2 s−1 (Fig. 11). The spacegroup of both PST-13 and 14 was determined from the cREDdata to be P4̄21c. The tilt ranges of the data sets used for struc-ture determination was 121° and 130° respectively and with a
resolution up to 0.78 Å. The completeness of the data setswere 97.7% and 90.0% following the large tilt range andhigh symmetry. The structure was solved using the softwareSIR2014 94 and refined using SHELXL.95 The refinement wasperformed without the need to use restraints on distances andconverged to R1 of 20.1% for PST-13 and 29.9% for PST-14. Thefinal structure of PST13/14 has 8 distinct T-site (T = Al, P) atomsand a framework density of 16.9. Following the structure deter-mination by cRED a Rietveld refinement was performed whichconverged at Rwp and Rp of 0.090 and 0.066 for dehydratedPST-13 and 0.070 and 0.051 for dehydrated PST-14, respectively.
4. Applications of electron microscopyfor studies of zeolite materials
4.1 Studies of nano-sized zeolites using electron microscopy
Besides structure determination, electron microscopy has alsobeen used for the observation and identification of nano-sizedzeolites. Nano-zeolites show improved catalytic activities indiffusion-limited reactions, and have attracted steady interests.TEM is an important tool for studying the structure of suchnano-zeolites.
One notable example is the single unit cell thick ZSM-5crystals that were synthesized using a purpose designed di-
Fig. 11 (a) The reconstructed 3D reciprocal lattice of PST-13 (top) andPST-14 (bottom) viewed perpendicular to the rotation axis. (b, c) 2D sec-tions through the reciprocal lattice corresponding to (b) hk0 and (c) 0kl.(d) The structures of PST-13 (left) and PST-14 (right) with Al in light blue,P dark gray and O in red.88
Research Article Inorganic Chemistry Frontiers
2848 | Inorg. Chem. Front., 2018, 5, 2836–2855 This journal is © the Partner Organisations 2018
Ope
n A
cces
s A
rtic
le. P
ublis
hed
on 2
6 Se
ptem
ber
2018
. Dow
nloa
ded
on 1
2/1/
2021
5:0
8:41
AM
. T
his
artic
le is
lice
nsed
und
er a
Cre
ativ
e C
omm
ons
Attr
ibut
ion-
Non
Com
mer
cial
3.0
Unp
orte
d L
icen
ce.
View Article Online

quaternary ammonium-type surfactant. The long alkyl chainsof the structure-directing agent prevented the growth of thecrystals in one dimension. This material was characterizedusing HRTEM imaging where it was possible to show that thematerial was growing as flakes of MFI type zeolite with a thick-ness of just one unit cell along the crystallographic b-axis.96
TEM was used to study the growth mechanism of zeolitesilicalite-1 in a clear solution aged for 40 months at roomtemperature, in a study by Liang and co-workers.97 TEMimages revealed the aggregation of nano-sized crystallinebuilding units (1–4 nm in thickness) into larger crystallinezeolite particles (15–30 nm) even without heating. HRTEMimages and their Fourier transforms show that these smallnano-slabs preferentially stacked along the a or b crystallo-graphic directions. These TEM studies support the modeldescribing the formation of silicalite-1 as a successive aggrega-tion process of structured building blocks.
A similar system, TPA-silicalite-1, was studied by applyingcryogenic transmission electron microscopy (cryo-TEM), byKumar and co-workers.98 After keeping the TPA-silica sols atroom temperature for 200 days, some aggregate-like larger par-ticles (30–50 nm) were observed by TEM, which were stillamorphous. After 220 days, aggregates with a similar size asthe 200-day sample were observed, but now exhibit latticefringes that are consistent with those of silicalite-1. This obser-vation suggests that the amorphous particles transformed tosilicalite-1 crystals sometime between 200 and 220 days. Thisstudy points out the formation of predominantly amorphousaggregates before the MFI crystallization and also shows theimportance of the intra-aggregate rearrangements in thenucleation and growth of zeolites.
HRTEM was also employed to study the synthesis of nano-sized template-free zeolites. Ng and co-workers investigatedthe very early stages of zeolite crystallization in colloidalsystems, which can provide access to important nanoscalezeolite phases while avoiding the use of expensive organic tem-plates.99 They reported the effective synthesis of ultra-small(6–15 nm) crystals of the large-pore zeolite EMT from tem-plate-free colloidal precursors at low temperature (30 °C) withvery high yield. HRTEM images of the solid particles extractedat different crystallization times revealed the presence of amor-phous gel after 8 to 14 hours of heating at 30 °C. After24 hours of heating, ultra-small crystallites of zeolite EMTappeared in the amorphous matrix, which was further con-firmed by the broad amorphous peak and low intense Braggpeaks in the PXRD pattern. After 36 hours of heating, theamorphous particles turned completely into EMT nanocrystals,as shown by well-defined hexagonal shapes and crystallinefringes in the TEM images (Fig. 12). The individual crystalshave sizes of 10 to 15 nm and thickness of 2 to 3 nm.
4.2. Applications of electron tomography on hierarchicalzeolites
For 3D structure determination of periodic structures such aszeolites and ordered mesoporous materials, electron crystallo-graphy (EC), for example electron diffraction and 3D recon-
struction of HRTEM and STEM images from different zoneaxes can be used. For studying hierarchical zeolites containingdisordered mesopore structures or having the 3D distributionof metal nanocatalysts in zeolites, electron tomography is themethod of choice. EC and ET are complementary to eachother. While EC can reach atomic resolution (better than0.3 nm to resolve Si sites), the resolution of conventional ET isonly 1–4 nm. ET provides unique information about the sizeand shape of the mesopores, and their distribution and con-nectivity in hierarchical mesoporous zeolites. Electron tomo-graphy has successfully been utilized for, e.g. studying size anddistribution of metal nanoparticle inside zeolites100 and meso-pores in zeolites.101–105 Here we show a few examples of recentwork of mesoporous zeolites studied by electron tomographycombined with other techniques.
4.2.1 Quantification of Pt nanoparticles in mesoporouszeolite Y. Bifunctional catalysts can be obtained by introduc-tion of metal nanoparticles into zeolites. Zečević and co-workers successfully combined electron tomography withimage analysis to perform detailed qualitative and quantitativeanalysis of the structure of bifunctional Pt-supported zeolite Ycatalysts.100 They optimized the imaging conditions and madeit possible to locate for the first time 3D distribution of Pt par-ticles as small as 1 nm inside the micropores of zeolite Y(Fig. 13). They found that the Pt loading varied dramaticallyfrom crystal to crystal in the same sample, up to a factor of 35.Despite the Pt loading variations in different crystals, the Pt
Fig. 12 TEM images showing the process of nucleation and growth ofthe ultra-small EMT crystals from template-free colloidal precursors. (A)Amorphous-shaped particles in the template-free precursor suspensionafter 8 to 14 hours. (B) Birth of ultra-small EMT nuclei after 24 hours. (C)Fully crystalline ultra-small EMT after 36 hours of conventional heatingat 30 °C. Scale bars, 10 nm.99
Inorganic Chemistry Frontiers Research Article
This journal is © the Partner Organisations 2018 Inorg. Chem. Front., 2018, 5, 2836–2855 | 2849
Ope
n A
cces
s A
rtic
le. P
ublis
hed
on 2
6 Se
ptem
ber
2018
. Dow
nloa
ded
on 1
2/1/
2021
5:0
8:41
AM
. T
his
artic
le is
lice
nsed
und
er a
Cre
ativ
e C
omm
ons
Attr
ibut
ion-
Non
Com
mer
cial
3.0
Unp
orte
d L
icen
ce.
View Article Online

size distribution was narrow (1.0–1.5 nm), which was close tothe size of the micropores (1.3 nm). Some larger (3–4 nm indiameters) Pt particles were also found inside the microporesystem, which indicates that neighbouring micropores werecollapsed upon particle growth. Semi-automated image ana-lysis was developed to quantify the numbers, size distribution,and interparticle distances of thousands of Pt particles withinindividual zeolite crystals (Fig. 13). Since the relative amountof metal and acid active sites and their vicinity play a crucialrole in the selectivity, the heterogeneities of Pt loading at thelevel of individual crystals might be an important factor formacroscale catalyst performance. Electron tomography com-bined with image analysis suggests that new synthesis pro-cedures are needed to optimize the Pt loading with lowernominal Pt loading. This example demonstrates that the quan-titative analysis of the local information in a catalyst by a com-bination of electron tomography and image analysis is apowerful tool to complement bulk characterization techniques.This is essential to understand structure-performance relation-ships in complex structures such as bifunctional catalysts.
4.2.2 Quantification of mesopores in zeolite Y. Zeolite Y isone of the most important catalysts for oil refining and petro-chemistry. In order to enhance the mass transport, mesoporesare introduced in zeolite Y. Electron tomography was appliedto mesoporous zeolites for both visualization of the interior ofthe materials and quantification of the mesopores. By combin-ing electron tomography with other techniques such as nitro-gen physisorption and mercury porosimetry, the connectivitybetween the mesopores and the external surface of the crystalscan be both visualized and quantified.102 Moreover, electrontomography is shown to be a stand-alone method for providing
quantitative information about mesoporous zeolites, such asmesopore size distribution, accessibility of mesopores and tor-tuosity of the mesopores.
Zečević and co-workers presented an excellent example ofthe application of electron tomography and image analysis instudying the mesoporosity in a zeolite Y.102 Bright-field TEMimages were collected within ±75° at a tilt step of 1° or 2°.While each individual TEM image indicates the presence of acomplex mesopore network, the reconstructed 3D tomogramsshowed much more clearly the presence of channel-like meso-pores and their connectivity than the images did, as shown inFig. 14a and b. After image processing by segmentation, voxelsin the tomogram that belong to the mesopores are separatedfrom those belonging to the micropore solid. This allowedquantification of the important properties of the mesoporenetwork with regard to its accessibility. Mesopores that areopen and accessible from the outer surface, could be separatedfrom those which are closed and can only be accessed fromthe outer surface through the micropores, as shown in Fig. 14cand d. The volumes and diameters of the mesopores werequantified. Quantitative information about the diameter of themesopores enabled the identification and quantification ofthe so-called ‘constricted’ mesopores which can be reachedthrough narrow openings.
4.2.3 Orientation relationship between the intrinsic micro-pores of zeolite Y and mesopore structures. Mesoporous zeo-lites with well-defined and tuneable pores are desirable forindustrial applications. Garcia-Martinez and co-workers intro-duced size-tailored mesoporosity (2–6 nm) into commercialzeolite Y crystals by a simple surfactant-templating post-syn-thetic modification process, controlled by the size of the sur-factant micelles.104 The resulting mesostructured zeolite Yshowed significantly improved product selectivity of the FCCcatalysts in both laboratory testing and refinery trials. Fig. 15aand b show high-resolution low voltage SEM images of mesos-tructured Y crystals. Mesopores can be clearly seen both on thesurfaces of the crystals (Fig. 15a) and inside the crystals(Fig. 15b) where a flat cross-section of the crystal was preparedby cross-section polishing (CP) using argon ion milling.
Electron tomography was used to study the distributionand connectivity of mesopores in 3D in the zeolite.104 Becausethe resolution of ET was limited to a few nanometers, it wasnot possible to resolve the micropores (<2 nm) in zeolites. Toinvestigate the hierarchical structure from atomic to mesoscale of the same mesostructured Y crystal, the 3D REDmethod was combined with ET (Fig. 15). The electron diffrac-tion patterns taken at an arbitrary crystal orientation (Fig. 15c)showed that the mesoporous Y crystals were of high crystalli-nity. The 3D reciprocal lattice reconstructed from the RED datashows that the particle contains two sets of crystal lattices ofzeolite Y, indicating the presence of twinning (Fig. 15e). Theorientation relationship between the twin components as wellas their orientations in relation to the particle could bededuced. The tomogram reconstructed from the ET imagesshows clearly that uniformly-sized mesopores are distributedthroughout the crystal. The pore architecture and the connec-
Fig. 13 Electron tomography and image analysis study of a Pt-HY30-Rcrystal. (a) TEM at 0° tilt angle; black dots are 5 nm gold particles usedfor the alignment of the tilt images; (b) 0.32 nm thick reconstructionslice from the middle of the zeolite crystal shown in (a). (c) Enlargedregion (b) highlighting the presence of larger Pt particles. White streaksemerging from the Pt particles are artefacts of the weighted back-pro-jection reconstruction and should not be confused with the presence ofmesopores. (d) Volume and iso-surface rendering shows segmented Ptparticles (blue), zeolite crystal (green), and mesopores (white). (e) Pt sizedistribution, volume-averaged Pt diameter, and total number ofmeasured Pt particles. (f ) Surface-to-surface distances of first andsecond nearest neighbouring Pt particles.100
Research Article Inorganic Chemistry Frontiers
2850 | Inorg. Chem. Front., 2018, 5, 2836–2855 This journal is © the Partner Organisations 2018
Ope
n A
cces
s A
rtic
le. P
ublis
hed
on 2
6 Se
ptem
ber
2018
. Dow
nloa
ded
on 1
2/1/
2021
5:0
8:41
AM
. T
his
artic
le is
lice
nsed
und
er a
Cre
ativ
e C
omm
ons
Attr
ibut
ion-
Non
Com
mer
cial
3.0
Unp
orte
d L
icen
ce.
View Article Online

tivity of the mesopores are intuitively illustrated from the porestructural model reconstructed by electron tomography(Fig. 15f). More detailed pore structures and connectivity ofthe bulk sample were obtained by advanced gas sorptionmeasurements.104
4.3. Analysis of metal sites in zeolites at atomic resolution
Due to its sensitivity to the atomic numbers, HAADF-STEMimaging can be used to detect metal species in zeolite struc-tures. With this technique, it is possible to observe singleheavy atoms or small metal clusters in zeolites. It can providedirect local information about the catalytic species that are notattainable with spectroscopic and traditional microscopictechniques.
HAADF-STEM imaging was employed to determine thelocations of the Pt atoms in zeolite K-LTL as a CO oxidationcatalyst.15 The infrared (IR) and extended X-ray absorption finestructure (EXAFS) studies showed that [Pt(NH3)4]
2+ complexeswere present in the zeolite. The HAADF-STEM images shownin Fig. 3 confirmed the absence of platinum clusters andshowed exclusively the site-isolated single Pt atom speciesboth before and after oxidation. By carefully analyzing theprecise Pt locations, the [Pt(NH3)4]
2+ complexes presentinitially were located primarily at the D sites in the largestpores (66%). The others were in smaller pores (23% in A/B)sites and 11% in C/E sites. Some Pt atoms moved as a result ofthe oxidation, with the approximate population present in thelargest pores decreasing to 56%, while that in the medium-sized A/B pores remained almost unchanged at 24% and thatin the smallest C/E pores increased to 20%.
Aberration-corrected HAADF-STEM imaging was alsoapplied to investigate heavy metal ion-exchanged zeolites, suchas a Ag ion exchanged zeolite A.14 The incorporation of silverinto the zeolite resulted in the formation of a material withantibacterial activity and with particular applications for therecovery of radioactive materials. Both NaA (sodium zeolite A)and AgA (silver zeolite A) were imaged. The NaA image showedthat the black parts correspond to the parts with no mass,which are zeolite alpha cages, linked to each other by the soda-lite cages. For AgA, because of the large difference between theatomic number of silver and those of the species in the zeoliticframework (Al and Si), it is rather difficult to observe thezeolite framework and only four atomic columns formingsquares or nine columns were identified (Fig. 16). The distancebetween the atoms located at the corners was around 4.72 Å,which can be attributed to Ag located at the 6-rings formingthe sodalite cages, and matched well with the value from themodel by Rietveld refinement. The distance between the Agcolumns in the adjacent sodalite cages was found to beapproximately 7.41 Å, close to that in the model (7.57 Å).Besides, the analysis of the intensity of atomic columns indi-cated the formation of a silver octahedron inside the sodalitecages surrounded by eight cations, each located in the centerof a 6-ring.
In a recent study Altantzis and co-workers used aberrationcorrected HAADF-STEM imaging in combination with PXRD tovisualize the atomic arrangement of luminescent Ag clustersinside zeolites X and Y.106 They showed that the difference incomposition between the two zeolites affected the arrange-ment of Ag atoms inside the pores of the material. Knowledge
Fig. 14 (a) TEM micrograph from a tilt series showing the presence of a complex mesopore network in the mesoporous zeolite Y sample and (b) avirtual slice from the middle of the reconstructed volume obtained by electron tomography showing the presence of channel-like mesopores dis-tributed throughout the crystal. Accessibility of the mesopores was described and quantified using image processing. The open and “closed” meso-pores are shown in green (c) and red (d), respectively, in the 3D volume.102
Inorganic Chemistry Frontiers Research Article
This journal is © the Partner Organisations 2018 Inorg. Chem. Front., 2018, 5, 2836–2855 | 2851
Ope
n A
cces
s A
rtic
le. P
ublis
hed
on 2
6 Se
ptem
ber
2018
. Dow
nloa
ded
on 1
2/1/
2021
5:0
8:41
AM
. T
his
artic
le is
lice
nsed
und
er a
Cre
ativ
e C
omm
ons
Attr
ibut
ion-
Non
Com
mer
cial
3.0
Unp
orte
d L
icen
ce.
View Article Online

regarding the different arrangement of the Ag atoms could beused to explain the altered luminescent behavior of the twomaterials.
5. Conclusions and future prospects
We have presented different electron microscopic techniquesand their applications for structure characterization of zeolitematerials. We have demonstrated how various electron micro-scopic methods are chosen and used for solving differentstructural problems and how these methods can be applied incombination with other techniques, for example powder X-raydiffraction and solid-state NMR. Electron diffraction can beused for phase identification, unit cell and space group deter-mination of crystals too small to be studied by single crystalX-ray diffraction or too complex to be studied by powder X-raydiffraction. The recently developed 3D electron diffractiontechniques have shown to be very efficient and powerful forab initio structure determination of novel zeolites. HRTEM andSTEM have unique advantages for structure determination,
because both the structure factor amplitudes and phases canbe directly obtained from the images. Both TEM and STEMcan provide atomic resolution. Compared to HRTEM the con-trast of HAADF-STEM images is more sensitive to atomicnumbers, therefore HAADF-STEM is very useful for revealingmetal clusters in zeolite catalysts. 3D atomic structure can beobtained by 3D reconstruction of HRTEM and HAADF-STEMimages from different projections. This technique is especiallyuseful for structure determination of zeolites with disorders,in which only small ordered areas are available. For 3D struc-ture characterization of zeolites with disordered mesopores orcontaining metal nano-particles, electron tomography is themethod of choice. The 3D structures can be visualized andeven quantified.
We have shown that transmission electron microscopy is avery powerful tool for structure characterization of zeolites.However, there are still several challenges to overcome so thatrich and accurate structural information can be obtainedroutinely in the application of the TEM techniques in zeolites.
For structure determination of new zeolite structures, therecently developed new electron diffraction techniques havemade the collection of single crystal 3D ED data on a TEMalmost as feasible and fast as that on a single crystal X-raydiffractometer, but from crystals millions times smaller.Data processing and structure determination software devel-oped for X-ray diffraction can be used for electron diffractiondata. The accuracy of the structure determination of zeolitescan reach better than 0.10 Å. The main challenge thatremains is to further improve the quality of ED intensitiesand minimize or take into account dynamical effects in
Fig. 16 (a) Aberration-corrected HAADF-STEM image of AgA along the[001] direction, where the white spots are single atomic columns andthe black arrows point to Ag clusters in the alpha cages. (b, c) Fourier-filtered images of the atomic distribution where the four columns of Agat the corners of the sodalite cage are separated by 4.72 Å and eachsodalite cage is separated by 7.41 Å. (d) Proposed model with the Agatoms in grey. (e) Intensity profiles performed on the atoms marked as 1,2, and 3 in (c) and 4, 5, and 6 with the interatomic distance betweenthese atoms being 2.70 Å. (f ) Multislice STEM simulation along the [001]direction and the experimental image is shown alongside.14
Fig. 15 (a) Morphology and (b) ion-polished cross section of a meso-structured zeolite Y crystal. The mesopores distributed on the surface ofand inside the crystal are clearly visible. Both images were taken at lowvoltage (electron beam landing energy of 0.5 keV and stage bias of 2kV). (c) An ED frame in the rotation electron diffraction (RED) data seriesand (d) the corresponding TEM image in the ET series. (e) Reconstructed3D reciprocal lattices from the RED data with the reconstructed 3D mor-phology of the corresponding particle obtained from electron tomo-graphy superimposed. RED data shows that the particle is highly crystal-line zeolite Y with two twin domains (lattices shown in red and green,respectively) sharing a common (111) plane. (f ) The 3D volume of a partof the tomogram from the area marked in (d) showing the connectivityof the mesopores in zeolite Y.104
Research Article Inorganic Chemistry Frontiers
2852 | Inorg. Chem. Front., 2018, 5, 2836–2855 This journal is © the Partner Organisations 2018
Ope
n A
cces
s A
rtic
le. P
ublis
hed
on 2
6 Se
ptem
ber
2018
. Dow
nloa
ded
on 1
2/1/
2021
5:0
8:41
AM
. T
his
artic
le is
lice
nsed
und
er a
Cre
ativ
e C
omm
ons
Attr
ibut
ion-
Non
Com
mer
cial
3.0
Unp
orte
d L
icen
ce.
View Article Online

order to obtain more detailed structures such as guestspecies in the pores.
HRTEM and STEM have unique advantages for studyingdisordered zeolite materials. The recent development of aber-ration correctors greatly strengthened these techniques andpushed the resolution to the sub-Ångström level. However,electron beam damage still remains a challenge for the appli-cation in zeolites. New data collection methods and improveddetectors can be the solutions for the problem.
The resolution of electron tomography for zeolite materialsis currently limited to a few nanometers. New methods need tobe developed to improve the resolution, so that it is possible toresolve both the micro- and meso-pores in mesoporous zeo-lites. New algorithms and software are needed for quantifi-cation of the pore size, quantity and connectivity of mesoporesin mesoporous zeolites.
New methods need to be developed for studying extremelybeam sensitive materials. This requires both the improvementof data collection techniques and development of fast andhigh quality detectors so that high quality data can be col-lected in a short time before the material is destroyed by elec-tron beams.
Finally, we want to emphasize that TEM techniques onlydeal with individual crystallites, it is important to combinedifferent techniques for structure characterization of bulkzeolite materials, for example various TEM techniques, powderX-ray diffraction, solid state NMR and gas sorption to obtain acomplete structure information about the material. The struc-ture information will give insights about the formation mecha-nisms of zeolites and zeolitic materials derived from zeolites,and help us to improve the materials, understand the pro-perties and explore new applications.
Conflicts of interest
There are no conflicts to declare.
Acknowledgements
The project is supported by the Swedish Research Council (VR,No. 2017-0432), the Swedish Governmental Agency for InnovationSystems (VINNOVA), and the Knut & Alice WallenbergFoundation through the project grant 3DEM-NATUR. The EMfacility was supported by the Knut and Alice WallenbergFoundation. TW acknowledges the Swedish Research Council(VR) for an International Postdoc grant (2014-06948).
References
1 C. Baerlocher and L. B. McCusker, Database of ZeoliteStructures, http://www.iza-structure.org/databases/,(accessed July 1, 2018).
2 M. E. Davis, Nature, 2002, 417, 813–821.
3 X. Zou, S. Hovmöller and P. Oleynikov, ElectronCrystallography: Electron Microscopy and ElectronDiffraction, Oxford University Press, 2011.
4 M. Haider, S. Uhlemann, E. Schwan, H. Rose, B. Kabiusand K. Urban, Nature, 1998, 392, 768–769.
5 K. Yoshida, Y. Sasaki and H. Kurata, AIP Adv., 2013, 3,042113.
6 D. Xie, L. B. McCusker, C. Baerlocher, S. I. Zones, W. Wanand X. Zou, J. Am. Chem. Soc., 2013, 135, 10519–10524.
7 W. M. J. Coene, A. Thust, M. Op de Beeck and D. VanDyck, Ultramicroscopy, 1996, 64, 109–135.
8 W. Wan, S. Hovmöller and X. Zou, Ultramicroscopy, 2012,115, 50–60.
9 X. Li, P. Mooney, S. Zheng, C. R. Booth, M. B. Braunfeld,S. Gubbens, D. A. Agard and Y. Cheng, Nat. Methods,2013, 10, 584–590.
10 A. Bartesaghi, A. Merk, S. Banerjee, D. Matthies, X. Wu,J. L. S. Milne and S. Subramaniam, Science, 2015, 348,1147–1151.
11 Y. Zhu, J. Ciston, B. Zheng, X. Miao, C. Czarnik, Y. Pan,R. Sougrat, Z. Lai, C.-E. Hsiung, K. Yao, I. Pinnau, M. Panand Y. Han, Nat. Mater., 2017, 16, 532–536.
12 D. Zhang, Y. Zhu, L. Liu, X. Ying, C.-E. Hsiung, R. Sougrat,K. Li and Y. Han, Science, 2018, 359, 675–679.
13 S. J. Pennycook, Ultramicroscopy, 1989, 30, 58–69.14 A. Mayoral, T. Carey, P. A. Anderson, A. Lubk and I. Diaz,
Angew. Chem., Int. Ed., 2011, 50, 11230–11233.15 J. D. Kistler, N. Chotigkrai, P. Xu, B. Enderle,
P. Praserthdam, C.-Y. Chen, N. D. Browning andB. C. Gates, Angew. Chem., Int. Ed., 2014, 53, 8904–8907.
16 S. D. Findlay, N. Shibata, H. Sawada, E. Okunishi,Y. Kondo, T. Yamamoto and Y. Ikuhara, Appl. Phys. Lett.,2009, 95, 191913.
17 T. Willhammar, A. Mayoral and X. Zou, Dalton Trans.,2014, 43, 14158–14163.
18 T. Willhammar, J. Sun, W. Wan, P. Oleynikov, D. Zhang,X. Zou, M. Moliner, J. Gonzalez, C. Martínez, F. Rey andA. Corma, Nat. Chem., 2012, 4, 188–194.
19 E. F. Rauch, J. Portillo, S. Nicolopoulos, D. Bultreys,S. Rouvimov and P. Moeck, Z. Kristallogr. – New Cryst.Struct., 2010, 225, 103–109.
20 Y. Wang, T. Yang, H. Xu, X. Zou and W. Wan, J. Appl.Crystallogr., 2018, 51, 1094–1101.
21 P. Wagner, O. Terasaki, S. Ritsch, J. G. Nery, S. I. Zones,M. E. Davis and K. Hiraga, J. Phys. Chem. B, 1999, 103,8245–8250.
22 R. Vincent and P. A. Midgley, Ultramicroscopy, 1994, 53,271–282.
23 D. L. Dorset, C. J. Gilmore, J. L. Jorda andS. Nicolopoulos, Ultramicroscopy, 2007, 107, 462–473.
24 D. Xie, C. Baerlocher and L. B. McCusker, J. Appl.Crystallogr., 2008, 41, 1115–1121.
25 U. Kolb, T. Gorelik, C. Kübel, M. T. Otten and D. Hubert,Ultramicroscopy, 2007, 107, 507–513.
26 D. Zhang, P. Oleynikov, S. Hovmöller and X. Zou, Z.Kristallogr., 2010, 225, 94–102.
Inorganic Chemistry Frontiers Research Article
This journal is © the Partner Organisations 2018 Inorg. Chem. Front., 2018, 5, 2836–2855 | 2853
Ope
n A
cces
s A
rtic
le. P
ublis
hed
on 2
6 Se
ptem
ber
2018
. Dow
nloa
ded
on 1
2/1/
2021
5:0
8:41
AM
. T
his
artic
le is
lice
nsed
und
er a
Cre
ativ
e C
omm
ons
Attr
ibut
ion-
Non
Com
mer
cial
3.0
Unp
orte
d L
icen
ce.
View Article Online
27 W. Wan, J. Sun, J. Su, S. Hovmöller and X. Zou, J. Appl.Crystallogr., 2013, 46, 1863–1873.
28 I. Nederlof, E. van Genderen, Y.-W. Li and J. P. Abrahams,Acta Crystallogr., Sect. D: Biol. Crystallogr., 2013, 69, 1223–1230.
29 D. Shi, B. L. Nannenga, M. G. Iadanza and T. Gonen,eLife, 2013, 2, e01345.
30 B. L. Nannenga, D. Shi, A. G. W. Leslie and T. Gonen, Nat.Methods, 2014, 11, 927–930.
31 K. Yonekura, K. Kato, M. Ogasawara, M. Tomita andC. Toyoshima, Proc. Natl. Acad. Sci. U. S. A., 2015, 112,3368–3373.
32 M. Gemmi, M. G. I. La Placa, A. S. Galanis, E. F. Rauchand S. Nicolopoulos, J. Appl. Crystallogr., 2015, 48, 718–727.
33 H. Xu, H. Lebrette, T. Yang, V. Srinivas, S. Hovmöller,M. Högbom and X. Zou, Structure, 2018, 26, 667–675.
34 W. Kabsch, Acta Crystallogr., Sect. D: Biol. Crystallogr.,2010, 66, 125–132.
35 M. T. B. Clabbers, T. Gruene, J. M. Parkhurst,J. P. Abrahams and D. G. Waterman, Acta Crystallogr., Sect.D: Struct. Biol., 2018, 74, 506–518.
36 S. Smeets, X. Zou and W. Wan, J. Appl. Crystallogr., 2018,51, 1262–1273.
37 J. Su, E. Kapaca, L. Liu, V. Georgieva, W. Wan, J. Sun,V. Valtchev, S. Hovmöller and X. Zou, MicroporousMesoporous Mater., 2014, 189, 115–125.
38 P. Guo, J. Shin, A. G. Greenaway, J. G. Min, J. Su,H. J. Choi, L. Liu, P. A. Cox, S. B. Hong, P. A. Wright andX. Zou, Nature, 2015, 524, 74–78.
39 T. Willhammar, J. Su, Y. Yun, X. Zou, M. Afeworki,S. C. Weston, H. B. Vroman, W. W. Lonergan andK. G. Strohmaier, Inorg. Chem., 2017, 56, 8856–8864.
40 P. A. Midgley and M. Weyland, Ultramicroscopy, 2003, 96,413–431.
41 Z. Saghi and P. A. Midgley, Annu. Rev. Mater. Res., 2012,42, 59–79.
42 H. Friedrich, P. E. de Jongh, A. J. Verkleij and K. P. deJong, Chem. Rev., 2009, 109, 1613–1629.
43 M. C. Scott, C.-C. Chen, M. Mecklenburg, C. Zhu, R. Xu,P. Ercius, U. Dahmen, B. C. Regan and J. Miao, Nature,2012, 483, 444–447.
44 B. Goris, S. Bals, W. Van den Broek, E. Carbó-Argibay,S. Gómez-Graña, L. M. Liz-Marzán and G. Van Tendeloo,Nat. Mater., 2012, 11, 930–935.
45 C.-C. Chen, C. Zhu, E. R. White, C.-Y. Chiu, M. C. Scott,B. C. Regan, L. D. Marks, Y. Huang and J. Miao, Nature,2013, 496, 74–77.
46 B. Goris, J. De Beenhouwer, A. De Backer, D. Zanaga,K. J. Batenburg, A. Sánchez-Iglesias, L. M. Liz-Marzán,S. Van Aert, S. Bals, J. Sijbers and G. Van Tendeloo, NanoLett., 2015, 15, 6996–7001.
47 Y. Yang, C.-C. Chen, M. C. Scott, C. Ophus, R. Xu,A. Pryor, L. Wu, F. Sun, W. Theis, J. Zhou, M. Eisenbach,P. R. C. Kent, R. F. Sabirianov, H. Zeng, P. Ercius andJ. Miao, Nature, 2017, 542, 75–79.
48 T. Willhammar, K. Sentosun, S. Mourdikoudis, B. Goris,M. Kurttepeli, M. Bercx, D. Lamoen, B. Partoens,I. Pastoriza-Santos, J. Pérez-Juste, L. M. Liz-Marzán,S. Bals and G. Van Tendeloo, Nat. Commun., 2017, 8,14925.
49 D. V. Dyck, J. R. Jinschek and F.-R. Chen, Nature, 2012,486, 243–246.
50 M. O. Cichocka, Y. Lorgouilloux, S. Smeets, J. Su, W. Wan,P. Caullet, N. Bats, L. B. McCusker, J.-L. Paillaud andX. Zou, Cryst. Growth Des., 2018, 18, 2441–2451.
51 M. M. J. Treacy and J. M. Newsam, Nature, 1988, 332, 249–251.
52 J. M. Newsam, M. M. J. Treacy, W. T. Koetsier andC. B. D. Gruyter, Proc. R. Soc. London, Ser. A, 1988, 420,375–405.
53 M. E. Leonowicz, J. A. Lawton, S. L. Lawton andM. K. Rubin, Science, 1994, 264, 1910–1913.
54 R. F. Lobo, M. Tsapatsis, C. C. Freyhardt, I. Chan,C.-Y. Chen, S. I. Zones and M. E. Davis, J. Am. Chem. Soc.,1997, 119, 3732–3744.
55 M. Moliner, T. Willhammar, W. Wan, J. González, F. Rey,J. L. Jorda, X. Zou and A. Corma, J. Am. Chem. Soc., 2012,134, 6473–6478.
56 S. Smeets, D. Xie, C. Baerlocher, L. B. McCusker, W. Wan,X. Zou and S. I. Zones, Angew. Chem., Int. Ed., 2014, 53,10398–10402.
57 J. Ruan, P. Wu, B. Slater, Z. Zhao, L. Wu and O. Terasaki,Chem. Mater., 2009, 21, 2904–2911.
58 C. Baerlocher, F. Gramm, L. Massüger, L. B. McCusker,Z. He, S. Hovmöller and X. Zou, Science, 2007, 315, 1113–1116.
59 J. Sun, Z. He, S. Hovmöller, X. Zou, F. Gramm, C. Baerlocherand L. B. McCusker, Z. Kristallogr., 2010, 225, 77–85.
60 L. Xu, X. Ji, J.-G. Jiang, L. Han, S. Che and P. Wu, Chem.Mater., 2015, 27, 7852–7860.
61 S. Smeets, Z. J. Berkson, D. Xie, S. I. Zones, W. Wan,X. Zou, M.-F. Hsieh, B. F. Chmelka, L. B. McCusker andC. Baerlocher, J. Am. Chem. Soc., 2017, 139, 16803–16812.
62 F. Gramm, C. Baerlocher, L. B. McCusker, S. J. Warrender,P. A. Wright, B. Han, S. B. Hong, Z. Liu, T. Ohsuna andO. Terasaki, Nature, 2006, 444, 79–81.
63 C. Baerlocher, D. Xie, L. B. McCusker, S.-J. Hwang,I. Y. Chan, K. Ong, A. W. Burton and S. I. Zones, Nat.Mater., 2008, 7, 631–635.
64 Z.-B. Yu, Y. Han, L. Zhao, S. Huang, Q.-Y. Zheng, S. Lin,A. Córdova, X. Zou and J. Sun, Chem. Mater., 2012, 24,3701–3706.
65 A. Corma, M. J. Díaz-Cabañas, J. Jiang, M. Afeworki,D. L. Dorset, S. L. Soled and K. G. Strohmaier, Proc. Natl.Acad. Sci. U. S. A., 2010, 107, 13997–14002.
66 D. L. Dorset, K. G. Strohmaier, C. E. Kliewer, A. Corma,M. J. Díaz-Cabañas, F. Rey and C. J. Gilmore, Chem.Mater., 2008, 20, 5325–5331.
67 J. Sun, C. Bonneau, Á. Cantín, A. Corma, M. J. Díaz-Cabañas, M. Moliner, D. Zhang, M. Li and X. Zou, Nature,2009, 458, 1154–1157.
Research Article Inorganic Chemistry Frontiers
2854 | Inorg. Chem. Front., 2018, 5, 2836–2855 This journal is © the Partner Organisations 2018
Ope
n A
cces
s A
rtic
le. P
ublis
hed
on 2
6 Se
ptem
ber
2018
. Dow
nloa
ded
on 1
2/1/
2021
5:0
8:41
AM
. T
his
artic
le is
lice
nsed
und
er a
Cre
ativ
e C
omm
ons
Attr
ibut
ion-
Non
Com
mer
cial
3.0
Unp
orte
d L
icen
ce.
View Article Online

68 J. Jiang, J. L. Jorda, J. Yu, L. A. Baumes, E. Mugnaioli,M. J. Diaz-Cabanas, U. Kolb and A. Corma, Science, 2011,333, 1131–1134.
69 R. Martínez-Franco, M. Moliner, Y. Yun, J. Sun, W. Wan,X. Zou and A. Corma, Proc. Natl. Acad. Sci. U. S. A., 2013,110, 3749–3754.
70 Y. Lorgouilloux, M. Dodin, E. Mugnaioli, C. Marichal,P. Caullet, N. Bats, U. Kolb and J.-L. Paillaud, RSC Adv.,2014, 4, 19440–19449.
71 T. Willhammar, A. W. Burton, Y. Yun, J. Sun, M. Afeworki,K. G. Strohmaier, H. Vroman and X. Zou, J. Am. Chem.Soc., 2014, 136, 13570–13573.
72 W. Hua, H. Chen, Z.-B. Yu, X. Zou, J. Lin and J. Sun,Angew. Chem., Int. Ed., 2014, 53, 5868–5871.
73 J. Liang, J. Su, Y. Wang, Y. Chen, X. Zou, F. Liao, J. Linand J. Sun, Chem. – Eur. J., 2014, 20, 16097–16101.
74 J. K. Lee, A. Turrina, L. Zhu, S. Seo, D. Zhang, P. A. Cox,P. A. Wright, S. Qiu and S. B. Hong, Angew. Chem., Int. Ed.,2014, 53, 7480–7483.
75 S. Smeets, D. Xie, L. B. McCusker, C. Baerlocher,S. I. Zones, J. A. Thompson, H. S. Lacheen andH.-M. Huang, Chem. Mater., 2014, 26, 3909–3913.
76 Y. Yun, M. Hernández, W. Wan, X. Zou, J. L. Jordá,A. Cantín, F. Rey and A. Corma, Chem. Commun., 2015, 51,7602–7605.
77 J. Jiang, Y. Yun, X. Zou, J. Luis Jorda and A. Corma, Chem.Sci., 2015, 6, 480–485.
78 J. E. Schmidt, D. Xie, T. Rea and M. E. Davis, Chem. Sci.,2015, 6, 1728–1734.
79 S. Smeets, L. B. McCusker, C. Baerlocher, D. Xie,C.-Y. Chen and S. I. Zones, J. Am. Chem. Soc., 2015, 137,2015–2020.
80 J. Shin, H. Xu, S. Seo, P. Guo, J. G. Min, J. Cho,P. A. Wright, X. Zou and S. B. Hong, Angew. Chem., Int.Ed., 2016, 55, 4928–4932.
81 J. H. Kang, D. Xie, S. I. Zones, S. Smeets, L. B. McCuskerand M. E. Davis, Chem. Mater., 2016, 28, 6250–6259.
82 J. Simancas, R. Simancas, P. J. Bereciartua, J. L. Jorda,F. Rey, A. Corma, S. Nicolopoulos, P. Pratim Das,M. Gemmi and E. Mugnaioli, J. Am. Chem. Soc., 2016, 138,10116–10119.
83 P. Guo, K. Strohmaier, H. Vroman, M. Afeworki,P. I. Ravikovitch, C. S. Paur, J. Sun, A. Burton and X. Zou,Inorg. Chem. Front., 2016, 3, 1444–1448.
84 Y. Luo, S. Smeets, F. Peng, A. S. Etman, Z. Wang, J. Sunand W. Yang, Chem. – Eur. J., 2017, 23, 16829–16834.
85 L. Bieseki, R. Simancas, J. L. Jordá, P. J. Bereciartua,Á. Cantín, J. Simancas, S. B. Pergher, S. Valencia, F. Reyand A. Corma, Chem. Commun., 2018, 54, 2122–2125.
86 A. Turrina, R. Garcia, A. E. Watts, H. F. Greer, J. Bradley,W. Zhou, P. A. Cox, M. D. Shannon, A. Mayoral, J. L. Casciand P. A. Wright, Chem. Mater., 2017, 29, 2180–2190.
87 C. Zhang, E. Kapaca, J. Li, Y. Liu, X. Yi, A. Zheng, X. Zou,J. Jiang and J. Yu, Angew. Chem., Int. Ed., 2018, 57, 6486–6490.
88 S. Seo, T. Yang, J. Shin, D. Jo, X. Zou and S. B. Hong,Angew. Chem., Int. Ed., 2018, 57, 3727–3732.
89 B. D. Yuhas, J. P. S. Mowat, M. A. Miller and W. Sinkler,Chem. Mater., 2018, 30, 582–586.
90 P. Guo, N. Yan, L. Wang and X. Zou, Cryst. Growth Des.,2017, 17, 6821–6835.
91 A. Corma, M. Moliner, Á. Cantín, M. J. Díaz-Cabañas,J. L. Jordá, D. Zhang, J. Sun, K. Jansson, S. Hovmöller andX. Zou, Chem. Mater., 2008, 20, 3218–3223.
92 R. W. Grosse-Kunstleve, L. B. McCusker andC. Baerlocher, J. Appl. Crystallogr., 1999, 32, 536–542.
93 L. Palatinus and G. Chapuis, J. Appl. Crystallogr., 2007, 40,786–790.
94 M. C. Burla, R. Caliandro, B. Carrozzini, G. L. Cascarano,C. Cuocci, C. Giacovazzo, M. Mallamo, A. Mazzone andG. Polidori, J. Appl. Crystallogr., 2015, 48, 306–309.
95 G. M. Sheldrick, Acta Crystallogr., Sect. A: Found.Crystallogr., 2008, 64, 112–122.
96 M. Choi, K. Na, J. Kim, Y. Sakamoto, O. Terasaki andR. Ryoo, Nature, 2009, 461, 246–249.
97 D. Liang, L. R. A. Follens, A. Aerts, J. A. Martens, G. VanTendeloo and C. E. A. Kirschhock, J. Phys. Chem. C, 2007,111, 14283–14285.
98 S. Kumar, Z. Wang, R. L. Penn and M. Tsapatsis, J. Am.Chem. Soc., 2008, 130, 17284–17286.
99 E.-P. Ng, D. Chateigner, T. Bein, V. Valtchev andS. Mintova, Science, 2012, 335, 70–73.
100 J. Zečević, A. M. J. van der Eerden, H. Friedrich, P. E. deJongh and K. P. de Jong, ACS Nano, 2013, 7, 3698–3705.
101 S. Bals, K. J. Batenburg, D. Liang, O. Lebedev, G. VanTendeloo, A. Aerts, J. A. Martens and C. E. A. Kirschhock,J. Am. Chem. Soc., 2009, 131, 4769–4773.
102 J. Zečević, C. J. Gommes, H. Friedrich, P. E. de Jongh andK. P. de Jong, Angew. Chem., Int. Ed., 2012, 51, 4213–4217.
103 J. V. Aelst, D. Verboekend, A. Philippaerts, N. Nuttens,M. Kurttepeli, E. Gobechiya, M. Haouas, S. P. Sree,J. F. M. Denayer, J. A. Martens, C. E. A. Kirschhock,F. Taulelle, S. Bals, G. V. Baron, P. A. Jacobs and B. F. Sels,Adv. Funct. Mater., 2015, 25, 7130–7144.
104 J. Garcia-Martinez, C. Xiao, K. A. Cychosz, K. Li, W. Wan,X. Zou and M. Thommes, ChemCatChem, 2014, 6, 3110–3115.
105 L. Van Tendeloo, W. Wangermez, A. Vandekerkhove,T. Willhammar, S. Bals, A. Maes, J. A. Martens,C. E. A. Kirschhock and E. Breynaert, Chem. Mater., 2017,29, 629–638.
106 T. Altantzis, E. Coutino-Gonzalez, W. Baekelant,G. T. Martinez, A. M. Abakumov, G. V. Tendeloo,M. B. J. Roeffaers, S. Bals and J. Hofkens, ACS Nano, 2016,10, 7604–7611.
Inorganic Chemistry Frontiers Research Article
This journal is © the Partner Organisations 2018 Inorg. Chem. Front., 2018, 5, 2836–2855 | 2855
Ope
n A
cces
s A
rtic
le. P
ublis
hed
on 2
6 Se
ptem
ber
2018
. Dow
nloa
ded
on 1
2/1/
2021
5:0
8:41
AM
. T
his
artic
le is
lice
nsed
und
er a
Cre
ativ
e C
omm
ons
Attr
ibut
ion-
Non
Com
mer
cial
3.0
Unp
orte
d L
icen
ce.
View Article Online


![Ultrafast transmission electron microscopy using a laser ...transmission electron microscopy [4], scanning electron microscopy [5], x-ray diffraction [6], scanning tunneling and atomic](https://img.dokumen.tips/doc/110x75/607eb1335ce8082131294459/ultrafast-transmission-electron-microscopy-using-a-laser-transmission-electron.jpg)