Embed Size (px)
Citation preview
Translating 20 years of research with
volumetric MRI into multi center trials and
routine clinical practice. Has ADNI solved
all the problems?
RASAD 2012
Clifford R Jack Jr
Alexander Family Professor of Alzheimer's Disease Research,
Dept Radiology, Mayo Clinic, Rochester, MN

How should biomarkers work?
Same for lipids, diabetes, PSA, etc

Is vMRI used routinely in clinical
trials and clinical practice, as
biomarkers are in other fields?
Research studies and clinical trials –yes, but lab specific, no
standardization
Clinical practice – qualitative
If not, why?

Lack of validation?
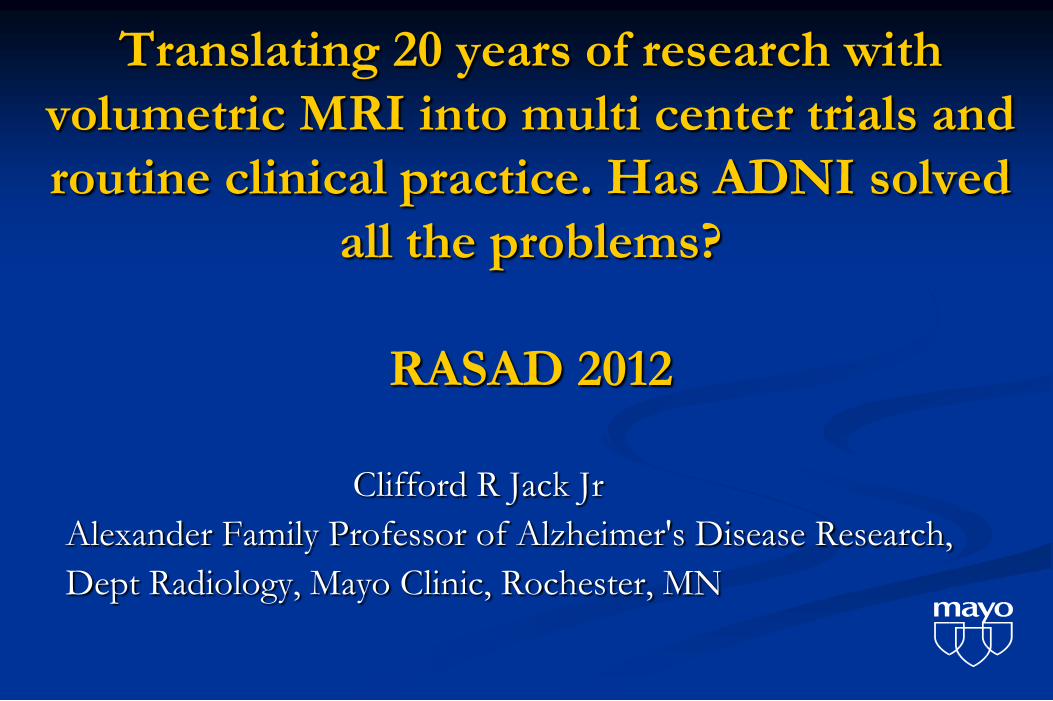
Is autopsy evidence lacking that
vMRI maps onto the
neurodegenerative aspect of AD
pathophysiology?
Bobinski, Neuroscience 95, 2000
Hippocampal Volume vs CA1 neuron counts
Zarow, Ann Neurol, 2005

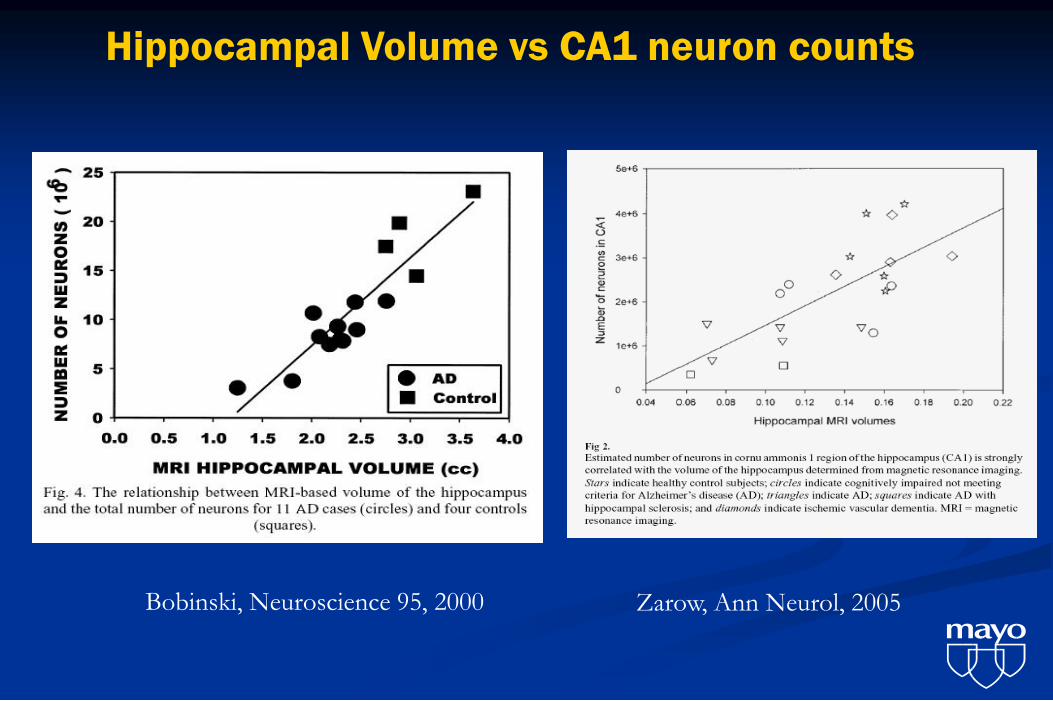
Braak NFT
Staging
Topography of grey matter loss vs Braak
stage Whitwell et al Neurology 2008

Clinical validation: Is evidence lacking
that vMRI is diagnostically effective?
Cross sectional diagnostic discrimination
Prediction
Longitudinal measure of disease progression
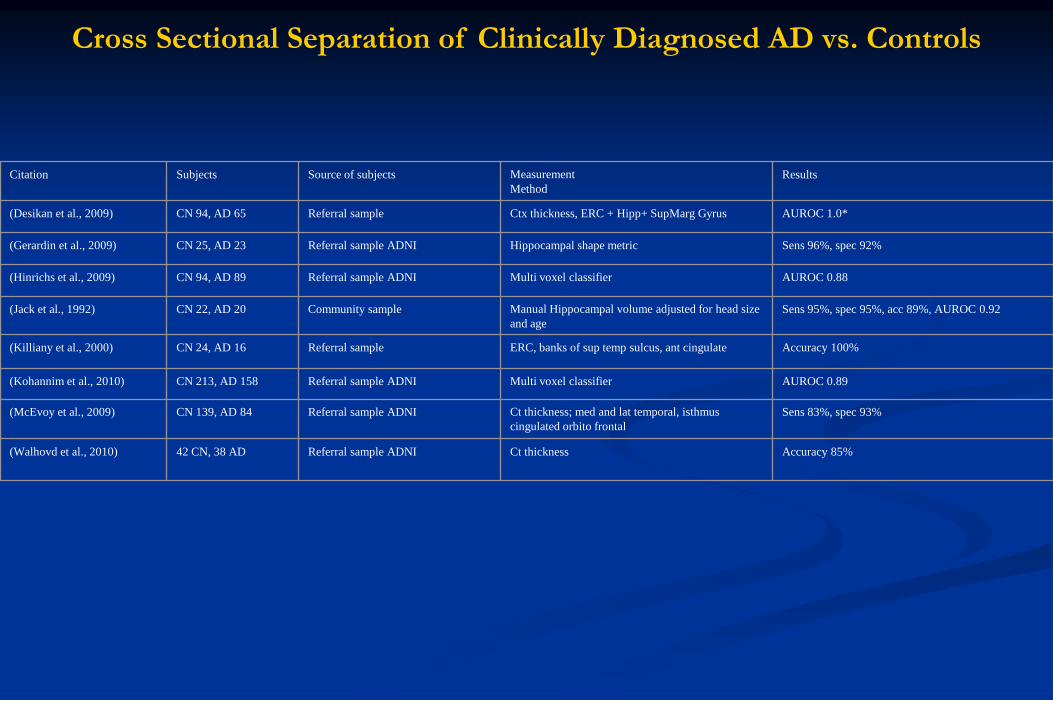
Citation Subjects Source of subjects Measurement
Method
Results
(Desikan et al., 2009) CN 94, AD 65 Referral sample Ctx thickness, ERC + Hipp+ SupMarg Gyrus AUROC 1.0*
(Gerardin et al., 2009) CN 25, AD 23 Referral sample ADNI Hippocampal shape metric Sens 96%, spec 92%
(Hinrichs et al., 2009) CN 94, AD 89 Referral sample ADNI Multi voxel classifier AUROC 0.88
(Jack et al., 1992) CN 22, AD 20 Community sample Manual Hippocampal volume adjusted for head size
and age
Sens 95%, spec 95%, acc 89%, AUROC 0.92
(Killiany et al., 2000) CN 24, AD 16 Referral sample ERC, banks of sup temp sulcus, ant cingulate Accuracy 100%
(Kohannim et al., 2010) CN 213, AD 158 Referral sample ADNI Multi voxel classifier AUROC 0.89
(McEvoy et al., 2009) CN 139, AD 84 Referral sample ADNI Ct thickness; med and lat temporal, isthmus
cingulated orbito frontal
Sens 83%, spec 93%
(Walhovd et al., 2010) 42 CN, 38 AD Referral sample ADNI Ct thickness Accuracy 85%
Cross Sectional Separation of Clinically Diagnosed AD vs. Controls
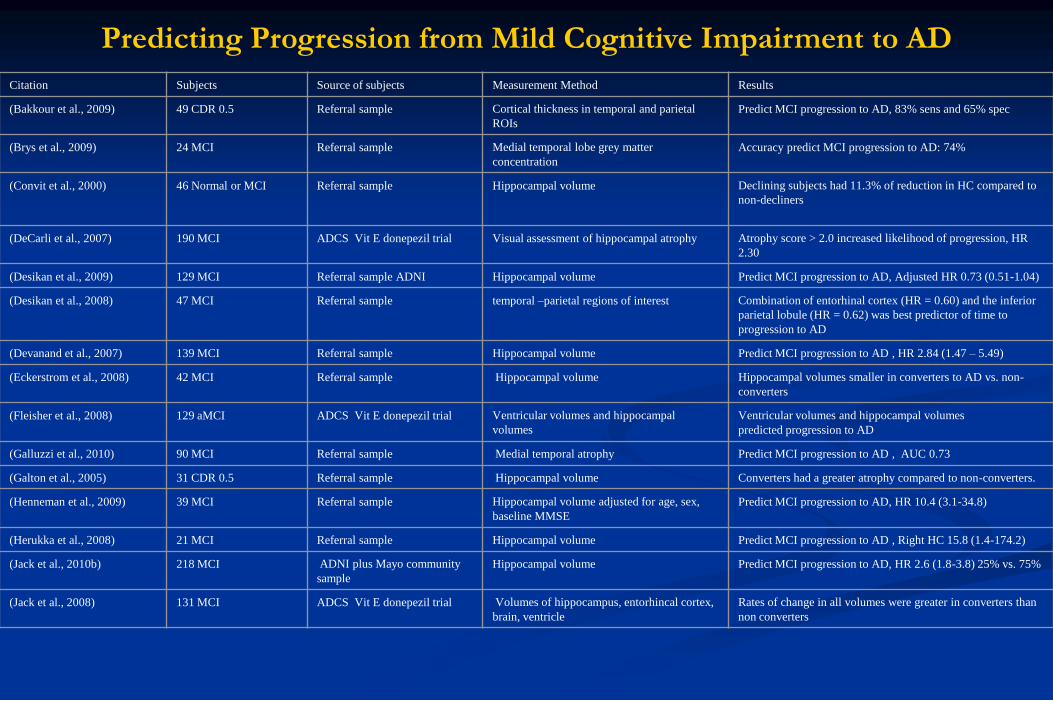
Citation Subjects Source of subjects Measurement Method Results
(Bakkour et al., 2009) 49 CDR 0.5 Referral sample Cortical thickness in temporal and parietal
ROIs
Predict MCI progression to AD, 83% sens and 65% spec
(Brys et al., 2009) 24 MCI Referral sample Medial temporal lobe grey matter
concentration
Accuracy predict MCI progression to AD: 74%
(Convit et al., 2000) 46 Normal or MCI Referral sample Hippocampal volume Declining subjects had 11.3% of reduction in HC compared to
non-decliners
(DeCarli et al., 2007) 190 MCI ADCS Vit E donepezil trial Visual assessment of hippocampal atrophy Atrophy score > 2.0 increased likelihood of progression, HR
2.30
(Desikan et al., 2009) 129 MCI Referral sample ADNI Hippocampal volume Predict MCI progression to AD, Adjusted HR 0.73 (0.51-1.04)
(Desikan et al., 2008) 47 MCI Referral sample temporal –parietal regions of interest Combination of entorhinal cortex (HR = 0.60) and the inferior
parietal lobule (HR = 0.62) was best predictor of time to
progression to AD
(Devanand et al., 2007) 139 MCI Referral sample Hippocampal volume Predict MCI progression to AD , HR 2.84 (1.47 – 5.49)
(Eckerstrom et al., 2008) 42 MCI Referral sample Hippocampal volume Hippocampal volumes smaller in converters to AD vs. non-
converters
(Fleisher et al., 2008) 129 aMCI ADCS Vit E donepezil trial Ventricular volumes and hippocampal
volumes
Ventricular volumes and hippocampal volumes
predicted progression to AD
(Galluzzi et al., 2010) 90 MCI Referral sample Medial temporal atrophy Predict MCI progression to AD , AUC 0.73
(Galton et al., 2005) 31 CDR 0.5 Referral sample Hippocampal volume Converters had a greater atrophy compared to non-converters.
(Henneman et al., 2009) 39 MCI Referral sample Hippocampal volume adjusted for age, sex,
baseline MMSE
Predict MCI progression to AD, HR 10.4 (3.1-34.8)
(Herukka et al., 2008) 21 MCI Referral sample Hippocampal volume Predict MCI progression to AD , Right HC 15.8 (1.4-174.2)
(Jack et al., 2010b) 218 MCI ADNI plus Mayo community
sample
Hippocampal volume Predict MCI progression to AD, HR 2.6 (1.8-3.8) 25% vs. 75%
(Jack et al., 2008) 131 MCI ADCS Vit E donepezil trial Volumes of hippocampus, entorhincal cortex,
brain, ventricle
Rates of change in all volumes were greater in converters than
non converters
Predicting Progression from Mild Cognitive Impairment to AD

(Jack et al., 2005) 72 MCI Community sample Hippocampal volume Predict MCI progression to AD, HC volume OR: 1.51 (1.1-2.0)
(Jack et al., 2000) 43 MCI Community sample Hippocampal volume Rates of hippocampal atrophy were greater in converters than
non converters
(Jack et al., 1999) 80 MCI Community sample Hippocampal W score Relative risk 0.69 – for each 1 unit increase in W score (less
atrophy) risk of progression to AD decreased by 31%
(Kantarci et al., 2005) 21 MCI Referral sample Hippocampal volume Predict MCI progression to AD OR: 2.5 (1.0-6.2)
(Killiany et al., 2002) 94 CDR 0.5 Referral sample Hippocampal volume Predict MCI progression to AD OR: 1.5 (1.0-2.31)
(Landau et al., 2010) 85 MCI Referral sample Hippocampal volume Predict MCI progression to AD OR: 2.49 (1.02-5.96)
(Leung et al., 2010) 335 MCI ADNI Hippocampal volume Rates higher in converters compared with stable and reverter
groups
(Risacher et al., 2009) 227 MCI ADNI Hippocampal volume Effect size for separating MCI stable vs. converter Cohens d=
0.60
(Stoub et al., 2010) 29 aMCI Referral sample Entorhinal cortex and
hippocampus
Atrophy rate of entorhinal cortex and hippocampus in controls
less than MCI converters
(Tapiola et al., 2008) 60 MCI Referral sample Hippocampal volume Predict MCI progression to AD OR: Total HC 0.815 (0.69-
0.97)
(Vemuri, P. et al., 2009) 192 MCI Referral sample ADNI STAND score HR for time to conversion from MCI to AD 25th vs. 75th
percentile 2.6
(Visser et al., 1999) 13 MCI Community sample Hippocampal volume Predict MCI progression to AD OR 0.21 (0.05-0.99)
(Visser et al., 2002) 30 MCI Community sample Hippocampal volume Hippocampal volume predicts MCI progression to AD
(Wang et al., 2009) 58 aMCI Referral sample Hippocampal volume Predict MCI progression to AD Left HC HR 0.38 (0.10-0.88)
Predicting Progression from Mild Cognitive Impairment to AD (cont.)

Citation Subjects Source of subjects Measurement
Method
Sample size required to detect treatment effects
(Fox et al., 2000) 18 AD Referral sample Classic BSI 207 per arm assuming: 1 year trial, 20% effect size,
90% power, 10% drop out, 10% unusable scans
(Holland et al., 2009) 129 AD
299 MCI
Referral sample ADNI Ctx thickness ERC ROI Assuming 24 month trial, 25% effect size, 80%
power, scans every 6 mo ;45 per arm for AD; 135 per
arm MCI
(Hua, Xue et al., 2010) AD 50
MCI 122
Referral sample ADNI TBM temporal lobe Assuming 12 month trial, 25% effect size, 80%
power; 43 AD per arm; 82 MCI per arm
(Jack et al., 2003) 192 AD Referral sample, terminated multi site
therapeutic trial
Hippocampus Assuming 12 month trial, 50% effect size, 90% power
at 0.05; 21 per arm for AD
(Leung et al., 2010) 81 AD Referral sample ADNI KN-BSI Assuming 12 month trial, 25% effect size, 80%
power; 81AD per arm
(Schott et al., 2006) 46 AD Referral sample BSI Assuming 12 month trial, 20% effect size, 90%
power, 2-sided significance at 0.05, 4 ideally spaced
scans; 138 AD per arm
(Schuff et al., 2009) 96 AD
226 MCI
Referral sample ADNI Hippocampal volume (SNT), model
includes 3 scans, Markov chain, APOE
Assuming 12 month trial, 25% effect size, 90%
power; 186 AD per arm; 341 MCI per arm
(Vemuri, P. et al., 2010) 71 AD
149 MCI
Referral sample ADNI Ventricular -BSI Assuming 12 month trial, 25% effect size, 80%
power, 2-sided 2 sample t-test at 0.05; 100 AD per
arm; 186 MCI per arm
(Wolz et al., 2010) 126 AD
279 MCI
Referral sample ADNI Simultaneous 4D graph segmentation Assuming 12 month trial, 25% effect size, 80%
power, 2-sided 2 sample t-test at 0.05; 67 AD per arm;
206 MCI per arm
Sample Sizes per Arm Needed to Power Treatment Study in AD/MCI

Why is vMRI rarely used in clinical
practice and not used in a
standardized way clinical trials?
There are no universally accepted standards at this
time
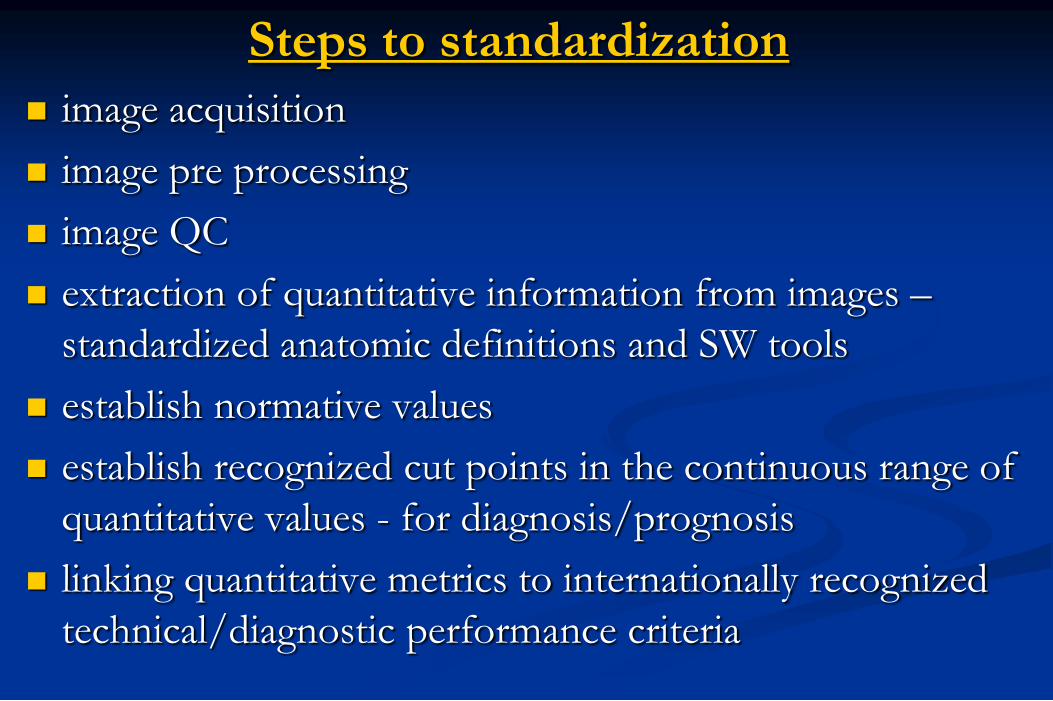
Steps to standardization
image acquisition
image pre processing
image QC
extraction of quantitative information from images –
standardized anatomic definitions and SW tools
establish normative values
establish recognized cut points in the continuous range of
quantitative values - for diagnosis/prognosis
linking quantitative metrics to internationally recognized
technical/diagnostic performance criteria

Steps to Standardization – what steps
has ADNI solved?

Acquisition Create generic protocol – limited to MPRAGE & FLAIR
Each MRI vendor speaks a “different language”
Port to each platform (ADNI -1) ~ 35 different platforms
each requiring own compiler
Distribute electronically
Major problems for standardization for ADNI-1, 2005
GE: SNR - slice #, chem shift, debug ref scout, (MPRAGE)
Siemens: RF spoiler
Effect of ADNI on standardization - over time vendors
included ADNI changes in product
Limitations – phase encode looping
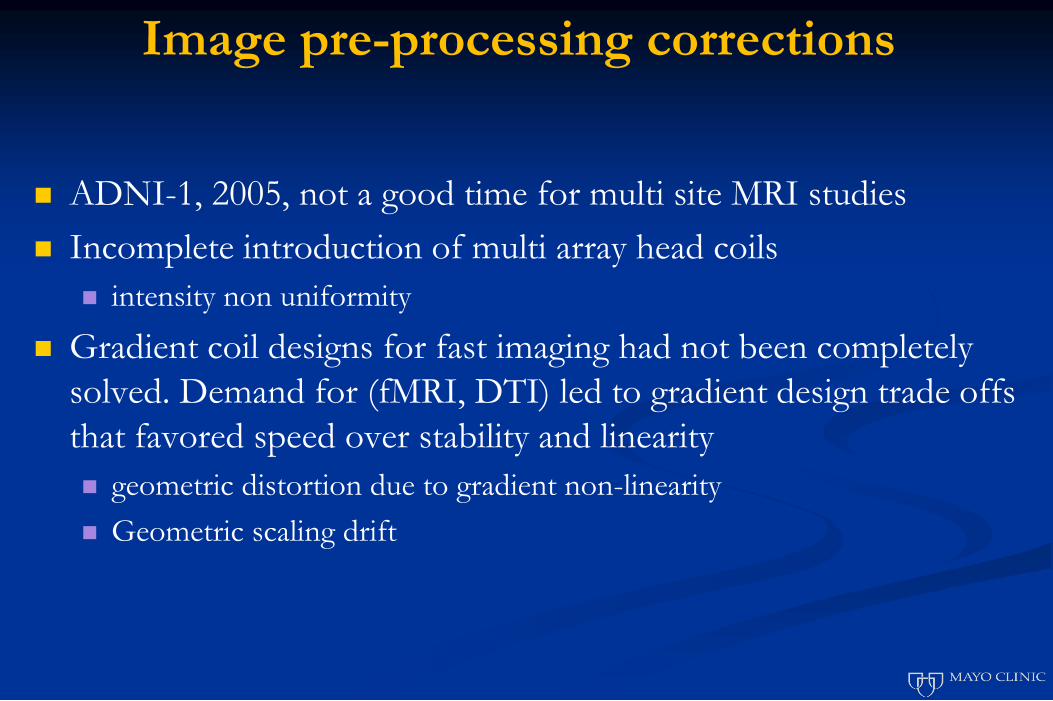
Image pre-processing corrections
ADNI-1, 2005, not a good time for multi site MRI studies
Incomplete introduction of multi array head coils
intensity non uniformity
Gradient coil designs for fast imaging had not been completely
solved. Demand for (fMRI, DTI) led to gradient design trade offs
that favored speed over stability and linearity
geometric distortion due to gradient non-linearity
Geometric scaling drift

Intensity Inhomogeneity Correction
Before After
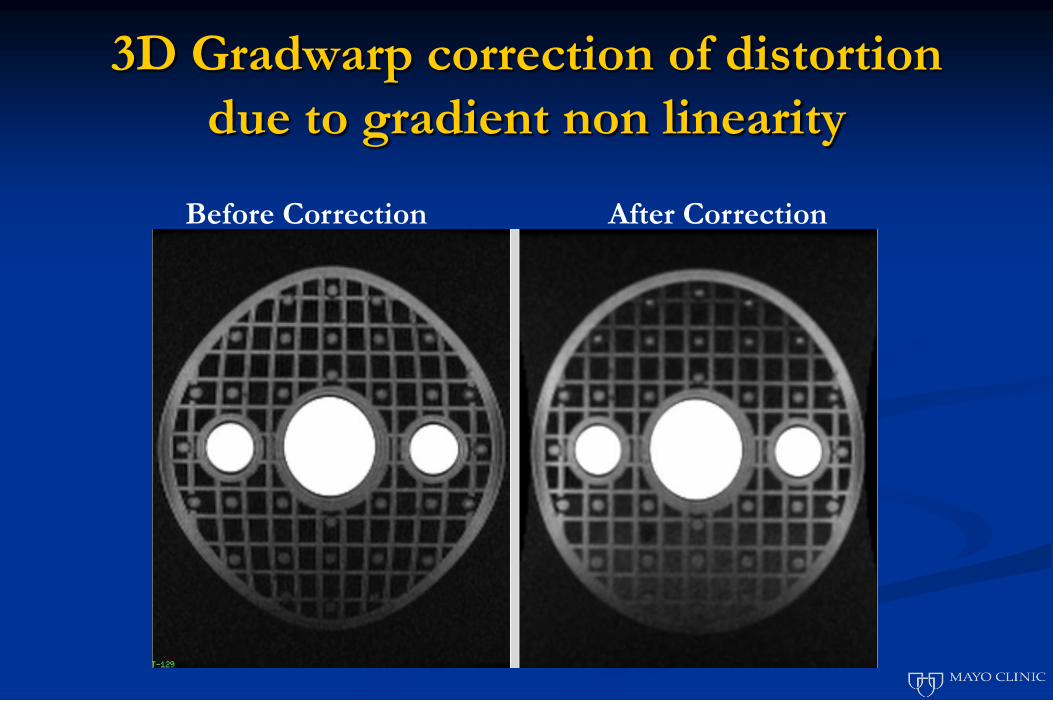
3D Gradwarp correction of distortion
due to gradient non linearity
Before Correction After Correction

Pre processing
ADNI performed pre processing on MPRAGE scans
off line to correct artifacts – recommended that users
use these pre processed scans (NIFTI) rather than
raw DICOM
But in the interim, MR vendors have improved
product and also offer these corrections on line (not
universally though)
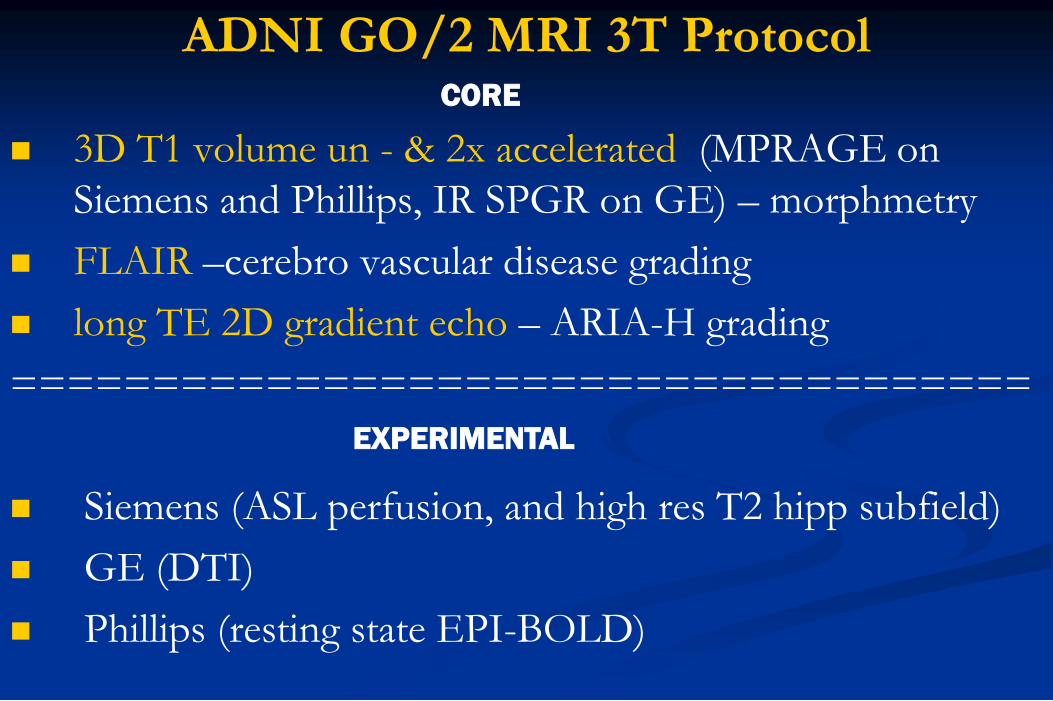
ADNI GO/2 MRI 3T Protocol
3D T1 volume un - & 2x accelerated (MPRAGE on
Siemens and Phillips, IR SPGR on GE) – morphmetry
FLAIR –cerebro vascular disease grading
long TE 2D gradient echo – ARIA-H grading
====================================
Siemens (ASL perfusion, and high res T2 hipp subfield)
GE (DTI)
Phillips (resting state EPI-BOLD)
CORE
EXPERIMENTAL

Steps to standardization & ADNI solutions
image acquisition – to some extent
image pre processing – to some extent
image QC - to some extent
extraction of quantitative information from images –
standardized anatomic definitions and SW tools – NO
establish normative values - NO
establish recognized cut points in the continuous range of
quantitative values used for diagnosis/prognosis – NO
linking quantitative metrics to internationally recognized
technical/diagnostic performance criteria - NO
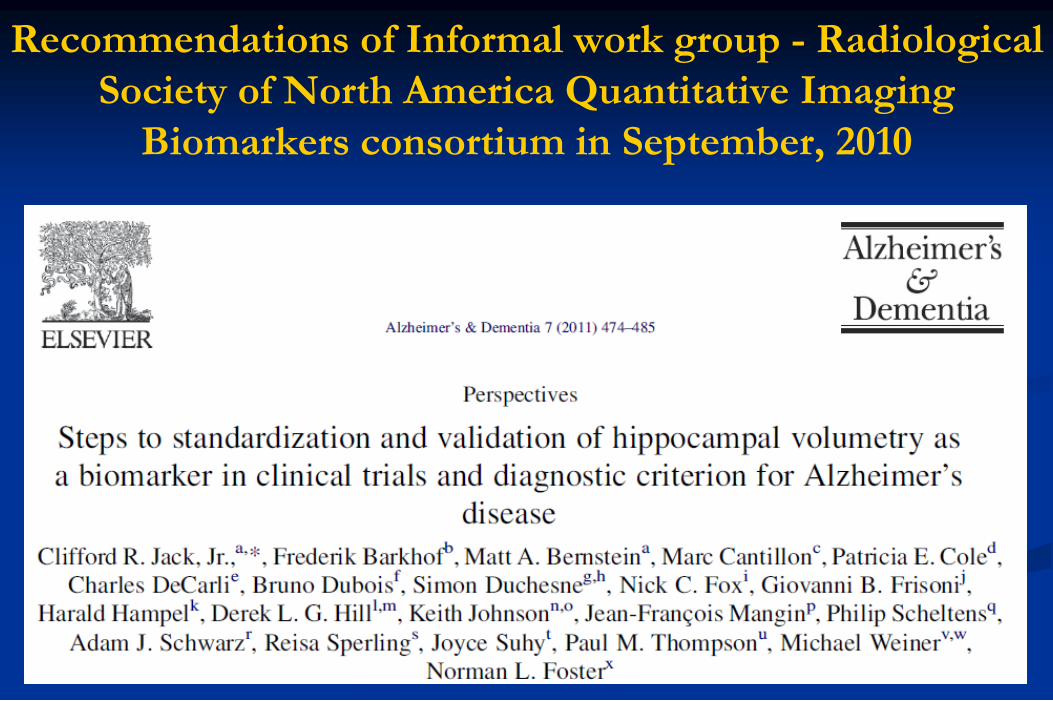
Recommendations of Informal work group - Radiological
Society of North America Quantitative Imaging
Biomarkers consortium in September, 2010
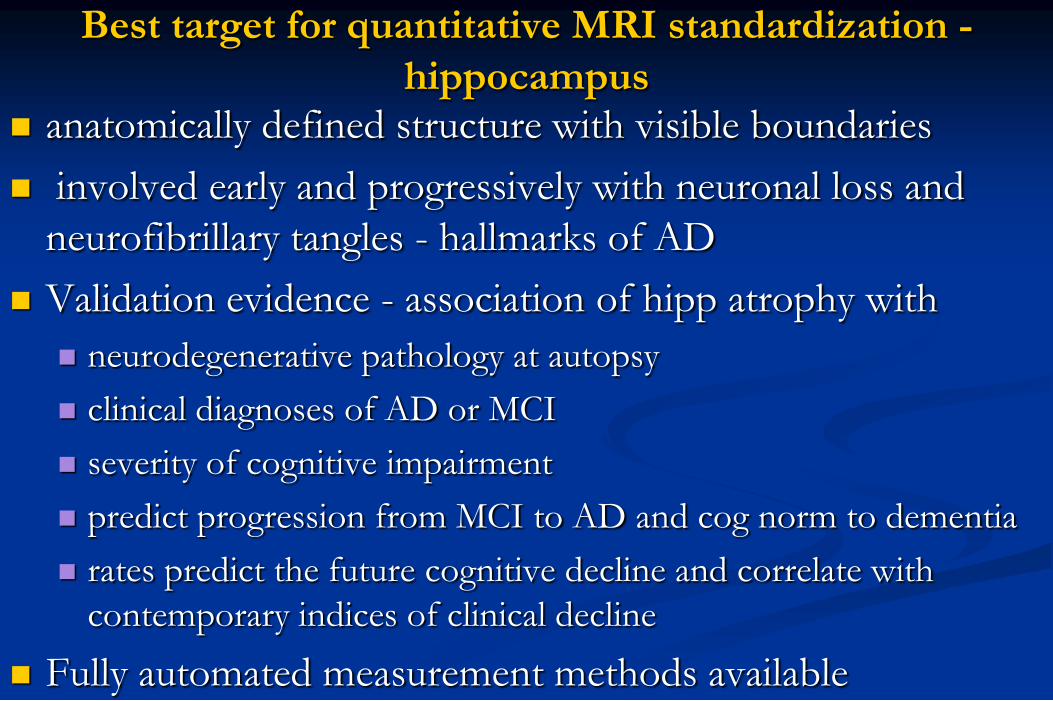
Best target for quantitative MRI standardization -
hippocampus anatomically defined structure with visible boundaries
involved early and progressively with neuronal loss and
neurofibrillary tangles - hallmarks of AD
Validation evidence - association of hipp atrophy with
neurodegenerative pathology at autopsy
clinical diagnoses of AD or MCI
severity of cognitive impairment
predict progression from MCI to AD and cog norm to dementia
rates predict the future cognitive decline and correlate with
contemporary indices of clinical decline
Fully automated measurement methods available

Recommendations: Steps to standardization and validation of
hippocampal volumetry as a biomarker of AD
Step 1) Establish and empower an Oversight Board to
manage and assess the effort with following attributes
include all necessary areas of expertise
unbiased
represent both academia as well as industry
international composition
*Link to non-profit professional organization, eg Alz Assoc
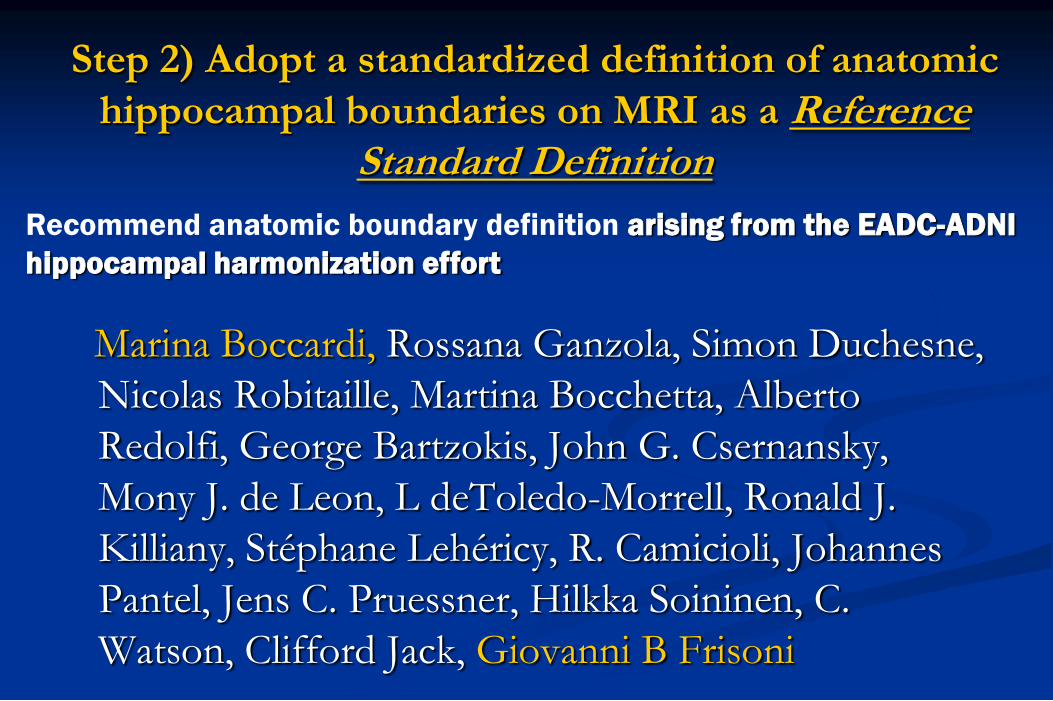
Step 2) Adopt a standardized definition of anatomic
hippocampal boundaries on MRI as a Reference Standard Definition
Marina Boccardi, Rossana Ganzola, Simon Duchesne,
Nicolas Robitaille, Martina Bocchetta, Alberto
Redolfi, George Bartzokis, John G. Csernansky,
Mony J. de Leon, L deToledo-Morrell, Ronald J.
Killiany, Stéphane Lehéricy, R. Camicioli, Johannes
Pantel, Jens C. Pruessner, Hilkka Soininen, C.
Watson, Clifford Jack, Giovanni B Frisoni
Recommend anatomic boundary definition arising from the EADC-ADNI
hippocampal harmonization effort
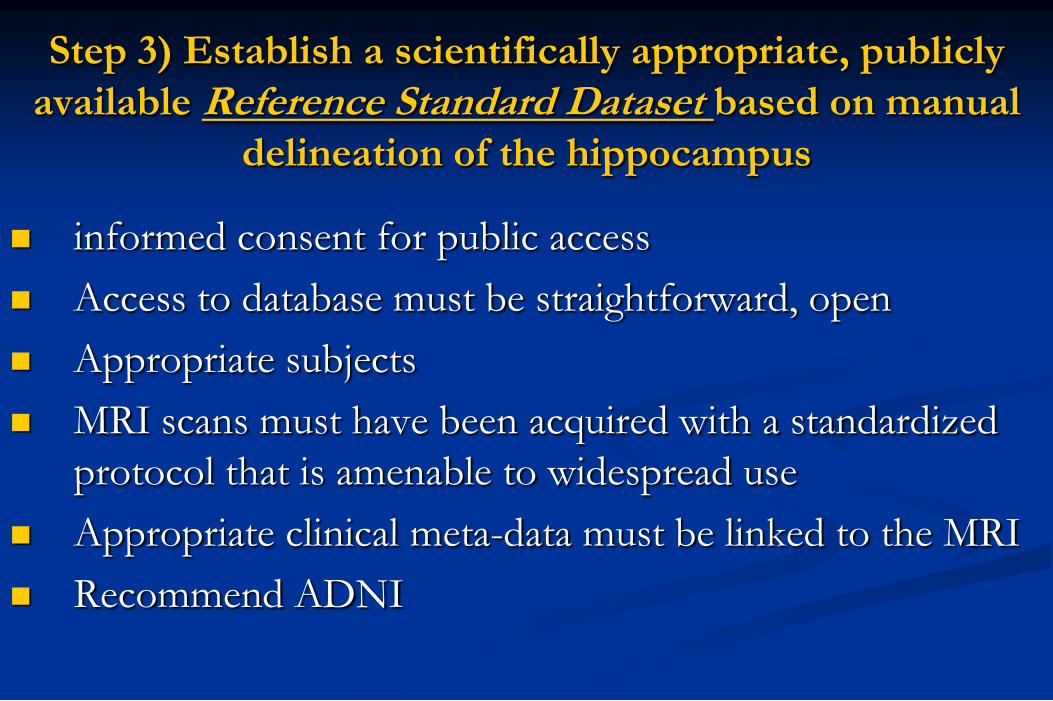
Step 3) Establish a scientifically appropriate, publicly
available Reference Standard Dataset based on manual
delineation of the hippocampus
informed consent for public access
Access to database must be straightforward, open
Appropriate subjects
MRI scans must have been acquired with a standardized
protocol that is amenable to widespread use
Appropriate clinical meta-data must be linked to the MRI
Recommend ADNI

Step 4) Develop standards for reporting
measurement units including a standardized
approach for normalization of raw hippocampal
volume measures
defining correct measures of head size through
standardization of intracranial volume measures
Age (?)
gender

Step 5) Establish normative values
age (?) and gender specific norms
cut points in the continuous range of quantitative
values defining normal, abnormal, indeterminate (?)
In an appropriate/representative population(s)
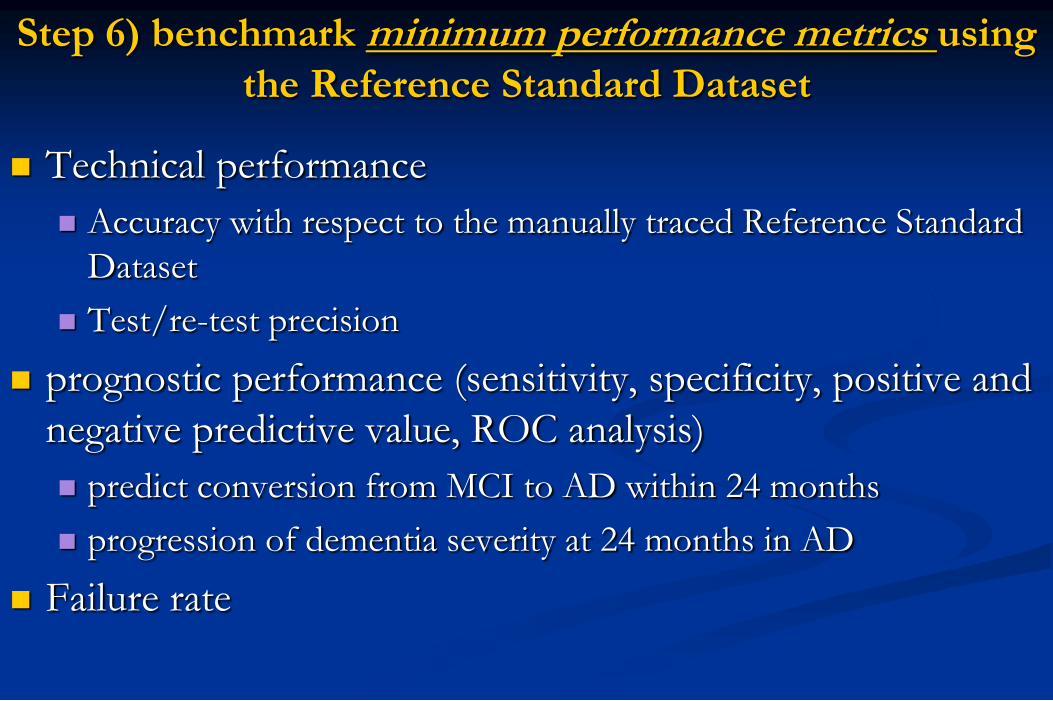
Step 6) benchmark minimum performance metrics using
the Reference Standard Dataset
Technical performance
Accuracy with respect to the manually traced Reference Standard
Dataset
Test/re-test precision
prognostic performance (sensitivity, specificity, positive and
negative predictive value, ROC analysis)
predict conversion from MCI to AD within 24 months
progression of dementia severity at 24 months in AD
Failure rate
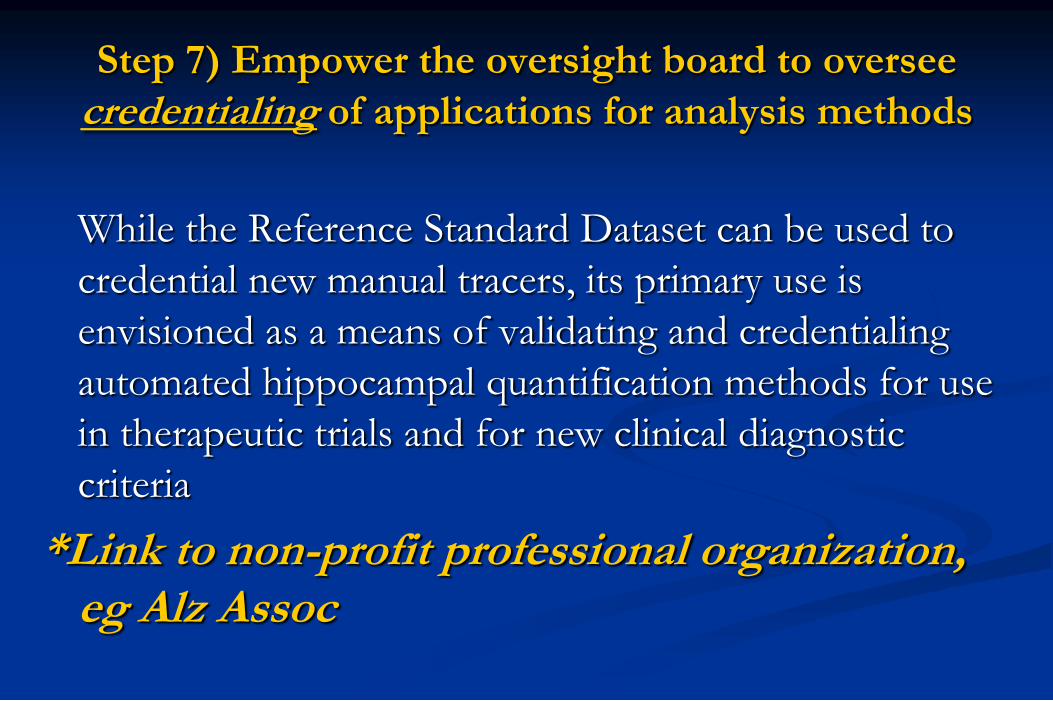
Step 7) Empower the oversight board to oversee
credentialing of applications for analysis methods
While the Reference Standard Dataset can be used to
credential new manual tracers, its primary use is
envisioned as a means of validating and credentialing
automated hippocampal quantification methods for use
in therapeutic trials and for new clinical diagnostic
criteria
*Link to non-profit professional organization, eg Alz Assoc
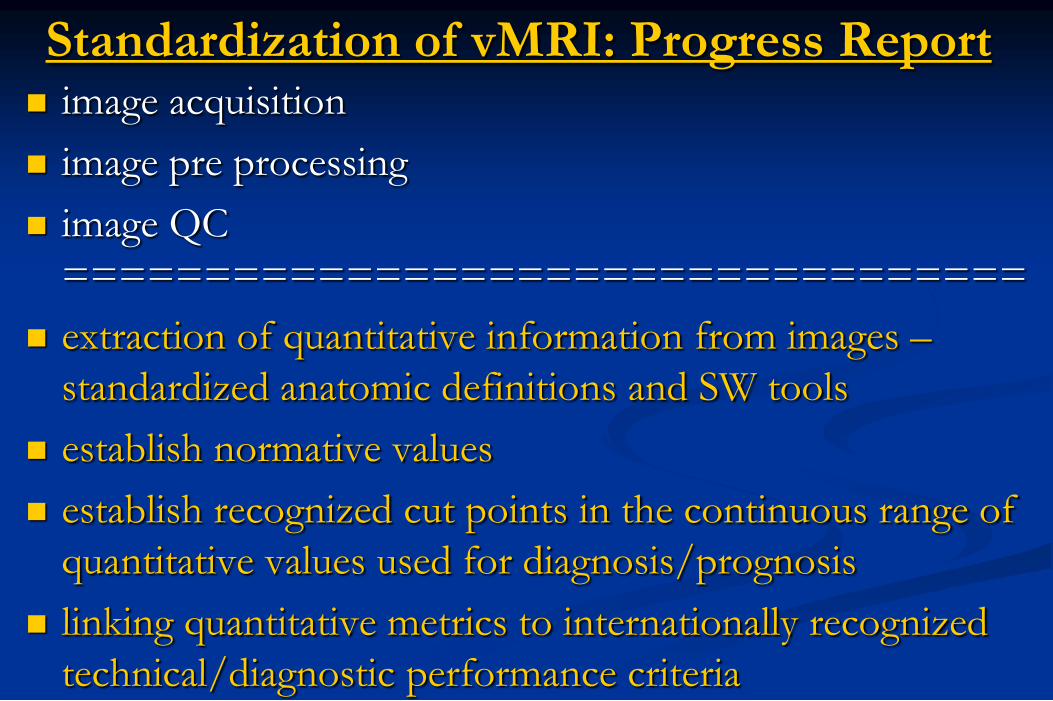
Standardization of vMRI: Progress Report image acquisition
image pre processing
image QC
==================================
extraction of quantitative information from images –
standardized anatomic definitions and SW tools
establish normative values
establish recognized cut points in the continuous range of
quantitative values used for diagnosis/prognosis
linking quantitative metrics to internationally recognized
technical/diagnostic performance criteria