Embed Size (px)
Citation preview

1©2021 TETRA Technologies, Inc.
Cowen and Company
Sustainability & Energy Transition Summit
June 8, 2021

2©2021 TETRA Technologies, Inc.
Disclaimer
Forward-Looking StatementsThe information in this presentation includes “forward-looking statements.” All statements, other than statements of historical fact included in this presentation, regarding our management,strategy, future operations, financial position, estimated revenues and losses, projected costs, prospects, plans and objectives of management are forward-looking statements. When usedin this presentation, the words “could,” “believe,” “anticipate,” “intend,” “estimate,” “expect,” “project” and similar expressions are intended to identify forward-looking statements, althoughnot all forward-looking statements contain such identifying words. These forward-looking statements are based on TETRA’s current expectations and assumptions about future events andare based on currently available information as to the outcome and timing of future events. When considering forward-looking statements, you should keep in mind the risk factors andother cautionary statements described under the heading “Risk Factors” included in TETRA’s Annual Report on Form 10-K filed with the Securities and Exchange Commission andsubsequent Form 10-Q Quarterly Reports. We caution you that these forward-looking statements are subject to all the risks and uncertainties, most of which are difficult to predict andmany of which are beyond our control. These risks include, but are not limited to, the level of capital spending by the oil and natural gas industry natural or man-made disasters and otherexternal events that may disrupt our operations, volatility of oil and natural gas prices, changes in general economic and geopolitical conditions, large or multiple customer defaultsincluding defaults resulting from actual or potential insolvencies, technological advancements in oil field or chemicals technologies, competitive conditions in our industry, our ability to fullyprotect our intellectual property rights and changes in the long-term supply of and demand for oil and natural gas. Should one or more of these risks or uncertainties occur, or shouldunderlying assumptions prove incorrect, our actual results and plans could differ materially from those expressed in any forward-looking statements. You are cautioned not to place unduereliance on any forward-looking statements, which speak only as of the date of this presentation. Except as otherwise required by applicable law, we disclaim any duty to update and donot intend to update any forward-looking statements, all of which are expressly qualified by the statements in this section, to reflect events or circumstances after the date of thispresentation. This presentation includes financial measures that are not presented in accordance with generally accepted accounting principles ("GAAP"), including EBITDA, adjustedEBITDA, adjusted EBITDA margin, adjusted free cash flow and net debt. While management believes such measures are useful for investors, they do not have any standardized meaningand are therefore unlikely to be comparable to similar measures presented by other companies. The presentation of non-GAAP financial measures should not be used as a replacementfor, and should not be considered in isolation from, financial measures that are in accordance with GAAP. Please see the Appendix for reconciliations of those measures to comparableGAAP measures.
Industry and Market DataThis presentation has been prepared by TETRA and includes market data and other statistical information from third-party sources, including independent industry publications,government publications or other published independent sources. Although TETRA believes these third-party sources are reliable as of their respective dates, TETRA has notindependently verified the accuracy or completeness of this information. Some data are also based on the TETRA’s good faith estimates, which are derived from its review of internalsources as well as the third-party sources described above.
Trademarks and LogosTETRAA owns or has rights to various trademarks, service marks and trade names that is uses in connection with the operation of its business. This presentation also containstrademarks, service marks and trade names of third parties, which are the property of their respective owners. TETRA’s use or display of third parties’ trademarks, service marks, tradenames or products in this presentation is not intended to and does not imply, a relationship with TETRA or an endorsement or sponsorship by or of TETRA. Solely for convenience, thetrademarks, service marks and trade names referred to in this presentation may appear without the ©, ®, TM or SM symbols, but the omission of such references is not intended toindicate, in any way, that TETRA will not assert, to the fullest extent under applicable law, its rights or the right of the applicable owner of these trademarks, service marks and tradenames.
3©2021 TETRA Technologies, Inc.
Industrial
Oil & Gas
Investment Highlights
(a) As of 6/4/2021 (b) As of 3/31/2021 (c) As of 5/3/2021. Enterprise value, Net debt and Adjusted EBITDA margins are non-GAAP financial measure. See “Non-GAAP Reconciliation” in appendix for more information and reconciliation
Stock and Market Information 2020 Revenue Mix Improving Adjusted EBITDA Margins
Water & Flowback Services
Ticker NYSE: TTI
Market Cap (a) $475 Mil
Net Debt (b) $117 Mil
Enterprise Value (a) $592 Mil
Shares Outstanding (c) 127 Mil
Average Daily Trading Volume 1,796,692
4.6%
11.0% 11.8% 11.5%13.0%
2016 2017 2018 2019 2020
Completion Fluids &
Products$135M$243M
Global leader in onshore water management, high-value completion fluids and related industrial chemicals. Uniquely positioned for a recovering Oil
and Gas market and an accelerating Energy Transition market
• Diverse revenue stream from O&G, industrial, US & international, onshore & offshore• Industry innovation leader & vertically integrated Completions Fluids & Products segment• Leading water management service provider in the Permian Basin • Key mineral reserves and chemistry R&D expertise for low carbon energy
4©2021 TETRA Technologies, Inc.
Recent Highlights
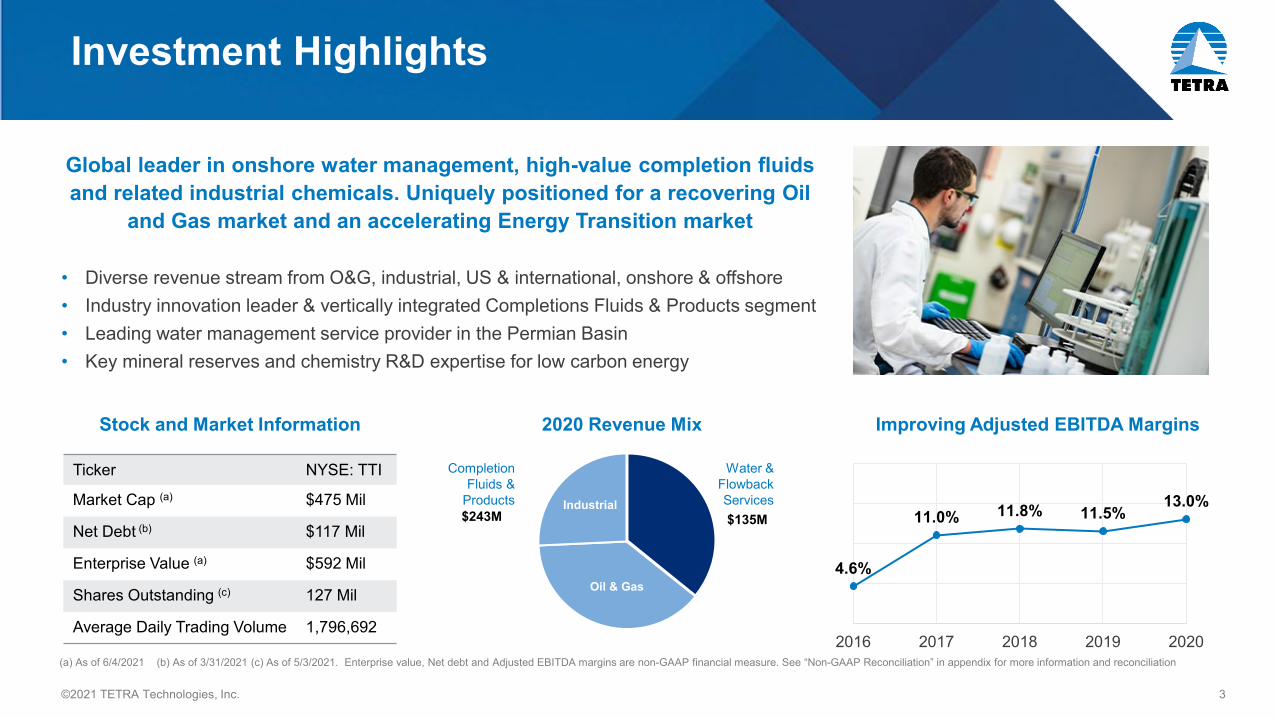
• Q1 adjusted EBITDA of $9M and adjusted FCF of $5.4M
• MOU with CarbonFree to jointly advance innovative carbon capture technology
• Advancing PureFlowTM high purity zinc-bromide energy storage
• Standard Lithium initiated economic assessment to produce lithium from TETRA leases
• Reduced term loan from $221M at 9/30/20 to $184M at 3/31/21
• Recent insider buying activity
Adjusted EBITDA, Net debt and Adjusted free cash flow are non-GAAP financial measures. See “Non-GAAP Reconciliation” in appendix for more information and reconciliation
Generating Cash and Reducing Net Debt
$(22)
$189
$59
$133
$5
$117
2019 2020 2021-Q1
Adjusted Free Cash Flow
Net Debt$ millions
5©2021 TETRA Technologies, Inc.
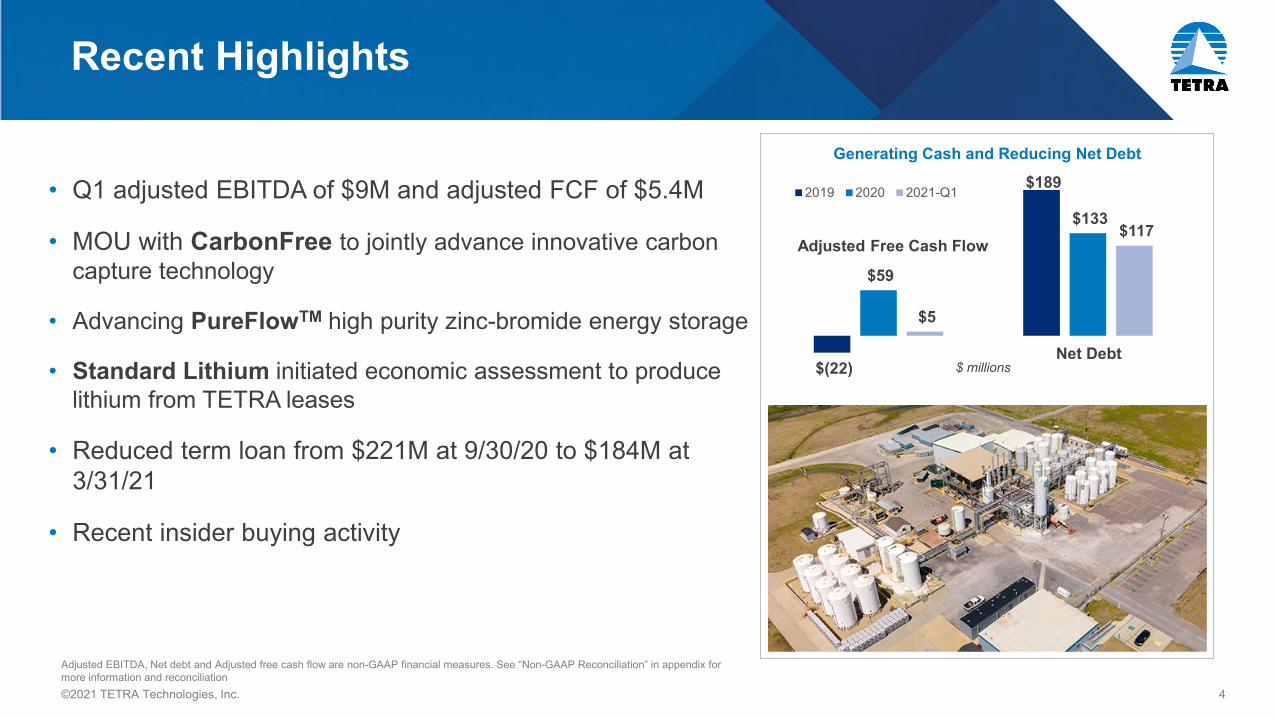
Compelling ESG* Story
Operations
• Innovative environmentally-friendly (non-zinc) CS Neptune®
fluids technology
• Recycling and reusing produced water
• Proprietary leak-resistant water transfer systems
Low Carbon Energy
• Significant bromine reserves with high quantities of lithium
• High purity zinc-bromide for mass energy storage
• MOU for calcium chloride applications for carbon capture
Governance
• Separate chair and CEO
• Ongoing board refreshment
• Executive compensation aligned with shareholder returns
• Active shareholder engagement program
Health & Safety
• Strong culture of QHS&E drives product & service delivery
• Monitoring systems for all vehicles drives exceptional performance
• Customer recognition of environmental stewardship
* Environment, Social and Governance
6©2021 TETRA Technologies, Inc.
2018 2019 2020
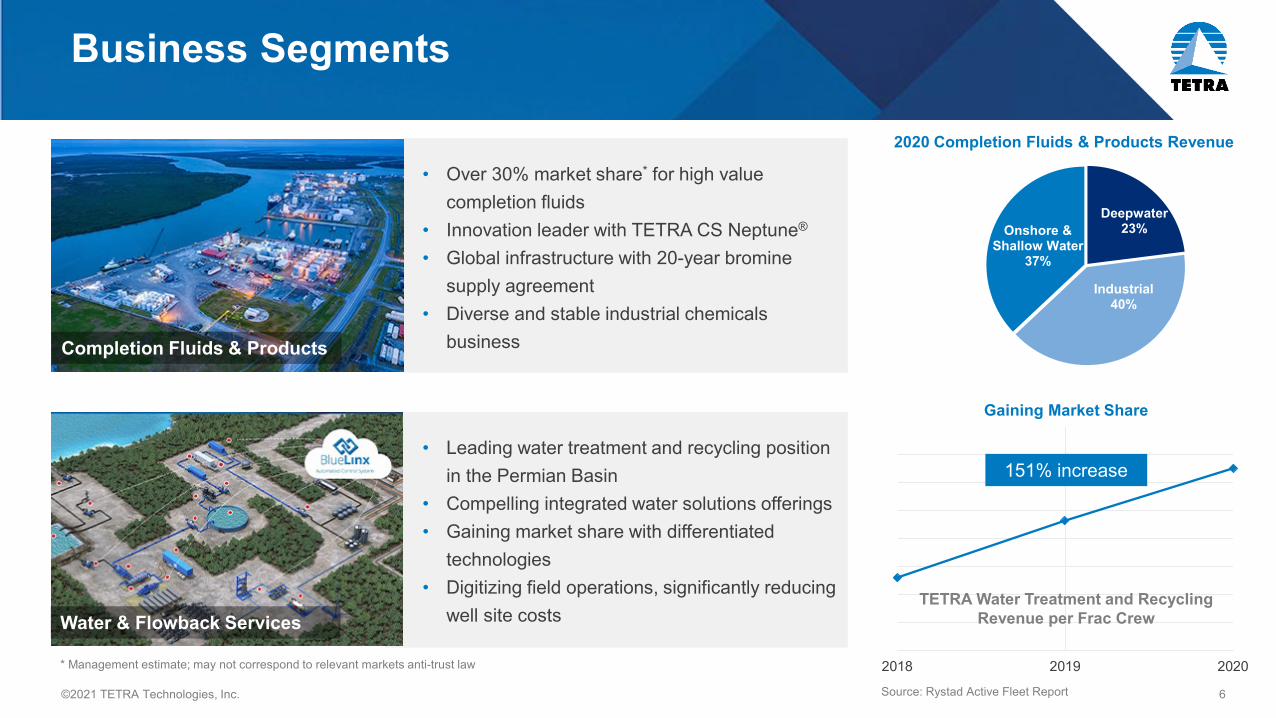
Business Segments
• Leading water treatment and recycling position in the Permian Basin
• Compelling integrated water solutions offerings• Gaining market share with differentiated
technologies• Digitizing field operations, significantly reducing
well site costs
• Over 30% market share* for high value completion fluids
• Innovation leader with TETRA CS Neptune®
• Global infrastructure with 20-year bromine supply agreement
• Diverse and stable industrial chemicals business
* Management estimate; may not correspond to relevant markets anti-trust law
Deepwater23%
Industrial40%
Onshore & Shallow Water
37%
2020 Completion Fluids & Products Revenue
TETRA Water Treatment and Recycling Revenue per Frac Crew
151% increase
Completion Fluids & Products
Water & Flowback Services
Gaining Market Share
Source: Rystad Active Fleet Report

7©2021 TETRA Technologies, Inc.
Low Carbon Energy Opportunities
• 27,000 acres of brine leases in Arkansas with inferred lithium carbonate equivalent resources of 890,000 tons and an estimated 3.9 million tons of bromine resources
• $3.1M of earnings in 2020 from Standard Lithium agreement (TSX:SLL)• SLL agreement for royalty from lithium sales; TETRA has ownership of all extracted bromine
• Emerging energy storage market using zinc bromide• TETRA’s PureFlow is one of the highest purity zinc bromides in the world • Represents an additional potential market for TETRA’s zinc bromide products with no capital
investment required
• MOU with CarbonFree to advance technology and agree on joint development and commercial terms • CarbonFree requires large volumes of calcium chloride for carbon capture• TETRA is a global leader in the production of calcium chloride, with capacity to double production
Energy Storage
Lithium
Carbon Capture
8©2021 TETRA Technologies, Inc.
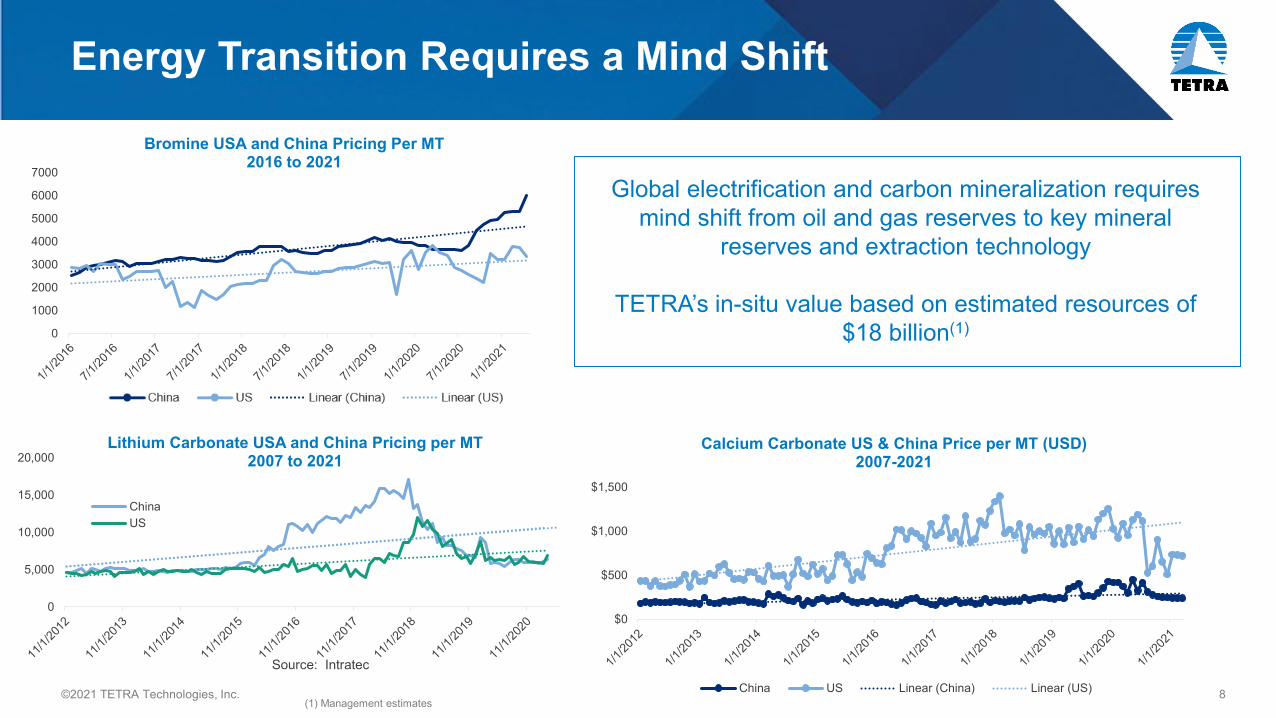
Energy Transition Requires a Mind Shift
0
1000
2000
3000
4000
5000
6000
7000
Bromine USA and China Pricing Per MT2016 to 2021
0
5,000
10,000
15,000
20,000
Source: Intratec
Lithium Carbonate USA and China Pricing per MT2007 to 2021
ChinaUS
$0
$500
$1,000
$1,500
Calcium Carbonate US & China Price per MT (USD)2007-2021
China US Linear (China) Linear (US)
Global electrification and carbon mineralization requires mind shift from oil and gas reserves to key mineral
reserves and extraction technology
TETRA’s in-situ value based on estimated resources of $18 billion(1)
(1) Management estimates
9©2021 TETRA Technologies, Inc.
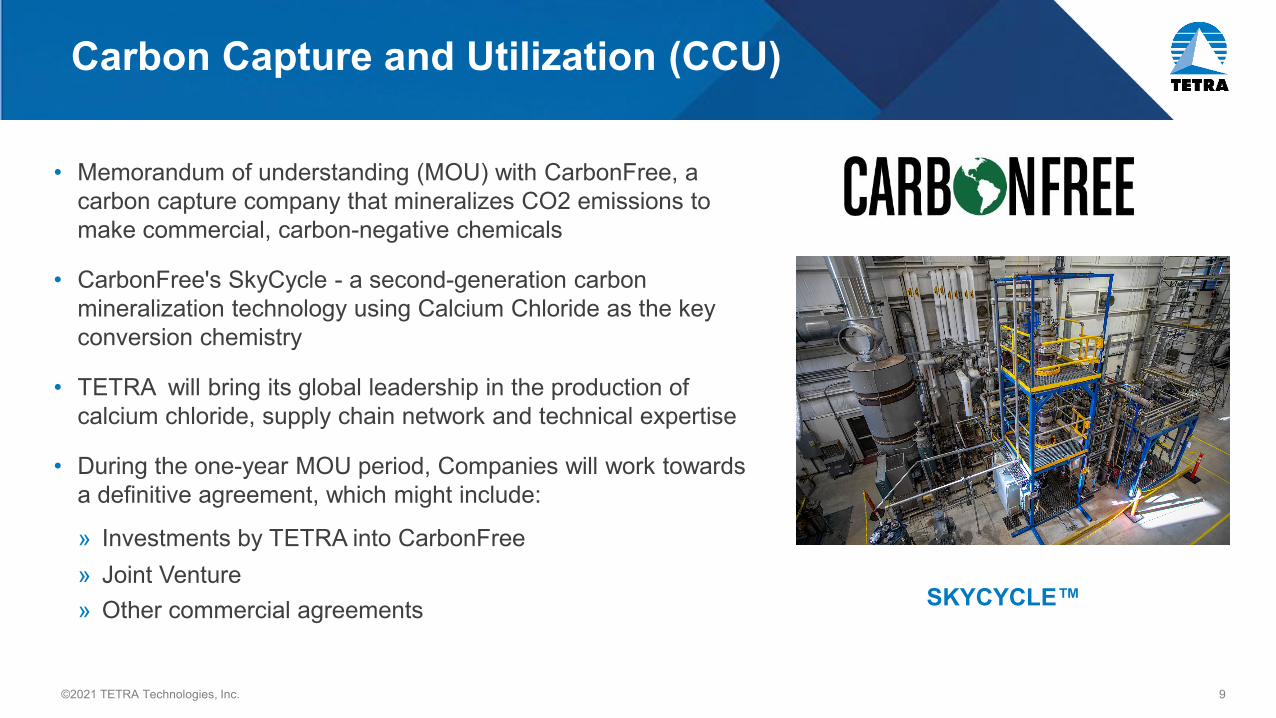
• Memorandum of understanding (MOU) with CarbonFree, a carbon capture company that mineralizes CO2 emissions to make commercial, carbon-negative chemicals
• CarbonFree's SkyCycle - a second-generation carbon mineralization technology using Calcium Chloride as the key conversion chemistry
• TETRA will bring its global leadership in the production of calcium chloride, supply chain network and technical expertise
• During the one-year MOU period, Companies will work towards a definitive agreement, which might include:
» Investments by TETRA into CarbonFree» Joint Venture» Other commercial agreements
Carbon Capture and Utilization (CCU)
SKYCYCLE™

10©2021 TETRA Technologies, Inc.
Completion Fluids & Products

11©2021 TETRA Technologies, Inc.
Diverse Fluids Revenue Streams
• Competitive advantage as only vertically integrated completion fluids service provider» Long-term bromine and acid supply agreements» Plants and facilities fully built, require minimal capital» Broad global logistics and distribution network» World class chemists & scientists
• Significant Industrial Chemicals Business» Calcium chloride is a major industrial chemical with a durable
demand profile» Largest producer of calcium chloride in Europe» 2nd largest producer of calcium chloride in the US
• Non-oil & gas calcium chloride applications» Agriculture» Food & beverage» De-icing & dust control» Construction Materials
12©2021 TETRA Technologies, Inc.
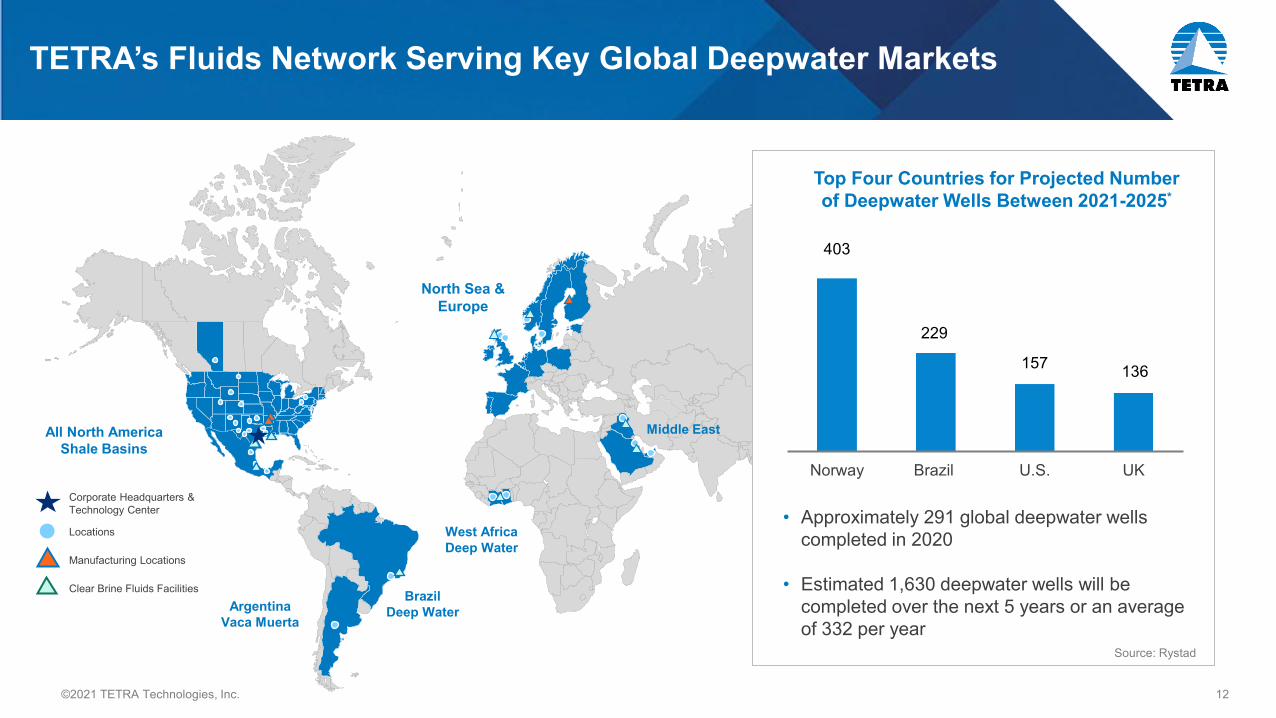
All North America Shale Basins
Brazil Deep WaterArgentina
Vaca Muerta
West Africa Deep Water
North Sea & Europe
Middle East
TETRA’s Fluids Network Serving Key Global Deepwater Markets
Corporate Headquarters & Technology Center
Locations
Manufacturing Locations
Clear Brine Fluids Facilities
403
229
157 136
Norway Brazil U.S. UK
Top Four Countries for Projected Number of Deepwater Wells Between 2021-2025*
• Approximately 291 global deepwater wells completed in 2020
• Estimated 1,630 deepwater wells will be completed over the next 5 years or an average of 332 per year
Source: Rystad
13©2021 TETRA Technologies, Inc.
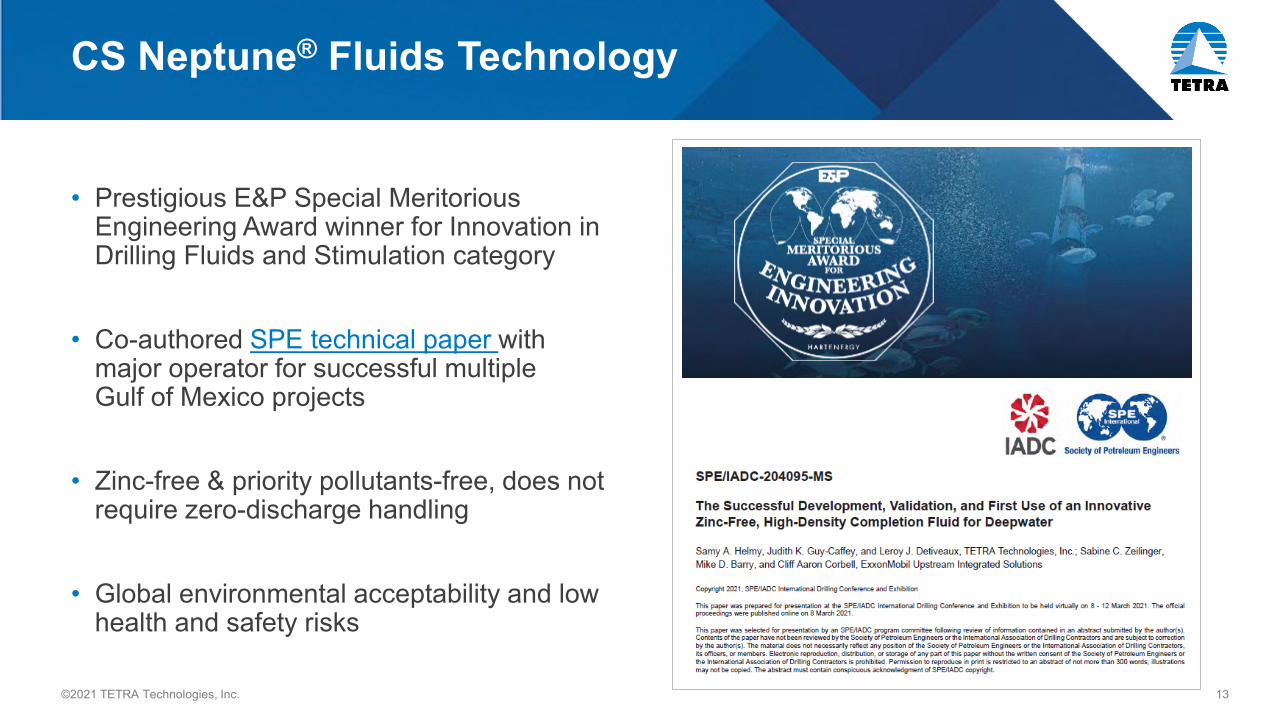
CS Neptune® Fluids Technology
• Prestigious E&P Special Meritorious Engineering Award winner for Innovation in Drilling Fluids and Stimulation category
• Co-authored SPE technical paper with major operator for successful multiple Gulf of Mexico projects
• Zinc-free & priority pollutants-free, does not require zero-discharge handling
• Global environmental acceptability and low health and safety risks

14©2021 TETRA Technologies, Inc.
Resilient High Value Fluids Business Model
Vertically integrated with technology, cost and logistics advantages
• Third party report on Gulf of Mexico completions fluids recognizes TETRA as “Value Advantage” and “Highest Customer Loyalty” provider
• Q1 Adjusted EBITDA margin of 23.7%
• Eighth consecutive quarter with Adj. EBITDA above 20%
• Increasing deepwater activity expected in late 2021 and beyond including projects delayed by pandemic in 2020
• Minimal dependency on North America onshore shale markets
Adjusted EBITDA and adjusted EBITDA margins are non-GAAP financial measures. See “Non-GAAP Reconciliation” in appendix for more information and reconciliation to net loss
Revenue and Adjusted EBITDA Margins
$62
$80
$59
$79 $75 $71
$52 $44 $47
17%22% 24%
35%29%
26% 27%
33%
24%
0%
10%
20%
30%
40%
$-
$20
$40
$60
$80
Rev Adjusted EBITDA Margins
$ m
illio
ns
15©2021 TETRA Technologies, Inc.
Water & Flowback Services
16©2021 TETRA Technologies, Inc.
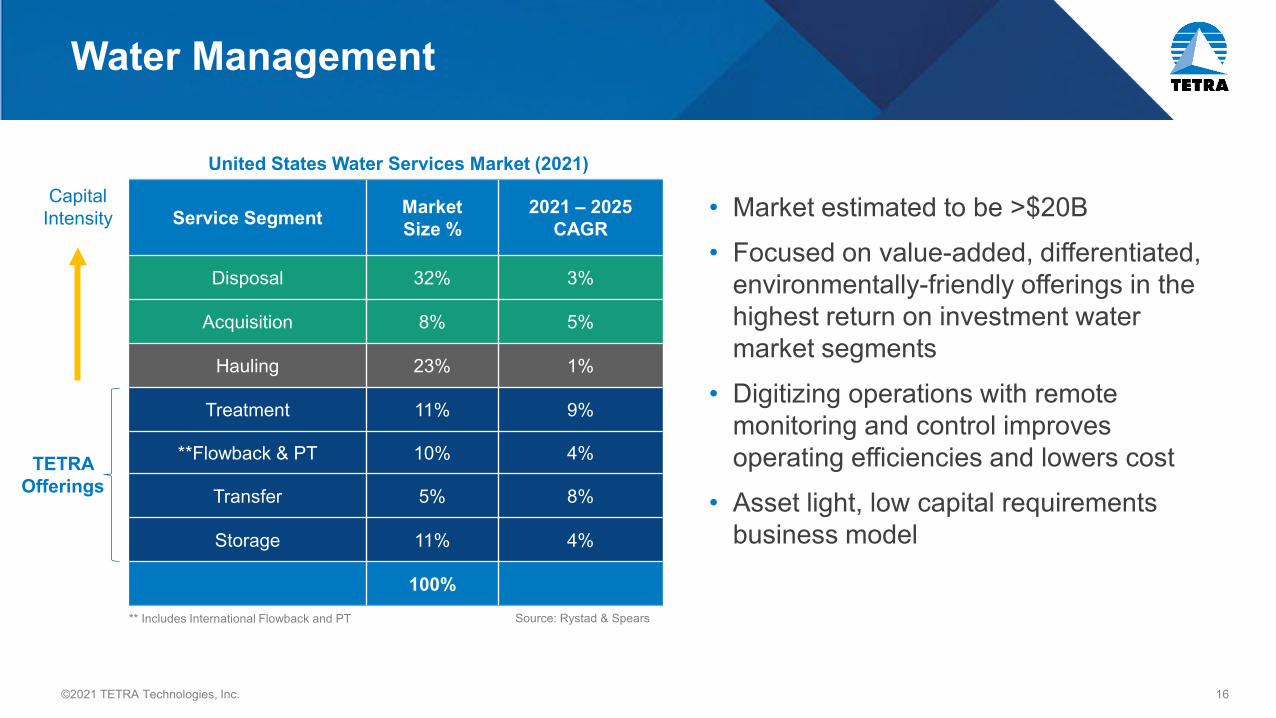
Water Management
Service Segment Market Size %
2021 – 2025 CAGR
Disposal 32% 3%
Acquisition 8% 5%
Hauling 23% 1%
Treatment 11% 9%
**Flowback & PT 10% 4%
Transfer 5% 8%
Storage 11% 4%
100%
TETRA Offerings
** Includes International Flowback and PT
Capital Intensity • Market estimated to be >$20B
• Focused on value-added, differentiated, environmentally-friendly offerings in the highest return on investment water market segments
• Digitizing operations with remote monitoring and control improves operating efficiencies and lowers cost
• Asset light, low capital requirements business model
United States Water Services Market (2021)
Source: Rystad & Spears

17©2021 TETRA Technologies, Inc.
Digitized Integrated Water Management Solution
Sourcing
Flowback
Temporary Transfer
BlendingDistribution
Storage
Treatment
Pit Lining
Automation (Real-Time Monitoring & Control)
Poly Pipe & Pipeline
Oil Recovery
Recycling
18©2021 TETRA Technologies, Inc.
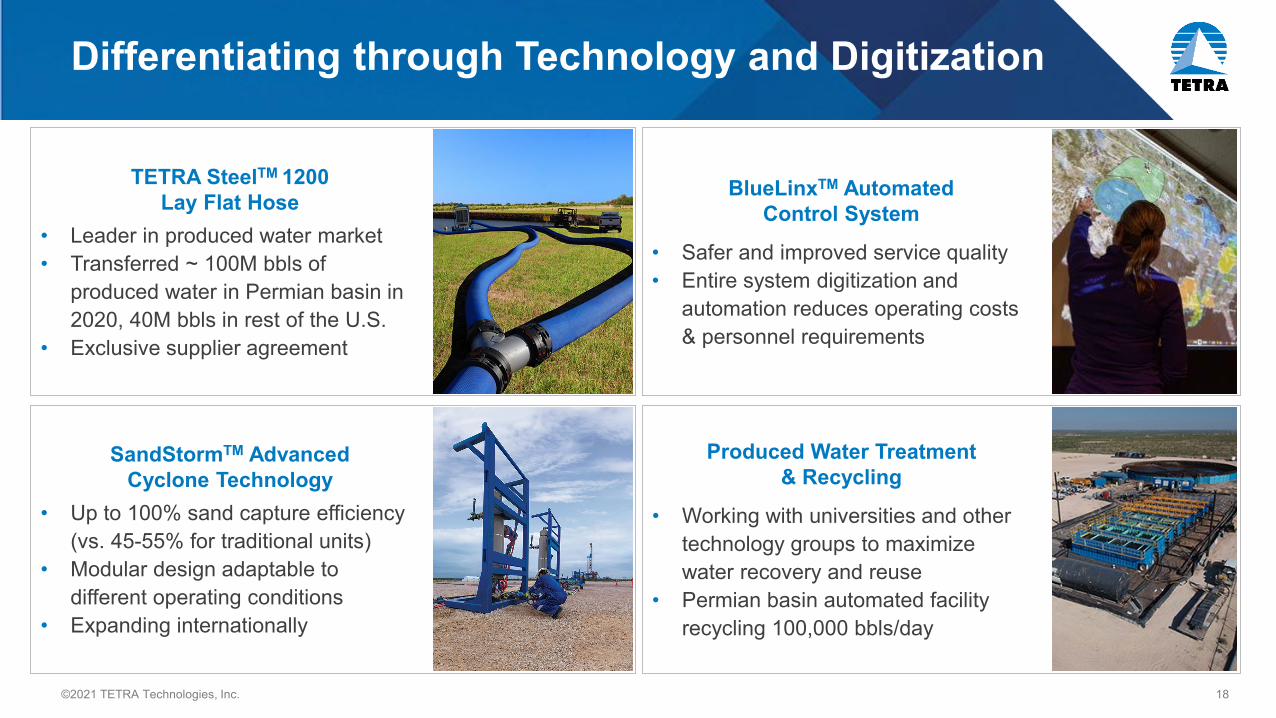
TETRA SteelTM 1200 Lay Flat Hose
• Leader in produced water market• Transferred ~ 100M bbls of
produced water in Permian basin in 2020, 40M bbls in rest of the U.S.
• Exclusive supplier agreement
SandStormTM Advanced Cyclone Technology
• Up to 100% sand capture efficiency (vs. 45-55% for traditional units)
• Modular design adaptable to different operating conditions
• Expanding internationally
Produced Water Treatment & Recycling
• Working with universities and other technology groups to maximize water recovery and reuse
• Permian basin automated facility recycling 100,000 bbls/day
BlueLinxTM Automated Control System
• Safer and improved service quality• Entire system digitization and
automation reduces operating costs & personnel requirements
Differentiating through Technology and Digitization

19©2021 TETRA Technologies, Inc.
Water & Flowback Services
Adjusted EBITDA and adjusted EBITDA margins are non-GAAP financial measures. See “Non-GAAP Reconciliation” in appendix for more information and reconciliation to net loss
Revenue and Adjusted EBITDA Margins
$ m
illio
ns
Market share gains due to our technologies, digitizing operations and integrated solutions
• Secured second project in Argentina for a fully automated sand recovery using SandStormTM
technology• Record high 47 integrated Water Management
projects in Q1 with 22 different customers• Adjusted EBITDA positive for all quarters of 2020
and 2021-Q1 despite negative impact of winter storm
$79 $73 $73
$57 $57
$25 $22 $31 $31 13% 15% 15%
10% 12%
1% 0% 12% 3%
0%
10%
20%
30%
40%
$-
$20
$40
$60
$80
Rev Adjusted EBITDA Margins

20©2021 TETRA Technologies, Inc.
Financial Overviewand Summary
21©2021 TETRA Technologies, Inc.
Normalized Cash Corporate G&A Expenses
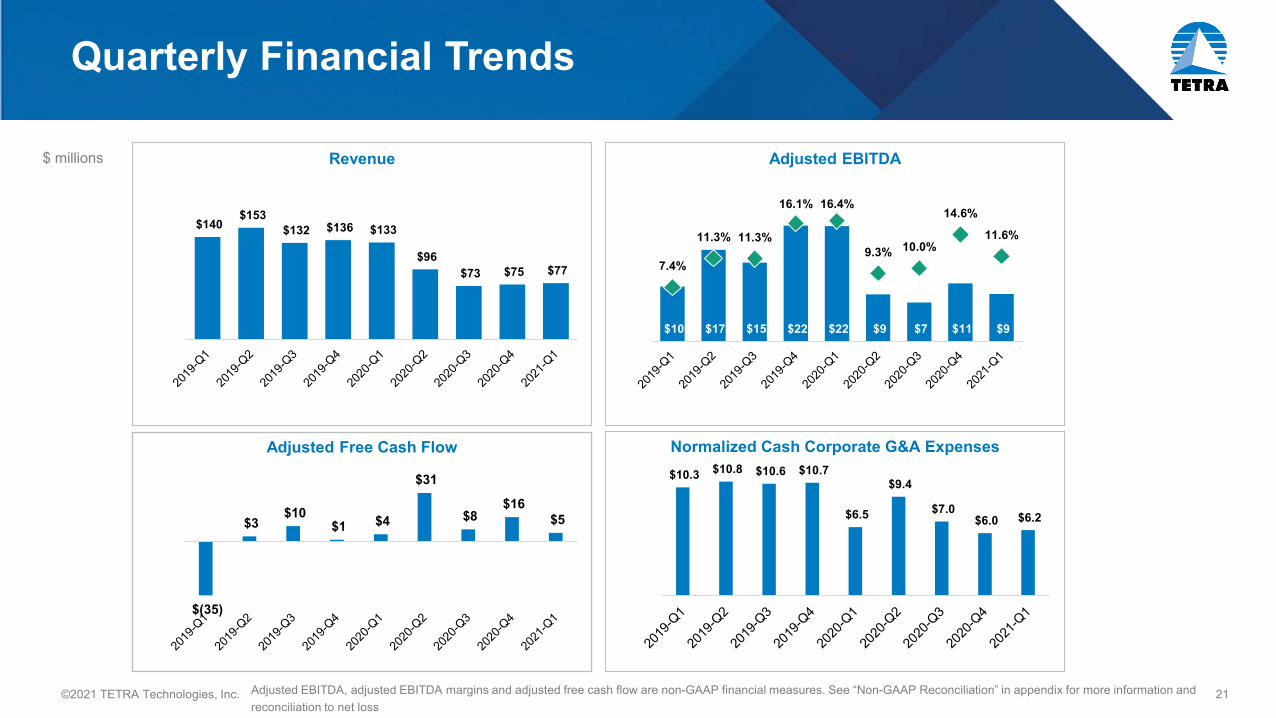
Quarterly Financial Trends
Adjusted Free Cash Flow
Adjusted EBITDA, adjusted EBITDA margins and adjusted free cash flow are non-GAAP financial measures. See “Non-GAAP Reconciliation” in appendix for more information and reconciliation to net loss
$ millions Adjusted EBITDARevenue
$140 $153
$132 $136 $133
$96 $73 $75 $77
$- $20 $40 $60 $80
$100 $120 $140 $160 $180
$10 $17 $15 $22 $22 $9 $7 $11 $9
7.4%
11.3% 11.3%
16.1% 16.4%
9.3% 10.0%
14.6%
11.6%
0%2%4%6%8%10%12%14%16%18%
$-
$5
$10
$15
$20
$25
$10.3 $10.8 $10.6 $10.7
$6.5
$9.4
$7.0 $6.0 $6.2
$-
$2.0
$4.0
$6.0
$8.0
$10.0
$12.0
$(35)
$3 $10
$1 $4
$31
$8 $16
$5
$(40) $(30) $(20) $(10)
$- $10 $20 $30 $40
22©2021 TETRA Technologies, Inc.
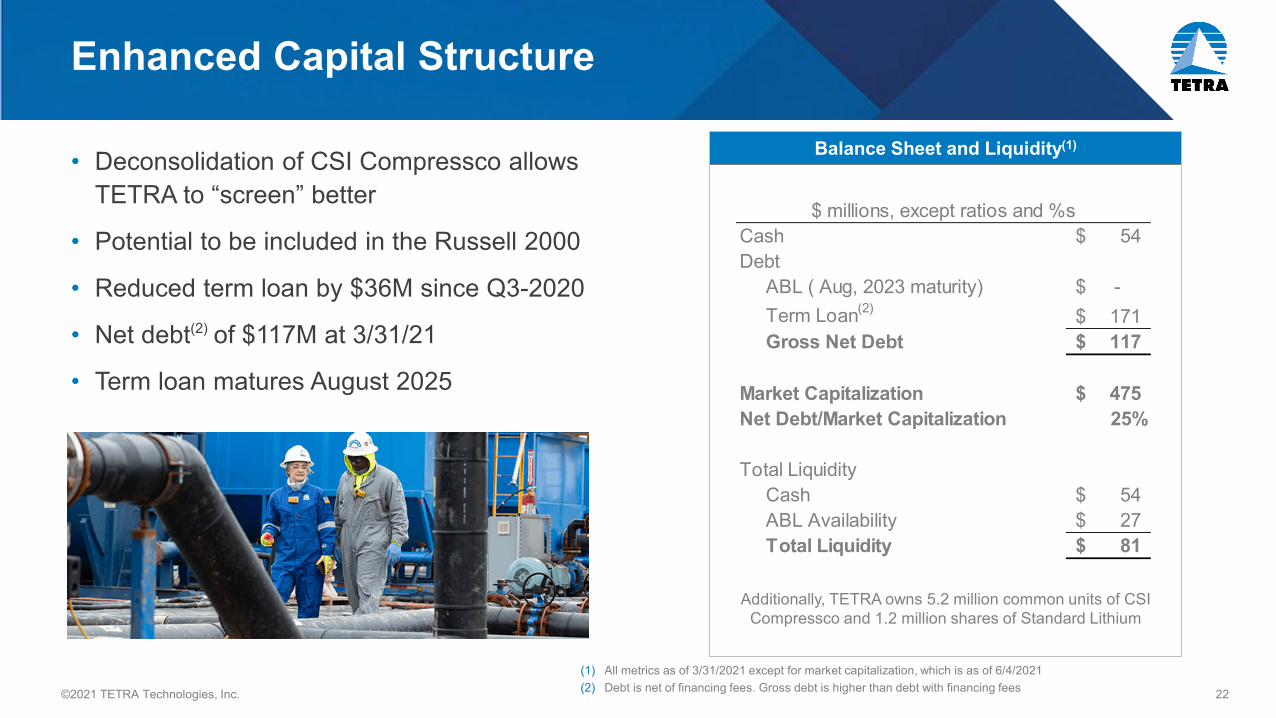
Enhanced Capital Structure
• Deconsolidation of CSI Compressco allows TETRA to “screen” better
• Potential to be included in the Russell 2000
• Reduced term loan by $36M since Q3-2020
• Net debt(2) of $117M at 3/31/21
• Term loan matures August 2025
Balance Sheet and Liquidity(1)
(1) All metrics as of 3/31/2021 except for market capitalization, which is as of 6/4/2021(2) Debt is net of financing fees. Gross debt is higher than debt with financing fees
Additionally, TETRA owns 5.2 million common units of CSI Compressco and 1.2 million shares of Standard Lithium
$ millions, except ratios and %sCash 54$ Debt
ABL ( Aug, 2023 maturity) -$ Term Loan(2) 171$ Gross Net Debt 117$
Market Capitalization 475$ Net Debt/Market Capitalization 25%
Total LiquidityCash 54$ ABL Availability 27$ Total Liquidity 81$

23©2021 TETRA Technologies, Inc.
Market Performance & Capital Allocation
Capital Allocation Priorities
• Focused on two core segments targeting organic investments with cash paybacks <18 months
• Reduce outstanding debt, targeting leverage ratio below 2.0X
• Opportunistically invest in low carbon energy initiatives, including creating JV agreements, and/or funding technology investments
• Constantly evaluate debt markets to extend 2025 maturity and reduce cost of capital
Adjusted EBITDA calculated & communicated by peers and competitors, which include not in sequence NewPark Resources, Inc., Select Energy Services, Inc., CES Energy Solutions Corp, Forum Energy Technologies, Inc., Dril-Quip, Inc, Oil States International, Inc., Solaris Oilfield Infrastructure, Inc.
2021 Share Performance vs OSX
TTI
OSX
$ m
illion
s
100%
As of 6/4/2021
$66
$36 $33
$14 $10
$(2) $(1)
$(22)Peer1 TETRA Peer 2 Peer 3 Peer 4 Peer 5 Peer 6 Peer 7
Adjusted EBITDA(1) Pandemic Performance (TTM 3/31/2021)
435%
157%
31-Dec-20 31-Jan-21 28-Feb-21 31-Mar-21 30-Apr-21 31-May-21

24©2021 TETRA Technologies, Inc.
Investment Highlights
• Build on core competencies of fluids and aqueous chemistry» Industry leading position on high value completion fluids» Vertically integrated chemicals business participating in multiple industry segments» Market leading position for treating and recycling produced water » Leverage digitization and differentiation for Water Management and Flowback
Services
• Priority on differentiated, low capital-intensive offerings focused on generating free cash flow and returns above cost of capital
• Exploit key mineral resources and vertical integration to create growth opportunities outside the O&G market
• Explore consolidation opportunities to gain critical mass
• Potential to be included in the Russell 2000 Index in June, 2021

25©2021 TETRA Technologies, Inc.
Appendix
26©2021 TETRA Technologies, Inc.
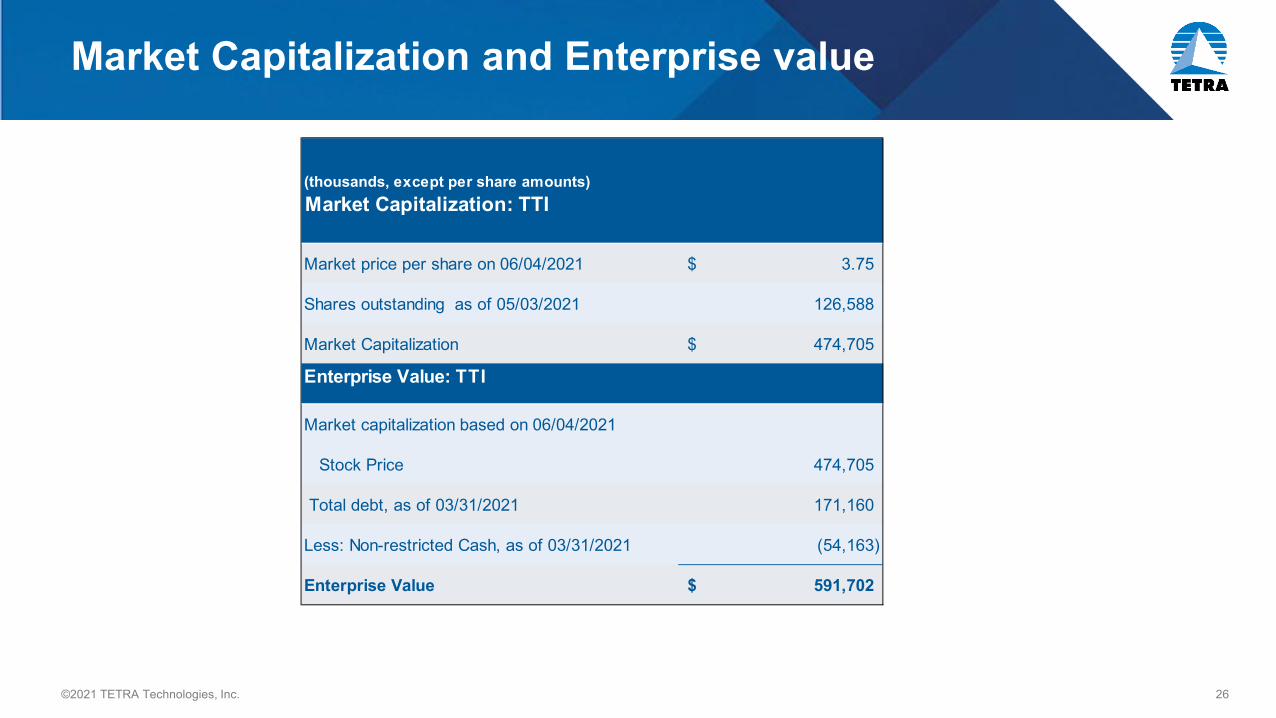
Market Capitalization and Enterprise value
(thousands, except per share amounts)Market Capitalization: TTI
Market price per share on 06/04/2021 3.75$
Shares outstanding as of 05/03/2021 126,588
Market Capitalization 474,705$
Enterprise Value: TTI
Market capitalization based on 06/04/2021
Stock Price 474,705
Total debt, as of 03/31/2021 171,160
Less: Non-restricted Cash, as of 03/31/2021 (54,163)
Enterprise Value 591,702$
27©2021 TETRA Technologies, Inc.
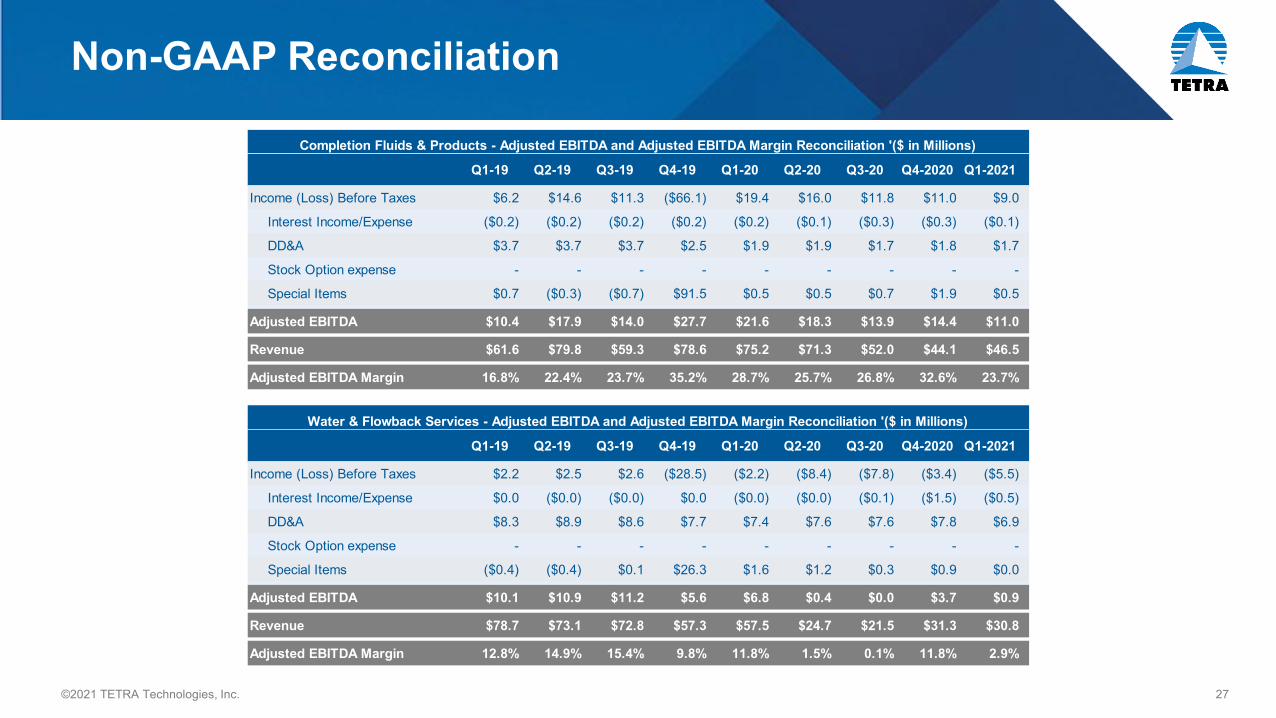
Non-GAAP Reconciliation
Completion Fluids & Products - Adjusted EBITDA and Adjusted EBITDA Margin Reconciliation '($ in Millions)
Q1-19 Q2-19 Q3-19 Q4-19 Q1-20 Q2-20 Q3-20 Q4-2020 Q1-2021
Income (Loss) Before Taxes $6.2 $14.6 $11.3 ($66.1) $19.4 $16.0 $11.8 $11.0 $9.0
Interest Income/Expense ($0.2) ($0.2) ($0.2) ($0.2) ($0.2) ($0.1) ($0.3) ($0.3) ($0.1)
DD&A $3.7 $3.7 $3.7 $2.5 $1.9 $1.9 $1.7 $1.8 $1.7
Stock Option expense - - - - - - - - -
Special Items $0.7 ($0.3) ($0.7) $91.5 $0.5 $0.5 $0.7 $1.9 $0.5
Adjusted EBITDA $10.4 $17.9 $14.0 $27.7 $21.6 $18.3 $13.9 $14.4 $11.0
Revenue $61.6 $79.8 $59.3 $78.6 $75.2 $71.3 $52.0 $44.1 $46.5
Adjusted EBITDA Margin 16.8% 22.4% 23.7% 35.2% 28.7% 25.7% 26.8% 32.6% 23.7%
Water & Flowback Services - Adjusted EBITDA and Adjusted EBITDA Margin Reconciliation '($ in Millions)
Q1-19 Q2-19 Q3-19 Q4-19 Q1-20 Q2-20 Q3-20 Q4-2020 Q1-2021
Income (Loss) Before Taxes $2.2 $2.5 $2.6 ($28.5) ($2.2) ($8.4) ($7.8) ($3.4) ($5.5)
Interest Income/Expense $0.0 ($0.0) ($0.0) $0.0 ($0.0) ($0.0) ($0.1) ($1.5) ($0.5)
DD&A $8.3 $8.9 $8.6 $7.7 $7.4 $7.6 $7.6 $7.8 $6.9
Stock Option expense - - - - - - - - -
Special Items ($0.4) ($0.4) $0.1 $26.3 $1.6 $1.2 $0.3 $0.9 $0.0
Adjusted EBITDA $10.1 $10.9 $11.2 $5.6 $6.8 $0.4 $0.0 $3.7 $0.9
Revenue $78.7 $73.1 $72.8 $57.3 $57.5 $24.7 $21.5 $31.3 $30.8
Adjusted EBITDA Margin 12.8% 14.9% 15.4% 9.8% 11.8% 1.5% 0.1% 11.8% 2.9%

28©2021 TETRA Technologies, Inc.
Non-GAAP Reconciliation
TTI excl. Disc. Operations - Adj. EBITDA and Ad. EBITDA Margin Reconciliation '($ in Mil)
2019-Q1 2019-Q2 2019-Q3 2019-Q4 2020-Q1 2020-Q2 2020-Q3 2020-Q4 2021-Q1Q2-Q4 2020 &
2021-Q1Income (Loss) Before Taxes ($9.3) ($2.2) ($4.0) ($112.6) $3.7 ($12.2) ($9.5) ($7.2) ($11.8) ($40.6)
Interest Income/Expense $5.2 $5.5 $5.3 $5.3 $5.3 $4.6 $4.3 $4.0 $4.4 $17.4 DD&A $12.1 $12.8 $12.4 $10.3 $9.6 $9.7 $9.5 $9.7 $8.8 $37.7 Stock Option expense $1.8 $1.7 $1.5 $1.5 $1.1 $1.7 $1.0 $1.0 $1.0 $4.6 Special Items $0.6 ($0.4) ($0.3) $117.4 $2.1 $5.1 $2.0 $3.4 $6.6 $17.1
Adjusted EBITDA $10.4 $17.3 $14.9 $21.9 $21.8 $8.9 $7.4 $11.0 $9.0 $36.2 Revenue $140.3 $152.9 $132.2 $135.9 $132.7 $96.1 $73.5 $75.5 $77.3 $322.3 Income (Loss) Before Taxes Margin -6.6% -1.5% -3.1% -82.9% 2.8% -12.7% -12.9% -9.6% -15.2% -12.6%Adjusted EBITDA Margin 7.4% 11.3% 11.3% 16.1% 16.4% 9.3% 10.0% 14.6% 11.6% 11.2%
29©2021 TETRA Technologies, Inc.
Non-GAAP Reconciliation
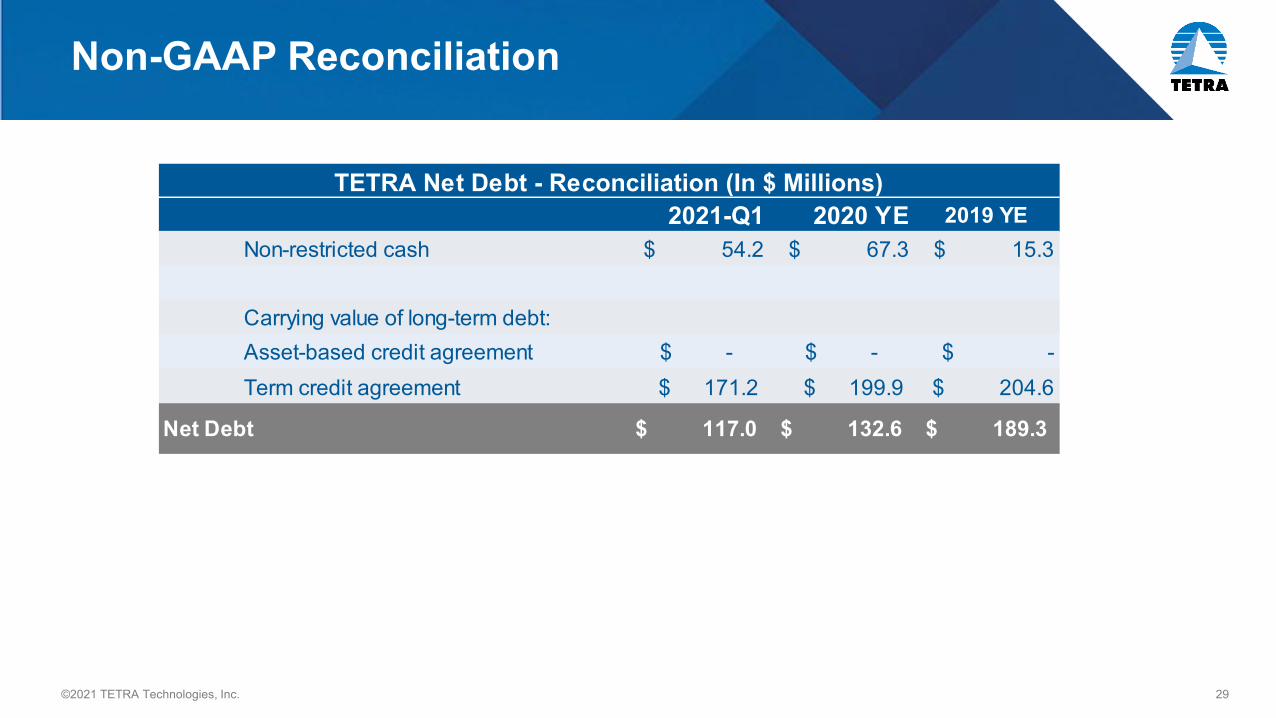
TETRA Net Debt - Reconciliation (In $ Millions)2021-Q1 2020 YE 2019 YE
Non-restricted cash $ 54.2 $ 67.3 $ 15.3
Carrying value of long-term debt:Asset-based credit agreement -$ -$ $ - Term credit agreement $ 171.2 $ 199.9 $ 204.6
Net Debt 117.0$ 132.6$ 189.3$
30©2021 TETRA Technologies, Inc.
Non-GAAP Reconciliation
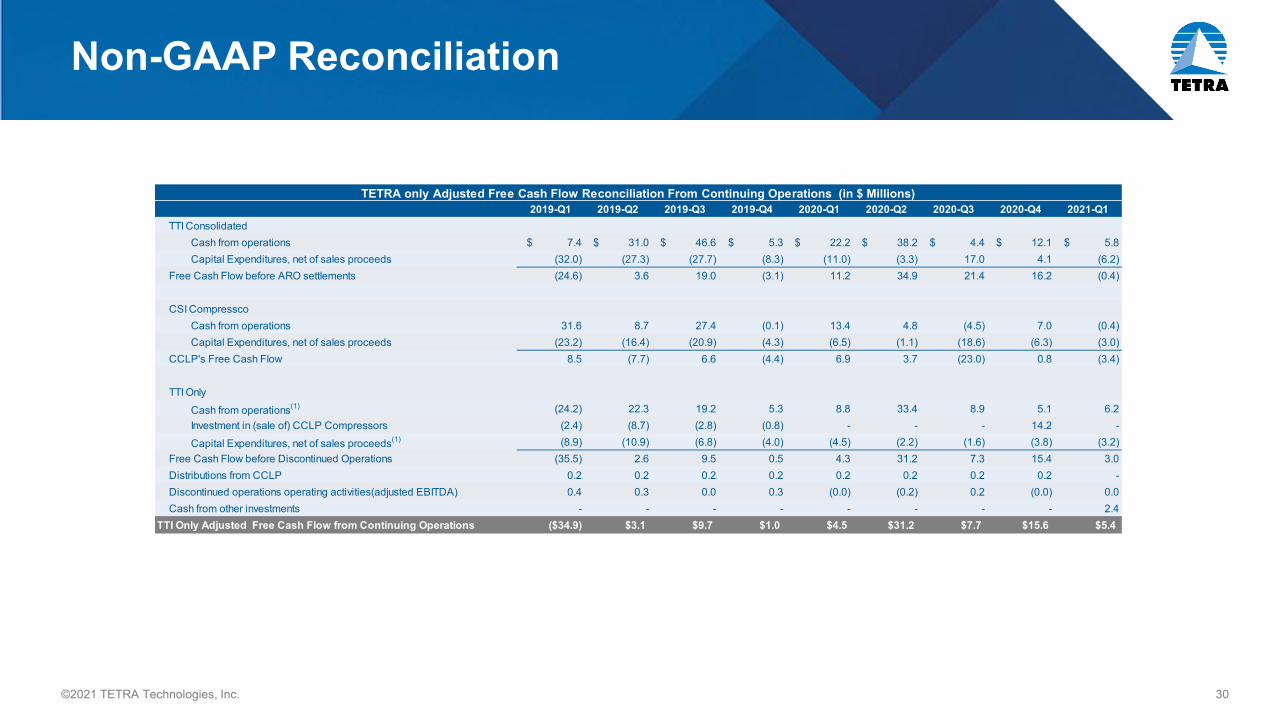
TETRA only Adjusted Free Cash Flow Reconciliation From Continuing Operations (in $ Millions)2019-Q1 2019-Q2 2019-Q3 2019-Q4 2020-Q1 2020-Q2 2020-Q3 2020-Q4 2021-Q1
TTI ConsolidatedCash from operations $ 7.4 $ 31.0 $ 46.6 $ 5.3 $ 22.2 $ 38.2 $ 4.4 $ 12.1 $ 5.8 Capital Expenditures, net of sales proceeds (32.0) (27.3) (27.7) (8.3) (11.0) (3.3) 17.0 4.1 (6.2)
Free Cash Flow before ARO settlements (24.6) 3.6 19.0 (3.1) 11.2 34.9 21.4 16.2 (0.4)
CSI CompresscoCash from operations 31.6 8.7 27.4 (0.1) 13.4 4.8 (4.5) 7.0 (0.4)Capital Expenditures, net of sales proceeds (23.2) (16.4) (20.9) (4.3) (6.5) (1.1) (18.6) (6.3) (3.0)
CCLP's Free Cash Flow 8.5 (7.7) 6.6 (4.4) 6.9 3.7 (23.0) 0.8 (3.4)
TTI OnlyCash from operations(1) (24.2) 22.3 19.2 5.3 8.8 33.4 8.9 5.1 6.2 Investment in (sale of) CCLP Compressors (2.4) (8.7) (2.8) (0.8) - - - 14.2 - Capital Expenditures, net of sales proceeds(1) (8.9) (10.9) (6.8) (4.0) (4.5) (2.2) (1.6) (3.8) (3.2)
Free Cash Flow before Discontinued Operations (35.5) 2.6 9.5 0.5 4.3 31.2 7.3 15.4 3.0 Distributions from CCLP 0.2 0.2 0.2 0.2 0.2 0.2 0.2 0.2 - Discontinued operations operating activities(adjusted EBITDA) 0.4 0.3 0.0 0.3 (0.0) (0.2) 0.2 (0.0) 0.0 Cash from other investments - - - - - - - - 2.4
TTI Only Adjusted Free Cash Flow from Continuing Operations ($34.9) $3.1 $9.7 $1.0 $4.5 $31.2 $7.7 $15.6 $5.4